 Ma Yujuan
 Yang Guangli
 Li Bo3
- 1Guangzhou Huashang College, Guangzhou, China
- 2Guangzhou Xinhua University, Guangzhou, China
- 3Zhongnan University of Economics and Law, Wuhan, China
The global COVID-19 epidemic in 2020 has caused a significant drop in many countries’ employment rates and economies. Numerous countries have implemented a number of tax and fee reduction policies in response to the COVID-19 epidemic. This essay analyzes the tax and fee policies and results of the three largest economies in the world—China, the United States, and Japan—in response to COVID-19 between 2020 and 2021. We will first compare the effects of tax and fee reduction policies horizontally across China, the US, and Japan. The second step is to compare the effects of tax and fee reduction policies. According to the study, China, the United States and Japan have each implemented separate tax and fee policies in response to COVID-19. The United States primarily provides corporate income tax, personal income tax relief, and increased social welfare and subsidies that reduce the tax burden of enterprises, stimulate the vitality of enterprises, increase the disposable income of residents, stimulate consumption, and thus promote economic growth; Japan primarily provides income tax, consumption tax and business tax relief to reduce the cost of consumption for residents, increase corporate profits and cash flow, restore economic growth and stabilize employment. China primarily provides tax relief for VAT, corporate income tax and social security funds. It indirectly lowers the selling price of products, reduces the operating costs of enterprises, increases personal disposable income, stimulates consumption, promotes the growth of business performance and plays a certain role in curbing inflation. Based on the empirical analysis of the impact of different tax and fee reduction policies on the economy and employment in China, the United States and Japan, it is of some relevance for other countries. Therefore, in response to COVID-19 or major emergencies, each country can formulate targeted tax and fee reduction measures based on its own national conditions to support economic growth and stable employment.
1 Introduction
Tax and fee reductions are a crucial reduction of proactive fiscal policy and a major cost-cutting mechanism in supply-side reform (Zhang, 2019). Keynes’ effective demand theory holds that government intervention is required when the market cannot clear surplus goods due to the current price and wage rigidity. The government allocates resources to the market’s main body through tax cuts, lowering enterprise costs, raising residents’ disposable income, promoting consumption, and raising total demand, thereby improving overall output (Yang and Sun, 2020). While the government intervention is flawed, the supply-side approach highlights the efficiency of the market process. Reduced taxes result in a different tax of resources between the government and the market, which can improve market efficiency, reduce supply, and boost output (Wang and Yuan, 2020). Being a permanent tax reform, the supply-side tax and fee reduction policy is frequently seen as a crucial component of structural reform (Zhang, 2019).
In accordance with the economic cycle inverse regulation rule, tax reductions are necessary to support economic growth when the economy continues to contract into depression, as evidenced by company bankruptcy and rising unemployment, among other indicators (Hejing, 2022). Jiang Fei is a crucial budgetary measure to combat the slump in the policy. China’s GDP growth rate fell after the start of the financial crisis in 2008, primarily because the “demographic dividend” that had previously supported economic growth has gradually decreased, and the “supply-side structural” tax and fee reduction policy has taken its place as the primary theoretical justification for economic growth (Gao, 2019). China enacted a proactive fiscal policy in 2009 to lessen the effects of the financial crisis on its economy, focusing primarily on expanding investment, boosting consumption, and increasing government spending. China offered “structural tax cuts” at the same time to boost demand, and it was successful in doing so; as a result, the economy has rebounded. China began implementing a pro-active fiscal policy after 2015, focusing primarily on reducing tax and fee cuts, which are also seen as a crucial step in cutting costs for the supply-side reform. Since 2018, China has improved tax and fee reductions. The tax rate structure has been made simpler because of ongoing reductions in VAT rates, which have also raised the standard deduction for personal income tax expenses and expanded special supplementary deductions. Structured and inclusive tax cuts currently coexist (Zhang, 2019). Therefore, China responded with tax reductions and favorable policies (Ming and Xiaowen, 2020), including annual tax and fee cuts of more than 2.6 trillion. tax and fee reduction policies played a significant role in realizing the “six stability, six protect” encouraging businesses to resume work and production, maintaining the employment rate, and resuming economic growth. China has implemented several tax and fee reduction initiatives throughout the 13th Five-Year Plan period that have contributed significantly and favorably to reviving market vitality and sustaining economic growth (Wan, 2020). The 14th Five-Year Plan will begin in 2021. China will keep advancing and improving its tax and fee reduction policies while expanding tax exemptions and other preferential benefits for small and medium-sized businesses (Li and Yang, 2021). For instance, increasing the deduction for manufacturing R&D costs, increasing the VAT threshold for small-scale taxpayers, and providing more tax benefits to small and micro firms. In addition to implementing institutional tax reduction policies, China will continue to optimize the tax reduction and fee reduction measures. New structural tax reduction and fee reduction measures will be implemented, which will not only improve the vitality of market entities but also allow for the adjustment of tax reduction and exemption policies to take into account the current situation and play a significant role in stabilizing economic growth.
COVID-19 has led to economic and employment declines in many countries to varying degrees (Zhou et al., 2022). In order to restore the economy and employment rates, many countries have adopted favorable fiscal policies, namely tax and fee reduction policies, which have diverse policy effects. Economic policy choices have an important bearing on cushioning the implications of containment measures and the speed at which the economy can adjust towards more normal conditions after the virus outbreak (Boone et al., 2020). Laurence Boone points out, Supporting vulnerable households and firms is essential; Reducing fixed charges and taxes and credit forbearance would help to ease the pressure on firms facing an abrupt falloff in demand (Boone et al., 2020). The United States, China and Japan are the three largest economies in the world. By studying their tax and fee reduction policies and their implementation effects, we can learn from each other and complement each other’s strengths. On the other hand, it also has a certain reference point for other countries dealing with COVID-19 policy-making. In addition, most existing studies on fiscal policy in response to COVID-19 focus on countries and lack comparative research. Research on the effects of tax and fee reduction policies is not relatively granular, and comparative studies on the policy effects of different taxes are lacking. Based on this, this paper will take the world’s three largest economies--China, the United States and Japan, as the research object, specifically study the tax and fee reduction policies and effects of different taxes, provide reference for China and other countries’ paths which for further reduce tax and fee, and supplement the research literature in related fields.
2 Comparison of tax and fee reduction policies in China, the US, and Japan in response to the epidemic
The COVID-19 outbreak in 2020 has partially slowed economic expansion and, to varying degrees, reduced employment. The US GDP will decline by 3.49%, the Japanese GDP by 5.2%, and the United Kingdom GDP by 9.86% in 2020, according to data from the International Monetary Fund published in April 20211. One of the few countries with positive GDP growth is China. In the meantime, the epidemic also contributes to a number of societal issues like inflation and unemployment in most countries. In response to COVID-19, many countries have implemented a number of tax and fee reduction policies to boost economic growth and increase employment.
2.1 China
Data from the World Bank2 suggests that China’s economic growth trended downward after 2007 and remained relatively stable between 6 and 7 percent from 2015 to 2019. In 2020, the COVID-19 pandemic led to a sharp drop in China’s economic growth, with the year-one-year growth rate of GDP was only 2.24%. The decline in GDP in the first quarter of 2020 was even steeper, contracting 5.27% year-on-year and 9.5% quarter-on-quarter. In addition, most businesses experienced job losses in the first quarter of 2020 due to the epidemic. According to the National Bureau of Statistics3, China’s urban unemployment rate in 2020 was 4.2%, up from 3.6% in 2019. This represents an increase of 16.67%. First-tier cities such as Beijing, Shanghai, Guangzhou and Shenzhen have particularly high unemployment rates, with Beijing hitting a high of 29% in 2020. The Ministry of Finance and the State Administration of Taxation jointly announced a number of tax cuts policies to lessen the effects of COVID-19 on the economy and employment, including the support will be coronavirus pneumonia epidemic prevention and control of tax policy announcement about supporting individual businesses to return to work. VAT policy announcement about the expansion of small-scale taxpayer exemptions VAT policy execution announcement (Ministry of Finance Taxation announcement 2020 no. 8–13, no. 24), etc. The economy recovered in the second and third quarters of 2020 with GDP growth of 3.1 percent and 5.55 percent year-on-year, respectively, following China’s proactive fiscal and monetary policies. In the meantime, the 2021 unemployment rate also fell. The recorded urban unemployment rate was 4.0% (as shown in Figure 1).
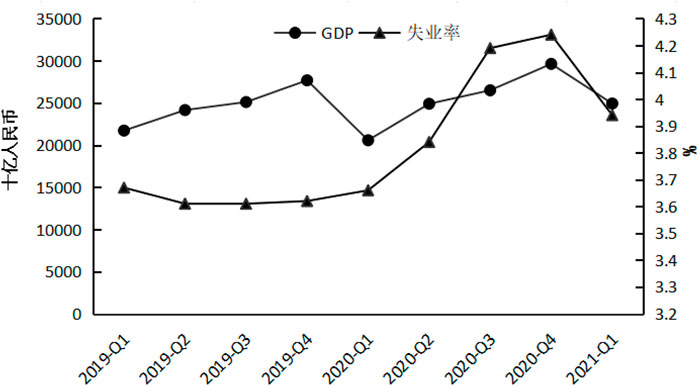
FIGURE 1. China’s GDP and unemployment rate.
To combat the effects on our country’s economic growth, increase the employment rate, and fulfill the response of “six stability, six protect”, China has intensified tax and fee reductions, the state administration of taxation, published guidelines for preferential tax policies to promote economic and social development and prevent and control epidemics (General Office of the State Administration of Taxation of China, 2020). These policies were divided into seven batches totaling 28 tax preferences, most of which included tax breaks for individuals and small businesses and social security and charitable donations. Small and medium-sized firms, as well as individual industrial and commercial businesses, have resumed employment and production, and domestic demand has increased as a result of these tax and fee reduction policies (General Office of the State Administration of Taxation of China, 2020). Following are specific steps to lower taxes and fees:
Tax incentives for supplies used in epidemic prevention and control. More favorable tax policies for the procurement of materials for epidemic prevention and control during the epidemic period in China, Manufacturers providing items for epidemic control and prevention are mostly included. Manufacturers of materials for the prevention and control of epidemics will be able to purchase machinery and equipment after receiving a complete refund of the VAT increase (China Report, 2020; Wan, 2020). The equipment investment to increase production capacity will no longer be deducted over time; a one-time pre-tax deduction is permitted (Cui et al., 2020). Public transportation, life services provided by taxpayers, and express delivery services of daily necessities provided by residents are all excluded from the VAT. Additionally, materials for preventing and controlling epidemics are transported to taxpayers, and transportation revenue is obtained. VAT exemption for income; import duties on supplies used by competent government agencies to prevent and control epidemics, exemption from (Cheng, 2020). The aforementioned favorable tax policies have helped to increase the supply of epidemic prevention and control products while lowering the tax burden on taxpayers and manufacturers of epidemic prevention and control materials.
Tax relief for donations to public welfare. China promotes public welfare donations following the outbreak and offers tax benefits. The primary actions include unit or individual donations of money and goods to epidemic areas through public welfare agencies or people’s government departments at or above the county level. Full pre-tax deduction of corporate income tax or personal income tax is permitted; units or individuals will directly donate prevention and control materials to epidemic prevention and control hospitals; full pre-tax deduction of corporate income tax or personal income tax is permitted; and epidemic prevention and control materials donated by units. (Wen, L., Yu, Y., and Chen, S., 2020). Being exempt from the VAT, consumption tax, urban maintenance, construction tax, education surcharge, local education surcharge, and other relevant taxes, duty-free donations will broaden the scope of the import duty exemption (Liang, 2021).
Tax reduction for businesses that resume work and production. China will aid businesses in starting up their operations and production. Losses for businesses in challenging industries that the epidemic will significantly impact in 2020 are among the main tax relief measures. The carry-over years can be extended to 8 years, for example, in the film industry (Cheng, 2020); In the impacted areas, small-scale taxpayers, the VAT exemption or the VAT rate is decreased from 3% to 1%; r educe or delay the payment of social security premiums that small and medium-sized businesses and specific industrial and commercial households are responsible for covering for employees; the minimum base for individual social security contributions in 2020 can make reference to and maintain the 2019 payment base’s lower limit; flexible employment staff or individual industrial and commercial households that pay social insurance premiums on their own may choose to defer the payment until 2020; the lessor must offer leasing businesses or specific industrial and commercial households a rent reduction or exemption; regulations may allow for a reduction or exemption in the payment of property tax and urban land use tax; Individual industrial and commercial households, small and micro businesses, and their income tax payments may be deferred; urban land use tax is cut in half for space used for storage by logistics companies; cinemas will not be required to collect value-added tax on their screening services; cultural projects will not be required to pay construction fees.
Boost aggregate demand with tax relief. China offers corresponding preferential tax policies to increase overall demand, most notably: the Ministry of Finance and the State Administration of Taxation announced some products (No. 15, 2020) to increase the export tax rebate rate for 1,464 products. Both the vehicle purchase tax for new energy vehicles and the VAT for used car dealers are being decreased by 0.5% in an effort to boost domestic demand.
Personal tax relief. China offers individual tax reduction and exemption policies to support protection and treatment. These policies primarily include personal income tax exemption for bonuses and work subsidies, personal income tax exemption for drugs, and personal income tax exemption for protective equipment issued by individuals’ units.
2.2 The United States
Since 2010, the United States’ actual GDP has grown at a positive annual rate of about 2%. The COVID-19 pandemic negatively impacted the growth in 2020, causing it to grow by 3.40% less than it did in 2019. This is in contrast to the 2009 financial crisis, which negatively impacted the economy by 2.6%. The second quarter of 2020 saw the most significant decline in GDP, down 8.76% from the second quarter of 2019. In addition, following the financial crisis in 2009, the unemployment rate in the United States decreased year over year. With the COVID-19 outbreak, the unemployment rate increased to 8.09% in 2020, 2.2 times higher than in 2019. The industrial production index also showed a negative growth of 7.03% during this time. In 2019, the unemployment rate was 3.67%. In response to recent fiscal and monetary policy changes, employment has increased along with economic growth. GDP increased by 8.6% in the third quarter of 2020, while employment increased by 3.3%. However, employment rate growth has been relatively slow compared to GDP growth. In the first quarter of 2021, employment stood at 59.7%, down from 60.5% in 2019. This is still a negative growth rate (Figure 24).
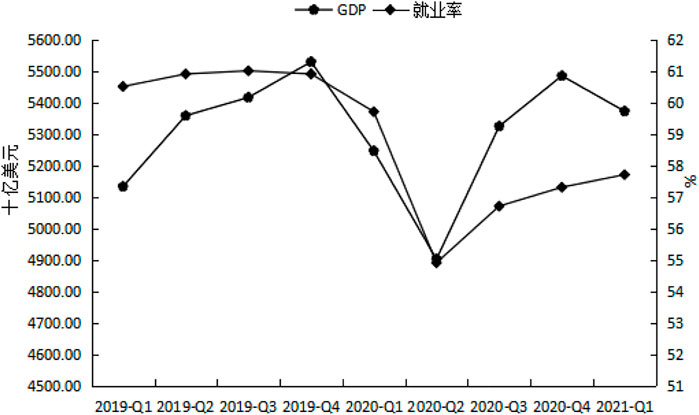
FIGURE 2. U.S. GDP and employment rate.
In response to the epidemic, the US CARES law in 2020 included fiscal stimulus measures totaling over $2 trillion, or roughly 11% of US GDP. Of this amount, more than $500 billion was paid to individual citizens directly, including direct tax rebates and individual unemployment insurance. The following are certain tax reduction policies5:
Deferred tax. Following the COVID-19 outbreak in the US in 2020, the federal government implemented personal income tax cuts, mostly by giving individuals a one-time tax return of $293 billion. On the other side, unemployment insurance was extended, and unemployment payments were increased by $268 billion. The US allows taxpayers to postpone their April 2020 income tax payment without incurring penalties or interest. It permits individuals and businesses to pay up to $1 million and $10 million in federal income tax, respectively, according to Document 17 from the Treasury and IRS. The IRS website offers many online services to assist taxpayers with tax delays and tax rebates to reduce contact during the outbreak.
Implement tax refunds to restore economic growth during the epidemic quickly. The United States enacted the tax rebate policy, a form of subsidy. The United States encourages firms to pay employees, enabling pre-tax deductions and returning taxes, social insurance, and other taxes earned by employees in order to stabilize employment. The adjusted gross income (AGI) is reported on the taxpayer’s 2019 tax return, which the Federal Tax Bureau uses to calculate the amount of the tax refund that is payable. Suppose the taxpayer does not submit a 2019 tax return. In that case, the Federal Tax Bureau will use the 2018 tax return to calculate the tax refund, allowing the taxpayer to obtain a refund check without filling out an application. A resident taxpayer with an adjusted gross tax (AGI) of less than $75,000 and a couple filing jointly with tax less than $15,000 are eligible to apply for a $1,200 tax refund; a couple filing jointly with income is suitable for a $2,400 refund (Zhao and Chen, 2020). Additionally, each child may apply for a $500 tax refund simultaneously. Except for non-residents, the policy applies to taxpayers without income, families, those with AGI over $75,000, couples filing jointly over $150,000, or 5% for every $100 over AGI. Couples who record an AGI of more than $198,000 and taxpayers with an AGI of more than $99,000 will receive no tax refund; their tax refund will be zero (Zhao and Chen, 2020).
Launch of new tax credit programs. During the outbreak, the US implemented new tax credits, which mostly consisted of tax on staff retention. Employers’ operating income decreased as a result of the pandemic by at least 50% from the prior year, even with tax rebates like the social security taxes they paid for their workers from March to December 2020. However, the tax credit cannot be given if the employer’s operating income does not significantly decrease and exceeds 80% of the prior year’s operating income (Zhao and Chen, 2020). Paid-Time-Off Credit. From April through December 2020, eligible firms must provide paid leave to their staff. They also must pay salaries that can be used as a corporate income tax credit or, if insufficient, a refund.
Subsidies will be increased. A US rescue plan Biden signed in March 2021 was expected to cost $1,844 billion, or around 8.8% of 2020 GDP. The program extends unemployment benefits to include supplemental unemployment benefits, including transfers to states to pay for extended unemployment insurance for extended SBA loans, $1,400 in direct stimulus payments to eligible individuals, 2 weeks of paid sick leave, up to 3 months of emergency leave (2/3 of salary), and up to 3 months of paid sick leave. Additionally, the pre-tax deduction for interest paid by taxpayers has been increased in the United States from the original 30%–50% cap for 2020. This raises the standard for pre-tax deductions for donations and interest connected to the epidemic.
2.3 Japan
Japan’s real GDP growth rate in 2020 was −4.53%, down 17.88 times from 2019, the unemployment rate was 2.77%, up 0.42% from 2019, and the industrial production index was down 10.32% year over year as a result of the COVID-19 pandemic. Among these, GDP started to fall in the first quarter of 2020 by 4.77% from the previous quarter and continued to fall in the second quarter, 8.0% from the last month and 8.9% annually. The third and fourth quarters saw an improvement in the economy after Japan implemented fiscal and monetary policy. From the first quarter of 2019 through the first quarter of 2021, Japan’s employment rate stayed between 60 and 61%, showing some stability. Despite the epidemic’s impact on the employment rate, it has maintained above 60%. (as shown in Figure 36).
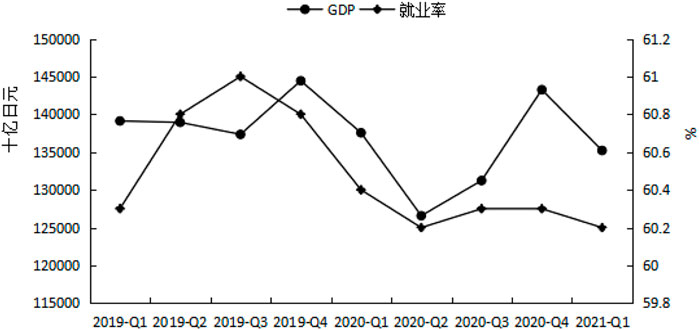
FIGURE 3. GDP and employment rate in Japan.
Japan has implemented a number of tax and fee reductions, including an increase in pre-tax deductions, deferred tax deductions, and household tax deductions, in reaction to the effects of COVID-19 on the economy and employment. Tax and fee reductions directly resulted in a tax reduction of 50–60 billion yen. Particular tax lowering measures7 include:
The amount of pre-tax deductions will rise. Japan has boosted pre-tax deductions, including preferred pre-tax deductions, in response to the epidemic’s economic effects. If businesses grow employee salaries and perks, particularly big and medium-sized businesses where the salaries of recent graduates or new hires increase by 2% or more compared to the prior year, the 15% increase in compensation can be written off as a tax deduction in 2021. This portion may also be written off before taxes for small and medium-sized businesses if the total employee salary increases by 1.5% or more than the prior year. Tax incentives for R&D. To encourage businesses to engage in R&D, the deduction cap for R&D expenses can be raised from 45 to 50%. Enterprises and research institutes conducting R&D jointly can deduct their R&D costs before corporate income tax. Businesses with sales declines of at least 2% are eligible for this rebate, valid from 2021 to 2023—tax benefit for small- and medium-sized businesses reorganizing. Japan permits businesses to set aside no more than 10% of the purchase costs as a reserve, pre-tax deduction, or complete instant amortization in order to mitigate losses and risks following restructuring or mergers and lessen their tax burden. Loss carry-over is permitted. Japan started implementing the loss carry-over policy under special circumstances in 2021, raising the loss carry-forward offset amount from 50% to 100%, and the carry-over term is 5 years, to encourage firms that experience losses due to COVID-19 to invest.
Extension of tax relief. Japan has implemented a number of deferred tax relief schemes during the epidemic, most notably: fixed asset tax relief. Tax reductions for land prices are expected in Japan starting in 2021. Under the tax and fee reduction proposal, the tax would remain unchanged in 2021 if land prices increased compared to the same period in 2020. However, if the land price falls, the tax will be directly reduced and the period will be extended by 3 years. Vehicle tax break or reduction for energy-efficient vehicles. From April 2021, Japan will prolong the tax break for 2 years. Customers purchasing energy-efficient vehicles may be subject to taxes based on fuel use, dropping from 3% to 1% before December 2021. Lowering the tax on aviation fuel in 2021. The revenue of the aviation industry fell sharply during the outbreak. Japan’s tax on aviation fuel dropped from 18,000 yen to 9,000 yen, or 50% of the original tax. Mortgage Loan Tax Relief has been extended for 3 years, extending the tax relief period from 10 to 13 years for individuals moving in before 2022; The scope of application of this preferential tax policy has been expanded from It applies to construction areas of at least 50 square meters expanded to at least 40 square meters. However, the income of borrower is strictly capped for homes measuring 40–50 square meters. The income limit of borrowers has been greatly reduced from not more than 30 million yen to not more than 10 million yen. Mortgage Loan Tax Relief mainly for the year-end loan balance of 1% is allowed as a pre-tax deduction. Residents can continue to benefit from low-interest rates as long as the loan’s annual rate is less than 1% by deducting 1% of the loan’s principal as a tax before taxes, which will result in more tax savings than the interest paid.
Families receive a home tax break. Japan’s primary tax relief policy in response to the epidemic is household tax relief, specifically tax relief for parents. Parental tax reductions have been provided in Japan for families with kids. Before the outbreak, the subsidy income for the mother to send the baby to the nursery was taxable, but during the epidemic, Japan exempted the tax of subsidy income, and at the same time, the tax for “postnatal care” subsidy received by the mother was also exempted. Gifts from education or marriage funds are given tax-free. The grandparents’ educational fund donation to the child is exempt from gift tax and given a 2-year extension. Additionally, the 10-million-yen (about 560,000 yuan) cap on assistance from grandparents for marriage, childbirth, and parenting will be exempt gift tax, extended by 2 years. Reduction in medical fees. Japan mandates that the annual cost of each household does not exceed 12,000 yen (about 673 yuan) while also enabling pre-tax deductions in order to lessen the financial burden of medical bills on residents. However, necessary inspection and other certificates are attached when declaring the deductions.
The tax and fee reduction measures suggest that China’s COVID-19 tax and fee reduction strategies differ from those of the United States. China’s tax and fee reduction focus primarily on having more favorable tax policies for businesses. Maintain or raise employment rates after work and production have resumed. Personal income is also ensured; in response to COVID-19, the United States has increased personal tax advantages, encouraging domestic consumption and greater investment. In addition to providing tax cuts to businesses, it also includes tax breaks for families and individuals to further promote economic growth and employment rates. Japan’s employment rate will remain above 60% in 2020 due to these preferential tax measures, given no severe fall and some economic recovery.
3 Comparative analysis of the effect of tax reduction and fee reduction policies
In order to promote economic growth, stable employment, the return to work and production, etc., many countries adopted the corresponding tax and fee cuts measures. This paper selects China, the United States, and Japan. We conduct further research on the effects of various tax and fee cuts measures on China and Japan, as well as a comparative analysis.
3.1 Analysis of the effect of tax reduction and fee reduction policies
To combat the downward pressure on the economy, tax and fee reductions are a significant fiscal and tax policy option (Li and Liu, 2019). Tax and fee reductions will, in the short term, reduce business costs, boost business vitality, make it easier for people to get back to work and produce goods, increase residents’ disposable income and stimulate demand and consumption, which will help the growth grow. However, tax reductions will decrease government revenue, widen the fiscal deficit, or cause fiscal spending to be drastically cut. In the long run, under the conditions of a stable tax structure, where GDP serves as the tax base, GDP growth will result in tax growth, fee and tax reductions, and concurrent economic growth, which will broaden the tax base, boost tax revenue, and encourage economic growth even more. This article primarily examines the short-term effects of tax and fee reduction initiatives against COVID-19.
Due to the COVID-19 epidemic, most Chinese businesses ceased operations in the first quarter of 2020, negatively impacting GDP growth and overall tax income. China then announced a package of tax and fee reduction measures and assisted businesses so they could resume work and production in an orderly fashion. As indicated in Table 1, the overall tax revenue fell dramatically in the second quarter of 2020. Still, GDP started to increase, suggesting that tax and fee reductions helped the growth grow to some extent. As work and production resumed, the employment rate increased, and there was positive economic growth, the fall in China’s overall tax revenue slowed down. In the first quarter of 2021, the GDP growth rate was at its highest, and overall tax revenue rose. In the second quarter of 2020, the US reached COVID-19; the second quarter saw the most significant GDP and total tax revenue decline. The United States pursued an active monetary and fiscal policy and enacted many tax and fee reduction measures. Individual and family tax favorable policies are more prevalent among them. Boost citizens’ discretionary income to encourage consumption. In response, the GDP decrease often eases. Total tax collections started to increase, with the second quarter of 2021 seeing the biggest increases in GDP and total tax collections. For 17.12% and 112.04%, a new COVID-19 pandemic broke out in the third quarter of 2021, causing growth in overall tax revenue, and the GDP growth started to slow down. In the second quarter of 2020, Japan’s new crown outbreak caused a GDP and tax income decline of 8.87% and 54.53%, respectively. Japan experienced the biggest decline in tax revenue compared to China and the United States due to the new crown outbreak and tax and fee cuts factors. Employment is relatively stable, but GDP growth slowed in the second quarter of 2021. As a result, the outbreak started to occur again in the third quarter, and the GDP started to decline.
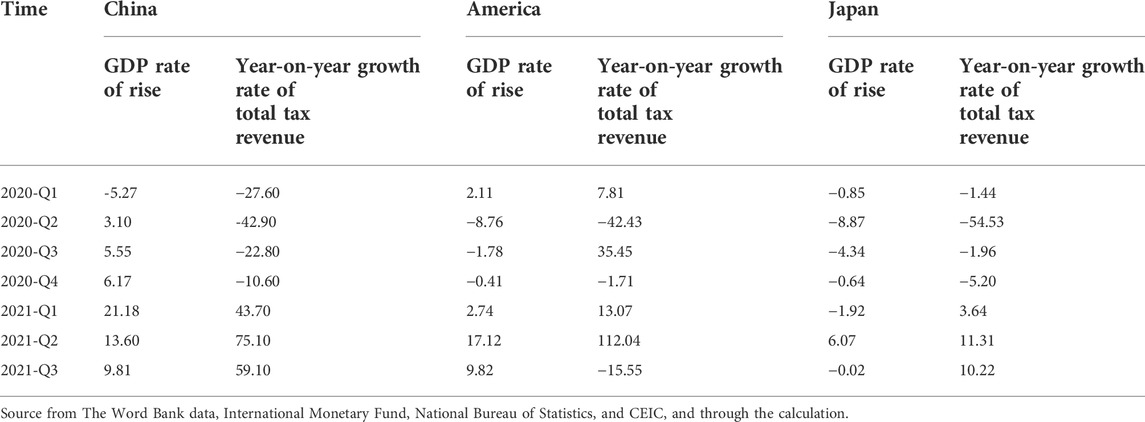
TABLE 1. The GDP growth rate and total tax revenue growth rate in different countries (%).
3.2 Comparative analysis of the effect of tax reduction and fee reduction policies for different taxes
Because tax categories vary between countries, it is necessary to combine horizontal and vertical comparisons in order to assess and analyze the effects of various tax and fee reduction strategies. The consequences of tax reduction programs for various taxes were examined, as shown in Tables 2–4.
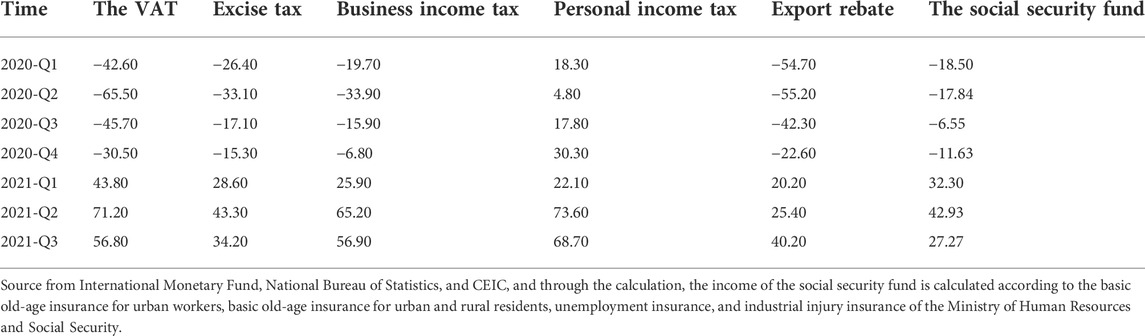
TABLE 2. Growth rate of different taxes in China (%).
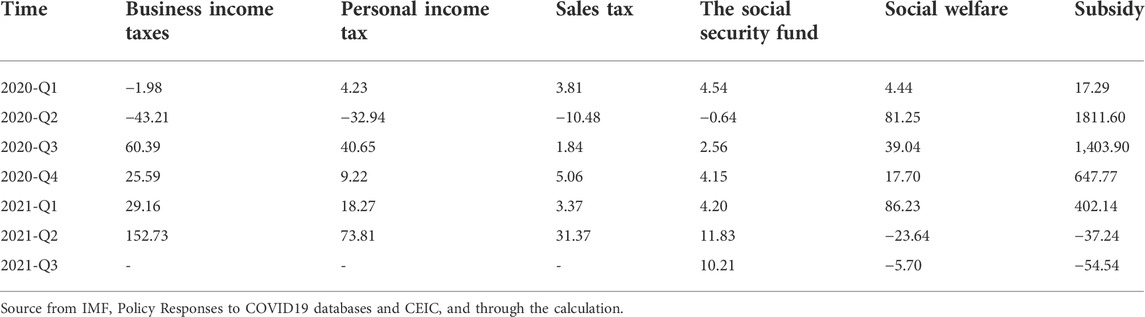
TABLE 3. growth rate of different taxes in the United States (%).
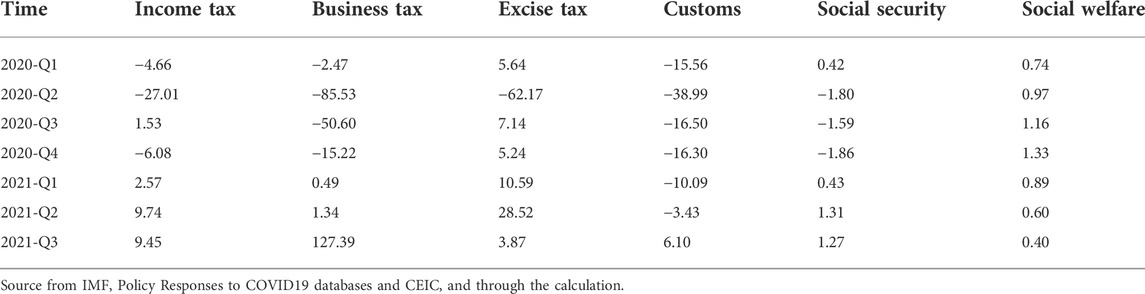
TABLE 4. The growth rate of different taxes in Japan: (%).
3.2.1 Income tax
China is a country that places a strong emphasis on both income tax and turnover tax. In order to aid businesses in getting back to work and producing during the outbreak and to raise the employment rate, introducing additional business income tax rules that are more favorable. From the first to the fourth quarters of 2020, corporate income tax was negative, although more so in the second quarter, and it continued to rise positively in 2021. The COVID-19 pandemic is affecting China. Personal income tax decreased in the second quarter of 2020, and the rising unemployment rate. However, continuing to see growth demonstrates that despite the epidemic, personal income tax has not decreased significantly. From the aforementioned China’s preferential tax policies in response to the pandemic, it can be inferred that there are not many preferential tax policies for individual income tax in China. In the second quarter of 2020, the corporate and personal income taxes in the United States decreased by 43.21% and 32.94%, respectively. However, income tax revenue increased from the third quarter of 2020, indicating that the United States responded to the new crown outbreak by giving tax breaks to businesses and individuals. Japan’s income tax and fee cuts preferential policies are relatively few. Even though the income tax maintained positive growth in 2021, the growth rate is significantly lower than in China and the United States. As a result of the new outbreak and tax and fee cuts, Japan’s income tax fell in the second quarter of 2020 by 27.01%, but the decline is lower than in China and the United States. China’s industrial production index experienced positive growth from the second quarter of 2020 to the first quarter of 2021, while the United States and Japan experienced a negative change from the first quarter to the first quarter of 2020–2021 before beginning to experience positive growth in the second quarter of 2020. As the outbreak was effectively controlled, businesses resumed production, and the industrial production index recovered. Therefore, a tax cut can encourage businesses to resume production and work. Additionally, China’s corporate income tax has a more significant impact on tax reduction.
3.2.2 VAT and business tax
China fully implemented VAT after replacing the business tax with a value-added tax, whereas Japan introduced a business tax. VAT and business tax are major levies in their respective countries and generate sizable tax income (Yang et al., 2022). Value-added and company taxes’ primary function guarantees timely and steady tax revenue growth. In an epidemic or serious emergency, the budget deficit can be adequately expanded, and the tax revenue can be significantly decreased or excused. It is evident from Tables 2, 4 that the VAT and business tax in China and Japan had the most significant decreases. According to data from the National Bureau of Statistics, the%age of total tax revenue for almost 5 years has remained between 30% and 40%, particularly in 2017–2019 accounted for nearly 40%. Because the VAT is high, our nation responded to the new crown outbreak of tax and fee cuts, VAT preferential policies, and in 2020 VAT accounted for 39.46% in 2019, fell to 36.80%. Japan’s business tax decreased significantly in 2020, particularly in the second quarter of 2020, which decreased by as much as 85.53%. From 2021 to 2023, the business tax increased positively, reaching a high growth rate of 127.39% in the third quarter of 2023. This suggests that Japan primarily provides tax relief for business tax in response to the COVID-19 tax and fee reduction policy. The VAT and corporate tax reductions and exemptions will directly lower business costs, boost earnings, and promote investment. Japanese population increased from 88.2 to 121.2, and positive growth in fixed asset investment has been seen since the third quarter of 2020. Corporate profits and capital expenditures have increased by 13.8% and 18.5%, respectively. In order to improve company conditions, lower losses, and boost profits, VAT and business tax reductions are crucial.
3.2.3 Excise tax and sales tax
Expenditure tax in China is a tax on particular consumer items, primarily to guide consumer consumption. Currently, there are 15 consumer goods subject to consumption tax. Due to the outbreak, consumers reduced their consumption of luxury goods and non-necessities, which caused consumption tax to decline in 2020 (Longtao et al., 2022) and (Hu et al., 2021). However, with the effective control of the epidemic and the economy’s recovery, consumption tax rose in 2021. The luxury market in 2020 experienced a 30% first-quarter decline before beginning to climb in the second. Japan’s consumption tax range is broad, covering almost all goods and transactions, and there are links between it and our nation. As a result, Japan’s consumption tax only experienced negative growth and decline in the second quarter of 2020, a decline of 62.17%. The leading cause of this is the outbreak, which caused a decrease in consumer demand and an increase in outbreak-related demand. Since the state of commodities dealing, leasing and services are subject to the sales tax. It was negatively impacted by the outbreak in the second quarter of 2020, growing by 10.48%. As the outbreak subsided, the sales tax steadily increased, but American manufacturing, wholesale, and retail sales declined significantly in March and April 2020, starting in May. The consumption tax in Japan and the lower sales tax in the US can both, to a certain extent, increase spending and support economic growth during the epidemic era, as can be seen from those above. In contrast, China will restrict its consumption of luxury products at this time.
3.2.4 The social security fund and the social security tax
Due to China’s lowered and postponed social security payments made by businesses during the epidemic, the income growth rate of social security funds decreased to varying degrees in 2020. With the pandemic successfully under control and social security firms receiving their regular payments, the income growth rate of social security funds started to increase in 2021. With only a modest fall of 0.64% in the second quarter of 2020, attributable to US subsidies for individuals and families during the outbreak, the US Social Security Fund’s income was less negatively impacted by the epidemic. From the second to the fourth quarters of 2020, Japan’s social security tax decreased slightly, by less than 2%. According to the comparison above, China has more favorable regulations for cutting back on the social security fund during an epidemic than the US and Japan. Businesses’ production and operating costs are somewhat reduced by the decrease and exemption of the social security fund and social security tax, which makes it easier for businesses to generate more cash flow and increase production. We can also conclude that Chinese companies can resume output faster during the epidemic era based on the aforementioned business climate and industrial production indexes.
3.2.5 Social welfare and subsidies
Social welfare programs developed in the United States and Japan throughout the outbreak. Social assistance and subsidies are quite substantial as the United States fights the disease. Between the second quarter of 2020 and the first quarter of 2021, social welfare in the United States experienced a greater growth rate, with certain quarters experiencing growth rates of more than 80%. In the second and third quarters of 2020, the subsidies increased by 1,811.60% and 1,403.90%, respectively, as a result of increased subsidies from the United States during the pandemic. Social assistance and subsidies only started to decrease when the outbreak eased in the second quarter of 2021; in Japan, despite an increase in social welfare throughout the outbreak, it was only a slight 1% increase. Since the United States provided more social benefits and subsidies to families and individuals during the epidemic, raising household income and encouraging consumption, American retail sales started 6.71 negative growth in the second quarter of 2020, rising to 4.45%, while China and Japan experienced negative retail sales growth during the epidemic, with Chinese retail sales growing in the first and second quarters of 2020 and Japanese retail sales growing in the first three-quarters of 2020. As was previously illustrated, social welfare and subsidies can have a quick impact in the face of an epidemic by raising resident incomes, boosting income, and so fostering economic growth.
3.2.6 Other taxes and fees
The epidemic negatively impacted China’s exports, which led to an increase in the export tax rebate rate and a dramatic reduction in the export tax rebate in 2020. However, in 2021, the export tax rebate started to show signs of improvement. China’s trade balance, meanwhile, only showed a deficit in February 2020, started to trend upward in March, and continued to show a surplus. Japan is impacted by various factors, including the economy and the outbreak, and tariffs from the first quarter of 2020 to the second quarter of 2021 have resulted in negative growth. In particular, the second quarter of 2020 saw a significant decline of 38.99%. Despite tariff reductions, Japan’s trade balance in the third and fourth quarters of 2020 is still greater than 0, indicating a trade surplus before changing to a trade deficit. As a result, China’s preferential export tax rebate policy is more effective than Japan’s preferential tariff policy.
In conclusion, the enterprise income tax, value-added tax, and social security premiums granted to businesses during the epidemic era play a significant role in the resumption of employment and production, raising investment, minimizing losses, improving profits, and other aspects. Although the impact of China’s corporate income tax cut is greater than that of the United States and Japan, the United States sales tax cuts, social benefits, and individual and family subsidies are still considerable. Japanese company tax and consumption tax reductions will encourage the development of business, personal, and family consumption, increasing citizens’ disposable income and promoting consumption. However, China’s social security and export tax rebates were not included in Japan’s social security tax and tariff decrease.
4 Conclusion and suggestions
4.1 Conclusion
First, research comparing the employment and GDP growth rates of China, the United States, Japan, and the other three countries against the new crown tax and fee cuts policy found that the new crown outbreak in China in early 2020, China’s first GDP growth fell in the first quarter of 2020. Then China adopted a rate of tax and fee cuts measures, mainly for the enterprise various tax breaks, China’s economic recovery, GDP growth in 2020, and is one of the few countries with GDP growth in 2020 The GDP and employment rate drastically decreased in the second quarter of 2020 as a result of the COVID-19 countries’ effects. While proactive fiscal and monetary policies like tax and fee reductions recovered the employment rate and total GDP in the United States and Japan, the GDP was still negative in 2020. From the standpoint of tax reduction and fee reduction policies, China, the United States, and Japan all primarily lower taxes and fees for individuals in order to implement their “six guarantees” policy. The United States primarily offers tax rebates and direct subsidies for individuals. Japan has tax exemptions for both businesses and individuals. In addressing COVID-19, China’s tax and fee reduction policies have been beneficial. Reduced operational costs as a result of corporate tax cuts have boosted employment and growth. To achieve the best results from tax reduction, however, the tax reduction policies for individuals and families in the United States and Japan can also be used as a guide.
Then, it was discovered through a comparison of the GDP growth rates, total tax revenue growth rates, and various tax growth rates in China, the US, and Japan that these nations responded to COVID-19 in different ways by implementing various tax and fee reduction measures. Because China levies both an income tax and a turnover tax, we can delay or reduce the payment of social security benefits in response to COVID-19. In contrast, the United States and Japan reduce income, consumption, and business taxes. In light of this, our nation should continue to implement an enterprise income tax, VAT, social tax, and export tax rebates, as well as learn from other nations’ advanced tax and fee cuts policies, such as the United States and Japan’s social welfare subsidies, etc., to not only help businesses quickly resume work and production but also to encourage family and personal consumption and spur economic growth. The United States and Japan can also learn from our practice, increase the reduction of social security funds and social security taxes, reduce the operating costs of enterprises, increase the cash flow of enterprises, stimulate the vitality of enterprises, quickly restore production and stabilize employment.
4.2 Suggestions
Comparative analysis of how the United States and Japan have responded to the recent wave of tax cuts has revealed that while our country’s enterprise income tax, value added tax, social tax, and export rebate reduction effects are significant, those for consumption tax, personal income tax, and social welfare subsidies are not. In addition, our country’s continued tax and fee cuts under policy have increased the fiscal deficit and pressure on the government, which is why this paper is being written.
4.2.1 We will continue to deepen tax and fee reduction policies
China has responded to COVID-19 by introducing seven batches of 28 tax and fee reduction policies, primarily to help assure epidemic prevention and control, assist businesses in overcoming challenges, and guarantee the necessities of life for citizens. China is one of the few countries with positive economic growth because of the proactive fiscal policy of tax reductions, which has allowed the country’s economy to sustain a 2.3% growth rate in 2020. China should continue to deepen its tax exemption and reduction policies, such as lowering corporate income tax, value-added tax, and social insurance premiums. The corporate income tax should concentrate on the industries significantly impacted by the epidemic or emergency and intensify the reduction and exemption because manufacturing, tourism, and micro, small, and medium-sized businesses have all been negatively impacted by the disease. It should be decreased from three to two rates in terms of VAT. Additionally, this is in accordance with China’s “14th Five-Year Plan” objectives to broaden the scope of tax benefits; Social Security premiums. In order to alleviate China’s pension crisis and lower operating expenses for businesses, it is necessary to decrease the firm social security contribution rate while simultaneously raising the social security participation rate.
4.2.2 Innovate tax reduction policies based on the existing anti-epidemic tax reduction policies
The comparison research above indicates that China’s consumption tax is not material in response to COVID-19. The primary factor is that China’s consumption tax is too limited in reach. There are now insufficient taxes on luxury products. Only 15 tax categories are included in our excise tax. During the pandemic, only the premium consumer market declined by 30% in the first quarter of 2020. Data from Bain show that in 2020, Chinese consumers’ domestic consumption accounted for more than 70% of all domestic and foreign consumption; as a result, China’s consumption tax should broaden its collection scope. Increasing the luxury goods consumption tax rate; I n the midst of the epidemic, China has reduced its preferential tax policies for individuals and families, while America and Japan’s efforts to boost consumption fell short. Therefore, in addition to providing preferential tax treatment for businesses and tax and fee reduction measures, China should also provide individual resident and household tax cuts when responding to COVID-19 or other significant catastrophes. Furthermore, by boosting social welfare and subsidies, the United States offers individuals direct subsidies and tax breaks. Japan permits pre-tax school fund deductions and tax breaks for parents, Australia allows early pension payments, etc. To boost citizens’ disposable income and encourage spending.
4.2.3 Expand the tax base and increase fiscal revenue
In the short term, ongoing tax and fee reductions will lower businesses’ production and running expenses. Still, the lowered tax collection will increase the budget deficit or sharply limit the government’s spending. The room for tax cuts and fee reductions is constrained in the long run if we do not take fiscal affordability into account and focus simply on the effect of tax cuts. This means that prolonged tax cuts are impossible. By increasing the tax burden on state-owned firms and the%age of earnings paid, reviving the rate at which state assets are used, and promptly recovering carry-over and excess money, we will broaden the tax base and raise fiscal income. In addition, we will expand the reach of taxation by enacting inheritance and real estate taxes concurrently.
4.2.4 We will combine tax and fee cuts with deepening reform of the fiscal and tax systems
Accelerating the transformation of government operations, improving the reform of the fiscal and tax systems, and enhancing the long-term mechanism for tax and fee cuts are all necessary to ensure the sustainability of tax and fee reductions as well as government revenue and expenditure over the long term (Research Group of State Treasury Division of PBC Nanjing Branch, 2020). First and foremost, we should enhance the fiscal and tax system reform, improve the direct tax system, increase the share of direct tax requirements, and play a stronger role in enhancing the redistribution mechanism and providing the third distribution its proper due. Then, we will strengthen the evaluation of the impact of tax and fee reduction policies, implement universal preferential tax policies, improve the long-term mechanism for tax and fee reduction policies, and integrate tax and fee reduction into a more profound reform of the fiscal and tax systems, achieve the best possible structure for fiscal revenue, and make tax and fee reduction and fiscal operation sustainable development.
Finally, it should be noted that this paper only conducted a comparative study on the tax and fee reduction policies and effects of China, the United States and Japan in response to the epidemic and major emergencies, and did not cover the research of other countries, so the research scope was limited. In addition, other countries should take into account their specific national conditions and make appropriate adjustments when learning from the remarkable tax and fee reduction measures taken by China, the United States and Japan. In terms of research methods, more rigorous empirical tests and analysis of policy effects can be carried out.
Data availability statement
Publicly available datasets were analyzed in this study. This data can be found here: WDI.
Author contributions
MY: Writing — original draft, data curation, visualization, supervision; YG: Conceptualization, data curation, methodology; LB: Editing, writing — review, and software.
Conflict of interest
The authors declare that the research was conducted in the absence of any commercial or financial relationships that could be construed as a potential conflict of interest.
Publisher’s note
All claims expressed in this article are solely those of the authors and do not necessarily represent those of their affiliated organizations, or those of the publisher, the editors and the reviewers. Any product that may be evaluated in this article, or claim that may be made by its manufacturer, is not guaranteed or endorsed by the publisher.
Footnotes
1IMF Fiscal Policies Database (https://www.imf.org/en/Topics/imf-and-covid19/Fiscal-Policies-Database-in-Response-to-COVID-19).
2THE WORD BANK Data(https://data.worldbank.org.cn/country/china?view=chart).
3National Bureau of Statistics data(http://www.stats.gov.cn/tjsj).
4Data from CEIC database (https://insights.ceicdata.com/login); IMF Policy Responses to COVID19 (https://www.imf.org/en/Topics/imf-and-covid19/Policy-Responses-to-COVID-19).
5Data from the Internal Revenue Service (http://www.irs.gov/); IMF Policy Responses to COVID19 (https://www.imf.org/en/Topics/imf-and-covid19/Policy-Responses-to-COVID-19).
6Data from CEIC database (https://insights.ceicdata.com/login); IMF Policy Responses to COVID19 (https://www.imf.org/en/Topics/imf-and-covid19/Policy-Responses-to-COVID-19).
7Data from the National Tax Service of Japan (https://www.nta.go.jp); IMF Policy Responses to COVID19 (https://www.imf.org/en/Topics/imf-and-covid19/Policy-Responses-to-COVID-19).
References
Boone, L., Haugh, D., and Pain, N. (2020). Tackling the fallout from COVID-19[J]. Econ. Time COVID-19 37, 44. Available at: https://www.viet-studies.com/kinhte/COVID19_CPER.pdf#page=44.
Cheng, H. (2020). Practice and optimization strategies of COVID-19 tax policies in China [J]. Sub Natl. Fiscal Res. (04), 48–53.
China Report (2020). What should the affected wages, social security, and tax payments do during the epidemic period?[J]. China Rep. (Z1), 13. https://oversea.cnki.net/kns/detail/detail.aspx?FileName=ZGBD2020Z1009&DbName=CJFQ2020.
Cui, C., Cai, W. Y., and Cui, Y. (2020). Analysis of the impact of the epidemic on local fiscal and tax revenues and "three guarantees" expenditures— Takes shenqiu county of henan province as an example [J]. Financ. Superv. (06), 69–76.
Gao, P. (2019). Grasp the proactive fiscal policy based on high-quality development and understand the profound changes in the allocation pattern [J]. Money China (16), 39–41.
General Office of the State Administration of Taxation of China. (2020) Guidelines on preferential tax policies to support epidemic prevention and control and economic and social development. Available at: http://www.chinatax.gov.cn/chinatax/n810219/n810724/c5145862/content.html.(Accessed 2020 03 10).
Hejing, S. (2022). Economic analysis of policies of cutting taxes and fees for economic growth [J]. Trade Fair Econ. (13), 17–19. doi:10.19995/j.cnki.CN10-1617/F7.2022.13.017
Hu, T., Wang, S., She, B., Zhang, M., Huang, X., Cui, Y., et al. (2021). Human mobility data in the COVID-19 pandemic: Characteristics, applications, and challenges. Int. J. Digital Earth 14 (9), 1126–1147. doi:10.1080/17538947.2021.1952324
Li, T., and Yang, L. (2021). The effects of tax reduction and fee reduction policies on the digital economy. Sustainability 13 (14), 7611. doi:10.3390/su13147611
Li, W., and Liu, T. (2019). Tax reduction and fee reduction policy research opinion review [J]. Tax. Res. 2020 (04), 138–145. doi:10.19376/j.cnki.cn11-1011/f.2020.04.021
Liang, X. (2021). On the strategic choice of playing a tax support role under the epidemic situation [J]. China Mark. 2021 (31), 53–54. doi:10.13939/j.cnki.zgsc.2021.31.053
Longtao, H., Liping, M., Jean, JA, Zhang, L., Wu, H., Zhou, T., et al. (2022). Contributions and challenges of Public Health Social Work practice during the initial 2020 COVID-19 outbreak in China. Br. J. Soc. Work, bcac077. doi:10.1093/bjsw/bcac077
Ming, L., and Xiaowen, W. (2020). Tax policies in response to public health emergencies [J]. Fiscal Sci. (02), 17–23. doi:10.19477/j.cnki.10-1368/f.2020.02.002
Wan, H. (2020). Actively respond to the impact of COVID-19 epidemic and comprehensively promote economic and social development[J]. China State Finance (10), 14–17. doi:10.14115/j.cnki.zgcz.2020.10.004
Wang, S., and Yuan, F. (2020). Tax cuts and fee reductions:mechanism, measures and micro effects [J]. Financial Res. 2020 (01), 18–25. doi:10.14115/j.cnki.10-1242/f.2020.01.003
Wen, L., Yu, Y., and Chen, S. (2020). Tax policies will help win the battle against COVID-19 [J]. China State Finance (08), 69–70. doi:10.14115/j.cnki.zgcz.2020.08.028
Wenzheng, X.Research Group of State Treasury Division of PBC Nanjing Branch (2020). Effect assessment of the tax and fee reduction policies [J]. Financial Perspect. J. (04), 57–67.
Yang, D., Zhu, T., Wang, S., Wang, S., and Xiong, Z. (2022). LFRSNet: A robust light field semantic segmentation network combining contextual and geometric features. Front. Environ. Sci. 1443. doi:10.3389/fenvs.2022.996513
Yang, G., and Sun, H. (2020). Research on the relationship between macro tax burden and economic growth—concurrently analyze the effects of tax and fee reduction policies in response to COVID-19 [J]. Price:Theory Pract. (08), 84–87. doi:10.19851/j.cnki.cn11-1010/f.2020.08.317
Zhang, B. (2019). Theoretical dimensions, policy framework, and the realistic choices of tax and fee cut [J]. Financial Res. (05), 7–16. + 76. doi:10.19477/j.cnki.11-1077/f.2019.05.002
Zhao, S., and Chen, J. (2020). Fiscal and tax policies of countries (regions) on COVID-19 [J]. China Dev. Obs. (Z5), 118–120. + 117.
Zhou, Y., Zhou, J., Li, Y., and Rui, D. (2022). Convergence or divergence: Preferences for establishing an unemployment subsidy during the COVID-19 period by taxing across earnings redistribution in urban China[J]. Front. Psychol., 2766. Available at: https://frontiersin.yncjkj.com/articles/10.3389/fpsyg.2022.852792/pdf.
Keywords: tax reduction and fee reduction, economic growth rate, employment rate, tax system reform, COVID-19
Citation: Yujuan M, Guangli Y and Bo L (2022) A comparative study on the tax and fee reduction policies for sustainable development: Empirical analysis from the world’s three major economies in tackling COVID-19. Front. Environ. Sci. 10:1032425. doi: 10.3389/fenvs.2022.1032425
Received: 30 August 2022; Accepted: 26 September 2022;
Published: 14 October 2022.
Edited by:
Jean Vasile Andrei, Universitatea Petrol Si Gaze Ploiesti, RomaniaCopyright © 2022 Yujuan, Guangli and Bo. This is an open-access article distributed under the terms of the Creative Commons Attribution License (CC BY). The use, distribution or reproduction in other forums is permitted, provided the original author(s) and the copyright owner(s) are credited and that the original publication in this journal is cited, in accordance with accepted academic practice. No use, distribution or reproduction is permitted which does not comply with these terms.
*Correspondence: Yang Guangli, eV9ndWFuZ2xpQGhvdG1haWwuY29t