 Feifei Li1
 Mingyue Du
- 1Department of Economics and Management, Yuncheng University, Yuncheng, China
- 2School of Economics, Beijing Technology and Business University, Beijing, China
As a way for the government to integrate funds and make up for fiscal deficits, bond issuance plays an important role in environmental governance and thus impacts environmental quality. Based on the panel data of 30 provinces in China from 2011 to 2019, this study utilizes spatial econometric and threshold panel models to investigate the influence of local government debt on environmental pollution. The empirical results are as follows: 1) Both environmental pollution and local government debt have a significant positive spatial agglomeration effect. 2) The relationship between local government debt and environmental pollution presents a nonlinear U-shaped curve. Specifically, when the debt scale is less than the threshold value, local government debt plays a role in restraining environmental pollution, and when the debt scale exceeds the threshold value, the influence of local government debt on environmental pollution plays a promoting role. 3) A regional heterogeneity test suggests that in the eastern region, the influence of local government debt on environmental pollution is always restraining, while in the central and western regions, this influence is consistent with the national level, showing a U-shaped feature. This study provides a reference for policy-makers in improving environmental quality from the perspective of local government debt. Policy-makers should keep the scale of government debt within a moderate range to avoid the deterioration of environmental quality caused by excessive debt.
1 Introduction
Since its reform and opening up, China’s economy has developed rapidly and become the second largest in the world (Abbasi et al., 2022; Irfan and Ahmad, 2022). However, with the rapid advancement of industrialization and urbanization, China’s environmental problems have become increasingly serious (Wu et al., 2020; Ren et al., 2022b). The 2020 Global Environmental Performance Index (EPI) report showed that among the 180 participating countries and regions, China’s environmental performance ranked 120th and that its performance score was only approximately 55% of that of the top-ranked country. Environmental pollution, ecological destruction, smog weather and other problems have seriously restricted the sustainable development of the economy and had a serious effect on people’s production, life and health (Duan et al., 2020; Hao et al., 2021; Yang et al., 2021). Therefore, the strengthening of environmental governance and improvement of environmental quality are important aspects of the new development concept (Ren et al., 2022a). To this end, government departments have promulgated a string of new policies to improve the layout of related industries and alleviate environmental pollution. The General Plan for the Reform of Ecological Civilization System, formulated and implemented by the State Council, points out the following: “We should quicken the construction of a system of ecological civilization and enhance the systematicness, integrity and synergy of the reform of ecological civilization system.” The “14th Five-Year Plan” also points out that in the face of increasing environmental problems, there is an urgent need for the laying out of green transformation and for the agglomeration and development of pollution-intensive industries to be actively guided.
Environmental protection is a long-term and systematic project that requires many material and financial resources (Rediske et al., 2021; Su et al., 2021; Wu et al., 2021). As the concrete executors of environmental policies, local government departments need sufficient financial funds to ensure the implementation of environmental policies. However, since the start of tax-sharing reform in 1994, Chinese local governments have been faced with a mismatch between financial and administrative power, which has led them to issue debts through investment and financing platforms to raise funds (Qi et al., 2022). In recent years, the scale of China’s local government debt has been expanding continuously. According to the statistics of the Ministry of Finance, in 2008, China’s local government debt was 5.57 trillion yuan and, by the end of 2020, had reached 25.66 trillion yuan, translating to a 3.6-fold increase. Borrowing debt can not only make up for this fiscal deficit and promote economic growth but also give corresponding financial support to the field of environmental pollution prevention and control to a large extent and play a guiding role in government policies. Moreover, the expansion of local government debt can improve the quality of the regional environment. However, when the debt scale continues to expand and debt is overissued, local governments may face greater financial pressure. To protect its reputation and repay its debt on time, the government tends to relax its environmental supervision policy, choosing instead to promote economic growth and increase fiscal revenue, with the phenomenon of an “environment for growth” even appearing (Pang et al., 2019; Jiang and Li, 2021). At this time, the expansion of the debt scale worsens environmental quality and aggravates environmental pollution. Therefore, what is the impact of local government debt on environmental pollution? Does local government debt promote or suppress environmental pollution, or is it suppressed first and then promoted? Therefore, against the background of China’s pursuit of high-quality economic development and the continuous expansion of local government debt, it is of great practical significance to study the impact of local government debt on environmental pollution.
The rest of this paper is organized as follows. Section 2 reviews the related literature. Section 3 analyses the influence mechanism of local government debt on environmental pollution and proposes the research hypotheses. Section 4 sets up the econometric model and explains the data sources. Section 5 reports the empirical results and analysis. Finally, Section 6 summarizes the full text and puts forward corresponding policy suggestions. The specific research framework used for this study is shown in Figure 1.
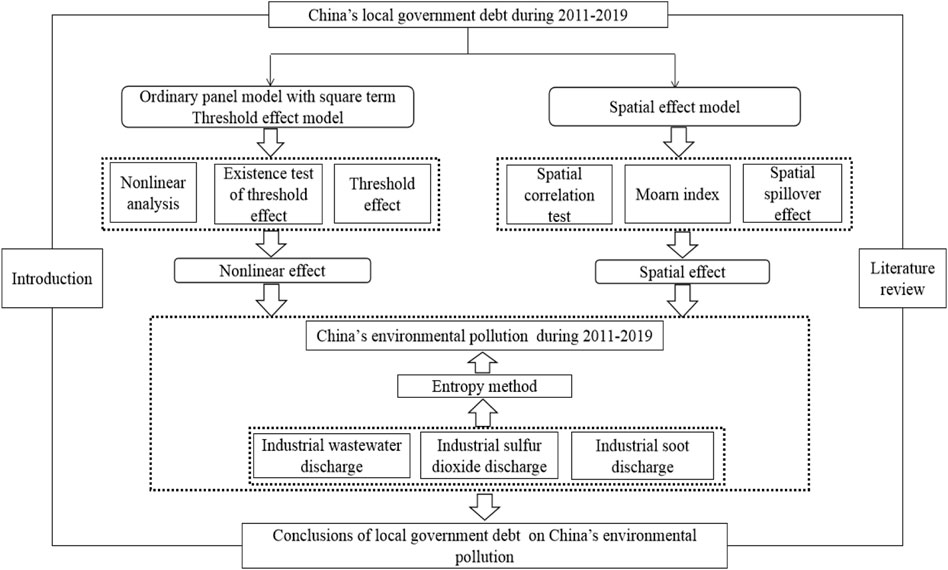
FIGURE 1. Research framework.
2 Literature review
At present, the literature on local government debt and environmental pollution focuses mainly on the influencing factors of environmental pollution, the economic consequences of local government debt and the relationship between these two factors. Therefore, this section also reviews the related research from the perspective of these three aspects.
2.1 Influencing factors of environmental pollution
Scholars have analysed the influencing factors of environmental pollution (Duan et al., 2021), including economic growth (Grossman and Krueger, 1995), financial development (Abbasi and Riaz, 2016; Katircioğlu and Taşpinar, 2017; Xiong and Qi, 2018), foreign direct investment (An et al., 2021), real estate development (Wei and Kong, 2019; Gong and Kong, 2022) and education inequality (Liu et al., 2022). Moreover, some scholars have become concerned about the effect of public financial expenses on environmental quality. For instance, López et al. (2011) claimed that with of the increase in public expenditure, sulfur dioxide (SO2) emissions and lead concentration decrease, while Hua et al. (2018) studied the influence of education and innovation expenditure on atmospheric pollution by using sample data from China, the empirical results of which showed that both education and innovation expenditure significantly reduced SO2 emissions. Furthermore, Karásek and Pavlica (2016) and Sachs et al. (2019) showed that financial expenditure on environmental protection, such as green investment, plays a positive role in improving environmental quality.
2.2 Economic consequences of local government debt
Currently, a large number of studies have examined the economic effects brought about by the expansion of local government debt, but no consistent conclusion has been reached. The positive view is that such a sustained economic recession has a negative impact on industrial capital and investment projects. In both the short and long terms, government borrowing or expansionary fiscal policies can have a positive impact on output, thus promoting regional economic growth (Spilioti and Vamvoukas, 2015; Arai et al., 2018). In contrast, the negative view holds that although government borrowing can promote economic growth to a certain extent, the excessive expansion of the debt scale may cause inflation, raise interest rates, and then crowd out private investment, which are not conducive to economic growth (Cochrane, 2011; Teles and Mussolini, 2014; Swamy, 2020). The third view is that the influence of local government borrowing on the economy is not invariable and that the relationship between debt and economic growth is nonlinear; that is, there are one or more debt thresholds. When the debt level is lower than this threshold, the relationship between debt and economic growth is positive, but once the level exceeds this threshold, this relationship is reversed (Baum et al., 2013; Woo and Kumar, 2015). In addition, some studies have examined the effects of local government debt on other economic indicators, such as technological innovation (Xu et al., 2021), inflation (Reinhart and Rogoff, 2010), interest rate (Winter 2017), and financial risk (Zheng et al., 2021; Ba, 2022).
2.3 Influence of local government debt on environmental pollution
Regarding the impact of local government debt on environmental pollution, at present, there are not many studies in this field, with only a few studies having directly examined the relationship between these two factors. For example, using a sample of Chinese data, Qi et al. (2022) revealed that local government debt negatively affects SO2 emissions and that this negative effect shows a dynamic feature of first strengthening and then weakening. Moreover, Zhang and Zhao (2018) indicated that the increase in the debt scale places great pressure on local governments to repay debts and interests. To avoid damaging their reputation, local governments choose to exchange environment quality for economic growth; that is, the expansion of government debt promotes environmental pollution. Additionally, Carratù et al. (2019), taking European countries as the research sample, found that government debt has a restraining effect on consumption pollution and that this effect decreases with the increase in the ratio of debt to gross domestic product (GDP). Furthermore, Guo and Xue (2021) combined city-level debt data with the pollution emission data of enterprises to investigate the influence of local debt on enterprise pollution emissions and found a U-shaped curve.
The above documents have laid the foundation for understanding the effect of local government debt on environmental pollution, but some shortcomings still exist. First, the existing research related to local government debt has paid attention mainly to its economic consequences, but little focus has been placed on its noneconomic effects, particularly those on the ecological environment. Second, the literature has used mainly panel data, rarely considering the influence of spatial geographical factors. Spatial correlation and contagion are important attributes of environmental pollution, and thus, ignoring spatial effects may lead to a deviation in the results. Finally, the current research has focused mainly on the positive or negative linear effect of local government debt on environmental pollution while ignoring the nonlinear relationship between the two factors. At present, only Guo and Xue (2021) have investigated the nonlinear effect of the relationship between these two factors by introducing the square term of local government debt into the regression equation. However, a premise implied by this introduction of the square term is that the influence of government debt on environmental pollution is symmetrical around the inflection point determined by the equation, but no relevant research to support this assumption exists.
In view of this, the marginal contributions of this paper lie in three aspects. First, local government debt and environmental pollution are placed into a unified framework, which helps the impact and consequences of local government debt be fully recognized and enriches the relevant literature on the environmental effects of government debt. Second, a spatial econometric model is constructed to explore the impact of local government debt on environmental pollution more comprehensively and scientifically. Third, a threshold panel model is utilized to analyse the nonlinear relationship between local government debt and environmental pollution, and the regional heterogeneity of the influence of government debt on environmental pollution is further investigated, providing rich policy guidance and suggestions for the scientific formulation of debt prevention measures and improvement of the ecological environment.
3 Theoretical analysis and research hypotheses
3.1 Nonlinear influence of local government debt on environmental pollution
As market failures can emerge, government departments need to implement environmental protection activities, which have certain positive externalities (Qi et al., 2022). Over the past few years, the financial expenditure of Chinese government departments for the purpose of environmental protection has been increasing, with the annual investment in 2020 reaching 630 billion yuan, accounting for approximately 2.58% of central and local general public budget expenditures. Such a large fiscal expenditure does not match the current political system of turning over financial rights faced by local governments in China, and thus, local governments have to issue debt to meet the expenditure requirements for environmental protection. By issuing debt, on the one hand, the government can improve environmental quality by increasing green investment. For example, the research of Ren et al. (2022a) claims that green investment can improve energy-saving and emission reduction capacity, upgrade the industrial structure, and then restrain environmental pollution. On the other hand, the government can also promote environmental protection by increasing financial subsidies to enterprises (Wang et al., 2020). For example, the study of Qi et al. (2022) suggests that government subsidies to those enterprises that purchase environmental protection equipment and implement green innovation projects can impact their behaviours and push them towards the development of a green economy.
However, if the size of local government debt is excessively expanded, then environmental quality is also worsened, and a positive function in aggravating the degree of environmental pollution is exerted. The continuous expansion of the debt scale has brought with it certain challenges to the government’s debt repayment. To increase fiscal revenue to ensure that such debt can be repaid on time, the government often chooses to invest in public infrastructure projects that can promote economic growth shortly to increase tax revenue. However, for environmental protection expenditures, such as green investment projects, the government’s investment gradually decreases due to their long investment cycle and unstable income levels. At the same time, to further increase tax revenue, the government encourages enterprises to actively expand production, reduce the intensity of environmental supervision, and improve the pollution discharge level of the region. In addition, from the perspective of financing sources, some scholars have pointed out that the excessive expansion of local government debt reduces the level of green innovation of enterprises in the region, thus further affecting environmental quality improvement. For example, Chen et al. (2022) showed that as China’s capital market is not perfect, the local government relies mainly on banks and other financial institutions to obtain credit funds and that the financing sources of enterprises are mainly financial institutions. Due to the homogeneity and limitation of funding sources, the expansion of government financing demand occupies the credit resources originally belonging to enterprises to a great extent, thus inhibiting the green innovation investment of enterprises.
According to the above analysis, it can be inferred that the effect of local government debt on environmental pollution does not comprise a simple linear relationship. If the size of local government debt is within a moderate range, then government departments can make use of the raised funds to carry out green investment and increase financial subsidies, as well as carry out other environmental protection projects, to optimize environmental quality. If local government debt crosses a reasonable threshold, then it places pressure on the local government to repay such debt and prompts the government to embark on a path of “exchanging the environment for growth”. At this time, the effect of local government debt on environmental pollution is positive. Based on the above factors, Hypothesis 1 is put forward, with the mechanism of the effect of local government debt on environmental pollution being depicted in Figure 2.
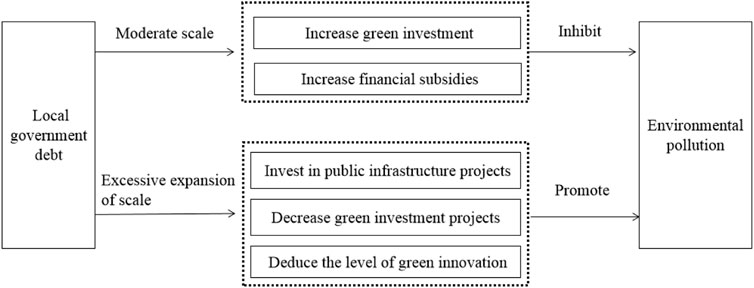
FIGURE 2. Mechanism analysis diagram.
Hypothesis 1. The impact of local government debt on environmental pollution is nonlinear.
3.2 Spatial effect of local government debt on environmental pollution
The discharge of pollutants has obvious negative externality characteristics, as pollutants can spread across different areas through various media. Therefore, environmental pollution has obvious spatial spillover characteristics (Hao et al., 2021; Wang et al., 2021; Zhang et al., 2021). Shao et al. (2016) pointed out that particulate matter (PM) 2.5 is spatially dependent due to its strong spatial diffusivity, while Ren et al. (2022b) constructed a comprehensive environmental pollution index, the empirical results of which revealed that environmental pollution has an obvious positive spatial correlation with environmental quality. Such a positive spatial correlation implies that local environmental pollution worsens environmental quality in the adjacent area (Wang and He, 2019). In addition, many scholars have been interested in the spatial correlation between local government debt and environmental pollution and considered it from different angles. Some scholars have discussed the spatial correlation between debt and environmental quality from the perspective of government competition. For example, Pan et al. (2017) pointed out that competition among local governments is the major reason for the enlargement of the government debt scale and that the competition mechanism allows the government to offer financial guarantees for the promotion of local economic improvement by continuously increasing the debt scale. Furthermore, Kopczewska et al. (2016) analysed the strategic borrowing game between local governments in terms of tax competition, indicating that both local taxes and government debt are spatially dependent. Moreover, some scholars have discussed the spatial correlation between local government debt and environmental quality at the macro level and suggested that an increase in the level of local government debt leads to an increase in the debt level of neighbouring countries and regions, and vice versa (Baskaran, 2012; Borck et al., 2015; Balaguer-Coll et al., 2016; Coll and Toneva, 2019).
The above analysis shows that environmental pollution and local government debt in different regions exhibit spatial correlation. However, few studies on the topics of government debt and environmental pollution consider the spatial effect. In recent studies, Qi et al. (2022) and Guo and Xue (2021) have utilized the data of Chinese cities to analyse the effect of government debt on emission reduction and enterprise pollution emissions and its mechanism but have not taken the spatial effect of government debt and environmental pollution into account. In view of this deficiency in the literature, to make the analysis more scientific and accurate, this study incorporates spatial correlation into the same research framework and puts forward Hypothesis 2:
Hypothesis 2. There is a spatial effect of local government debt on environmental pollution.
4 Methodology and data
4.1 Econometric methodology
4.1.1 Ordinary panel model
This study focuses on the relationship between local government debt and environmental pollution. First, we build an ordinary panel regression model, as shown in Model (1). Referring to Qi et al. (2022), to test whether there is a nonlinear relationship between local government debt and environmental pollution, we introduce a quadratic term, local government debt (
Here,
4.1.2 Spatial effect model
The abovementioned model considers only the influence of the economic and social factors of each province on local government debt and environmental pollution, but in reality, there are often complex links in various regions. The government debt level, economic status and environmental quality of neighbouring provinces and cities may also exert an influence on local government debt and environmental pollution. Therefore, in this part, spatial econometric models are built to analyse the effect of local government debt on environmental pollution. At present, spatial metrology models include mainly the spatial lag model (SAR), spatial error model (SEM) and spatial Durbin model (SDM). Based on the above factors, the spatial metrology models are constructed as follows:
Equation 2 is the SAR model, where
(1) 0–1 matrix: if provinces i and j are geographically adjacent, then
(2) Geographic distance matrix:
(3) Economic distance matrix:
4.1.3 Threshold effect model
Based on the theoretical analysis, the influence of local government debt on environmental pollution is shown to be nonlinear. By introducing the square term into the regression model, the nonlinear relationship between the two factors can be preliminarily judged, but the implicit, and rather strict, assumption is that the influence of government debt on environmental pollution is symmetrical both before and after the inflection point. However, the threshold effect model can automatically identify model characteristics according to the sample data and does not require strong presupposition. Moreover, the threshold effect model can better capture the nonlinear threshold characteristics of one variable in the economic system due to the structural mutation of another variable. Therefore, to identify the effect of local government debt on environmental pollution more accurately and learn from Hansen’s idea of building a threshold panel model (Hansen, 1999), we construct the following threshold panel model:
Here, λ1, λ2 … λn, λn+1 denote the staged influence of local governmental debt on environmental pollution; I (∙) is an instruction function;
4.2 Explanation of the variables
4.2.1 Explained variables
Environmental pollution: To comprehensively depict the degree of environmental pollution in various regions in China, with reference to Gong and Kong (2022) and Ren et al. (2022a), a composite index of environmental pollution is constructed by using industrial wastewater discharge, industrial SO2 discharge and industrial soot discharge as basic data. In the determination of index weight, the entropy method is utilized to objectively weight each index, and finally, the comprehensive index of the annual environmental pollution intensity of each province is obtained, expressed as Pol.
4.2.2 Core explanatory variables
Local government debt: Local government debt in China includes not only “in-system” local government bonds launched by the Ministry of Finance and provincial governments with obvious budget constraints but also “city investment bonds” issued by local investment and financing platforms with the function of “quasi-municipal bonds” and bonds issued by local state-owned enterprises. As the debt of local state-owned enterprises is used mainly for the development of the enterprises themselves, it does not have the full function of quasi-municipal debt, and its scale is limited by company law, so it does not change much and, thus, is not considered. Based on the above factors and referring to Wang (2022) and Shi and Zhao (2020), this study uses mainly the sum of government and urban investment bond balance to represent the size of government debt. In addition, following Chen et al. (2022) and Croce et al. (2019), to eliminate the influence of the regional economic scale, we take the ratio of government debt to GDP as the proxy variable of local government debt. Furthermore, the ratio of government debt to fiscal revenue is adopted to replace the local government debt index for the robustness test.
4.2.3 Control variables
There are many factors that affect environmental pollution. Following previous research (Wang and Zhou, 2021; Zhang and Du, 2022; Zhou et al., 2022), this study selects a series of control variables.
Economic development (Pergdp). The level of economic development can influence environmental resource demand and energy utilization efficiency, thus affecting environmental pollution. This study adopts the per capita GDP of each province to measure economic development (Du et al., 2022b).
Financial development (Finance). As the “brain” of the whole economy, finance plays an important role in optimizing the industrial structure and economic transformation; in particular, the development of green finance promotes energy conservation, emission reduction and environmental protection. In this paper, the financial development level is expressed by the proportion of the balance of loans from financial institutions to year-end GDP (Mao and Ma, 2021).
Population density (Popden). The greater the population density is, the greater the environmental pressure (Liu and Liu, 2019). The number of people per square kilometre is used to measure the level of population density.
Economic openness (Open). In this study, foreign direct investment is used to measure the degree of openness to the outside world, as such investment can curb environmental pollution by introducing advanced energy-saving and environmental protection products and clean technologies from abroad. We use the proportion of actual foreign investment and GDP to measure economic openness (Ma et al., 2022).
Research and development (R&D) investment (Rd). R&D investment can affect the level of technological innovation, which can contribute to the improvement of environmental quality. This study uses the ratio of R&D investment to GDP in each province to represent the level of R&D investment (Ma et al., 2022).
Industrial structure (Industry). As the core factor determining how the economic system uses resources and discharges waste, the industrial structure has an important impact on environmental pollution (Du et al., 2022a). In this study, the ratio of the value added of the tertiary industry to GDP is used to measure the industrial structure.
4.2.4 Date sources
In this paper, China’s provincial panel data, taken from the website of the National Bureau of Statistics, China Statistical Yearbook, China Environmental Statistics Yearbook, China Regional Economic Statistical Yearbook and the statistical yearbooks of various provinces, are used as the research sample. The descriptive statistics of the sample data are displayed in Table 1.
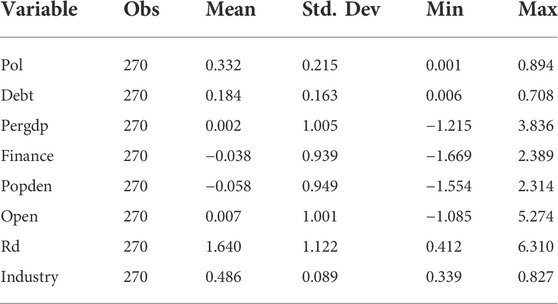
TABLE 1. Statistical description of variables.
5 Empirical results and analysis
5.1 Basic nonlinear analysis of environmental pollution caused by local government debt
Table 2 displays the regression results without considering the spatial correlation effect. Column (1) contains only the first item, local government debt; Column (2) introduces its square item on the basis of Column (1); and Columns (3)–(8) add control variables. Table 2 shows that the coefficient of local government debt in Column (1) is significantly positive, meaning that government debt can promote environmental pollution, without considering its nonlinear impact. Under the premise of considering this nonlinear influence, the square coefficients of the government debt listed in Columns (2)–(8) are all significantly positive, suggesting that local government debt has a U-shaped relationship with environmental pollution. That is, there exists a turning point of the influence of government debt on environmental pollution, before which government debt can inhibit environmental pollution and after which it can promote environmental pollution.
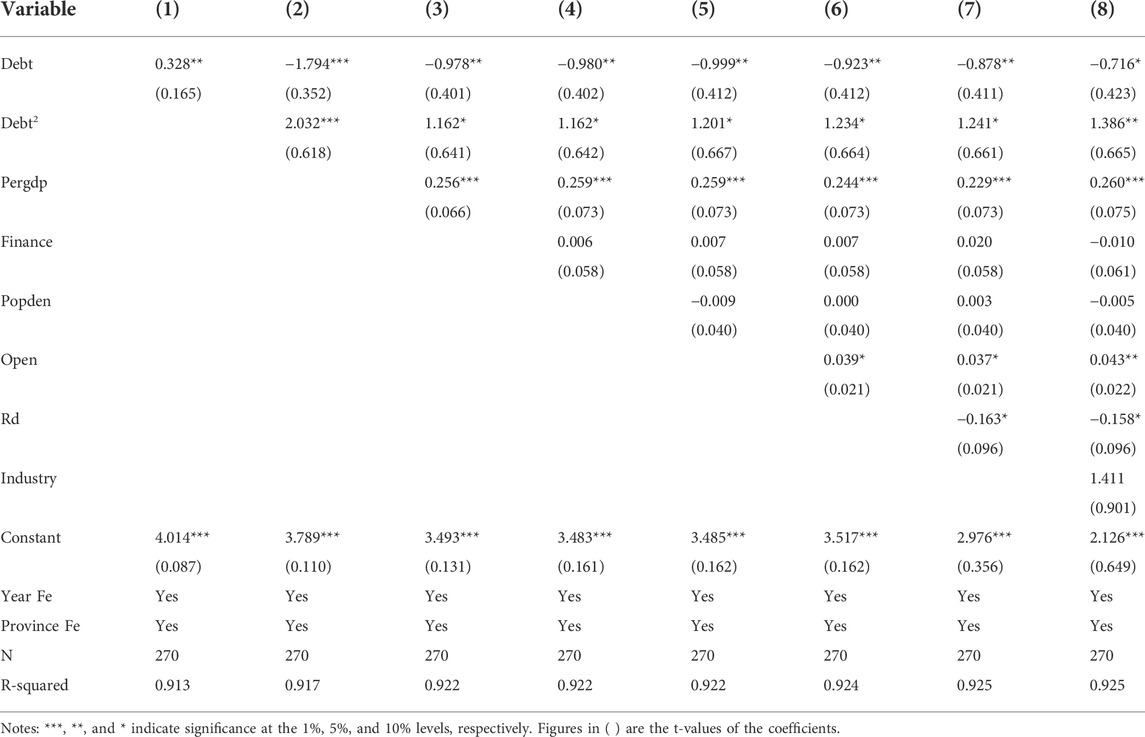
TABLE 2. Results of nonlinear regression based on square term.
Regarding the regression results in Column (8), the coefficients of the economic development level (Pergdp) and degree of openness (Openness) are all significantly positive, meaning that with the improvement of these two factors, environmental pollution becomes serious. The influence of R&D investment (Rd) on environmental pollution is significantly negative, meaning that technological innovation can optimize the regional environment, which is in line with the conclusions of Wang and Zhou (2021). In addition, the coefficients of financial development (Finance), population density (Popden) and industrial structure (Industry) all fail the significance test, implying that the degrees of these factors do not play a role in environmental pollution in the sample period.
To ensure the reliability of the above test results, this study adopts the below methods for robustness testing.
(1) Endogeneity test. On the one hand, local government debt affects environmental pollution, and on the other hand, the level of environmental pollution may also affect the borrowing strategy of the local government; that is, a two-way causal relationship may exist, which may bring about endogeneity problems leading to biased benchmark regression results. In addition, although this study attempts to control for the related factors that affect environmental pollution, the empirical results may still be affected by unobservable factors. Therefore, to alleviate this endogeneity problem caused by two-way causality and missing variables, this work lags the explained variable (environmental pollution) for the first stage and then regresses it again. The regression results are shown in Columns (1) and (2) of Table 3, with Column (1) showing the results of not adding control variables and Column (2) being the results of adding control variables. It can be seen that the quadratic coefficient of local government debt is significantly positive, which is consistent with the previous results.
(2) Substitution variable measurement method. The ratio of local government debt to GDP is replaced with the debt ratio (local government debt to fiscal revenue) for regression analysis. The regression results are shown in Columns (3) and (4) of Table 3. Column (3) does not add control variables, and the quadratic coefficient of the debt ratio is significantly positive, while Column (4) adds control variables, and the quadratic coefficient of the debt ratio is still significantly positive, indicating that after changing the measurement method of the explanatory variable, local government debt and environmental pollution still exhibit a U-shaped relationship. Thus, this conclusion is both stable and reliable.
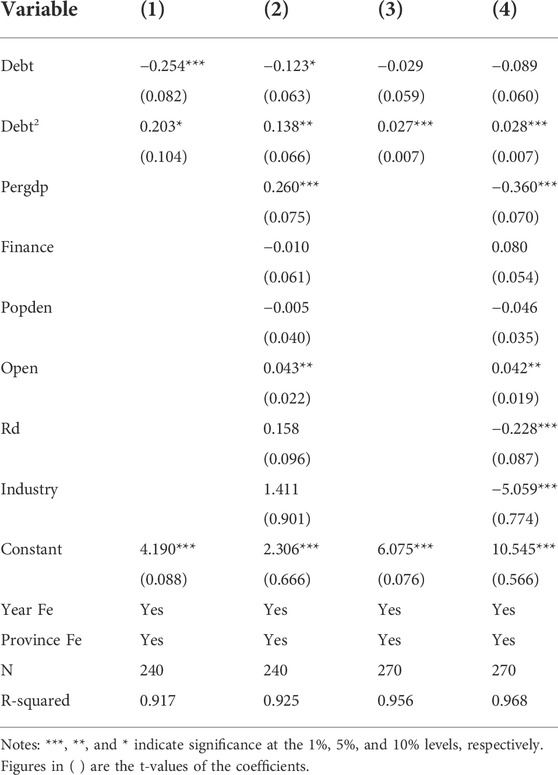
TABLE 3. The robustness test.
5.2 Estimation results of spatial model
5.2.1 Spatial correlation test
Moran’s I test is conducted on the spatial correlation of local government debt and environmental pollution from 2011 to 2019, the results of which are reported in Table 4. Moran’s Z values of environmental pollution and local government debt are mostly higher than the critical value (1.65) at the level of 0.05 from 2011 to 2019, which indicates that these two factors exhibit obvious spatial correlation.
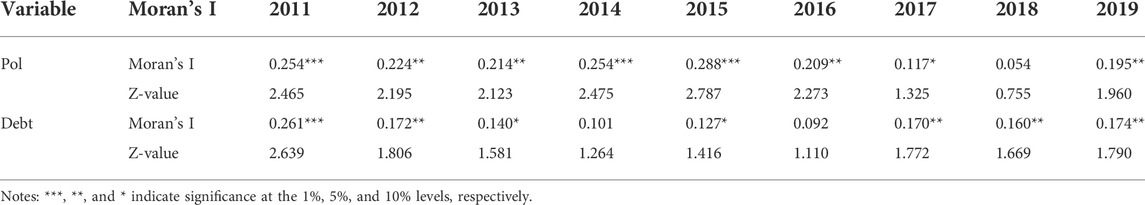
TABLE 4. Global correlation test: Moran index.
Taking 2011 and 2019 as representative years, Moran’s I scatterplot is utilized to verify the local spatial autocorrelation of local government debt and environmental pollution in each province, the results of which are presented in Figures 3, 4. Most of the observed values are located in the first and third quadrants in each figure, and the spatial agglomeration characteristics of local government debt and environmental pollution are obvious, characterized by the fact that provinces with higher levels of local government debt (environmental pollution) are adjacent to each other and that those with lower levels of local government debt (environmental pollution) are adjacent to each other, further indicating that strong local spatial correlation exists between environmental pollution and local government debt; therefore, in the next section, a spatial econometric model is constructed for further analysis.
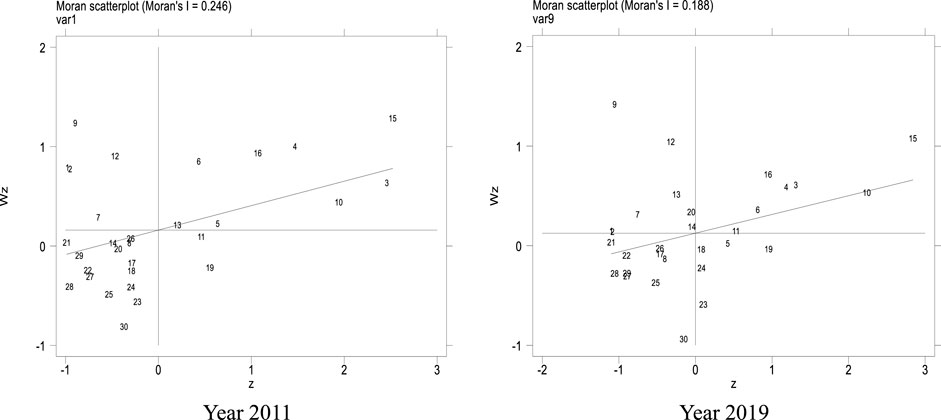
FIGURE 3. Scatter plot of the Moran’s I of China’s environmental pollution in 2011 and 2019.
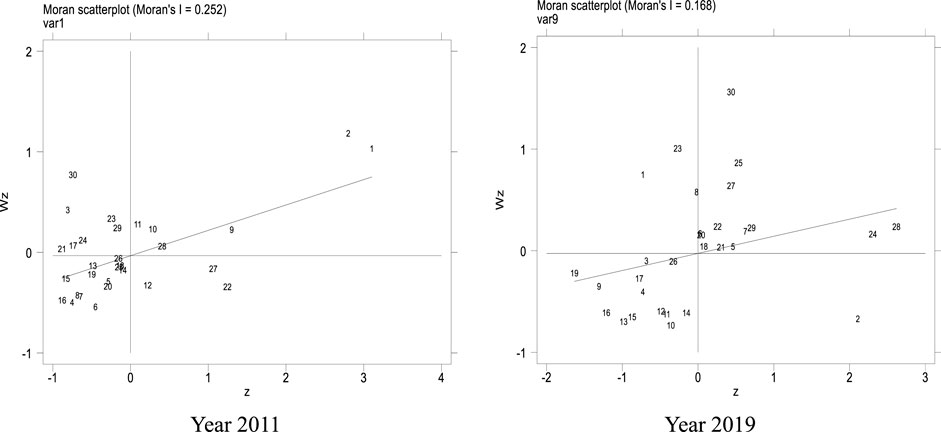
FIGURE 4. Scatter plot of the Moran’s I of China’s local government debt in 2011 and 2019.
5.2.2 Estimation results of spatial effect
Table 5 shows the regression results of the spatial econometric models, and Columns (1)–(3) report those results after using a 0–1 adjacency matrix. Specifically, the first-term coefficients of local government debt are all significantly negative, and its square-term coefficients are all significantly positive. This result implies that local government debt presents a U-shaped relationship with environmental pollution. The possible reason for this is that moderate debt issuance can make up for local financial pressure and that the funds raised by government departments through borrowing debt can increase their investment in environmental protection and optimize regional environmental quality. However, if debt is overissued, then pressure is placed on the local government in terms of debt repayment, causing government departments to take the path of ‘exchanging the environment for growth’ to expand fiscal revenue. Columns (4)–(6) show the results of the regression using the spatial matrix of geographical distance. It can be seen that the signs and significance of the first-term and square-term coefficients of government debt are consistent with the results of the regression using the 0–1 matrix, indicating that the nonlinear impact of local government debt on environmental pollution still holds when considering the geographical distances of provinces.

TABLE 5. Estimation results of the spatial econometric models.
5.2.3 Robustness test of spatial effect
To further verify the reliability of the regression results of the spatial econometric model, the following two robustness testing methods are adopted. 1) The spatial weight of economic distance is employed. With the strengthening of economic correlation among provinces, economic distance has become a factor that cannot be ignored in terms of its influence on environmental pollution and local debt, so the spatial weight of economic distance is used to regress the model. Although the coefficient of local government debt in the SDM fails the significance test, the regression results of the SAR and SEM reported in Columns 1) and 2) of Table 6 suggest that the impact of local government debt on environmental pollution is nonlinear. 2) The measurement method of the core explanatory variable (Debt) is changed. The debt ratio (local government debt to fiscal revenue) is used to replace the local government debt index for spatial effect analysis. In Columns (4)–(6) of Table 6, we observe that the results of the three models are highly concordant. All of the above results imply that the conclusions of the spatial econometric model regression analysis are robust.
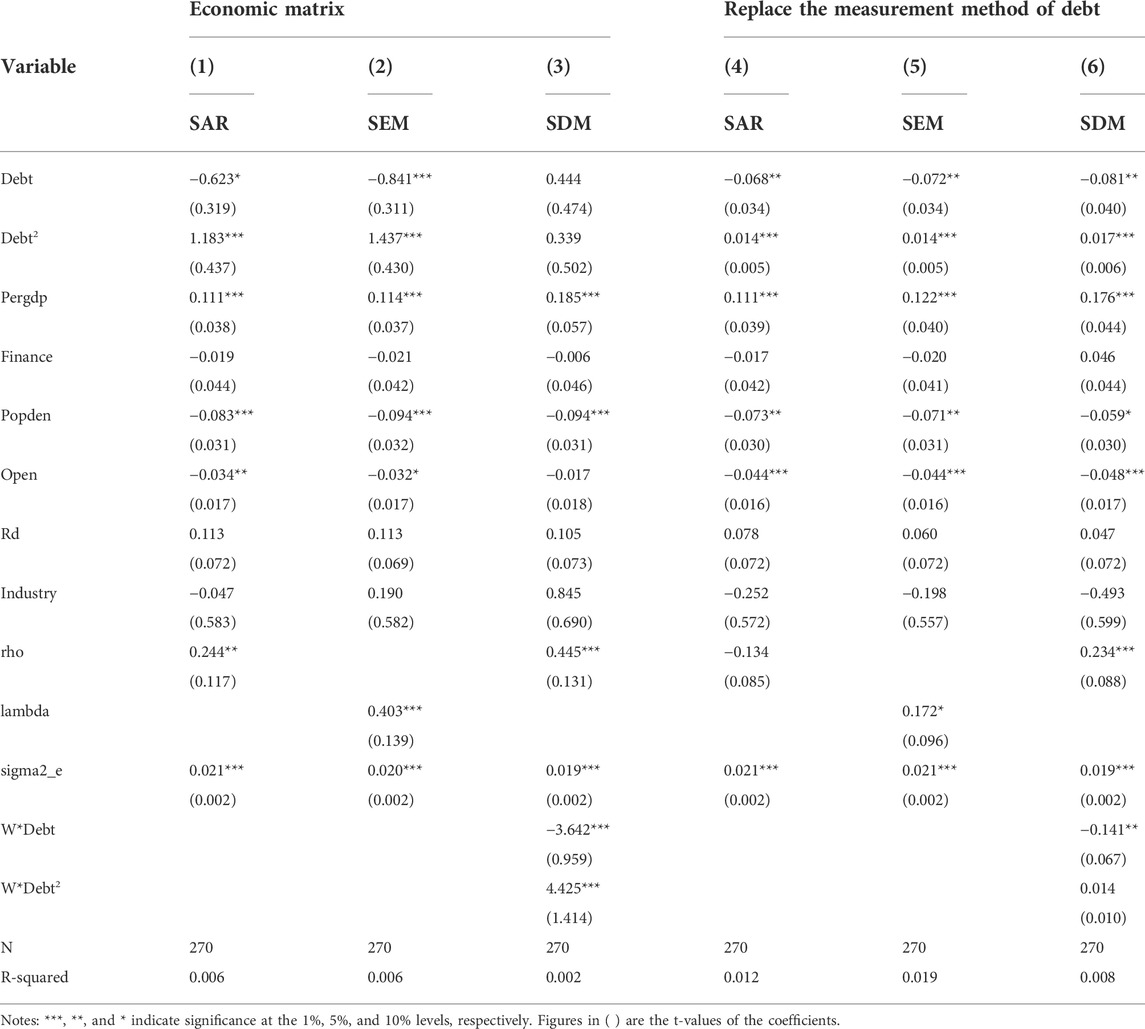
TABLE 6. Robustness test of the spatial econometric models.
5.3 Estimation results of the threshold effect
5.3.1 Existence test of the threshold effect
Before establishing the threshold effect model, we first need to test for the existence of the local government debt threshold and specific threshold number. From Table 7, the p value of the single-threshold test is shown to be 0.006, which is significant at the 1% level. The p values of the double and triple thresholds are 0.126 and 0.326, respectively, and fail the significance test. Therefore, a single-threshold model is built for estimation.
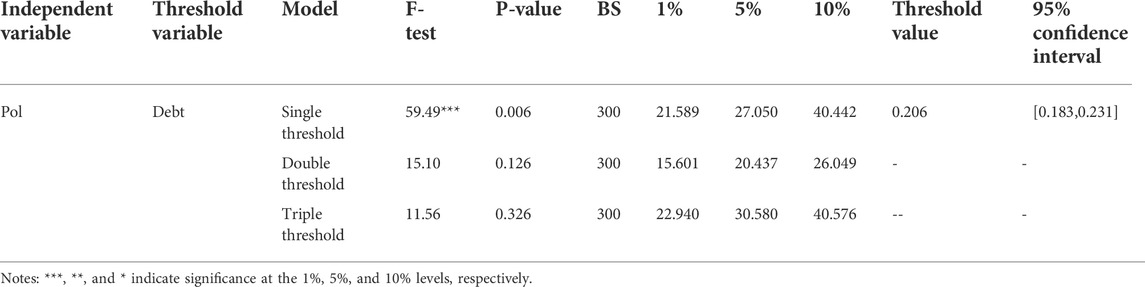
TABLE 7. Test results of threshold effect and the value of threshold estimation.
In addition, the threshold estimation result is also reported in Table 7, showing that the threshold value is 0.206. Furthermore, we draw a likelihood ratio (LR) function diagram to test the consistency between the estimated and actual threshold values, as presented in Figure 5. We can see that the LR value matching the threshold value is notably lower than the critical value of 7.35, suggesting that the estimated threshold value is accurate and effective.
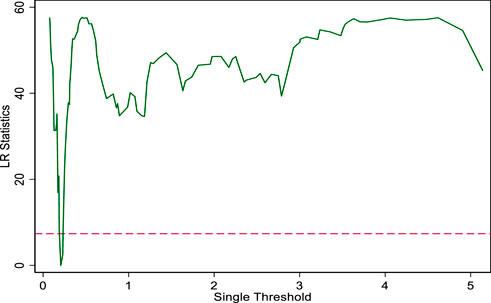
FIGURE 5. Likelihood ratio function diagram of threshold model.
5.3.2 Estimation results and robustness test of the threshold model
From Table 8, it can be seen that Column (1) lists the regression results of the common fixed effect and that Column (2) reports those of the fixed effects model considering heteroscedasticity. Specifically, when the ratio of local government debt to GDP is below 0.206, the former can significantly inhibit environmental pollution. If the proportion of local government debt to GDP surpasses 0.206, then the coefficient of local government debt is significantly positive, implying that when government debt reaches a critical value, it has a positive impact on environmental pollution. This change shows that the influence of the expansion of local government debt on environmental pollution acts as a double-edged sword and that there is a transformation between the financial and pressure effects. This research conclusion is consistent with that of Guo and Xue (2021).
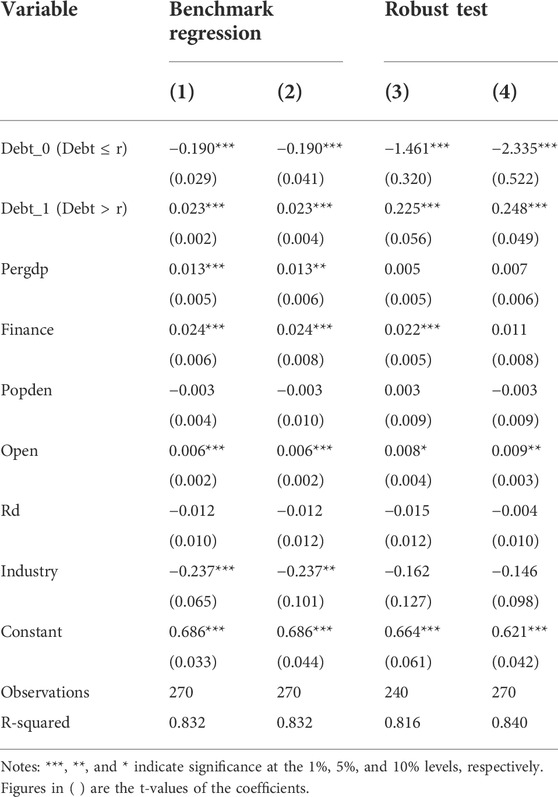
TABLE 8. Threshold regression results and its robustness test.
To further enhance the credibility of the above conclusions, some robustness tests are conducted as follows. First, to eliminate endogeneity, the core explanatory variable (local government debt) is delayed by one period to re-establish the model, the results of which are presented in Column (3). Second, we replace the measurement of the local government debt index with the ratio of the local government debt scale to fiscal revenue, the regression results of which are displayed in Column (4). The results of the robustness test are basically consistent with the previous results, suggesting that the results of the threshold effect model are both robust and reliable.
5.3.3 Heterogeneity analysis
Due to China’s vast territory, the impact of local government debt on environmental pollution may differ across regions. Therefore, this study divides 30 provinces into eastern, central and western regions for discussion. Table 9 indicates that only the single-threshold effect in the three regions passes the significance test, suggesting its existence in these regions.
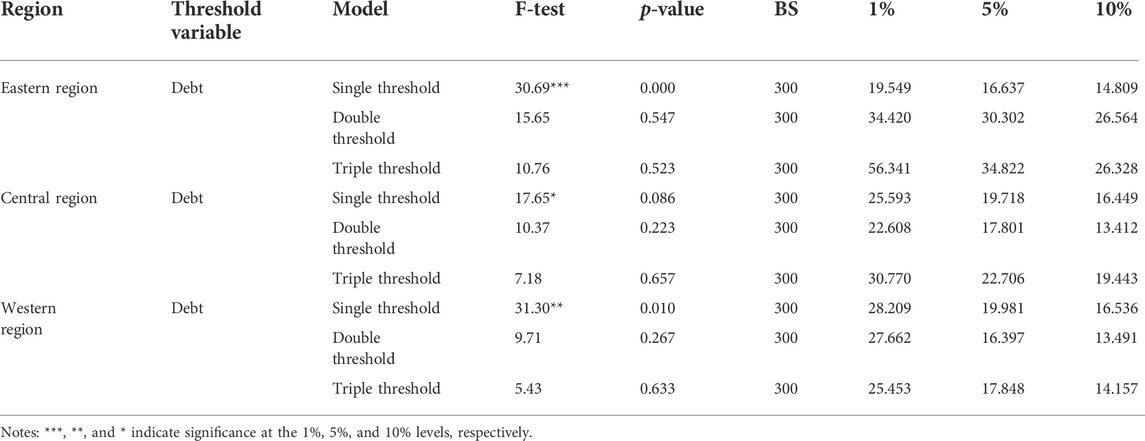
TABLE 9. The existence test of threshold effect in three regions.
Table 10 reports the regression results in the three regions. For the eastern region, when the government debt ratio does not surpass the threshold, its coefficient is significantly negative. Conversely, if the government debt ratio is above the threshold value, then although its coefficient decreases, it is still negative. For the central and western regions, the impact of local government debt on environmental pollution is in line with the results at the national level. The reason for this is mainly that the levels of economic development in different areas vary greatly. Specifically, the economy of the eastern region is developed, with the local government showing strong financing and debt bearing capacities, which leads to a relatively small impact of debt pressure on local government finance. Therefore, even after the level of local government debt surpasses the threshold, the government can still guarantee the investment of environmental protection funds by continuing to issue debt. For the underdeveloped central and western regions, the government’s solvency is relatively weak, so the relieving of financial pressure by issuing bonds is an unsustainable approach. Therefore, the relaxing of environmental supervision to promote economic growth has become one possible strategy in these regions. Therefore, as the scale of local government debt surpasses the threshold value, the environmental quality of these regions may be more affected by local government debt.
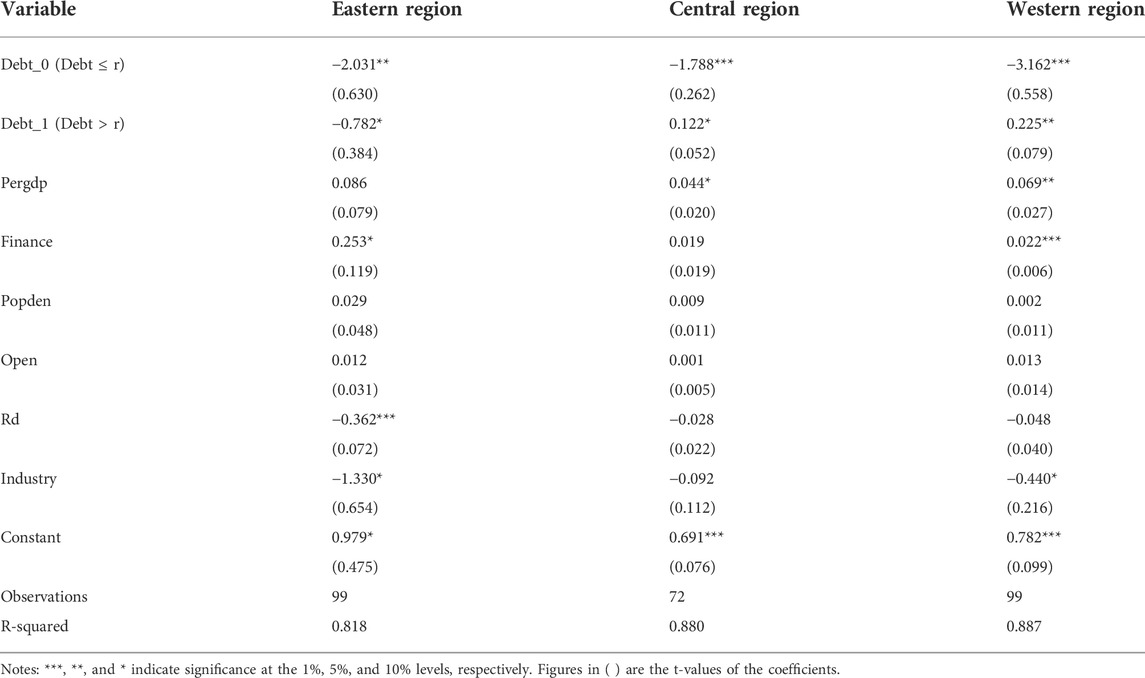
TABLE 10. The estimation results for regional heterogeneity.
6 Conclusions and policy recommendations
Since existing studies have paid little attention to the relationship between local debt and environmental pollution, this work explores this relationship by constructing spatial econometric and threshold panel models. According to the test results, some conclusions are drawn. First, the result of the spatial econometric model proves that the distributions of local government debt and environmental pollution both present obvious spatial correlation. Second, the U-shaped relationship between local government debt and environmental pollution still holds after taking the spatial effect into account. Third, the research of the threshold panel model indicates that the influence of local government debt on environmental pollution exists in the form of a single-threshold effect. When government debt exceeds the threshold, the influence of local government debt on environmental pollution changes from inhibiting to promoting. Further considering regional heterogeneity, it is found that the influence of local government debt on environmental pollution is always restrained in the eastern region, while it shows a U-shaped relationship in the central and western regions.
According to the research conclusions, the following policy recommendations are put forth.
First, the spatial effect shows that both government debt and environmental pollution in each province have a positive spatial correlation. In view of this finding, the government should enhance regional cooperation to regulate the scale of government debt and pollution prevention and control to achieve synergy between the regional ecological environment and government debt and ultimately realize sustainable economic development.
Second, the threshold effect shows that in terms of the ecological environment, the welfare effect of government debt is not a simple result of pros and cons; rather, the key is whether its scale is in a reasonable range. Therefore, all sectors of society should take a dialectical attitude towards the environmental effects of local government debt, make overall plans, and develop classified policies. For those areas in which the debt scale has not yet exceeded the threshold value, the supervision of government debt funds should be strengthened, and the government should be guided to invest funds in areas such as those that improve people’s livelihood and environmental quality so that local governments can maintain the top-by-top competition mode for a long time for the purpose of exerting the pollution control and emission reduction effect of government debt. For areas where the government debt scale exceeds the threshold value, on the one hand, we should guard against the continuous expansion of the debt scale causing regional financial risks and, on the other hand, should strengthen the environmental protection supervision work of the central government and avoid the phenomenon of “exchanging the environment for growth”.
Third, the results of regional heterogeneity show that the government should fully consider regional differences when formulating relevant policies. For the eastern region, debt bearing capacity is strong, while for the central and western provinces, it is weak. Therefore, the relevant departments should formulate multiple debt scales for different regions and avoid conducting a one-size-fits-all approach.
This study performs a preliminary exploration into the influence of local government debt on environmental pollution, but much remains to be known. First, this study adopts macro data at the provincial level, which are admittedly too rough. Because the degrees of economic development, government debt level and environmental pollution in different cities in the same province are obviously heterogeneous, future research can use city-level data to carry out further detailed research. Second, this study explains mainly the influence mechanism of local government debt on environmental pollution at the theoretical level, without quantitative analysis. Thus, future research should comprehensively investigate the influence mechanism of government debt on environmental pollution, supplemented by empirical tests.
Data availability statement
Publicly available datasets were analyzed in this study. This data can be found here: https://data.stats.gov.cn/.
Author contributions
FL: Software, visualization, writing-original draft, conceptualization. JH: Conceptualization, methodology, funding acquisition, supervision. MD: Formal analysis, writing-review and editing, visualization.
Funding
This work was financially supported by the Philosophy and Social Science Research Project of Shanxi Colleges and Universities (2019W159) and the Project of National Social Science Foundation (19BJL016).
Conflict of interest
The authors declare that the research was conducted in the absence of any commercial or financial relationships that could be construed as a potential conflict of interest.
Publisher’s note
All claims expressed in this article are solely those of the authors and do not necessarily represent those of their affiliated organizations, or those of the publisher, the editors and the reviewers. Any product that may be evaluated in this article, or claim that may be made by its manufacturer, is not guaranteed or endorsed by the publisher.
References
Abbasi, F., and Riaz, K. (2016). CO2 emissions and financial development in an emerging economy: An augmented VAR approach. Energy Policy 90, 102–114. doi:10.1016/j.enpol.2015.12.017
Abbasi, K. R., Shahbaz, M., Zhang, J., Irfan, M., and Lv, K. (2022). Analyze the environmental sustainability factors of China: The role of fossil fuel energy and renewable energy. Renew. Energy 187, 390–402. doi:10.1016/j.renene.2022.01.066
An, T., Xu, C., and Liao, X. (2021). The impact of FDI on environmental pollution in China: Evidence from spatial panel data. Environ. Sci. Pollut. Res. 28 (32), 44085–44097. doi:10.1007/s11356-021-13903-9
Arai, R., Naito, K., and Ono, T. (2018). Intergenerational policies, public debt, and economic growth: A politico-economic analysis. J. Public Econ. 166, 39–52. doi:10.1016/j.jpubeco.2018.08.006
Ba, S. (2022). “How to address the gray rhino risk of local government debt,” in The new cycle and new finance in China (Singapore: Springer), 321–324.
Balaguer-Coll, M. T., Prior, D., and Tortosa-Ausina, E. (2016). On the determinants of local government debt: Does one size fit all? Int. Public Manag. J. 19 (4), 513–542. doi:10.1080/10967494.2015.1104403
Baskaran, T. (2012). Soft budget constraints and strategic interactions in subnational borrowing: Evidence from the German States, 1975–2005. J. Urban Econ. 71 (1), 114–127. doi:10.1016/j.jue.2011.07.003
Baum, A., Checherita-Westphal, C., and Rother, P. (2013). Debt and growth: New evidence for the euro area. J. Int. money finance 32, 809–821. doi:10.1016/j.jimonfin.2012.07.004
Borck, R., Fossen, F. M., Freier, R., and Martin, T. (2015). Race to the debt trap?--Spatial econometric evidence on debt in German municipalities. Regional Sci. Urban Econ. 53, 20–37. doi:10.1016/j.regsciurbeco.2015.04.003
Carratù, M., Chiarini, B., D’ Agostino, A., Marzano, E., and Regoli, A. (2019). Air pollution and public finance: Evidence for European countries. J. Econ. Stud. 46, 1398–1417. doi:10.1108/jes-03-2019-0116
Chen, W., Zhu, Y., He, Z., and Yang, Y. (2022). The effect of local government debt on green innovation: Evidence from Chinese listed companies. Pacific-Basin Finance J. 73, 101760. doi:10.1016/j.pacfin.2022.101760
Cochrane, J. H. (2011). Understanding policy in the great recession: Some unpleasant fiscal arithmetic. Eur. Econ. Rev. 55 (1), 2–30. doi:10.1016/j.euroecorev.2010.11.002
Coll, M. T. B., and Toneva, M. I. (2019). The importance of spatial effects in municipal debt: La importancia de los efectos espaciales en la deuda municipal. Rev. Contabilidad-Spanish Accounting Review 22 (1), 61–72. doi:10.6018/rc-sar.22.1.354311
Croce, M. M., Nguyen, T. T., Raymond, S., and Schmid, L. (2019). Government debt and the returns to innovation. J. Financial Econ. 132 (3), 205–225. doi:10.1016/j.jfineco.2018.11.010
Du, M., Hou, Y., Zhou, Q., and Ren, S. (2022a). Going green in China: How does digital finance affect environmental pollution? Mechanism discussion and empirical test. Environ. Sci. Pollut. Res. Int. 8 (1), 222. doi:10.1007/s11356-022-21909-0
Du, M., Zhou, Q., Zhang, Y., and Li, F. (2022b). Towards sustainable development in China: How do green technology innovation and resource misallocation affect carbon emission performance? Front. Psychol. 13, 929125. doi:10.3389/fpsyg.2022.929125
Duan, Y., Mehariya, S., Kumar, A., Singh, E., Yang, J., Kumar, S., et al. (2021). Apple orchard waste recycling and valorization of valuable product-A review. Bioengineered 12 (1), 476–495. doi:10.1080/21655979.2021.1872905
Duan, Y., Pandey, A., Zhang, Z., Awasthi, M. K., Bhatia, S. K., and Taherzadeh, M. J. (2020). Organic solid waste biorefinery: Sustainable strategy for emerging circular bioeconomy in China. Industrial Crops Prod. 153, 112568. doi:10.1016/j.indcrop.2020.112568
Gong, W., and Kong, Y. (2022). Nonlinear influence of Chinese real estate development on environmental pollution: New evidence from spatial econometric model. Int. J. Environ. Res. Public Health 19 (1), 588. doi:10.3390/ijerph19010588
Grossman, G. M., and Krueger, A. B. (1995). Economic growth and the environment. Q. J. Econ. 110 (2), 353–377. doi:10.2307/2118443
Guo, Y., and Xue, J. (2021). Study on nonlinear environmental effects of local government debt. Stat. study 38 (12), 105–117.
Hansen, B. E. (1999). Threshold effects in non-dynamic panels: Estimation, testing, and inference. J. Econ. 93 (2), 345–368. doi:10.1016/s0304-4076(99)00025-1
Hao, Y., Gai, Z., Yan, G., Wu, H., and Irfan, M. (2021). The spatial spillover effect and nonlinear relationship analysis between environmental decentralization, government corruption and air pollution: Evidence from China. Sci. Total Environ. 763, 144183. doi:10.1016/j.scitotenv.2020.144183
Hua, Y., Xie, R., and Su, Y. (2018). Fiscal spending and air pollution in Chinese cities: Identifying composition and technique effects. China Econ. Rev. 47, 156–169. doi:10.1016/j.chieco.2017.09.007
Irfan, M., and Ahmad, M. (2022). Modeling consumers' information acquisition and 5G technology utilization: Is personality relevant? Personality Individ. Differ. 188, 111450. doi:10.1016/j.paid.2021.111450
Jiang, S. S., and Li, J. M. (2021). Do political promotion incentive and fiscal incentive of local governments matter for the marine environmental pollution? Evidence from China’s coastal areas. Mar. Policy 128, 104505. doi:10.1016/j.marpol.2021.104505
Karásek, J., and Pavlica, J. (2016). Green investment scheme: Experience and results in the Czech republic. Energy Policy 90, 121–130. doi:10.1016/j.enpol.2015.12.020
Katircioğlu, S. T., and Taşpinar, N. (2017). Testing the moderating role of financial development in an environmental kuznets curve: Empirical evidence from Turkey. Renew. Sustain. Energy Rev. 68 (1), 572–586. doi:10.1016/j.rser.2016.09.127
Kopczewska, K., Kudła, J., Walczyk, K., Kruszewski, R., and Kocia, A. (2016). Spillover effects of taxes on government debt: A spatial panel approach. Policy Stud. 37 (3), 274–293. doi:10.1080/01442872.2016.1146246
Liu, F., and Liu, C. (2019). Regional disparity, spatial spillover effects of urbanisation and carbon emissions in China. J. Clean. Prod. 241, 118226. doi:10.1016/j.jclepro.2019.118226
Liu, X., Liu, H., and Yang, J. (2022). Would educational inequality aggravate environmental pollution?—evidence from spatial-based panel analysis in China. Front. Environ. Sci. 134. doi:10.3389/fenvs.2022.813254
López, R., Galinato, G. I., and Islam, A. (2011). Fiscal spending and the environment: Theory and empirics. J. Environ. Econ. Manag. 62 (2), 180–198. doi:10.1016/j.jeem.2011.03.001
Ma, R., Li, F., and Du, M. (2022). How does environmental regulation and digital finance affect green technological innovation: Evidence from China. Front. Environ. Sci. 10, 782. doi:10.3389/fenvs.2022.928320
Mao, C. C., and Ma, Z. X. (2021). The analysis of the regional economic growth and the regional financial industry development difference in China based on the theil index. Int. J. Econ. Finance Stud. 13 (1), 128–154.
Pan, F., Zhang, F., Zhu, S., and Wójcik, D. (2017). Developing by borrowing? Inter-jurisdictional competition, land finance and local debt accumulation in China. Urban Stud. 54 (4), 897–916. doi:10.1177/0042098015624838
Pang, R., Zheng, D., Shi, M., and Zhang, X. (2019). Pollute first, control later? Exploring the economic threshold of effective environmental regulation in China's context. J. Environ. Manag. 248, 109275. doi:10.1016/j.jenvman.2019.109275
Qi, Z., Yang, S., Feng, D., and Wang, W. (2022). The impact of local government debt on urban environmental pollution and its mechanism: Evidence from China. Plos one 17 (3), e0263796. doi:10.1371/journal.pone.0263796
Rediske, G., Burin, H. P., Rigo, P. D., Rosa, C. B., Michels, L., and Siluk, J. C. M. (2021). Wind power plant site selection: A systematic review. Renew. Sustain. Energy Rev. 148, 111293. doi:10.1016/j.rser.2021.111293
Reinhart, C. M., and Rogoff, K. S. (2010). Growth in a time of debt. Am. Econ. Rev. 100 (2), 573–578. doi:10.1257/aer.100.2.573
Ren, S., Hao, Y., and Wu, H. (2022a). Digitalization and environment governance: Does internet development reduce environmental pollution? J. Environ. Plan. Manag., 1–30. doi:10.1080/09640568.2022.2033959
Ren, S., Hao, Y., and Wu, H. (2022b). How does green investment affect environmental pollution? Evidence from China. Environ. Resour. Econ. (Dordr). 81 (1), 25–51. doi:10.1007/s10640-021-00615-4
Sachs, J. D., Schmidt-Traub, G., Mazzucato, M., Messner, D., Nakicenovic, N., and Rockström, J. (2019). Six transformations to achieve the sustainable development goals. Nat. Sustain. 2 (9), 805–814. doi:10.1038/s41893-019-0352-9
Shao, S., Li, X., Cao, J. H., and Yang, L. L. (2016). China’s economic policy choices for governing smog pollution based on spatial spillover effects. Econ. Res. J. 9, 73–88.
Shi, Y., and Zhao, A. (2020). The influence of local government debt on regional financial development--research based on panel quantile. J. Zhongnan Univ. Econ. Law 1, 105–113.
Spilioti, S., and Vamvoukas, G. (2015). The impact of government debt on economic growth: An empirical investigation of the Greek market. J. Econ. Asymmetries 12 (1), 34–40. doi:10.1016/j.jeca.2014.10.001
Su, Y., Li, Z., and Yang, C. (2021). Spatial interaction spillover effects between digital financial technology and urban ecological efficiency in China: An empirical study based on spatial simultaneous equations. Int. J. Environ. Res. Public Health 18 (16), 8535. doi:10.3390/ijerph18168535
Swamy, V. (2020). Debt and growth: Decomposing the cause and effect relationship. Int. J. Fin. Econ. 25 (2), 141–156. doi:10.1002/ijfe.1729
Teles, V. K., and Mussolini, C. C. (2014). Public debt and the limits of fiscal policy to increase economic growth. Eur. Econ. Rev. 66, 1–15. doi:10.1016/j.euroecorev.2013.11.003
Wang, B. (2022). Local government debt and private investment--empirical analysis based on the threshold effect and the two-way causality. J. Shanxi Univ. Finance Econ. 44 (06), 42–55.
Wang, F., Wang, R., and He, Z. (2021). The impact of environmental pollution and green finance on the high-quality development of energy based on spatial Dubin model. Resour. Policy 74, 102451. doi:10.1016/j.resourpol.2021.102451
Wang, L., Su, C. W., Ali, S., and Chang, H. L. (2020). How China is fostering sustainable growth: The interplay of green investment and production-based emission. Environ. Sci. Pollut. Res. 27 (31), 39607–39618. doi:10.1007/s11356-020-09933-4
Wang, X., and Zhou, D. (2021). Spatial agglomeration and driving factors of environmental pollution: A spatial analysis. J. Clean. Prod. 279, 123839. doi:10.1016/j.jclepro.2020.123839
Wang, Y., and He, X. (2019). Spatial economic dependency in the Environmental Kuznets Curve of carbon dioxide: The case of China. J. Clean. Prod. 218, 498–510. doi:10.1016/j.jclepro.2019.01.318
Wei, F., and Kong, Y. (2019). A study of the influence of real estate development in China on CO2 emissions. Emerg. Mark. Finance Trade 55 (2), 323–336. doi:10.1080/1540496x.2017.1403316
Winter, C. (2017). The impact of government debt on the long-run natural real interest rate–a quantitative evaluation. Appl. Econ. Lett. 24 (20), 1429–1434. doi:10.1080/13504851.2017.1282137
Woo, J., and Kumar, M. S. (2015). Public debt and growth. Economica 82 (328), 705–739. doi:10.1111/ecca.12138
Wu, H., Hao, Y., and Ren, S. (2020). How do environmental regulation and environmental decentralization affect green total factor energy efficiency: Evidence from China. Energy Econ. 91, 104880. doi:10.1016/j.eneco.2020.104880
Wu, H., Xue, Y., Hao, Y., and Ren, S. (2021). How does internet development affect energy-saving and emission reduction? Evidence from China. Energy Econ. 103, 105577. doi:10.1016/j.eneco.2021.105577
Xiong, L., and Qi, S. (2018). Financial development and carbon emissions in Chinese provinces: A spatial panel data analysis. Singap. Econ. Rev. 63 (02), 447–464. doi:10.1142/s0217590817400203
Xu, J., Li, Y., Feng, D., Wu, Z., and He, Y. (2021). Crowding in or crowding out? How local government debt influences corporate innovation for China. PloS one 16 (11), e0259452. doi:10.1371/journal.pone.0259452
Yang, X., Zhang, J., Ren, S., and Ran, Q. (2021). Can the new energy demonstration city policy reduce environmental pollution? Evidence from a quasi-natural experiment in China. J. Clean. Prod. 287, 125015. doi:10.1016/j.jclepro.2020.125015
Zhang, G., Jia, Y., Su, B., and Xiu, J. (2021). Environmental regulation, economic development and air pollution in the cities of China: Spatial econometric analysis based on policy scoring and satellite data. J. Clean. Prod. 328, 129496. doi:10.1016/j.jclepro.2021.129496
Zhang, M., and Du, M. (2022). Does environmental regulation develop a greener energy efficiency for environmental sustainability in the post-COVID-19 era: Role of technological innovation. Front. Environ. Sci. 10, 978277. doi:10.3389/fenvs.2022.978277
Zhang, Z., and Zhao, W. (2018). Research on financial pressure, poverty governance, and environmental pollution in China. Sustainability 10 (6), 1834. doi:10.3390/su10061834
Zheng, C., Huang, S., and Qian, N. (2021). Analysis of the co-movement between local government debt risk and bank risk in China. Singap. Econ. Rev. 66 (03), 807–835. doi:10.1142/s0217590819500632
Keywords: local government debt, environmental pollution, spatial effect, nonlinear effect, China
Citation: Li F, Huang J and Du M (2022) Spatial and nonlinear effects of local government debt on environmental pollution: Evidence from China. Front. Environ. Sci. 10:1031691. doi: 10.3389/fenvs.2022.1031691
Received: 30 August 2022; Accepted: 20 October 2022;
Published: 03 November 2022.
Edited by:
Khurram Shehzad, Southeast University, ChinaReviewed by:
Mukesh Kumar Awasthi, Northwest A&F University, ChinaXiaodong Yang, Xinjiang University, China
Cunyi Yang, Lingnan College, Sun Yat-sen University, China
Copyright © 2022 Li, Huang and Du. This is an open-access article distributed under the terms of the Creative Commons Attribution License (CC BY). The use, distribution or reproduction in other forums is permitted, provided the original author(s) and the copyright owner(s) are credited and that the original publication in this journal is cited, in accordance with accepted academic practice. No use, distribution or reproduction is permitted which does not comply with these terms.
*Correspondence: Mingyue Du, bWluZ3l1ZTg1ODBAMTYzLmNvbQ==