 Xianbao Shen1,2,3
 Wenhan Yu1
 Zhiliang Yao1,2,3*
 Lei Kong1Bobo Wu1,2,3Kaijie Xuan1Xinyue Cao1,2,3Xin Li1,2,3
 Hanyu Zhang1,2,3Xuewei Hao1,2,3Qi Zhou1,2,3
- 1School of Ecology and Environment, Beijing Technology and Business University, Beijing, China
- 2State Environmental Protection Key Laboratory of Food Chain Pollution Control, Beijing Technology and Business University, Beijing, China
- 3Key Laboratory of Cleaner Production and Integrated Resource Utilization of China National Light Industry, Beijing Technology and Business University, Beijing, China
Emissions of agricultural machines during tillage processes played an important role in severe seasonal pollution events in agricultural areas in China and cannot be ignored. In this study, the CO, NOX, HC and PM2.5 emissions of agricultural machines during real-world tillage processes were tested using a portable emission measurement system (PEMS), and their fuel-based and tillage area-based emission factors were calculated. The CO, NOX, HC and PM2.5 emissions were influenced by emission standards, engine rated power, tillage processes and crops. Only the CO, HC and PM2.5 fuel-based emission factors were reduced from China 0 to China II. For China III agricultural machines, the fuel-based emission factors were higher during plowing and tilling than during harvesting. The tillage area-based CO, NOX, HC and PM2.5 emission factors of corn tillage process were 11.85 ± 8.30, 53.21 ± 48.80, 3.46 ± 3.14 and 1.64 ± 1.33 kg/km2, respectively. The tillage area-based CO, NOX, HC and PM2.5 emission factors of wheat tillage process were 19.69 ± 21.50, 79.98 ± 63.22, 3.90 ± 2.96 and 1.61 ± 2.43 kg/km2, respectively. The tillage area-based emission factors of China III agricultural machines during plowing and tilling were higher than those during harvesting. The fuel consumption per unit tillage area can be used to provide a reference for the interconversion of the two emission factors in future studies. By comparing the fuel-based emission factors in this study with those in the Guidelines and other studies, we observed that the CO, HC and PM2.5 emissions of agricultural machines with corresponding emission standards may be overestimated and the NOX emissions may be underestimated in areas where wheat and corn are mainly grown. Moreover, the pollutant emissions of agricultural machines were regionally different. These results could help elucidate the pollution contribution of agricultural machines in China.
1 Introduction
With the development of agricultural mechanization, agricultural machinery gradually replaced traditional animal and human tillage processes and played an irreplaceable role in crop transportation, planting and harvesting (Ganesh et al., 2019; Hou et al., 2019; Zhang et al., 2020). Agricultural mechanization in China has improved year by year, combined mechanization rates of 97.19% and 89.76% for wheat and corn in 2020, respectively (MOA, 2021; NBSC, 2021). While agricultural machinery has been rapidly developed and popularized, its emissions during tillage processes have played an important role in severe seasonal pollution events in intensive agricultural areas of China (Li et al., 2019; Ning et al., 2020). The emissions of hydrocarbons (HC), nitrogen oxide (NOX) and particulate matter (PM) from agricultural machines in 2021 accounting for 48.0%, 34.9% and 38.8% of non-road mobile source emissions, respectively (MEE, 2021). Although the pollutant emissions from agricultural machines were lower than those from vehicles, they were not evenly distributed throughout the year and could be very large during the tillage season (Zhang et al., 2020), which indicates that the pollutant emissions from agricultural machines cannot be ignored.
In addition, the characteristics of agricultural machines, such as low technology level, long service life, high fuel consumption, low maintenance and high emissions from individual machines, increase the difficulty of regulation (Kean et al., 2000; Wang et al., 2020). The European Union and the United States Environmental Protection Agency have adopted legislation to limit emissions of NOX, carbon monoxide (CO), PM and HC from nonroad mobile sources, including agricultural machinery. The European legislation involved Emission Stages (i.e., I, II, IIIA, IIIB, IV final), and the American legislation involved Tiers (i.e., 1, 2, 3, 4, 5) (Lovarelli and Bacenetti, 2019; Ai et al., 2021). The regulatory system for agricultural machinery in China was adopted late, and the national emission standard for diesel engines of nonroad mobile machinery was established in 2007. The currently implemented emission standard is China III (GB 20891-2014), while China IV will be implemented in December 2022 (MEE, 2014a; Tan et al., 2018). The updating of emission standards has prompted machine manufacturers to continuously improve the waste treatment technology of their machines to meet the limits of increasingly stringent emission standards and curb pollutant emissions at the source (Rhys-Tyler et al., 2011). Shen et al. (2021a) demonstrated that the number of agricultural machines in 2017 was 12, 7 and 13 million units for China 0, China I and China II, respectively. In addition, CO emissions were 532, 47 and 312 Gg, NOX emissions were 859, 74 and 367 Gg, HC emissions were 106, 9 and 64 Gg, and PM2.5 emissions were 92, 7 and 41 Gg for China 0, China I and China II agricultural machines, respectively (Shen et al., 2021a).
In recent years, emission studies of agricultural machinery have focused on testing emission factors and establishing emission inventories. Some studies have tested time-based, fuel-based and power-based emission factors in three modes: idling, moving and working (Fu et al., 2013; Ge et al., 2013; Zavala et al., 2017; Hou et al., 2019). Then, some studies focused on the time-based and fuel-based emission factors of agricultural machines during different tillage processes and works at headlands (Janulevičius et al., 2013; Pang et al., 2020; Wang et al., 2020). In addition, several studies have established agricultural machinery emission inventories at the national, regional and city levels based on fuel consumption by using fuel-based emission factors (Fan et al., 2011; Wang et al., 2016; Huang et al., 2018; Pang et al., 2021). The fuel-based emission factors were acquired using the NONROAD model, the Non-Road Mobile Source Emissions Inventory Compiled Technical Guidelines (MEE, 2014b) or empirical measurements. Moreover, several studies built national-, regional- and city-level emission inventories of agricultural machinery using the power-based emission factors recommended in the Guidelines (MEE, 2014b) or field tests (Lang et al., 2018; Hou et al., 2019; Guo et al., 2020). There is still a very large gap between the current emissions of agricultural machinery inventoried using the above methods and the real-world emissions of in-use agricultural machines.
Zhang et al. (2020) developed an agricultural machinery emission inventory based on the tillage process and crop type using a grid-based methodology in 2015 with power-based emission factors, which were obtained from the Guidelines and emission tests. The results indicated that there were some differences in pollutant emissions from agricultural machinery in different tillage process. Constructing an agricultural machinery emission inventory using a grid-based methodology can effectively reduce the uncertainty related to the real usage rate of machines and the difference in working hours and enable the calculation of emissions that are closer to the emissions during real tillage processes. Fuel-based and tillage area-based emission factors can be applied to establish agricultural machinery emission inventories by using them in combination with fuel consumption and the grid-based methodology, respectively, improving the understanding of agricultural machinery pollutant emissions. Emission inventories built with tillage area-based emission factors have a higher spatial and temporal resolution than those built with fuel-based emission factors. Moreover, both emission factors can be used to explore emission characteristics of agricultural machines. Lovarelli and Bacenetti (2017) conducted a comparative Life cycle assessment of rotary harrowing operations using different data sources, testing the tractor using Controller Area Network-bus, Global Positioning System (GPS) and exhaust gases analyser to obtain the tillage area-based carbon dioxide (CO2), CO and NOX emission factors. However, there are few tillage area-based emission factors obtained through field tests in China.
In this study, we measured the CO, NOX, HC and PM2.5 emissions of 20 agricultural machines used for different tillage processes for planting wheat and corn using a portable emission measurement system (PEMS) in China. Fuel-based and tillage area-based emission factors were calculated to analyze the emission characteristics of agricultural machines. The fuel consumption per unit tillage area that could be used to interconvert the two emission factors were calculated and analyzed. Finally, the fuel-based emission factors were compared with those from the Guidelines and other studies. The results could help elucidate the pollution contribution of agricultural machinery, improve the accuracy of agricultural machinery emission inventories, and develop more effective tailpipe emission control measures to improve air quality.
2 Materials and methods
2.1 Sampling system and methods
A self-developed PEMS was used to evaluate the CO, NOX, HC and PM2.5 emissions of agricultural machines during tillage processes, as shown in Figure 1. The PEMS mainly included four parts: a SEMTECH-LDV (Light-Duty Vehicle, LDV) (Sensors, Ann Arbor, MI, United States), a SEMTECH-EFM (exhaust flow meter, EFM) (Sensors, Ann Arbor, MI, United States), a fine particulate matter (FPM) constant-velocity sampling dilution system (CTM-039, Environmental Supply Company, Durham, North Carolina, United States) and an online particulate matter measurement system. The sampling process of the emission test system was as follows. The exhaust gases emitted from the exhaust tailpipes of agricultural machines were transported into the SEMTECH-EFM duct through a sealed exhaust gas connection pipe. After passing through the EFM pipeline, part of the exhaust gas was expelled into the air, and the other part was divided into two channels for analysis. One channel of exhaust gas entered the SEMTECH-LDV system directly through a heated tube, and then the exhaust gas entered three submodules for measurement and analysis. The HC emission was measured by the SEMTECH-FID (flame ionization detector, FID) submodule. The CO, CO2 and NOX emissions were measured by the SEMTECH-GAS submodule through nondispersive ultraviolet spectroscopy and nondispersive infrared spectroscopy. Eventually, the measurement data from each submodule, combined with the external GPS data, were collected into the SEMTECH-SCS (Sample Conditioning System, SCS) submodule for recording and saving. The collected data were transferred to a laptop terminal through a wireless connection, and the measurement results could be monitored in real time during the experiment.
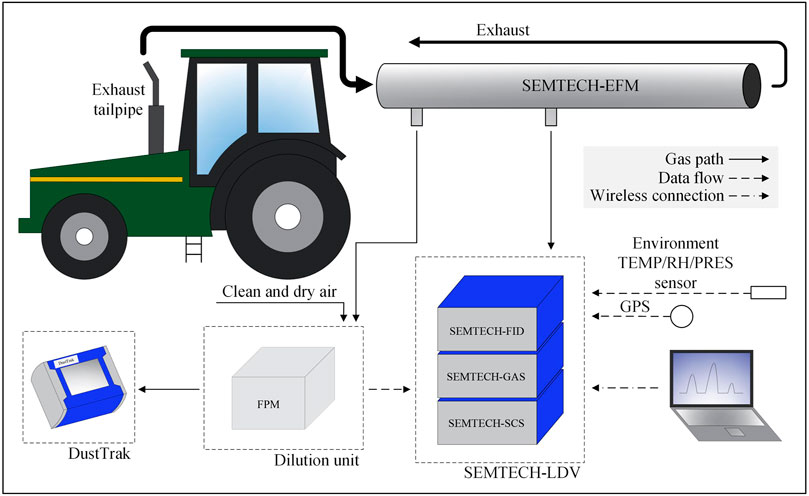
FIGURE 1. Schematic diagram of the portable emission measurement system for sampling CO, NOX, HC and PM2.5 emitted by agricultural machines.
Another channel of exhaust gas entered the FPM dilution system, and the pitot tube measured the exhaust gas flow rate at the EFM outlet and automatically adjusted the voltage of the air pump to control the sampling rate and achieve equal sampling speed. The exhaust gas was diluted with clean and dry air obtained from a high-efficiency particulate air filter and color-changing silica gel after continuous heating of the fume gun and hot box, precluding the problem of water condensation while diluting and causing the dilution ratio to be relatively stable by automatically adjusting the voltage of the air pump. After exhaust gases passed through the FPM dilution system, they were passed through an online particulate matter measurement system in which the DustTrak aerosol monitor (TSI Inc., U.S.A.) measured PM2.5 mass concentrations and recorded data. A gasoline generator set (EF6600, Yamaha Inc., Japan) provided power for the entire test system with a rated power of 5 kW.
There are a series of measures to ensure data quality during the experiment. Firstly, the air line of PEMS was cleaned and confirmed to not be blocked or broken before each experiment. Secondly, the SEMTECH-LDV system and DustTrak aerosol monitor were preheated before the experiment, and the dilution ratio of the FPM dilution system was adjusted to 8-10 for meeting the sampling requirements. Thirdly, the preheated SEMTECH-LDV system was zeroed using nitrogen (N2, 99.9%) and calibrated using standard gases containing CO, CO2, nitric oxide (NO) before the experiment. The DustTrak aerosol monitor using zeroed clean air before the experiment.
The measured experimental data needed to be corrected after the experiment due to the different response times of the SEMTECH-LDV system and the DustTrak aerosol monitor. The instantaneous PM2.5 concentration curves were adjusted to match the trend of the exhaust gas flow curve according to the exhaust gas flow rate and the PM2.5 concentrations during the experiment. The agricultural machines collected two samples during each tillage process except return process for AM07. More details about the PEMS can be found in previous studies (Yao et al., 2011, 2015; Huo et al., 2012; Wu et al., 2015, 2022; Shen et al., 2018, 2021b, 2021c; Yu et al., 2023).
2.2 Typical agricultural machines and operating modes
Based on the field research results regarding the agricultural activities, large tillage area of wheat and corn in Jining and large number of agricultural machines used, this study investigated the CO, NOX, HC and PM2.5 emission factors of agricultural machines used during wheat and corn tillage processes. To ensure the relevance of the experiments, the agricultural machines selected for the experiments were, as far as possible, the types of agricultural machines used in actual tillage processes and the establishment of emission standards. Twenty agricultural machines, including 14 tractors and 6 combine harvesters, used in the plowing, tilling, sowing, pesticide spraying, harvesting and return processes of planting wheat and corn were selected for testing. The plowing, tilling and harvesting processes of agricultural machines with China I emission standards have almost all been scrapped and are rarely used in actual tillage processes, so they were not selected for this study. The sowing process has fewer requirements regarding the use of agricultural machines, and most farmers still choose China 0 agricultural machines for sowing, so China 0 agricultural machines were selected in this study for sowing. Detailed information on the agricultural machines tested is shown in Table 1. The testing agricultural machines were rented from private owners or large agricultural machine service centers and tested during real-world tillage processes. The tested agricultural machineries were common and widely used. None of these machines were equipped with exhaust gas treatment, and each used diesel fuel, which is the main fuel of agricultural machines (MEE, 2021).
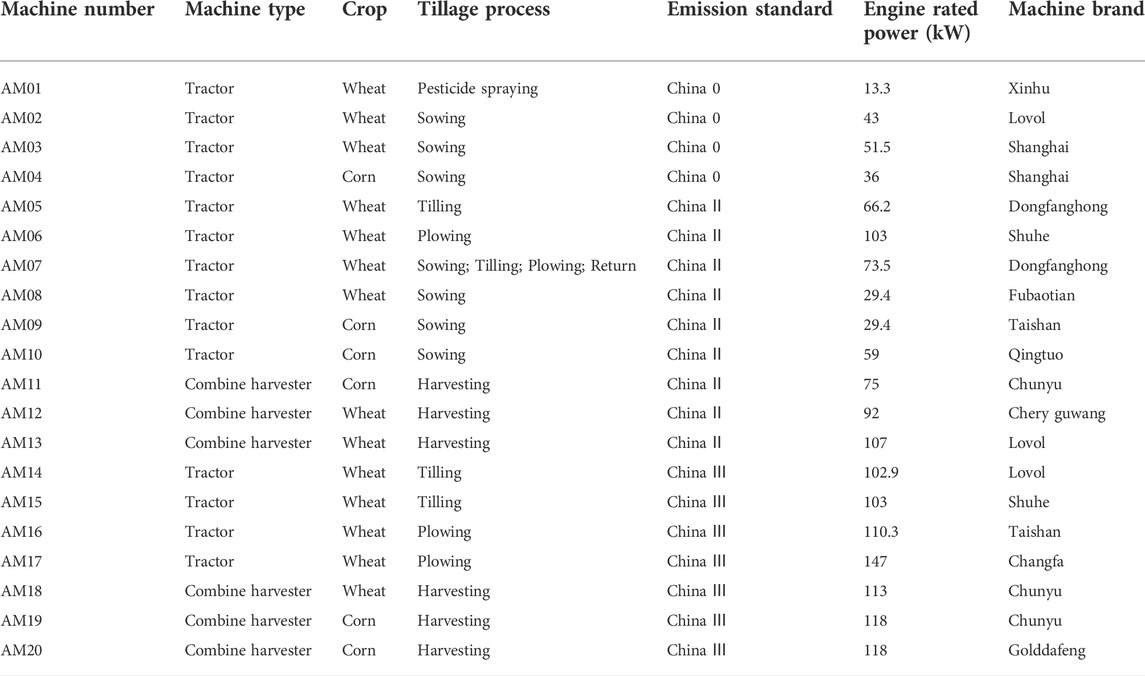
TABLE 1. Detailed information on the agricultural machines tested in this study.
The experimental site was selected in Jining City, Shandong Province, China. This area has a large tillage area, mainly for planting wheat and corn. During the experiment, all the PEMS instruments were placed on a platform, the SEMTECH-LDV system and DustTrak aerosol monitor continuously recorded the experimental data, and the measurement results were monitored in real time. The agricultural machines were tested in August and September 2020 when they were used in tillage processes.
2.3 CO, NOX, HC and PM2.5 emission factor calculations
The fuel-based CO, NOX, HC and PM2.5 emission factors have units of g/(kg-fuel) and were calculated according to Eq. 1:
where EFia is the fuel-based emission factor of pollutant i, g/(kg-fuel); Mi is the total discharged mass of pollutant i, g; Mf is the fuel consumption quality during the driving time, kg; Ci is the instantaneous concentration of pollutant i in the exhaust gas during the tillage process, g/m3; V is the instantaneous exhaust gas flow rate during the tillage process, m3/h; t is the time from the beginning to end of the sampling, h; and R is the fuel consumption rate during the tillage process, kg/h.
The tillage area-based CO, NOX, HC and PM2.5 emission factors of agricultural machines were calculated according to Eq. 2:
where EFib is the tillage area-based emission factor of pollutant i, kg/km2; Mi is the total discharged mass of pollutant i, g; and S is the tillage area, km2. All other parameters are consistent with those in Eq. 1.
2.4 Fuel consumption per unit tillage area calculation
The fuel consumption per unit tillage area was calculated according to Eq. 3:
where F is the fuel consumption per unit tillage area of pollutant i, (kg-fuel)/km2; EFib is the tillage area-based emission factor of pollutant i, kg/km2; EFia is the fuel-based emission factor of pollutant i, g/(kg-fuel).
2.5 Calculation of uncertainty analysis
The 95% confidence interval (CI) was calculated using Eq. 4, and the coefficient of variation (CV) was calculated using Eq. 5 (Wang et al., 2016):
where CIX is the confidence interval of emission factor x, CVX is the coefficient of variation of emission factor x, μx is the arithmetic average of emission factor x, σx is the standard deviation of emission factor x, and n is the number of emission factor x.
3 Results and discussion
3.1 Influencing factors of fuel-based CO, NOX, HC and PM2.5 emission factors
3.1.1 Emission standard and engine rated power
The continuous updating of emission standards for agricultural machines has obvious effects on pollutant emission control. Except for the fuel-based NOX emission factors, the fuel-based CO, HC and PM2.5 emission factors decreased with increasing emission standards, shown in Figure 2.
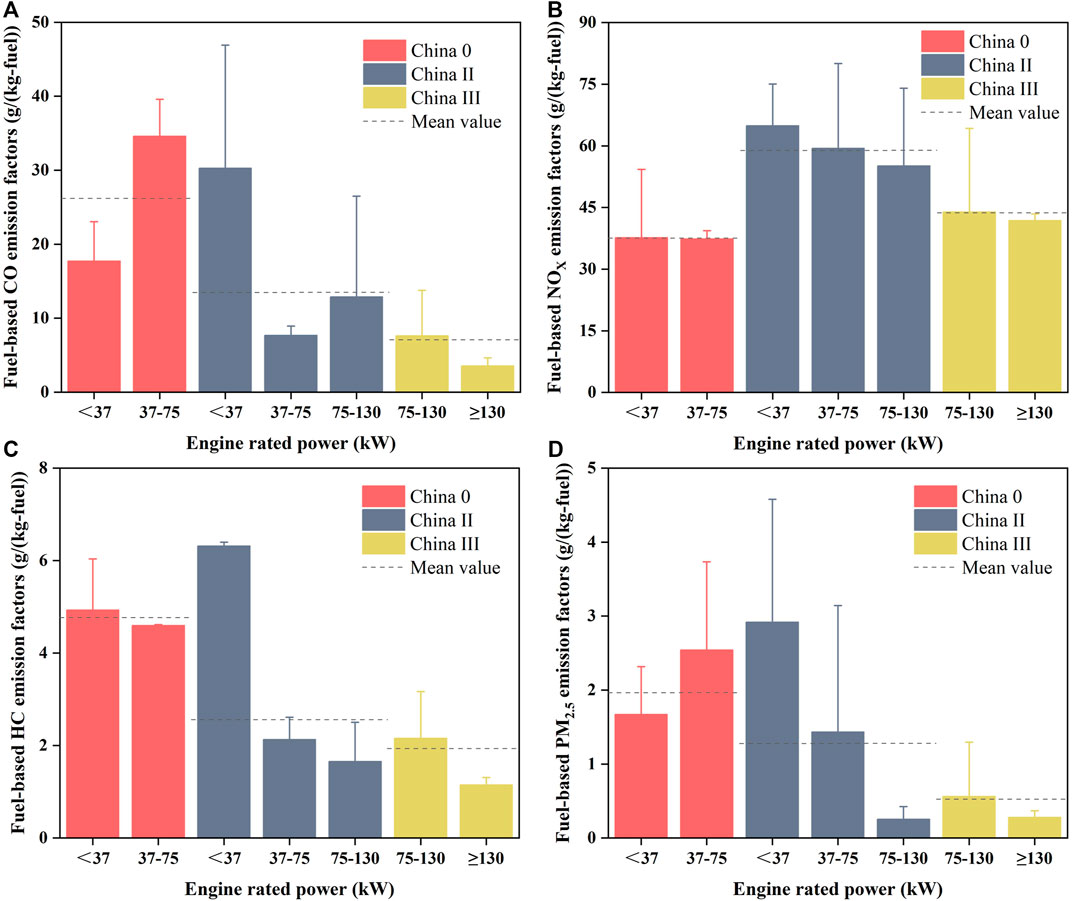
FIGURE 2. Fuel-based (A) CO, (B) NOX, (C) HC and (D) PM2.5 emission factors of agricultural machines under different emission standards and engine rated powers.
Compared with those of the China 0 agricultural machines, the fuel-based CO, HC and PM2.5 emission factors of the China II agricultural machines decreased by 48.67%, 46.34% and 34.62%, respectively. This was related to the use of pressurized intercooling systems in China II agricultural machines, which led to more uniform combustion in the engine cylinders and reduced pollutant emissions (Zhang et al., 2016). The fuel-based CO, HC and PM2.5 emission factors were reduced by 47.30%, 24.31% and 59.30% from China II to China III agricultural machines, respectively. This was because China III agricultural machines use exhaust gas recirculation or electronically controlled common rail systems based on pressurized intercooling systems (Tan et al., 2018). However, the fuel-based NOX emission factors were different. From China 0 to China II agricultural machines, the fuel-based NOX emission factors increased by 56.99%, which could be caused by an increase in NOX generation due to the increased maximum combustion temperature in the cylinder as a result of pressurization (Zamboni et al., 2016). The method of pressurization plus intercooling is usually used to reduce the inlet air temperature to reduce NOX emissions (Tan et al., 2018), but in this study, the intercooling method was not effective in reducing the NOX generated due to pressurization. From China II to China III agricultural machines, the fuel-based NOX emission factors were reduced by 25.87%. However, China 0 agricultural machines had the lowest fuel-based NOX emission factors. It may be because of the long service time, poor maintenance conditions and low cylinder temperature of China 0 agricultural machines, which eventually leads to less NOX generation. Furthermore, the phenomenon that NOX emissions increased with the tightening of emission standards was also observed for diesel vehicles (Huo et al., 2012; Shen et al., 2015).
In this study, agricultural machines were classified into four categories based on engine rated power (<37 kW, 37–75 kW, 75–130 kW and ≥130 kW), according to the Guidelines (MEE, 2014b). Figure 2A indicates that for China 0 agricultural machines, the fuel-based CO emission factors increased by 48.75% from <37 kW to 37–75 kW. For China II agricultural machines, the fuel-based CO emission factors decreased by 74.63% from <37 kW to 37–75 kW and increased by 67.83% from 37-75 kW to 75–130 kW. For China III agricultural machines, the fuel-based CO emission factors decreased by 53.31% from 75–130 kW to ≥130 kW. Figures 2B,C illustrate that the fuel-based NOX and HC emission factors for agricultural machines decreased with increasing engine rated power under these three emission standards. Figure 2D demonstrates that for China 0 agricultural machines, the fuel-based PM2.5 emission factors were highest in the 37–75 kW engine rated power range, and for China II and China III agricultural machines, the fuel-based PM2.5 emission factors declined with increasing engine rated power.
In general, a lower engine rated power leads to lower power output and lower fuel combustion efficiency (Luján et al., 2018). This causes the CO, HC and PM2.5 emissions as incomplete combustion products to vary with the engine rated power. Variations in NOX emissions as the complete combustion products of diesel engines are mainly influenced by changes in engine temperature (Lee et al., 2013; Reşitoğlu et al., 2014; Tan et al., 2018). When the engine rated power increased, the agricultural machine load and combustion temperature decreased; thus, NOX emissions decreased. Under the premise of meeting the requirements of the tillage process, agricultural machines with higher powers should be chosen, which can not only improve tillage efficiency but also reduce pollutant emission.
3.1.2 Tillage processes and crops
The fuel-based CO, NOX, HC and PM2.5 emission factors were compared and analyzed under different tillage processes (Figure 3). For China 0 agricultural machines, the fuel-based CO and PM2.5 emission factors were 1.23 and 1.35 times higher during sowing process than pesticide spraying process, respectively. In contrast, the fuel-based NOX emission factors were 0.63 times lower during sowing process than during pesticide spraying process. This may be because pesticide spraying is usually performed manually or by using small tractors with low fuel consumption and low power output. For China II agricultural machines, the highest fuel-based CO, HC and PM2.5 emission factors were observed during the sowing process. During the sowing process, the agricultural machines hung the seeder and moved slowly in the field, which suggests less resistance and incomplete fuel combustion, leading to higher fuel-based CO, HC and PM2.5 emission factors. The highest fuel-based NOX emission factors were observed during the plowing process. During the plowing process, the agricultural machine engines must provide power not only for movement but also for the rotary plow, and the engines are usually under high load conditions. These high load conditions decreased the average air–fuel ratio of the combustible mixture and increased the combustion pressure and temperature, so the NOX generation rate increased (Fu et al., 2013; Zamboni et al., 2016). For China III agricultural machines, the highest fuel-based CO, NOX and PM2.5 emission factors were observed during the plowing process. And the highest fuel-based HC emission factors were observed during the tilling process. The differences that occurred between the plowing and tilling tractors may be due to differences in the resistances of the two processes.
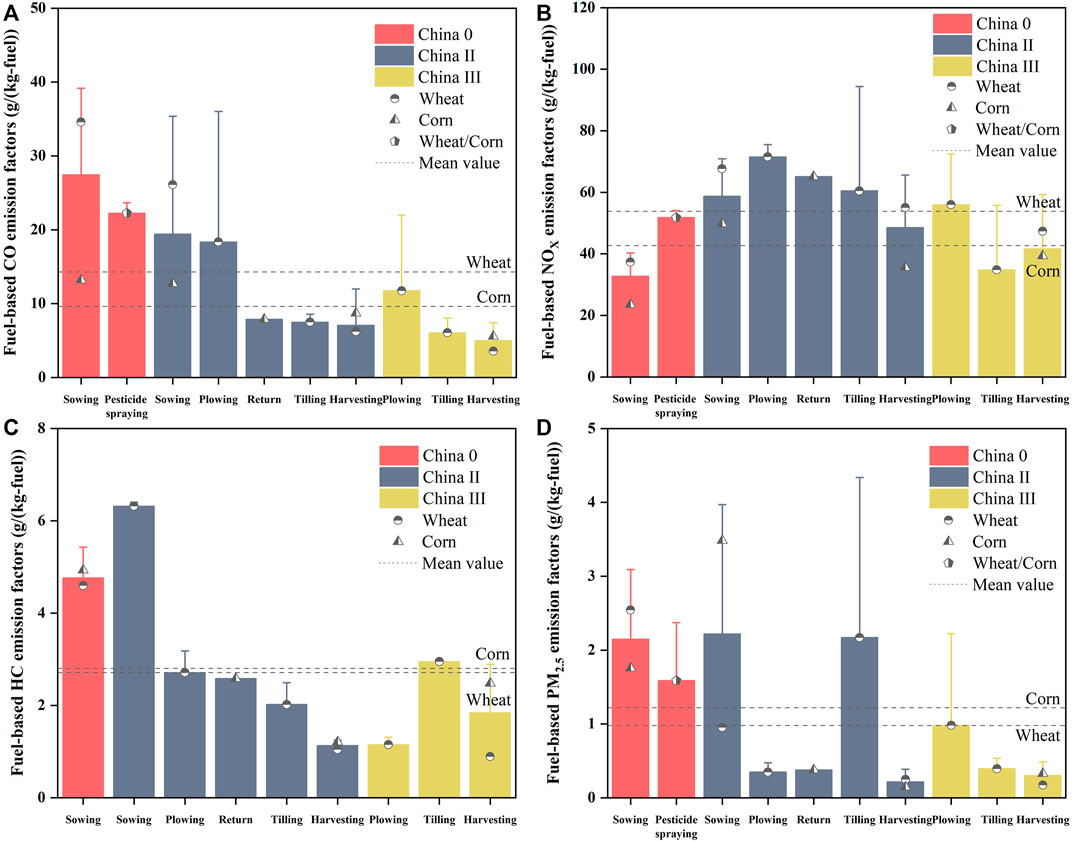
FIGURE 3. Fuel-based (A) CO, (B) NOX, (C) HC and (D) PM2.5 emission factors of agricultural machines under different tillage processes of different crops.
Furthermore, due to the influences of factors such as crop maturity, planting conditions and production conditions, there are significant differences in the pollutant emissions of agricultural machines during the tillage processes of different crops (Kong, 2021). As showcased in Figure 3, the fuel-based CO and NOX emission factors were 1.48 and 1.26 times higher during wheat tillage than corn tillage, respectively. And the fuel-based HC and PM2.5 emission factors were slightly lower during wheat tillage than during corn tillage. Generally, corn tillage rarely involves plowing and tilling processes, which are only done once a year after the corn harvesting and before the wheat sowing (Kong, 2021). The higher pollutant emissions from these processes caused the higher pollutant emissions from wheat tillage than from corn tillage. The difference of HC and PM2.5 emissions in this study may be due to the difference of emissions between the two crops during sowing and harvesting. For China II agricultural machines during sowing process, the fuel-based PM2.5 emission factors were 3.65 times higher for corn than those for wheat, which may be due to the lower engine rated power of agricultural machines used for corn than for wheat. And for agricultural machines during harvesting, fuel consumption was higher for corn harvesting than for wheat harvesting, which resulted higher emissions of CO, HC and PM2.5 as incomplete combustion products for corn than for wheat. Among them, the fuel-based HC emission factors for the corn harvesting process of China III agricultural machines were 2.78 times higher than those of wheat.
3.2 Tillage area-based CO, NOX, HC and PM2.5 emission factors
The tillage area-based emission factors were calculated for the plowing, tilling, sowing and harvesting processes of wheat and corn according to the methods described in Section 2.3. The results are shown in Table 2. The tillage area-based CO, NOX, HC and PM2.5 emission factors for the corn tillage process were 11.85 ± 8.30, 53.21 ± 48.80, 3.46 ± 3.14 and 1.64 ± 1.33 kg/km2, respectively. The tillage area-based CO, NOX, HC and PM2.5 emission factors for the wheat tillage process were 19.69 ± 21.50, 79.98 ± 63.22, 3.90 ± 2.96 and 1.61 ± 2.43 kg/km2, respectively. Except for the tillage area-based PM2.5 emission factors, the tillage area-based CO, NOX and HC emission factors for the wheat tillage process were higher than those for the corn tillage process.
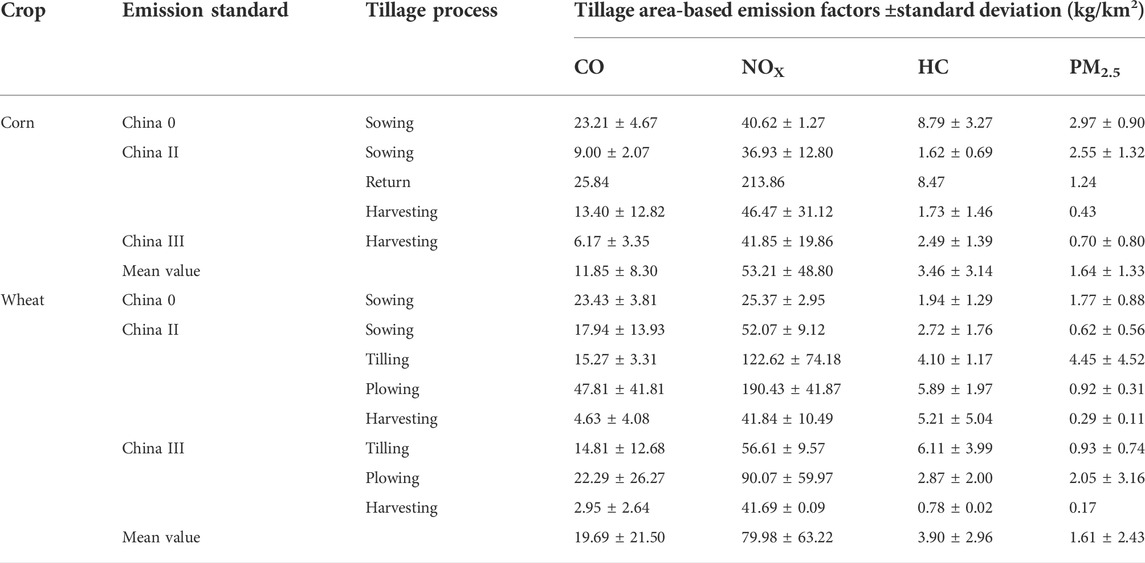
TABLE 2. Tillage area-based CO, NOX, HC and PM2.5 emission factors for different wheat and corn tillage processes.
Figure 4 illustrate the tillage area-based PM2.5, CO, HC and NOX emission factors of China II and China III agricultural machines during different tillage processes. For China II agricultural machines, the highest tillage area-based PM2.5 emission factors were observed during tilling process with 4.45 ± 4.52 kg/km2, and the highest tillage area-based HC, CO and NOX emission factors were observed during plowing process with 5.89 ± 1.97, 47.81 ± 41.81 and 190.43 ± 41.87 kg/km2, respectively. For China III agricultural machines, the tillage area-based PM2.5, CO and NOX emission factors decreased in the order of plowing (2.05 ± 3.16, 22.29 ± 26.27 and 90.07 ± 59.97 kg/km2, respectively), tilling and harvesting, and the tillage area-based HC emission factors decreased in the order of tilling (6.11 ± 3.99 kg/km2), plowing and harvesting. In general, the tillage area-based HC, CO and NOX emission factors of China II agricultural machines during plowing and tilling were higher than those during sowing and harvesting. The tillage area-based PM2.5, HC, CO and NOX emission factors of China III agricultural machines during plowing and tilling were higher than those during harvesting. The plowing and tilling processes were performed by large and medium-sized tractor rotary tillers or rotary plows. The operation processes of rotary tiller or rotary plow rotation bring more resistance, and more power needs to be output to complete the operation. The agricultural machines used during the sowing process simply drag the seeder while moving slowly. The harvesting process of the combine harvester’s head rotation also yielded some resistance. Compared with the plowing and tilling processes, the sowing and harvesting processes result in less resistance and fuel consumption. Moreover, combine harvesters were tested for a longer period of time, and the diesel engines were more stable.
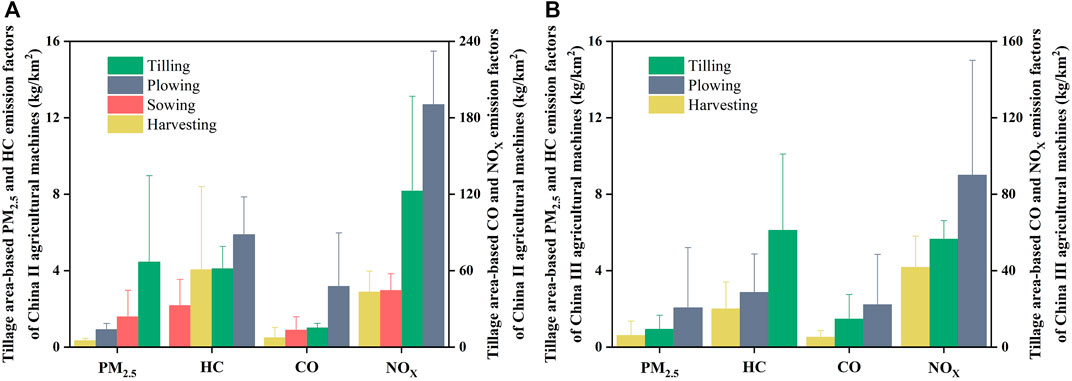
FIGURE 4. Tillage area-based PM2.5, HC, CO and NOX emission factors of (A) China II and (B) China III agricultural machines under different tillage processes.
3.3 Fuel consumption per unit tillage area
We obtained the fuel consumption per unit tillage area by dividing the tillage area-based emission factor by the fuel-based emission factor. The fuel consumption per unit tillage area can be used for the interconversion of the two emission factors and to provide a reference for future agricultural machine emission studies. Figure 5A indicates the fuel consumption per unit tillage area of agricultural machines during different tillage processes with the same engine rated power under two emission standards. The fuel consumption per unit tillage area of China II agricultural machines with engine rated powers of 37–75 kW decreased in the order of plowing, tilling and sowing. The fuel consumption per unit tillage area during plowing was 2.91 times higher than that during harvesting for agricultural machines with engine rated powers of 75–130 kW. For China III agricultural machines with engine rated powers of 75–130 kW, the fuel consumption per unit tillage area decreased in the order of tilling, plowing and harvesting. These results correlated to different resistances during different tillage processes. Figure 5B demonstrates the fuel consumption per unit tillage area of agricultural machines with different engine rated powers during the same tillage process under three emission standards. The fuel consumption per unit tillage area during sowing was 2.59 times higher for China 0 agricultural machines with engine rated powers of <37 kW than for those with engine rated powers of 37–75 kW, which may be due to the aging engines of the older China 0 agricultural machines. For China II agricultural machines, the fuel consumption per unit tillage area increased with increasing engine rated power during the sowing and plowing processes. The fuel consumption per unit tillage area during the plowing process was 1.95 times higher for China III agricultural machines with engine rated powers of 75–130 kW than for those with engine rated powers of ≥130 kW. This may be due to the more complete combustion of diesel fuel when the engine rated power exceeded 130 kW. Thus, the cost effectiveness of using agricultural machines with an engine rated power of 75–130 kW during the plowing process is relatively low. More detailed information on the fuel consumption per unit tillage area is shown in Supplementary Table S1.
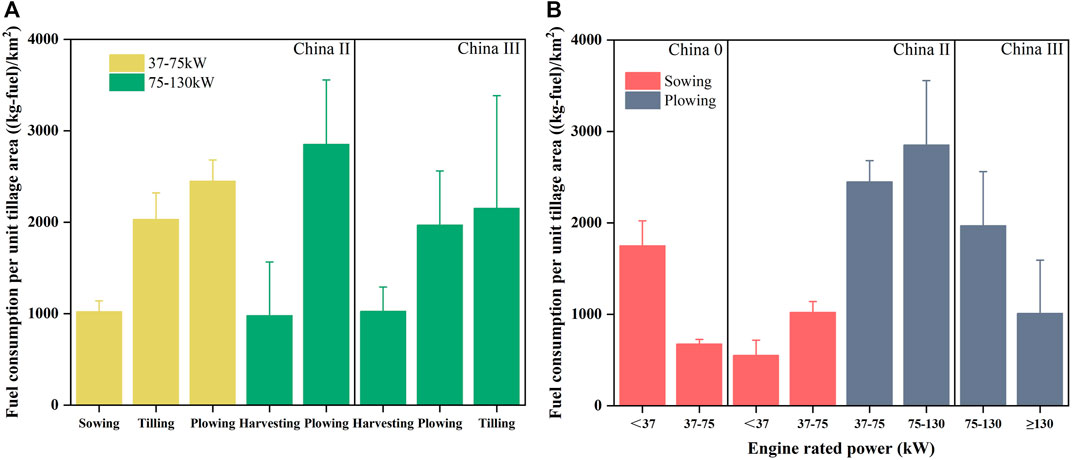
FIGURE 5. Fuel consumption per unit tillage area of agricultural machines under different emission standards, tillage processes and engine rated powers.
A comparison of the fuel consumption per unit tillage area obtained from the field research and the field tests in this study is shown in Figure 6. In general, for agricultural machines with different emission standards and engine rated powers, the results from the field research during corn and wheat planting were higher than those from the field tests. For corn, the fuel consumption per unit tillage area obtained from the field tests during sowing and harvesting was 461.15-1,752.00 and 1,097.30-1,390.29 (kg-fuel)/km2, respectively. The fuel consumption per unit tillage area obtained from the field research during sowing and harvesting was 1.82 and 3.07 times higher than those from the field tests, respectively. For wheat, the fuel consumption per unit tillage area obtained from the field tests during sowing and harvesting was 644.69-928.71 and 774.51-888.87 (kg-fuel)/km2, respectively. The fuel consumption per unit tillage area obtained from the field research during sowing and harvesting was 2.11 and 4.06 times higher than those from the field tests, respectively. In addition, the fuel consumption per unit tillage area obtained from the field research during the plowing and tilling processes was 1.68 times higher than those from the field tests (1,013.00-2,853.52 (kg-fuel)/km2). Compared to that for the sowing, plowing and tilling processes, the difference in fuel consumption per unit tillage area between the field research and field tests was higher for the harvesting process. Farmers in the research area usually hire workers, tractors and combine harvesters to farm their crops, and the fuel consumption per unit tillage area obtained from the field research was extrapolated from the workers’ charges; thus, this could lead to large degrees of uncertainty for the fuel consumption per unit tillage area obtained from the field research. This also indicated that the field test results were representative of the real situation, and it is recommended that the field test results be used as a reference in future studies. If the field test results are not available, the field research results could be corrected using the aforementioned ratio of the field research results to the field test results.
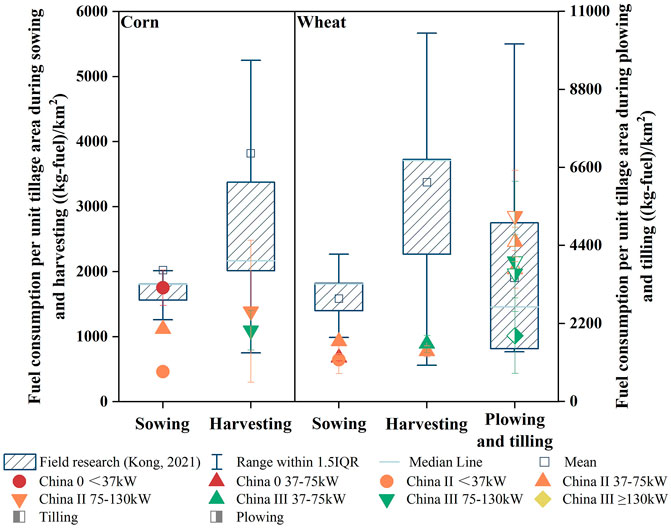
FIGURE 6. Comparison of fuel consumption per unit tillage area obtained from the field research and the field tests.
3.4 Comparison with other research
We compared the fuel-based CO, NOX, HC and PM2.5 emission factors collected under different emission standards and engine rated powers in this study with those from the Guidelines and other research (MEE, 2014b; Pang et al., 2020; Wang et al., 2020), as shown in Figure 7. The fuel-based CO, NOX, HC and PM2.5 emission factors in the Guidelines were determined by PEMS experiments on 37 typical tractors and combine harvesters under real-world operating conditions (MEE, 2014b; Guo et al., 2020). Pang et al. (2020) used a PEMS to measure the fuel-based CO, HC, NO and PM2.5 emission factors of China II tractors during tilling, fertilizing and returning in Sichuan Province, China. Wang et al. (2020) examined the tailpipe emissions of tractors and combine harvesters under real-world working conditions using a PEMS in Beijing, China.
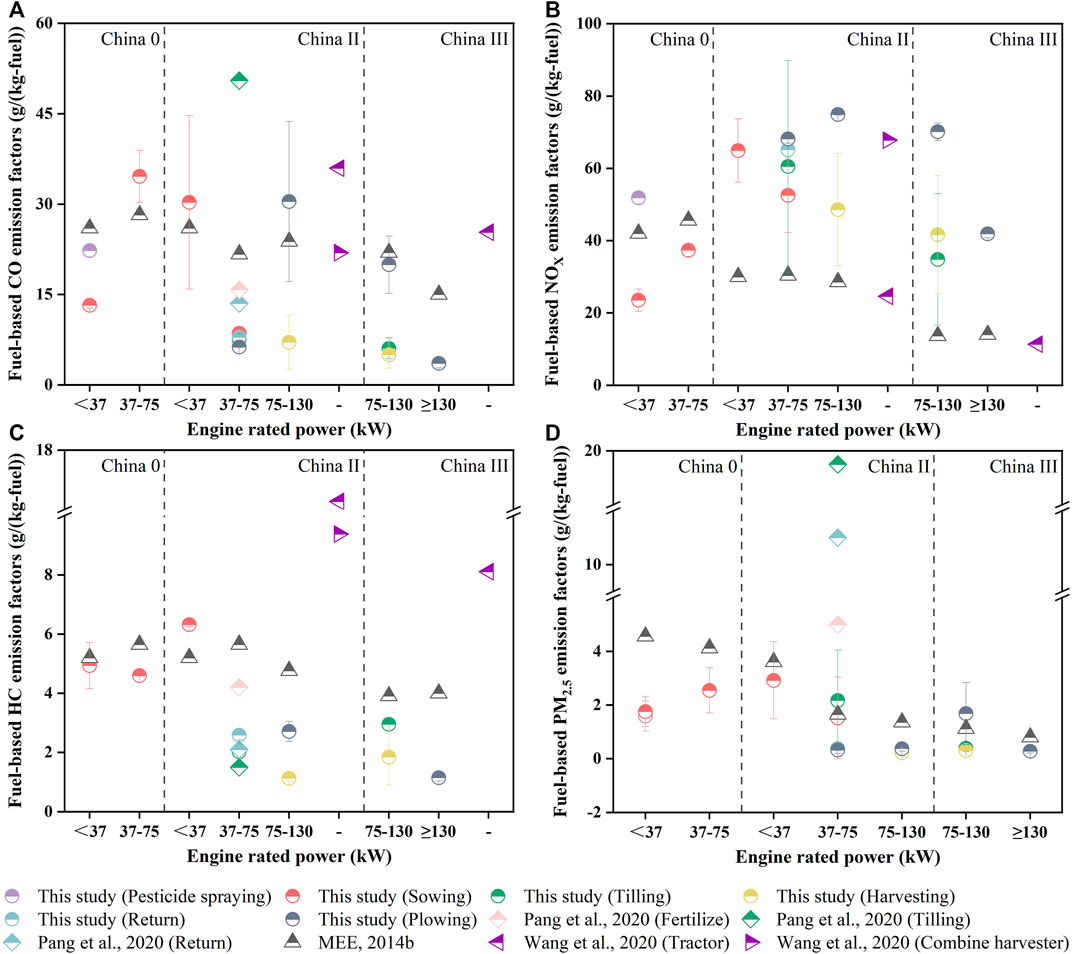
FIGURE 7. A comparison of the fuel-based (A) CO, (B) NOX, (C) HC and (D) PM2.5 emission factors of agricultural machines in this study with those reported in other research.
Figure 7A indicates that the fuel-based CO emission factors of the China 0 and China II agricultural machines in this study were close to those reported in previous research (MEE, 2014b; Pang et al., 2020; Wang et al., 2020). The fuel-based CO emission factors of the China III agricultural machines in this study were lower than those measured by Wang et al. (2020) and the Guidelines (MEE, 2014b). Figure 7B suggests that the fuel-based NOX emission factors of the China 0 agricultural machines in this study were close to those in the Guidelines (MEE, 2014b), the fuel-based NOX emission factors of the China II agricultural machines in this study were close to those of a China II combine harvester measured by Wang et al. (2020) but were higher than those of tractors estimated by Wang et al. (2020) and those in the Guidelines (MEE, 2014b), and the fuel-based NOX emission factors of the China III agricultural machines in this study were higher than those of Wang et al. (2020) and those in the Guidelines (MEE, 2014b). Figure 7C reveals that the fuel-based HC emission factors of the China 0 agricultural machines in this study were close to those in the Guidelines (MEE, 2014b), the fuel-based HC emission factors of the China II agricultural machines in this study were close to those of Pang et al. (2020), and the results of the China II and China III agricultural machines in this study were lower than those in the Guidelines (MEE, 2014b) and those of Wang et al. (2020). Figure 7D demonstrates that the fuel-based PM2.5 emission factors of the China 0 and China II agricultural machines in this study were lower than those in the Guidelines (MEE, 2014b) and those of Pang et al. (2020), respectively, and the fuel-based PM2.5 emission factors of the China II and China III agricultural machines in this study were close to those in the Guidelines (MEE, 2014b).
Currently, most agricultural machinery emission inventories in China are calculated by referring to the emission factors in the Guidelines (MEE, 2014b). This may lead to the overestimation of the CO, HC and PM2.5 emissions of agricultural machines with corresponding emission standards in regions where wheat and corn are mainly planted and the underestimation of the NOX emissions of China II and China III agricultural machines. Additionally, the differences among the results of this study and those of Pang et al. (2020) and Wang et al. (2020) revealed that the pollutant emissions of agricultural machines during tillage processes vary in different regions, and there is a certain uncertainty in using a single emission factor to build agricultural machinery emission inventories. A database of emission factors from agricultural machines in each region based on field tests is needed to reduce the uncertainty of emission inventories.
3.5 Uncertainty analysis
Inevitably, some uncertainties exist in evaluating the CO, NOX, HC and PM2.5 emission factors of agricultural machines. First, the agricultural machines tested were not comprehensive enough. China I emission standard of agricultural machines were applied for a short period, and relatively few agricultural machines were produced during this period. Moreover, almost all China I agricultural machines had been scrapped and rarely used in actual tilling, plowing and harvesting processes through field research (Kong, 2021). Therefore, China I agricultural machines were not tested. Second, the pollutant emissions of agricultural machines during transportation from storage to the workplace were ignored. We calculated 95% confidence intervals for the emission factors of the agricultural machines tested in this study by the method described in Section 2.5, as shown in Tables 3, 4. The coefficients of variation for the fuel-based emission factors and the tillage area-based emission factors were 0.12-1.39 and 0.33-1.13, respectively, which indicated a large uncertainty in the emission factors. More in-depth studies on the CO, NOX, HC and PM2.5 emissions of agricultural machines are still needed.

TABLE 3. 95% confidence intervals for fuel-based CO, NOX, HC and PM2.5 emission factors.
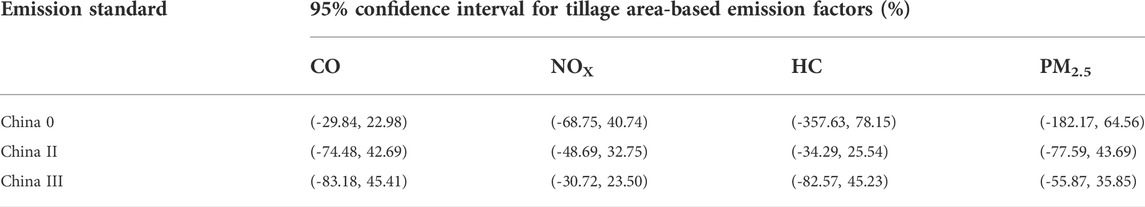
TABLE 4. 95% confidence intervals for tillage area-based CO, NOX, HC and PM2.5 emission factors.
4 Conclusion
With the continuous updating of emission standards for agricultural machines, the fuel-based CO, HC and PM2.5 emission factors have decreased, and the fuel-based NOX emission factors have increased. From China 0 to China II agricultural machines, the fuel-based CO, HC and PM2.5 emission factors decreased by 48.67%, 46.34% and 34.62%, respectively, and the fuel-based NOX emission factors increased by 56.99%. The fuel-based NOX, HC and PM2.5 emission factors of China II and China III agricultural machines decreased with increasing engine rated power. Furthermore, the fuel-based CO, NOX, HC and PM2.5 emission factors were affected by tillage processes and crops. And the highest fuel-based NOX emission factors were observed during the plowing process. Tillage area-based CO, NOX and HC emission factors for the wheat tillage process were 19.69 ± 21.50, 79.98 ± 63.22, 3.90 ± 2.96 kg/km2, respectively, and were higher than for corn tillage. Moreover, for China III agricultural machines, the highest tillage area-based PM2.5, CO and NOX emission factors were observed during plowing with 2.05 ± 3.16, 22.29 ± 26.27 and 90.07 ± 59.97 kg/km2, respectively. The fuel consumption per unit tillage area was higher during plowing and tilling than during sowing and harvesting under the same emission standards and engine rated powers. For China II agricultural machines, the fuel consumption per unit tillage area during sowing and plowing increased with increasing engine rated power. Furthermore, fuel consumption per unit tillage area of agricultural machines obtained from the field research during sowing, harvesting, plowing and tilling was higher than that obtained from the field tests when planting corn and wheat. During harvesting process, the fuel consumption per unit tillage area obtained from the field research for corn and wheat was 3.07 and 4.06 times higher than those from the field tests, respectively.
Additionally, we revealed that the CO, HC and PM2.5 emissions of agricultural machines with corresponding emission standards may be overestimated and the NOX emissions may be underestimated in the regions where mainly wheat and corn are planted. The pollutant emissions of agricultural machines were regionally different during different tillage processes. The uncertainty in the emission factors is mainly due to the lack of comprehensiveness of the agricultural machines tested, the lack of consideration of influences, and the ignoring of the pollutant emissions of agricultural machines during transportation from storage to the workplace. More in-depth research is needed on the CO, NOX, HC and PM2.5 emissions of agricultural machinery.
Data availability statement
The original contributions presented in the study are included in the article/Supplementary Material further inquiries can be directed to the corresponding author.
Author contributions
XS: Conceptualization, Methodology, Writing—Original Draft, Writing—Review and Editing, Visualization, Supervision, Project administration, Funding acquisition. WY: Writing—Original Draft, Writing—Review and Editing, Visualization, Formal analysis, Investigation. ZY: Conceptualization, Methodology, Resources, Supervision, Project administration, Funding acquisition. LK: Writing—original draft, Visualization. BW: Methodology, Resources, Project administration. KX: Resources, Data Curation. XC: Data Curation, Project administration. XL: Writing—Review and Editing, Project administration. HZ: Data Curation. XH: Writing—Review and Editing. QZ: Project administration.
Funding
This work was funded by the Beijing Natural Science Foundation (8222041, JQ19030), and the National Natural Science Foundation of China (41605095, 41775126).
Conflict of interest
The authors declare that the research was conducted in the absence of any commercial or financial relationships that could be construed as a potential conflict of interest.
Publisher’s note
All claims expressed in this article are solely those of the authors and do not necessarily represent those of their affiliated organizations, or those of the publisher, the editors and the reviewers. Any product that may be evaluated in this article, or claim that may be made by its manufacturer, is not guaranteed or endorsed by the publisher.
Supplementary material
The Supplementary Material for this article can be found online at: https://www.frontiersin.org/articles/10.3389/fenvs.2022.1031647/full#supplementary-material
References
Ai, Y., Ge, Y., Ran, Z., Li, X., Xu, Z., Chen, Y., et al. (2021). Quantifying air pollutant emission from agricultural machinery using surveys—a case study in anhui, China. Atmosphere 12 (4), 440. doi:10.3390/atmos12040440
Fan, S., Nie, L., Kan, R., Li, X., and Yang, T. (2011). Fuel consumption based exhaust emissions estimating from agriculture equipment in Beijing. J. Saf. Environ. 11 (01), 145–148.
Fu, M., Ding, Y., Yin, H., Ji, Z., Ge, Y., and Liang, B. (2013). Characteristics of agricultural tractors emissions under real-world operating cycle. Trans. Chin. Soc. Agric. Eng. 29, 42–48.
Ganesh, D., Ayyappan, P. R., and Murugan, R. (2019). Experimental investigation of iso-butanol/diesel reactivity controlled compression ignition combustion in a non-road diesel engine. Appl. Energy 242, 1307–1319. doi:10.1016/j.apenergy.2019.03.166
Ge, Y., Liu, H., Ding, Y., Yin, H., Fu, M., and Li, J. (2013). Experimental study on characteristics of emissions and fuel consumption for combines. Trans. Chin. Soc. Agric. Eng. 29, 41–47.
Guo, X., Wu, H., Chen, D., Ye, Z., Shen, Y., Liu, J., et al. (2020). Estimation and prediction of pollutant emissions from agricultural and construction diesel machinery in the Beijing-Tianjin-Hebei (BTH) region, China☆. Environ. Pollut. 260, 113973. doi:10.1016/j.envpol.2020.113973
Hou, X., Tian, J., Song, C., Wang, J., Zhao, J., and Zhang, X. (2019). Emission inventory research of typical agricultural machinery in Beijing, China. Atmos. Environ. X. 216, 116903. doi:10.1016/j.atmosenv.2019.116903
Huang, C., An, J., and Lu, J. (2018). Emission inventory and prediction of non-road machineries in the yangtze river delta region, China. Environ. Sci. 39, 3965–3975. doi:10.13227/j.hjkx.201802082
Huo, H., Yao, Z., Zhang, Y., Shen, X., Zhang, Q., and He, K. (2012). On-board measurements of emissions from diesel trucks in five cities in China. Atmos. Environ. X. 54, 159–167. doi:10.1016/j.atmosenv.2012.01.068
Janulevičius, A., Juostas, A., and Pupinis, G. (2013). Tractor’s engine performance and emission characteristics in the process of ploughing. Energy Convers. Manag. 75, 498–508. doi:10.1016/j.enconman.2013.06.052
Kean, A. J., Sawyer, R. F., and Harley, R. A. (2000). A fuel-based assessment of off-road diesel engine emissions. J. Air Waste Manag. Assoc. 50 (11), 1929–1939. doi:10.1080/10473289.2000.10464233
Kong, L. (2021). Research on high resolution emission inventory of agricultural machinery based on farming process. master’s thesis. China, Beijing: Beijing Technology and Business University.
Lang, J., Tian, J., Zhou, Y., Li, K., Chen, D., Huang, Q., et al. (2018). A high temporal-spatial resolution air pollutant emission inventory for agricultural machinery in China. J. Clean. Prod. 183, 1110–1121. doi:10.1016/j.jclepro.2018.02.120
Lee, T., Park, J., Kwon, S., Lee, J., and Kim, J. (2013). Variability in operation-based NO(x) emission factors with different test routes, and its effects on the real-driving emissions of light diesel vehicles. Sci. Total Environ. 461-462, 377–385. doi:10.1016/j.scitotenv.2013.05.015
Li, R., Chen, W., Xiu, A., Zhao, H., Zhang, X., Zhang, S., et al. (2019). A comprehensive inventory of agricultural atmospheric particulate matters (PM10 and PM2.5) and gaseous pollutants (VOCs, SO2, NH3, CO, NOX and HC) emissions in China. Ecol. Indic. 107, 105609. doi:10.1016/j.ecolind.2019.105609
Lovarelli, D., and Bacenetti, J. (2017). Bridging the gap between reliable data collection and the environmental impact for mechanised field operations. Biosyst. Eng. 160, 109–123. doi:10.1016/j.biosystemseng.2017.06.002
Lovarelli, D., and Bacenetti, J. (2019). Exhaust gases emissions from agricultural tractors: State of the art and future perspectives for machinery operators. Biosyst. Eng. 186, 204–213. doi:10.1016/j.biosystemseng.2019.07.011
Luján, J. M., Bermúdez, V., Dolz, V., and Monsalve-Serrano, J. (2018). An assessment of the real-world driving gaseous emissions from a Euro 6 light-duty diesel vehicle using a portable emissions measurement system (PEMS). Atmos. Environ. X. 174, 112–121. doi:10.1016/j.atmosenv.2017.11.056
MEE (Ministry of Ecology and Environment of the People’s Republic of China) (2021). China mobile source environmental management annual report. Available at: https://www.mee.gov.cn/hjzl/sthjzk/ydyhjgl/202109/t20210910_920787.shtml (Accessed March 4, 2022).
MEE (Ministry of Ecology and Environment of the People’s Republic of China) (2014a). Limits and measurement methods for exhaust pollutants from diesel engines of non-road mobile machinery (China III, IV). Available at: http://www.mee.gov.cn/ywgz/fgbz/bz/bzwb/dqhjbh/dqydywrwpfbz/201405/t20140530_276305.shtml (Accessed Sep 26, 2022).
MEE (Ministry of Ecology and Environment of the People’s Republic of China) (2014b). Non-road mobile source emissions inventory compiled technical Guidelines. Available at: http://www.mee.gov.cn/gkml/hbb/bgg/201501/W020150107594587960717.pdf (Accessed March 4, 2022).
MOA (Ministry of Agriculture and Rural Affairs of the People’s Republic of China) (2021). National agricultural mechanization development statistical bulletin in 2020. Available at: http://www.njhs.moa.gov.cn/nyjxhqk/202109/t20210908_6376013.htm (Accessed March 4, 2022).
NBSC (National Bureau of Statistics of China) (2021). China statistical yearbook. Beijing: China Statistics Press.
Ning, L., Duan, Q., Chen, Z., Kou, H., Liu, B., Yang, B., et al. (2020). A comparative study on the combustion and emissions of a non-road common rail diesel engine fueled with primary alcohol fuels (methanol, ethanol, and n-butanol)/diesel dual fuel. Fuel 266, 117034. doi:10.1016/j.fuel.2020.117034
Pang, K., Zhang, K., Ma, S., and Wang, F. (2021). Spatiotemporal distribution of activity and its emissions for agricultural equipment in China. Acta Sci. Circumst. 41 (10), 4268–4279.
Pang, K., Zhang, K., Wang, F., and Ma, S. (2020). Characterization of tailpipe emissions from in-use agricultural tractors. J. Chin. Agric. Mech. 41, 158–167.
Reşitoğlu, İ. A., Altinişik, K., and Keskin, A. (2014). The pollutant emissions from diesel-engine vehicles and exhaust aftertreatment systems. Clean. Technol. Environ. Policy 17 (1), 15–27. doi:10.1007/s10098-014-0793-9
Rhys-Tyler, G. A., Legassick, W., and Bell, M. C. (2011). The significance of vehicle emissions standards for levels of exhaust pollution from light vehicles in an urban area. Atmos. Environ. X. 45 (19), 3286–3293. doi:10.1016/j.atmosenv.2011.03.035
Shen, X., Kong, L., Shi, Y., Cao, X., Li, X., Wu, B., et al. (2021a). Multi-type Air pollutant emission inventory of non-road mobile sources in China for the period 1990-2017. Aerosol Air Qual. Res. 21 (9), 210003. doi:10.4209/aaqr.210003
Shen, X., Lv, T., Zhang, X., Cao, X., Li, X., Wu, B., et al. (2021b). Real-world emission characteristics of black carbon emitted by on-road China IV and China V diesel trucks. Sci. Total Environ. 799, 149435. doi:10.1016/j.scitotenv.2021.149435
Shen, X., Shi, J., Cao, X., Zhang, X., Zhang, W., Wu, H., et al. (2018). Real-world exhaust emissions and fuel consumption for diesel vehicles fueled by waste cooking oil biodiesel blends. Atmos. Environ. X. 191, 249–257. doi:10.1016/j.atmosenv.2018.08.004
Shen, X., Shi, Y., Kong, L., Cao, X., Li, X., Wu, B., et al. (2021c). Particle number emissions from light-duty gasoline vehicles in Beijing, China. Sci. Total Environ. 773, 145663. doi:10.1016/j.scitotenv.2021.145663
Shen, X., Yao, Z., Zhang, Q., Wagner, D. V., Huo, H., Zhang, Y., et al. (2015). Development of database of real-world diesel vehicle emission factors for China. J. Environ. Sci. 31, 209–220. doi:10.1016/j.jes.2014.10.021
Tan, P., Wang, D., Lou, D., and Hu, Z. (2018). Progress of control technologies on exhaust emissions for agricultural machinery. Trans. Chin. Soc. Agric. Eng. 34, 1–14.
Wang, F., Li, Z., Zhang, K., Di, B., and Hu, B. (2016). An overview of non-road equipment emissions in China. Atmos. Environ. X. 132, 283–289. doi:10.1016/j.atmosenv.2016.02.046
Wang, K., Fan, S. B., and Qi, H. Y. (2020). Emission factors and emission inventory of agricultural machinery in beijing under real-world operation. Environ. Sci. 41, 2602–2608. doi:10.13227/j.hjkx.201912005
Wu, B., Shen, X., Cao, X., Zhang, W., Wu, H., and Yao, Z. (2015). Carbonaceous composition of PM2.5 emitted from on-road China III diesel trucks in Beijing, China. Atmos. Environ. X. 116, 216–224. doi:10.1016/j.atmosenv.2015.06.039
Wu, B., Xuan, K., Shen, X., Zhao, Q., Shi, Y., Kong, L., et al. (2022). Non-negligible emissions of black carbon from non-road construction equipment based on real-world measurements in China. Sci. Total Environ. 806, 151300. doi:10.1016/j.scitotenv.2021.151300
Yao, Z., Huo, H., Zhang, Q., Streets, D. G., and He, K. (2011). Gaseous and particulate emissions from rural vehicles in China. Atmos. Environ. X. 45 (18), 3055–3061. doi:10.1016/j.atmosenv.2011.03.012
Yao, Z., Shen, X., Ye, Y., Cao, X., Jiang, X., Zhang, Y., et al. (2015). On-road emission characteristics of VOCs from diesel trucks in Beijing, China. Atmos. Environ. X. 103, 87–93. doi:10.1016/j.atmosenv.2014.12.028
Yu, W., Shen, X., Wu, B., Kong, L., Xuan, K., Zhao, C., et al. (2023). Real-world emission characteristics of carbonyl compounds from agricultural machines based on a portable emission measurement system. J. Environ. Sci. 124, 846–859. doi:10.1016/j.jes.2022.02.031
Zamboni, G., Moggia, S., and Capobianco, M. (2016). Hybrid EGR and turbocharging systems control for low NO and fuel consumption in an automotive diesel engine. Appl. Energy 165, 839–848. doi:10.1016/j.apenergy.2015.12.117
Zavala, M., Huertas, J. I., Prato, D., Jazcilevich, A., Aguilar, A., Balam, M., et al. (2017). Real-world emissions of in-use off-road vehicles in Mexico. J. Air Waste Manag. Assoc. 67 (9), 958–972. doi:10.1080/10962247.2017.1310677
Zhang, J., Liu, L., Zhao, Y., Li, H., Lian, Y., Zhang, Z., et al. (2020). Development of a high-resolution emission inventory of agricultural machinery with a novel methodology: A case study for yangtze river delta region. Environ. Pollut. 266, 115075. doi:10.1016/j.envpol.2020.115075
Keywords: agricultural machines, emission characteristics, tillage process, PEMS, tillage area-based emission factor
Citation: Shen X, Yu W, Yao Z, Kong L, Wu B, Xuan K, Cao X, Li X, Zhang H, Hao X and Zhou Q (2022) Real-world fuel-based and tillage area-based emission factors of agricultural machines during different tillage processes. Front. Environ. Sci. 10:1031647. doi: 10.3389/fenvs.2022.1031647
Received: 30 August 2022; Accepted: 06 October 2022;
Published: 20 October 2022.
Edited by:
Dan Chen, China Meteorological Administration, ChinaReviewed by:
Guohao Li, Beijing Municipal Research Institute of Eco-Environmental Protection, ChinaTong Li, Zhengzhou University, China
Copyright © 2022 Shen, Yu, Yao, Kong, Wu, Xuan, Cao, Li, Zhang, Hao and Zhou. This is an open-access article distributed under the terms of the Creative Commons Attribution License (CC BY). The use, distribution or reproduction in other forums is permitted, provided the original author(s) and the copyright owner(s) are credited and that the original publication in this journal is cited, in accordance with accepted academic practice. No use, distribution or reproduction is permitted which does not comply with these terms.
*Correspondence: Zhiliang Yao, eWFvemhsQHRoLmJ0YnUuZWR1LmNu