 Bingbing Xie
 Chenliang Zhu2,3*
 Liang Zhao
 Jun Zhang
94% of researchers rate our articles as excellent or good
Learn more about the work of our research integrity team to safeguard the quality of each article we publish.
Find out more
ORIGINAL RESEARCH article
Front. Environ. Sci. , 03 November 2022
Sec. Environmental Economics and Management
Volume 10 - 2022 | https://doi.org/10.3389/fenvs.2022.1031095
Knowledge discovery in databases (KDD) has an important effect on various fields with the development of information science. Electricity energy forecasting (EEF), a primary application of KDD, aims to explore the inner potential rule of electrical data for the purpose to serve electricity-related organizations or groups. Meanwhile, the advent of the information society attracts more and more scholars to pay attention to EEF. The existing methods for EEF focus on using high-techs to improve the experimental results but fail to construct an applicable electricity energy KDD framework. To complement the research gap, our study aims to propose a gradient boosting machine-based KDD framework for electricity energy prediction and enrich knowledge discovery applications. To be specific, we draw on the traditional knowledge discovery process and techniques to make the framework reliable and extensible. Additionally, we leverage Gradient Boosting Machine (GBM) to improve the efficiency and accuracy of our approach. We also devise three metrics for the evaluation of the proposed framework including R-square (R2), Mean Absolute Error (MAE), and Mean Absolute Percentage Error (MAPE). Besides, we collect the electricity energy consumption (EEC) as well as meteorological data from 2013 to 2016 in New York state and take the EEC prediction of New York State as an example. Finally, we conduct extensive experiments to verify the superior performance of our framework and the results show that our model achieves outstanding results for the three metrics (around 0.87 for R2, 60.15 for MAE, and 4.79 for MAPE). Compared with real value and the official prediction model, our approach also has a remarkable prediction ability. Therefore, we find that the proposed framework is feasible and reliable for EEF and could provide practical references for other types of energy KDD.
Electricity energy, as one of the necessary energy resources, has an increasing influence on all walks of life in modern society. Hence, electricity energy prediction is essential and significant to humans. Hu (2017) has revealed the rapid increment of the EEC over the past decades and its importance for the world. Specifically, there are around 250,000 TW h per year of electricity produced by all countries worldwide but 44.1% of the total is generated by the 36 main members of the Organization for Economic Cooperation and Development (Statistical Review of World Energy, 2022). This imbalance will lead to the unreasonable distribution of electricity and power shortages in numerous underdeveloped countries. Here is the statistic for worldwide electricity demand from 2015 to 2020. According to Figure 1, the average annual electricity demand growth rate is increasing year by year except for 2019 and 2020 due to COVID-19. This electricity decline in 2019 and 2020 leads to a lower vitality in diverse fields such as the inadequate power supply for industry, lack of lighting for business and education, instability of the government systems, etc. As a result, understanding the potential rules of power generation and consumption, as well as balancing global electricity distribution, is an important challenge that should be solved. EEF, as a kind of knowledge discovery, is a valuable approach to acquire the potential laws of electricity energy data. Besides, EEF has far-reaching policy implications for governments and institutions in the information era like guidelines for electricity-related policy development, business policy guidelines for electricity-related companies, guidance on electricity generation for power generation agencies, etc. When applied to predict electricity generation and consumption, EEF will be beneficial advice to governments and organizations for electricity-related policy-making decisions.
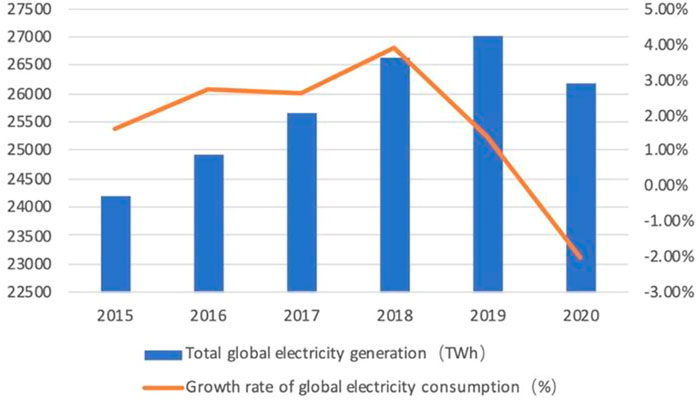
FIGURE 1. Global electricity generation and growth data of electricity consumption from 2015–2020 (Statistical Review of World Energy, 2022).
KDD refers to the non-trivial process of extracting effective, novel, potentially useful, and understandable patterns from a dataset (Fayyad et al., 1996). With the rapid advancement of data science, public interest in KDD is in full swing. Electricity energy knowledge discovery is a process of extracting potentially valuable, novel, and effective knowledge patterns from massive electricity data. Previous studies have shown that there are two main differences between electricity knowledge discovery and general KDD. First, there are large volumes of electricity data with a wide variety and complexity that makes it rather tough to handle. Second, discrete and heterogeneous electricity data is vulnerable to multiple factors like weather, human activities, regions, and so forth (Reddy and Momoh, 2014; Shao et al., 2014; Weron, 2014; Reddy, 2018). However, the rise of machine learning (ML) provides an increasing number of approaches to be employed in electricity KDD such as neural networks (Kaur and Kaur, 2016), ensemble algorithms (Banik et al., 2021), etc. As one of the most important applications of electricity energy knowledge discovery, EEF is attracting wide attention from industry and academia.
EEF methods can be split into two categories, time series analysis and multivariate regression (Wang L et al., 2018). Regarding time-series approaches, a linear time-series prediction system with nonlinear models (Chou and Truong, 2021) and a hybrid model with variational mode decomposition, autoencoder, and long-short term memory (LSTM) (Bedi and Toshniwal, 2020) are proposed for accurate electricity predictions. Additionally, several ensemble models are built for predicting EEC like conditional generative adversarial networks (Zhang and Guo, 2020), and random forests (Alshboul et al., 2022). On the issue of multivariate regression, numerous experts make efforts to achieve excellent performance. For example, some hybrid models have obtained outstanding results like the multiple linear regression (MLR) model with back-propagation neural networks (Li et al., 2017) and the MLR model with neuro-fuzzy models (Samhouri et al., 2009). Meanwhile, there are some algorithms for EEF with cluster analysis, multivariate adaptive regression splines, and conditional inferences trees (Li et al., 2020). Furthermore, Obaidat et al. (2019) discuss the feasibility and efficiency of MLR models for electricity energy forecasting. All of the mentioned methods have leveraged splendid cutting-edge algorithms for EEF and the average results were approximately 85%. However, there is a need to be more excellent methods for large-scale industrial utilization. Therefore, further in-depth research needs to be taken for the accuracy improvement of EEF. For example, more precise feature selection and ensemble algorithms can be employed for electricity prediction since they can fit the power data of different structures and make the model’s generalization ability stronger.
Ensemble algorithms have taken a vital role in the problem of prediction and classification recently. Many of them have been applied in various domains and made significant achievements. For instance, the first team in the Netflix prize competition attempts to apply ensemble methods to predict user ratings and obtain great performance (Koren, 2009). In terms of all ensemble algorithms, the tree-based method is undoubtedly the most successful which uses many simple decision trees to promote the whole model’s accuracy instead of training the “best” model. GBM is one of the most popular tree-based models, which contains multiple gradient boosting (GB) algorithms (Gumaei et al., 2021). Therefore, it can handle diverse variables easily through the augment of multiple base trees. GBM has achieved excellent results in multiple studies due to its advantages such as robustness, reliability, easy implementation, compatibility, etc. For example, GB algorithms are applied in different models for diverse scenarios, such as building energy consumption prediction with 8.06% of MAPE (Lu et al., 2020), electricity demand forecasting with 0.92% of MAPE (Leme et al., 2020), and photovoltaic power prediction with about 14% of MAPE (Wang et al., 2018). The superior performances compared with some other models prove that the GB ensemble predictor can effectively minimize errors in different scenarios.
In this study, we devise a novel electricity energy KDD framework for electricity energy forecasting by combining the traditional KDD process and the advanced ensemble model, GBM. Specifically, we first learn from the traditional knowledge discovery to build the main process of electricity energy KDD. Then, we use GBM as the predictor to mine the potential knowledge from electricity energy due to the vulnerability of electricity data to various elements such as regions, time, and climate (Meng and Niu, 2011). GBM is able to examine the specifics of each variable and parameter in the prediction process by merging many basic tree models, which makes our model more sensitive to time-series data and the various factors of the training procedure. After that, we design three evaluation metrics to prove the efficiency of our approach. To verify the feasibility of our framework, we collect the 2013 to 2016 electricity consumption data and meteorological information from New York state as an example.Then, our framework is employed to mine the latent information for predicting the hourly, daily, and monthly EEC. The experimental results are visualized and a detailed analysis is provided.
The contributions of this study are summarized as follows. First, this study builds a knowledge discovery framework based on GBM by combining meteorological information and energy data to mine the potential rules of electricity data. Meanwhile, this study describes the theoretical applicability of the model to KDD in energy data and discusses the possibility that our framework is applicable for mining knowledge from various energy data. Last, we employ our model to conduct experiments on the collected dataset and compare it with real EEC value and the bidirectional long-short term memory (BiLSTM)-based model of the New York electricity institution, regarding three metrics, i.e., R2, MAE, and MAPE. However, we do not employ our framework for different energy data and will further explore it in the follow-up research.
The parts of this study are presented as follows. The related work is shown in chapter two. The framework construction process and the GBM prediction model are developed in chapter three. The experiments and analysis are provided in chapter four. Finally, the conclusion and discussion are given in chapter five.
Energy is the economic lifeblood of a country (Magazzino et al., 2020). Especially in the era of big data, knowledge discovery is able to find latent rules of energy data to promote economic development of a country. There are a vast number of scholars paying attention to energy-data-driven KDD recently. In order to implement the application of the KDD process for predicting the power demand of a supply fan of an air handling unit, Le Cam et al. (2016) proposed an integrated method of an autoregressive neural network and a physical model to prove that the fan’s actual power consumption is consistent with the prediction. Based on artificial intelligence (AI) techniques, Huang et al. (2019) established a hybrid-driven knowledge discovery platform for grid security feature selection in Guangdong Power Grid. They combine manual rule extraction with AI real-time judgment operation models to update the massive data inside the power grid and effectively discover knowledge. Wang and Zhang (2019) combined cat swarm optimization with a back propagation neural network to estimate short-term power and verify the method’s excellent performance through experiments. Additionally, some research revealed the importance of information, environment, and energy (Magazzino et al., 2021) in the information society. For example, Magazzino and Mele (2022) presented a new D2C algorithm-based knowledge discovery approach to explore the nexus of carbon dioxide emission, energy use, and GDP in Russia.
Nowadays, many scholars are attempting to focus on EEF primarily including short-term forecasting, mid-term forecasting, and long-term forecasting. Multiple algorithms have been utilized commonly in the electricity prediction field in recent years including random forest, convolution neural networks, recurrent neural networks, genetic algorithms, back-propagation neural networks, etc. Kim et al. (2020a) explored the performance of different algorithms in building electrical energy forecasting and showed that artificial neural networks are more exact and trustworthy than linear regression in terms of EEF on working days. Besides, Kim et al. (2020b) worked on another study related to commercial building electricity consumption. They used four back-propagation neural networks to forecast electricity usage in buildings and proved that the algorithms are useful for determining how each input component affects energy consumption. Pinto et al. (2021) utilized three different ensemble algorithms to improve the prediction accuracy of EEF in office buildings and show the Adaboost model exceeds other algorithms for hour-ahead forecasting. Banik et al. (2021) designed an ensemble model of random forest and Xgboost to estimate electricity consumption in Agartala, Tripura of India. The proposed model aimed to precisely forecast the next 24-h, 1-week, and 1-month load, which has been proven by experiments in the study. Kang et al. (2020) built various deep learning (DL) models including recurrent neural networks, convolutional neural networks, and the combination of both algorithms for mining the data supported by Korean power exchange. It is shown convolutional neural networks have the best performance by comparing to the other models. Mukherjee et al. (2021) constructed the delay tolerance network-assisted internet for smart grid communication, as well as various algorithm-ensembled techniques for load prediction, and verified the feasibility of the proposed models by experiments.
In summary, energy-related KDD is one of the global research hotspots currently. With the popularity of AI, KDD has a wide range of applications including movie box office forecasting, highway traffic prediction, the prediction of aircraft flight delays, traffic accidents forecasting, solar radiation forecasting, electricity consumption forecasting, etc. Regarding energy-related KDD, most researchers tried to use the newest ML and DL algorithms to discover the knowledge from extensive energy data but fail to build a framework applicable to different genres of energy data. Meanwhile, there are relatively few studies applying GBM to energy knowledge discovery. In order to explore the feasibility and scalability of GBM in mining energy data, this study proposes a KDD process based on GBM and takes EEF for example to demonstrate the adaptability, scalability, and accuracy of the proposed KDD process.
GBM is a group of valuable and significant machine learning algorithms that integrate several base predictors into a strong predictor with outstanding effectiveness and achieves excellent performance in multiple prediction missions including anomaly detection, event mining, energy consumption forecasting, etc. (Lu and Mazumder, 2020) It is routinely considered as a kind of the top efficient algorithms in the competitions of Kaggle and KDD Cup (Chen and Guestrin, 2016). At the same time, GBM is capable of reducing the noise of missing data, highly correlated data, and other heterogeneous datasets. Besides, it can organically optimize an explainable model by aggregating weak learners for the whole frame (Friedman, 2001). GBM is also available in a wide range of existing machine learning and deep learning libraries such as Scikit-Learn, TensorFlow, Light GBM, etc., and can easily be applied in numerous fields. Based on the advantages of GBM, an increasing number of scholars attempt to leverage GBM for prediction tasks.
Zhang and Haghani (2015) trained a travel-time prediction model with GBM to efficiently improve the accuracy of traditional traffic prediction methods. Gong et al. (2020) leveraged the GBM model to predict the return temperature of the district heating systems and verified the superiority of the model in comparison with the other support vector machine (SVM) and neural network models. Cui et al. (2021) constructed a powerful GBM model to predict rainfall-runoff with the expectation to solve the problem of flood migration and prove the efficiency of the model. Alshboul et al. (2022) designed a solid model based on GBM to predict the forecast green building costs and showed excellent performance in contrast to deep neural networks and random forests. Andrade and Bessa (2017) applied a gradient boosting tree to wind and solar forecasting and obtained a significant improvement over prior models. Alonso et al. (2015) attempted to solve the issues of wind energy prediction with random forest and GB algorithms. They revealed that both algorithms can improve the accuracy of the prediction but GB can handle significantly higher data volumes. Razavi et al. (2019) developed a combined framework with genetic programming and GBM algorithms for electricity theft detection by using the electricity demand data from 4,000 families.
Generally speaking, there are lots of successful GBM applications in diverse domains but few cases in electricity energy prediction. Therefore, we attempt to build a GBM-based electricity energy knowledge discovery framework in this paper and demonstrate the feasibility and scalability of our framework.
Although tons of existing models and methods can be used for EEF, there is a lack of an effective KDD framework capable of mining the electricity energy data or other types of energy data in an accurate and scalable manner.
Meanwhile, EEF is complicated work since it is easily influenced by a variety of circumstances such as weather, temperature, season, etc. Additionally, inhabitants’ consumption patterns, which have a significant impact on EEF, are easily influenced by weather conditions. As a result, there are lots of uncertainties in the task of EEF under the impact of weather. Therefore, weather conditions must be considered comprehensively when forecasting EEC. Furthermore, there are several types of periodic variations in the process of EEF. The impact of the climate on EEC during the four seasons of a year results in seasonal fluctuation of electricity usage. This kind of change is frequently affected by a lot of factors, such as region, climate, longitude, etc. All of which make EEF difficult. The present methods in the literature could not tackle these critical challenges efficiently.
GBM, a mechanism of ensembled gradient boosting algorithms, can reliably and accurately analyze EEC with time series and regression. It can effortlessly capture various features in the time series of electricity consumption in order to make EEF more precise. Hence, in the following section, we design a novel KDD framework based on GBM for forecasting energy data and utilize EEC for example to prove the viability of the proposed framework in this study.
The aim of electricity energy KDD is to obtain “predictive knowledge” by extracting potential knowledge from historical data and predicting future electricity energy trends. Therefore, there are several requirements for this task including predicting the findings as accurately as possible, being well adapted to multiple data types and diverse data formats, having good fault tolerance and robustness, and paying attention to the feedback of the KDD process. To satisfy the above items, we design a framework for electricity energy knowledge discovery that effectively considers how to select the huge data source on the internet and includes detailed data preprocessing steps to improve compatibility and scalability. The latent knowledge hidden in the data source is significantly discovered through GBM and a feedback mechanism is engaged in the process to provide a closed-loop and feasible operation of electricity knowledge discovery. The specific process is shown in Figure 2.
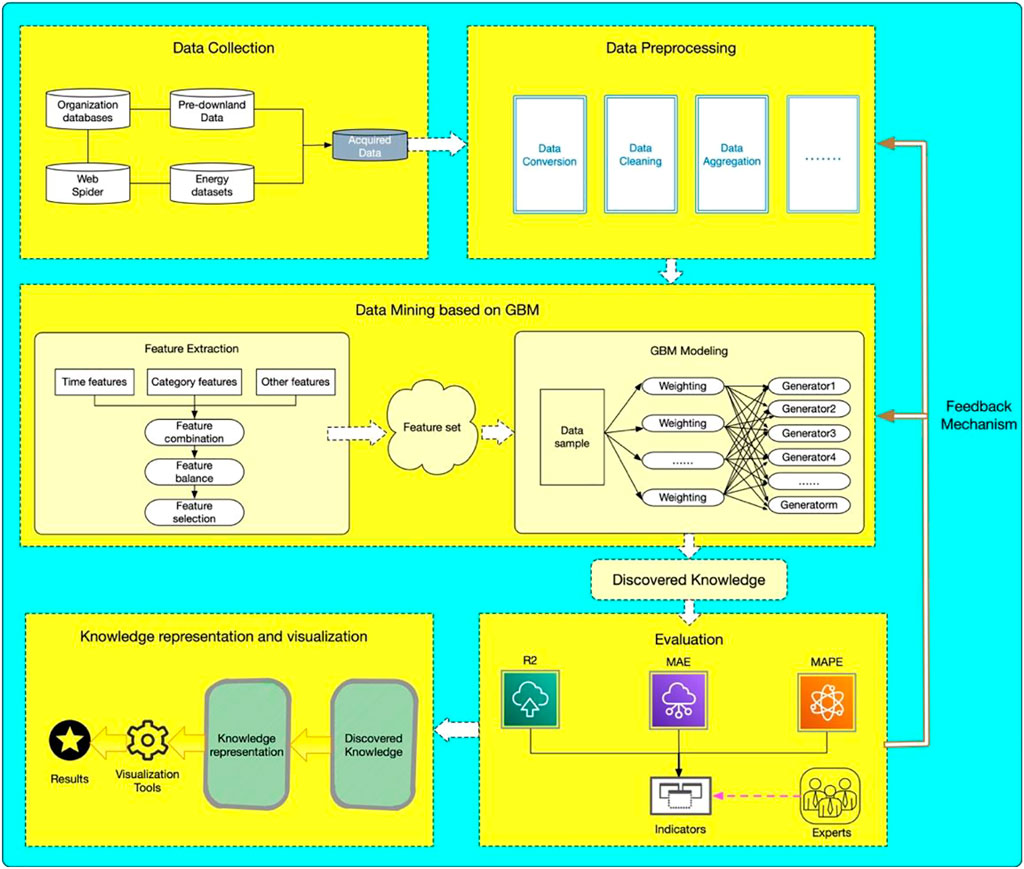
FIGURE 2. The Framework of Knowledge discovery based on GBM.
According to the figure, there are five sections in the KDD framework including data collection, data preprocessing, data mining, evaluation, and result visualization. They complement each other and promote each other to ensure accurate and effective implementation of electricity energy KDD. For data collection, our framework provides two main methods to gather the data sources. First, the electricity energy data can be obtained from specific organization datasets by establishing agreements with these institutions. The information era stimulates electricity-related agencies to urgently handle and analyze their own data in detail, which makes cooperation with electricity institutions feasible. Second, we can use web spiders to acquire the electricity energy data from the internet. This is a common approach to attain the required data when there are no other ways to get approximate information. Meanwhile, a variety of programming languages (i.e., python, java, etc.) are capable of implementing web spiders. In terms of data preprocessing, there are many high-dimensional, heterogeneous, and noisy information in the actual electricity data. Hence, our framework provides three methods to preprocess data including data cleaning to remove data noise, data conversion to reduce high-dimensional data, and data aggregation to eliminate data heterogeneity. Of course, other data preprocessing methods can be used for different types of data. For knowledge representation and visualization, our framework provides a process to implement visualization. In our framework, we transfer acquired knowledge to the knowledge representation section to represent the knowledge in a way and then leverage visualization tools to present the mined knowledge in an interactive manner. Evaluation is the key to evaluating the efficiency of our framework, which joins the expert system to help the evaluation part to make a more accurate evaluation. If the evaluation is not up to standard, the feedback system will be triggered to feedback to the previous sections, thus improving the accuracy of the entire knowledge discovery cycle. For GBM-based data mining, we utilize GBM to extract knowledge from the electricity data. Since our KDD conforms to the conventional knowledge discovery process and GBM is universally compatible with various data, our framework is widely applicable and extensible to various energy data. It is worth noting that data mining and evaluation are the core of the framework. We will in-depth discuss these two sections in the following.
The GBM was proposed by Friedman (2001). The primary idea is to create M weak classifiers and finally combine them to form a strong classifier through multiple iterations (Alonso et al., 2015). There are m steps of gradient boosting, where
Here, the loss function is
Friedman. (2002) shed light on an improved method, gradient boosting decision tree (GBDT), which can accumulate the learning ability of each weak learner. The general GB algorithm needs to use
Then,
After that, Friedman tried to discard the coefficient
GBM is an ensemble gradient boosting mechanism, which can attain the accurate prediction through the iteration of multiple weak learners (Natekin and Knoll, 2013). Traditional KDD is only a one-way process from the original data source to new knowledge, with a rather constrained data mining and analysis procedure that leads to unsatisfactory results (Harbelot et al., 2015). Our GBM model can optimize the knowledge discovery process by using base decision trees to form a loop until the optimal results are attained.
Feature extraction is the process of obtaining valuable features to improve the model’s performance (Barta et al., 2017). In our framework, we fully consider the following issues. Before data mining, a k-dimensional feature vector is created for the data source and different feature vectors should be chosen to represent information subsets. If the information represented by feature vectors satisfies the requirements for predicting dependent variables, the model’s prediction performance will increase, and vice versa. Therefore, the following two points should be paid attention to when extracting useful features. Firstly, whether or not the feature is scattered. For example, the original data basically has no difference regarding this feature when the variance of a feature vector is close to 0 in the electricity consumption prediction, so this feature is not scattered. Secondly, whether or not features and dependent variables are correlated. For instance, the feature with high correlation should be selected priorly concerning the correlation between the feature and the prediction target.
There are three steps in the process of feature extraction. The first is feature selection for choosing appropriate features and continuously optimizing feature subsets. The second is to compute the correlation between features and targets. The last is to select the most important features according to the ranking calculated by the above steps. Feature extraction is significant for the KDD process.
Excellent feature extraction is beneficial for improving prediction accuracy and can avoid over-fitting and reducing irrelevant features. This study designs a method for characteristic extraction, as shown in Figure 3. General electricity energy prediction is usually closely related to the users, regions, time, etc. Therefore, the feature selection is based on the interactive characteristics of users, regions, and user areas.
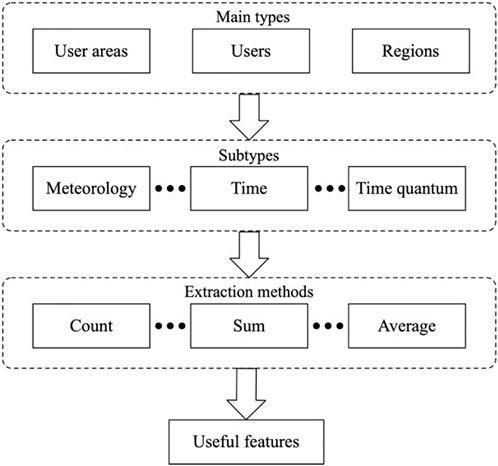
FIGURE 3. Feature extraction.
GBM is compatible with almost all linear or nonlinear regression prediction problems, and binary classification problems. The primary applications contain fault prediction, fraud prediction, energy prediction, etc. GBM allows different combinations of features are permitted when modeling and is appropriate for cases when different feature combinations generate diverse results. In addition, we choose GBM to build the model for the following five reasons. 1) Most energy forecasting is a type of regression analysis problem that GBM excels at. 2) GBM can handle well the issue of diverse feature combinations in energy prediction. 3) The resilience of the GBM can meet the scalability and robustness of our framework. 4). GBM has a strong generalization ability to different samples. 5) The time complexity of GBM is lower than that of neural networks. 6). GBM allows multiple discriminants and has less complexity of computation.
When modeling, we fully consider the valuable information in the lagging historical data and the changing trend at each lag time point. Therefore, the model’s generalization ability of time-series analysis is incredibly enhanced. Firstly, we utilize original data to train the GBM model and get the initial prediction results and residuals in light of the exact feature selection. Secondly, we use base decision trees to correct and update the residuals of the whole GBM model. Then, we repeat the above two steps until the prediction is accurate. There are overfitting problems of regression trees that should be paid attention to during this period. The modeling process is shown as follows.
The following steps show the process of the GBM modeling.
First, to initialize the estimated values of all sample data in K categories.
The second step is to perform the logistic transformation for the estimated value of each sample and to convert
Third, the probability of each class in every sample is traversed and each sample’s gradient of the K class is calculated. Therefore, the loss function is constructed.
The model uses the gradient descent method to obtain the gradient form by seeking the derivative. The gradient is the residual, which is the difference between the real and estimated probabilities. Meanwhile, the label of input data is the actual probability. When x belongs to k category,
The fourth step is to use the
Next, the
The sixth step is to update the estimated values of all samples in the Kth category. The estimated value f of all samples is obtained by adding the estimated value to the
It is noteworthy that
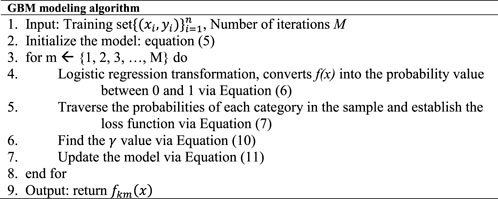
Algorithm 1. GBM modeling algorithm (Friedman, 2002).
In this study, we introduce R-squared (R2), Mean Absolute Error (MAE), and Mean Absolute Percentage Error (MAPE) as the evaluation indicators of the prediction results. Their equations are shown as follows.
Wherein,
We conducted our experiments in five steps including data collection, data preprocessing, data mining, data visualization, and evaluation.
We collect two aspects of data in the stage of data collection. The first is New York State’s EEC data from 1 January 2013, to 31 December 2016. The other is the climate information of various regions in New York State since EEC is inseparable from the weather. For example, the electricity consumption in summer is large, and EEC on rainy days is generally more than that on sunny days. The EEC data of 12 regions in New York State is obtained from NYISO. The weather information in various areas of New York State is collected by using the weather underground API to synchronize the historical period from 1 January 2013, to 31 December 2016. Climate data includes the following fields such as timeest (time), temperaturef (temperature), humidity (humidity), winddirdegree (wind speed), etc. In our experiments, we separate the data into two lists including time and date. Then we established the mapping relationship among the different regions in New York State, the corresponding cities, and weather stations, which is shown in Table 1. After that, we use data preprocessing techniques to retain four columns of information which are timestamp, region name, region name, region id, and power demand load. Table 2 is the part of the EEC data after data cleaning.
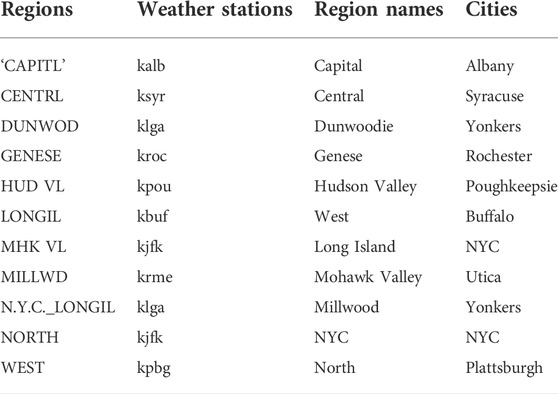
TABLE 1. Mapping of regions, cities, and weather stations.
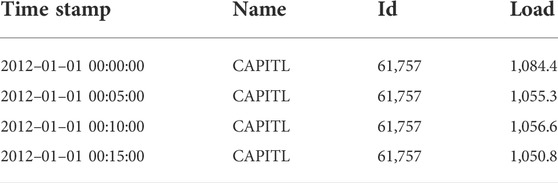
TABLE 2. Part of the EEC data after data cleaning.
After the data collection and preprocessing, we use the GBM model to conduct in-depth mining of EEC and weather information for intentionally forecasting the future electricity consumption trend.
EEC prediction is an issue of time-series regression. It is necessary to process the features according to time and then generate fine-grained time characteristics for forming a probability model to predict electricity consumption. The extracted time features are shown in Table 3.
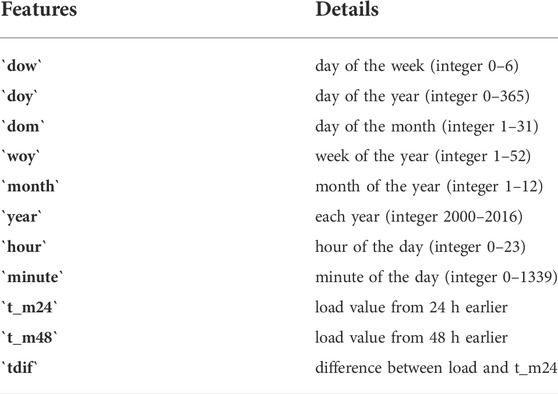
TABLE 3. Time series feature engineering.
The GBM regressor has several hyperparameters such as n_estimators, max_depth, max_features, etc. Wherein, n_estimators denotes the number of basic classifiers, max_depth represents the maximum depth of the tree, and max_features means the number of random features of each classification node. All the parameters could affect the performance of the model. This study uses grid search and cross-validation to select the optimal parameters. The details are shown in Table 4.
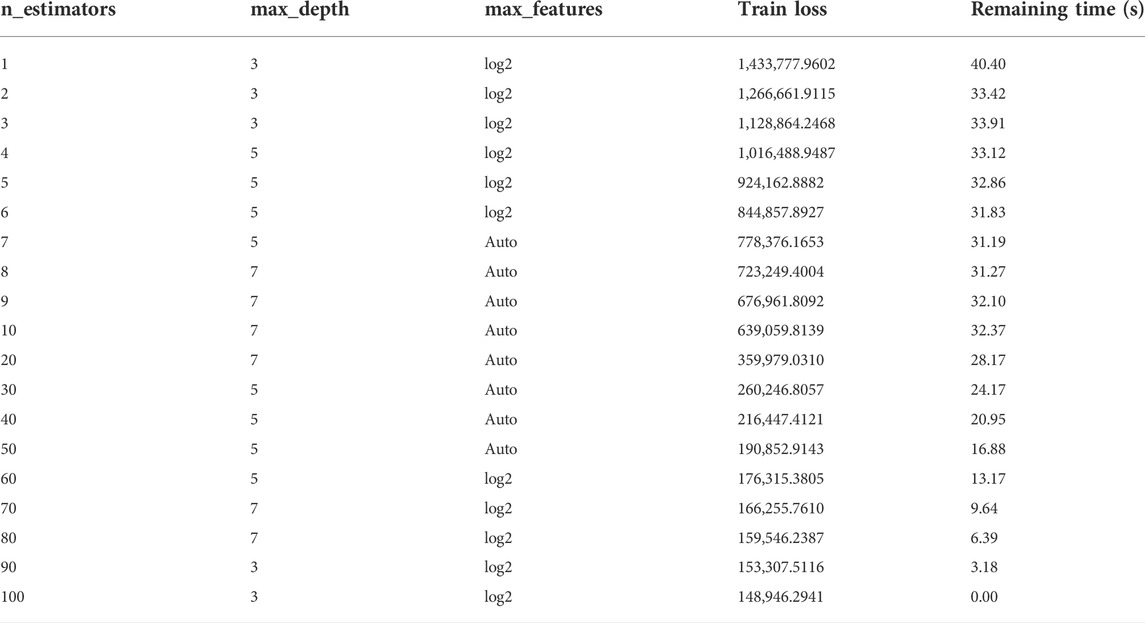
TABLE 4. Parameter selection grid table.
It can be seen that the larger the parameters, the greater the time complexity of the model. When the parameters are increased to a certain extent, the model’s error reduction is not obvious. Therefore excessively raising the parameters will result in overfitting. As shown in Figure 4, the error reduction amplitude of the model will occur with the change of parameters. The error will not drop visibly and the model has the best performance when n_estimators is 100. We use grid search and try cross-validation to find the best combination of parameters (i.e.,
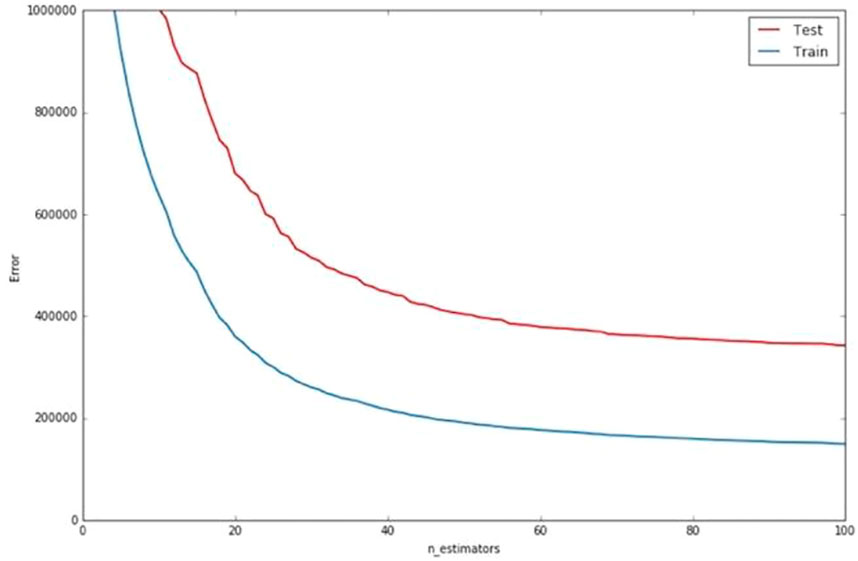
FIGURE 4. Error variation with parameters change.
In this study, we select six characteristics including temperaturef, summer, minute, dow, doy, and year. The importance of features is calculated based on the Gini coefficient (see Figure 5). As we can see, summer has the least impact on the model, while minute and doy make a significant difference to the model.
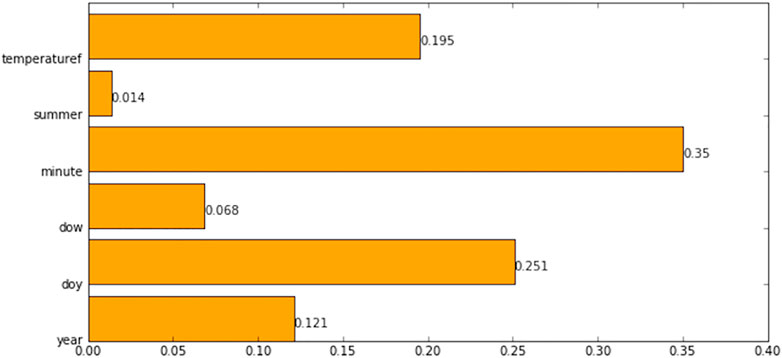
FIGURE 5. Feature importance of each factor.
After the above steps, we implement experiments to obtain the visualization results. We compared our experimental findings with the real electricity consumption and BiLSTM prediction results by official institutions. BiLSTM, a kind of recurrent neural network (RNN), leverages forward and backward long-short term memory to train data, which can handle highly correlated sequential information. Therefore, BiLSTM is suitable for time-series information such as electricity consumption data in this research. Finally, we select the official BiLSTM model as the comparative method.
Since EEC has a close relationship to the climate, this study selects three time periods consisting of the end of March (the cold weather), the end of July (the hot weather), and the end of October (the milder weather). The comparison between data and actual data is as follows.
The red lines in Figure 6 and Figure 7 are the predicted values of our experiments, and the blue lines are the actual value. By comparing with the actual consumption, we find that the EEC predicted by our model is basically consistent with the actual EEC trend. As the actual hits a pinnacle, the predicted basically follows suit. The differences between the forecasting results and the actual data is subtle.
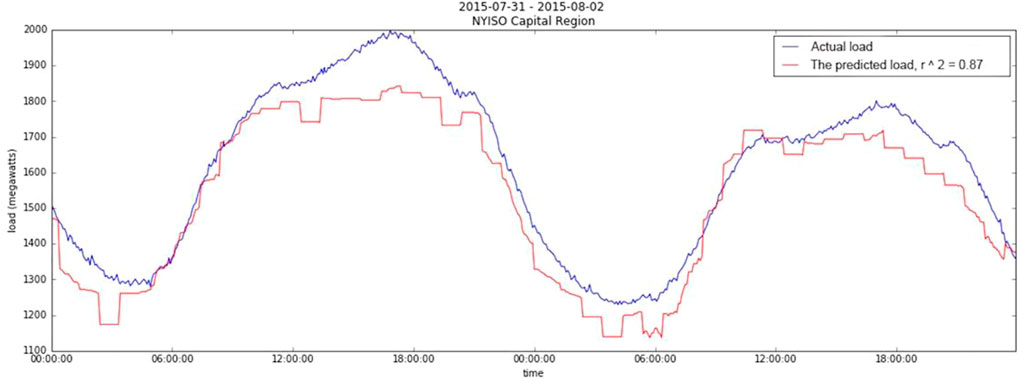
FIGURE 6. The forecasted EEC from the end of July 2015 to the beginning of August 2015.
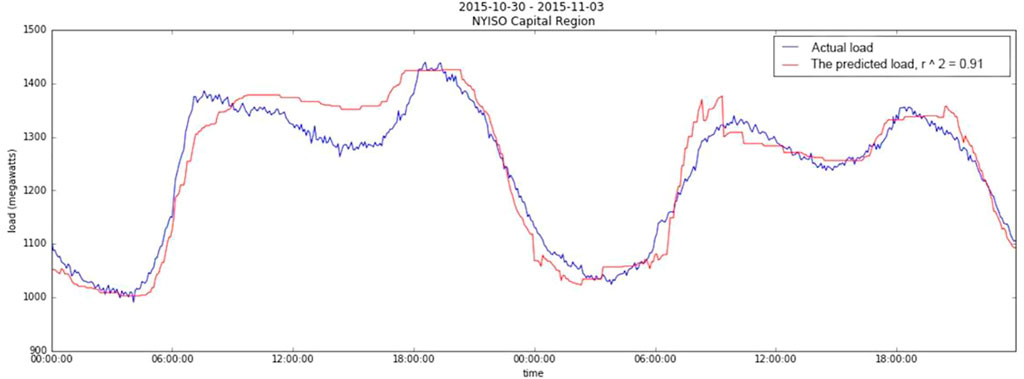
FIGURE 7. The forecasted EEC from the end of October 2015 to the beginning of November 2015.
To demonstrate the accuracy of the prediction, Figure 8 plots the actual values, the official results, and our predicted results at the end of July 2014. Figure 9 plots the three EEC trends of every day’s different time periods at the end of March 2016. The red lines are experimental results, the blue lines are the actual EEC, and the green lines are the official results. The following two figures show that our results trend and the official forecast results are by and largely consistent with the actual EEC curve trend. Meanwhile, our model is closer to the actual electricity consumption than the official model in terms of peak electricity consumption forecasting. And our model is more in line with the actual trend.
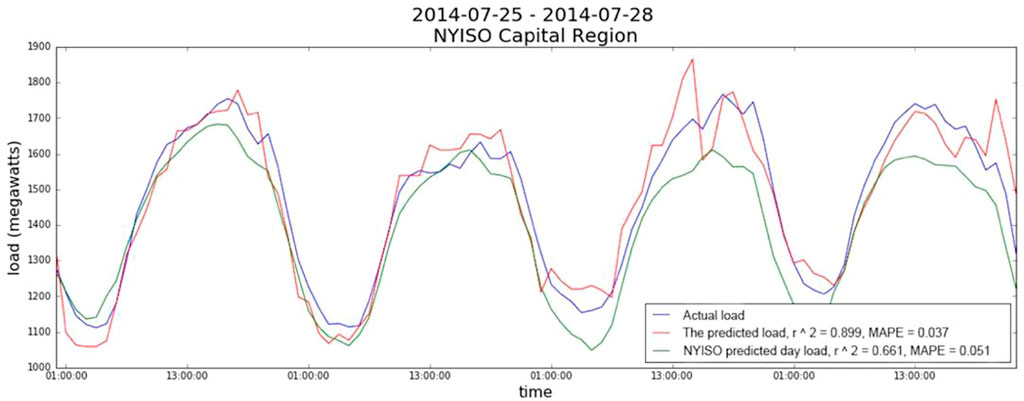
FIGURE 8. The forecasted EEC at the end of July 2014.
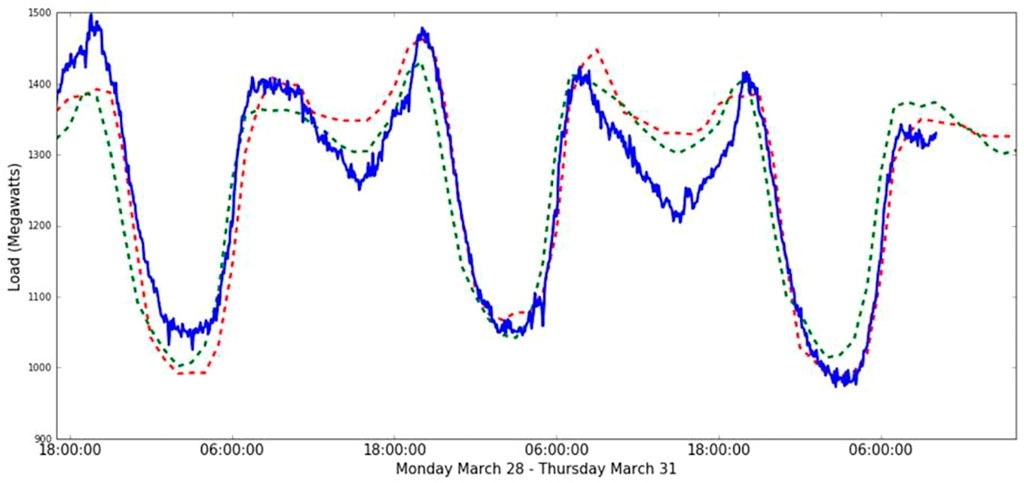
FIGURE 9. The forecasted EEC at the end of March 2016.
As we can see, the GBM model obtains excellent performance with the comparison of data during different periods. Therefore, we eventually draw the average daily EEC from April 2014 to January 2016 (see Figure 10). The red is the predicted result, the green is the official result and the blue is the actual EEC. As seen in the image below, the peak EEC of the proposed model is frequently closer to the real condition than the official model, which shows that our model is more accurate in anticipating extreme occurrences. Meanwhile, the GBM results are highly consistent with the actual EEC, which indicates that the framework proposed in this study is feasible and reliable in terms of EEF.
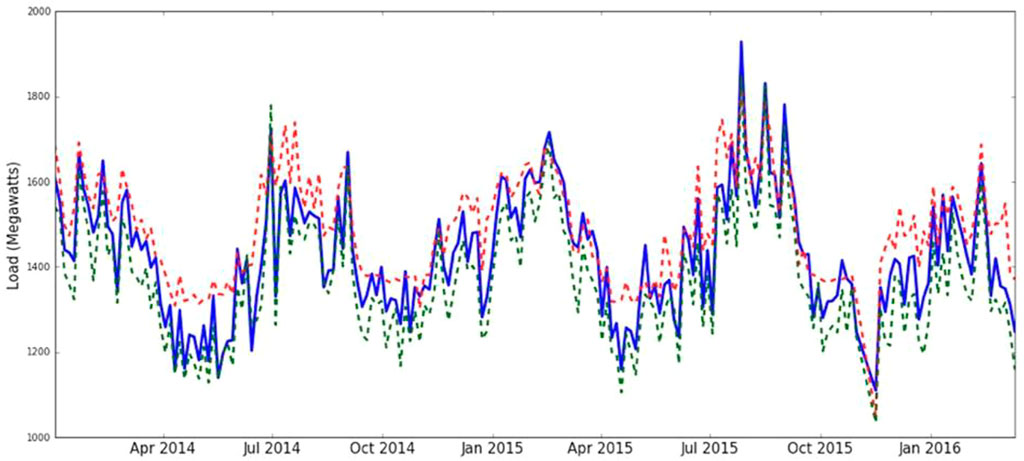
FIGURE 10. The average daily EEC from April 2014 to January 2016.
Finally, we use the R2-MAE-MAPE evaluation metrics to score the proposed model and the official BiLSTM model. As shown in Table 5, it is found that the official result is slightly better than our experiments regarding R2 and MAPE. Because there are more comprehensive data and more auxiliary information in official experiments while we are not able to get such data due to data privacy. Generally speaking, the experiments verify the feasibility of the proposed framework proposed and the framework can be applied to other scenarios due to tolerance of KDD and robustness of GBM. Our experimental results are reasonably accurate and satisfy the expectations for our designed framework when making electricity predictions.
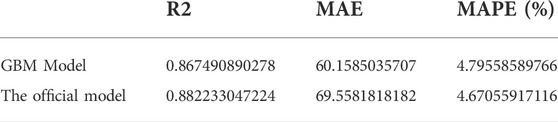
TABLE 5. The prediction result score.
In this study, we target to construct an accurate and scalable KDD framework for electricity forecasting. Specifically, we employ the KDD process and the popular algorithm, GBM, in our framework. Therefore, we design five robust and elastic steps to keep the proposed framework extendable for other types of energy knowledge discovery and discuss the scalability of the framework for other scenarios. Then we implement experiments to verify the accuracy and feasibility of the framework for electricity energy prediction. Therefore, the framework proposed in the study can provide reasonable support to the real-world energy system with data mining and analysis.
Several insights can be drawn from our study. First, when constructing the KDD framework in this study, we have fully borrowed the advantages of the traditional KDD process and techniques. Simultaneously, we keep up with the times to include ML-related techniques to increase the framework’s dependability. The GBM algorithm is finally selected as the best algorithm for the framework by comparing and assessing the many common algorithms’ advantages and shortcomings. Additionally, we utilize three metrics (R2, MAE, and MAPE) to construct a relatively complete evaluation system, which can accurately evaluate and analyze the experimental results. It is worth noting that the proposed framework contains a feedback system to optimize the process of knowledge discovery.
Second, we construct a K-dimensional feature vector based on the original data and completely consider two factors when performing feature selection including feature discreteness and feature-target function correlation. Meanwhile, we devise an available feature selection approach to guarantee the practicality and reliability of the selected characteristics.
Third, we consider the lagging history information and the changing trend information of each lag time point to enhance the generalization ability of the model to analyze time-series data when modeling. The modeling process is to obtain the data sequences of selected features for original residuals. Next, we train GBM regression trees to correct the residuals and iterate the training process until the final predicted result is acquired.
Finally, we integrate grid search and cross-validation to determine the appropriate parameters for overfitting avoidance. We use New York State’s electricity usage data as an example to conduct experiments for the constructed framework verification. We compare our experimental results with the actual EEC and official forecasting results to demonstrate our framework’s reliability and practicality.
In conclusion, the contributions of this study are shown as follows. Firstly, we construct a framework of the KDD process for electricity energy forecasting, which is scalable and applicable for different scenarios. Secondly, we utilize GBM to predict electricity consumption and set three effective metrics to demonstrate the validity and reliability of the framework. Thirdly, we illustrate that the proposed framework is suitable for electricity energy forecasting and has a splendid performance by comparing the experimental results with the real-life condition and the official prediction results. Lastly, we discuss the potential that our framework is applicable to other types of energy knowledge discovery. As for society, the proposed framework could assist governments in better creating corresponding energy-related regulations based on diverse real-world scenarios and establishing a more ecologically friendly society. The proposed framework can potentially benefit the decision-making and long-term sustainable development of governments and energy-related organizations.
This study develops a KDD framework based on the GBM and conducts a series of experiments to validate the feasibility and scalability of the framework. However, we do not consider other applications of GBM, such as text clustering, medical field prediction, automatic summarization, etc. Meanwhile, the experiments in this study only use the EEC data in New York State and the applicability of our framework for other energy data still needs to be further demonstrated. In addition, the experimental dataset is relatively small, and experiments on large datasets have not confirmed the feasibility of the framework. Meanwhile, the forecasting in this study is limited to the nearer future, and the accuracy of the forecasting for the far future is not confirmed.
Therefore, it would be beneficial to extend this study to different genres of datasets to account for the actual feasibility and reliability of our framework. In the near future, we will try to use large and different datasets to in-depth verify the resilience and scalability of the proposed framework.
The original contributions presented in the study are included in the article/supplementary material, further inquiries can be directed to the corresponding authors.
Conceptualization, BX and CZ; methodology, LZ; formal analysis; JZ; writing—original draft preparation, BX and CZ; writing—review and editing, LZ and B.X; visualization, JZ All authors have read and agreed to the published version of the manuscript.
The authors declare that the research was conducted in the absence of any commercial or financial relationships that could be construed as a potential conflict of interest.
All claims expressed in this article are solely those of the authors and do not necessarily represent those of their affiliated organizations, or those of the publisher, the editors and the reviewers. Any product that may be evaluated in this article, or claim that may be made by its manufacturer, is not guaranteed or endorsed by the publisher.
Alonso, A., Torres, A., and Dorronsoro, J. R. (2015). “Random forests and gradient boosting for wind energy prediction,” in Hybrid artificial intelligent systems, 26–37. doi:10.1007/978-3-319-19644-2_3
Alshboul, O., Shehadeh, A., Almasabha, G., and Almuflih, A. S. (2022). Extreme gradient boosting-based machine learning approach for green building cost prediction. Sustainability 14 (11), 6651. doi:10.3390/su14116651
Andrade, J. R., and Bessa, R. J. (2017). Improving renewable energy forecasting with a grid of numerical weather predictions. IEEE Trans. Sustain. Energy 8 (4), 1571–1580. doi:10.1109/TSTE.2017.2694340
Banik, R., Das, P., Ray, S., and Biswas, A. (2021). Prediction of electrical energy consumption based on machine learning technique. Electr. Eng. 103, 909–920. doi:10.1007/s00202-020-01126-z
Barta, G., Nagy, G. B. G., Kazi, S., and Henk, T. (2017). “Gefcom 2014—probabilistic electricity price forecasting,” in International conference on intelligent decision technologies, 67–76. doi:10.1007/978-3-319-19857-6_7
Bedi, J., and Toshniwal, D. (2020). Energy load time-series forecast using decomposition and autoencoder integrated memory network. Appl. Soft Comput. 93, 106390. doi:10.1016/j.asoc.2020.106390
Chen, T., and Guestrin, C. (2016). “Xgboost: A scalable tree boosting system,” in Proceedings of the 22nd acm sigkdd international conference on knowledge discovery and data mining, 785–794. doi:10.1145/2939672.2939785
Chou, J. S., and Truong, D. N. (2021). Multistep energy consumption forecasting by metaheuristic optimization of time-series analysis and machine learning. Int. J. Energy Res. 45 (3), 4581–4612. doi:10.1002/er.6125
Cui, Z., Qing, X., Chai, H., Yang, S., Zhu, Y., and Wang, F. (2021). Real-time rainfall-runoff prediction using light gradient boosting machine coupled with singular spectrum analysis. J. Hydrology 603, 127124. doi:10.1016/j.jhydrol.2021.127124
Dehuri, S., and Ghosh, A. (2013). Revisiting evolutionary algorithms in feature selection and nonfuzzy/fuzzy rule-based classification. WIREs. Data Min. Knowl. Discov. 3 (2), 83–108. doi:10.1002/widm.1087
Fayyad, U., Piatetsky-Shapiro, G., and Smyth, P. (1996). The KDD process for extracting useful knowledge from volumes of data. Commun. ACM 39 (11), 27–34. doi:10.1145/240455.240464
Friedman, J. H. (2001). Greedy function approximation: A gradient boosting machine. Ann. Stat. 29, 1189–1232. doi:10.1214/aos/1013203451
Friedman, J. H. (2002). Stochastic gradient boosting. Comput. statistics data analysis 38 (4), 367–378. doi:10.1016/S0167-9473(01)00065-2
Gong, M., Bai, Y., Qin, J., Wang, J., Yang, P., and Wang, S. (2020). Gradient boosting machine for predicting return temperature of district heating system: A case study for residential buildings in tianjin. J. Build. Eng. 27, 100950. doi:10.1016/j.jobe.2019.100950
Gumaei, A., Al-Rakhami, M., Al-Rahhal, M. M., Albogamy, F. R. H., Al-Maghayreh, E., and Al-Salman, H. (2021). Prediction of COVID-19 confirmed cases using gradient boosting regression method. Comput. Mat. Contin. 66 (1), 315–329. doi:10.32604/cmc.2020.012045
Harbelot, B., Arenas, H., and Cruz, C. (2015). LC3: A spatio-temporal and semantic model for knowledge discovery from geospatial datasets. J. Web Semant. 35, 3–24. doi:10.1016/j.websem.2015.10.001
Hu, Y. C. (2017). Electricity consumption prediction using a neural-network-based grey forecasting approach. J. Operational Res. Soc. 68 (10), 1259–1264. doi:10.1057/s41274-016-0150-y
Huang, T. E., Guo, Q. L., Sun, H. B., Zhao, N. Y., Wang, B., and Guo, W. X. (2019). Key technology and engineering application of power grid security feature selection and knowledge discovery driven by model-data hybrid. Automation Electr. Power Syst. 43 (01), 95–104+208.
Kang, T., Lim, D. Y., Tayara, H., and Chong, K. T. (2020). Forecasting of power demands using deep learning. Appl. Sci. (Basel). 10 (20), 7241. doi:10.3390/app10207241
Kaur, N., and Kaur, A. (2016). “Predictive Modelling approach to Data Mining for forecasting electricity consumption,” in 2016 6th international conference - cloud system and big data engineering (confluence), 331–336. doi:10.1109/CONFLUENCE.2016.7508138
Kim, M. K., Kim, Y. S., and Srebric, J. (2020b). Impact of correlation of plug load data, occupancy rates and local weather conditions on electricity consumption in a building using four back-propagation neural network models. Sustain. Cities Soc. 62, 102321. doi:10.1016/j.scs.2020.102321
Kim, M. K., Kim, Y. S., and Srebric, J. (2020a). Predictions of electricity consumption in a campus building using occupant rates and weather elements with sensitivity analysis: Artificial neural network vs. linear regression. Sustain. Cities Soc. 62, 102385. doi:10.1016/j.scs.2020.102385
Le Cam, M., Daoud, A., and Zmeureanu, R. (2016). Forecasting electric demand of supply fan using data mining techniques. Energy 101, 541–557. doi:10.1016/j.energy.2016.02.061
Leme, J. V., Casaca, W., Colnago, M., and Dias, M. A. (2020). Towards assessing the electricity demand in Brazil: Data-driven analysis and ensemble learning models. Energies 13 (6), 1407. doi:10.3390/en13061407
Li, K., Sun, Y., Robinson, D., Ma, J., and Ma, Z. J. (2020). A new strategy to benchmark and evaluate building electricity usage using multiple data mining technologies. Sustain. Energy Technol. Assessments 40, 100770. doi:10.1016/j.seta.2020.100770
Li, Y., Dai, S. Y., and Niu, D. X. (2017). “Electricity consumption forecast of hunan province using combined model based on multivariate linear regression and BP neural network,” in Proceedings of the 2017 7th international conference on mechatronics (Dordrecht, Netherlands: Atlantis Press), 651–655. doi:10.2991/mcei-17.2017.138
Lu, H., Cheng, F., Ma, X., and Hu, G. (2020). Short-term prediction of building energy consumption employing an improved extreme gradient boosting model: A case study of an intake tower. Energy 203, 117756. doi:10.1016/j.energy.2020.117756
Lu, H., and Mazumder, R. (2020). Randomized gradient boosting machine. SIAM J. Optim. 30 (4), 2780–2808. doi:10.1137/18M1223277
Magazzino, C., and Mele, M. (2022). A new machine learning algorithm to explore the CO2 emissions-energy use-economic growth trilemma. Ann. Oper. Res., 1–19. doi:10.1007/s10479-022-04787-0
Magazzino, C., Mele, M., Morelli, G., and Schneider, N. (2021). The nexus between information technology and environmental pollution: Application of a new machine learning algorithm to OECD countries. Util. Policy 72, 101256. doi:10.1016/j.jup.2021.101256
Magazzino, C., Mele, M., Schneider, N., and Vallet, G. (2020). The relationship between nuclear energy consumption and economic growth: Evidence from Switzerland. Environ. Res. Lett. 15 (9), 0940a5. doi:10.1088/1748-9326/abadcd
Meng, M., and Niu, D. (2011). Annual electricity consumption analysis and forecasting of China based on few observations methods. Energy Convers. Manag. 52 (2), 953–957. doi:10.1016/j.enconman.2010.08.023
Mukherjee, A., Mukherjee, P., De, D., and Dey, N. (2021). iGridEdgeDrone: Hybrid mobility aware intelligent load forecasting by edge enabled internet of drone things for smart grid networks. Int. J. Parallel Program. 49 (03), 285–325. doi:10.1007/s10766-020-00675-x
Natekin, A., and Knoll, A. (2013). Gradient boosting machines, a tutorial. Front. Neurorobot. 7, 21. doi:10.3389/fnbot.2013.00021
Obaidat, M., Obaidat, A. N., Ai-Ghandoor, A., Gharaibeh, M. A., and Almomani, A. H. (2019). Modelling energy consumption of the Jordanian transportation sector: The application of multivariate linear regression and adaptive neuro-fuzzy techniques. Int. J. Sustain. Energy 38 (9), 814–820. doi:10.1080/14786451.2018.1563092
Pinto, T., Praça, I., Vale, Z., and Silva, J. (2021). Ensemble learning for electricity consumption forecasting in office buildings. Neurocomputing 23, 747–755. doi:10.1016/j.neucom.2020.02.124
Razavi, R., Gharipopur, A., Fleury, M., and Akpan, I. J. (2019). A practical feature-engineering framework for electricity theft detection in smart grids. Appl. Energy 238, 481–494. doi:10.1016/j.apenergy.2019.01.076
Reddy, S. S. (2018). Bat algorithm-based back propagation approach for short-term load forecasting considering weather factors. Electr. Eng. 100 (03), 1297–1303. doi:10.1007/s00202-017-0587-2
Reddy, S. S., and Momoh, J. A. (2014). “Short term electrical load forecasting using back propagation neural networks,” in 2014 north American power symposium (NAPS), 1–6. doi:10.1109/NAPS.2014.6965453
Samhouri, M., Al-Ghandoor, A., Fouad, R. H., Hakim, A. H., Vasant, P., and Barsoum, N. (2009). Electricity consumption in the industrial sector of Jordan: Application of multivariate linear regression and adaptive neuro-fuzzy techniques. AIP Conf. Proc. 1159 (1), 135–143. doi:10.1063/1.3223918
Shao, Z., Yang, S. L., and Gao, F. (2014). Density prediction and dimensionality reduction of mid-term electricity demand in China: A new semiparametric-based additive model. Energy Convers. Manag. 87, 439–454. doi:10.1016/j.enconman.2014.07.038
Statistical Review of World Energy (2022). Global corporate energy-economics statistical-review-of-world-energy. Available at: https://www.bp.com/en/global/corporate/energy-economics/statistical-review-of-world-energy.html.
Wang, J., Li, P., Ran, R., Che, Y., and Zhou, Y. (2018). A short-term photovoltaic power prediction model based on the gradient boost decision tree. Appl. Sci. 8 (5), 689. doi:10.3390/app8050689
Wang, K. J., and Zhang, R. (2019). Research on short-term power load forecasting method based on improved BP neural network. Electr. Meas. Instrum. 56 (24), 115–121. doi:10.19753/j.issn1001-1390.2019.024.019
Wang, L., Hu, H., Ai, X. Y., and Liu, H. (2018). Effective electricity energy consumption forecasting using echo state network improved by differential evolution algorithm. Energy 153, 801–815. doi:10.1016/j.energy.2018.04.078
Weron, R. (2014). Electricity price forecasting: A review of the state-of-the-art with a look into the future. Int. J. Forecast. 30 (4), 1030–1081. doi:10.1016/j.ijforecast.2014.08.008
Zhang, G. Q., and Guo, J. F. (2020). A novel ensemble method for hourly residential electricity consumption forecasting by imaging time series. Energy 203, 117858. doi:10.1016/j.energy.2020.117858
Keywords: gradient boosting machine, energy prediction, knowledge discovery, electricity consumption, framework
Citation: Xie B, Zhu C, Zhao L and Zhang J (2022) A gradient boosting machine-based framework for electricity energy knowledge discovery. Front. Environ. Sci. 10:1031095. doi: 10.3389/fenvs.2022.1031095
Received: 29 August 2022; Accepted: 18 October 2022;
Published: 03 November 2022.
Edited by:
Željko Stević, University of East Sarajevo, Bosnia and HerzegovinaReviewed by:
Katleho Makatjane, University of Botswana, BotswanaCopyright © 2022 Xie, Zhu, Zhao and Zhang. This is an open-access article distributed under the terms of the Creative Commons Attribution License (CC BY). The use, distribution or reproduction in other forums is permitted, provided the original author(s) and the copyright owner(s) are credited and that the original publication in this journal is cited, in accordance with accepted academic practice. No use, distribution or reproduction is permitted which does not comply with these terms.
*Correspondence: Chenliang Zhu, Njg4MjcxNjFAcXEuY29t; Liang Zhao, WkwyMDEzQGNxdS5lZHUuY24=
Disclaimer: All claims expressed in this article are solely those of the authors and do not necessarily represent those of their affiliated organizations, or those of the publisher, the editors and the reviewers. Any product that may be evaluated in this article or claim that may be made by its manufacturer is not guaranteed or endorsed by the publisher.
Research integrity at Frontiers
Learn more about the work of our research integrity team to safeguard the quality of each article we publish.