 Guangxuan Yan
 Hao Yu
 Menghui Li2
 Dan Yao
94% of researchers rate our articles as excellent or good
Learn more about the work of our research integrity team to safeguard the quality of each article we publish.
Find out more
ORIGINAL RESEARCH article
Front. Environ. Sci., 11 November 2022
Sec. Atmosphere and Climate
Volume 10 - 2022 | https://doi.org/10.3389/fenvs.2022.1028572
Black carbon (BC) is one of the main factors in global climate change and human health. Based on reanalysis data from the Modern-Era Retrospective Analysis for Research and Applications Version 2 (MERRA-2), the historical trends in the variation of BC and the factors affecting this were investigated in core city of Central Plains Economic Zone in China-Zhengzhou. Based on correlation analysis with ground measurements of BC concentration, it was determined that the MERRA-2 reanalysis data could be used to reveal the variations in ground-level BC concentrations. According to the variation trends of BC concentration in 1980–2020 and typical fossil fuel consumption in 2008–2017, two periods of rapidly increasing BC concentration were identified in 1980–1989 and 1999–2006. The increase in BC concentration then slowed from 2007. Since 2012, due to the adjustment of the Zhengzhou strategy and the implementation of an emission control strategy throughout Henan Province, the consumption of coal and coke decreased by 4% every year, resulting in a downward trend in the total BC emissions. However, coal and coke were still the main factors affecting the BC concentration in Zhengzhou. The contribution of transportation to BC in Zhengzhou has been particularly important since 2016. Analysis of BC seasonal variation revealed that the highest BC concentration was in winter, mainly due to the increase in industry and residential emissions. Additionally, based on the local and regional emission inventories and combined with potential source contribution function (PSCF), concentration weighted trajectory (CWT), this study revealed the potential sources regions and source types of BC in Zhengzhou, and found that the intensification of energy consumption and BC emissions in Zhengzhou and the surrounding regions of Henan Province might be the reasons for the high BC loading in Zhengzhou through regional transport.
Black carbon (BC) is an important component of particulate matter (PM), which diameter is between 0.01 and 1.0 μm (Wang et al., 2015). Generally, the sources of BC can be divided into natural and anthropogenic sources (Pani et al., 2020; Wang et al., 2016). Natural sources mainly include natural fires and volcanic eruptions, which have strong contingency and obvious spatial differences. In contrast, anthropogenic sources are universal and sustained, mainly including fossil fuel combustion, biomass combustion, open straw burning and vehicle exhaust emissions, which are the main factors causing the variation in BC concentration in the atmosphere (Bond et al., 2013; Wang et al., 2016). Previous research found that, although BC accounts for less than 5–10% of PM (Liu et al., 2021), it is the strongest light-absorbing component in PM. It can directly absorb or scatter solar radiation and thereby affects the regional and global radiation balance and climate (Li et al., 2016; Liakakou et al., 2020). Moreover, the warming effect of BC is about two-thirds that of carbon dioxide (CO2) and it has become the second-largest factor affecting global warming behind CO2 (Gustafsson and Ramanathan, 2016; Bond et al., 2013). The average lifetime of BC in the atmosphere is about 7 days (Qin et al., 2019); thus, it can participate in the physical and chemical processes and reactions of the atmosphere during long-distance transmission (Lund and Berntsen, 2012). Furthermore, BC is a carcinogen and the adverse health effects of BC exposure have been shown to be greater than those of PM (Isley et al., 2017; Peng et al., 2019). Due to the significant impact of BC on the environment and health, it is necessary to analyse the sources of BC and implement effective mitigation measures in high BC pollution regions.
In past studies, long- and short-term ground measurements of BC have been conducted around the world to determine seasonal variations, diurnal variations and source apportionment (Dumka et al., 2018; Pani et al., 2020; Peng et al., 2019; Singh et al., 2018; Wei et al., 2020). For example, Dumka et al. found that fossil fuel combustion was the major source (72%) of BC in Delhi, India (Dumka et al., 2018). In North China, the concentrations of BC were higher in autumn and winter than in spring and summer, and in urban compared to non-urban areas. Zheng et al. analysed the temporal variation of BC in Hefei (Zhang et al., 2015). The results showed that the annual average concentration of BC was 3.5 ± 2.5 μg m−3, the lowest BC concentration was in summer and the highest in winter, and the diurnal variation was bimodal due to the morning and evening traffic peaks. To date, three main research methods are used to determine the spatial and temporal distribution of BC: ground monitoring, numerical simulation and remote sensing reanalysis data. However, ground measurement is limited by instrumentation, observation stations and manual operation, which cannot determine the spatial variation in BC (Boys et al., 2014). Although satellite data can be used for large-scale observation, it is vulnerable to weather conditions and data loss can occur (Zhao et al., 2021). NASA’s Modern-Era Retrospective Analysis for Research and Applications Version 2 (MERRA-2) reanalysis data were released by the Global Modelling and Assimilation Office (GMAO) in 2017, including atmospheric BC products since 1980 (Bali et al., 2017). These data can compensate for the deficiencies in the above observation methods. Additionally, many studies have proved the reliability of MERRA-2 data by determining the correlation between BC concentrations from MERRA-2 reanalysis data and ground measurements (Qin et al., 2019; Zhao et al., 2021).
As China is a developing country, its BC emissions are increasing year by year due to its economic development and the massive use of fossil fuels, which account for about 25–30% of the global total (Ni et al., 2014; Mao et al., 2016). As the core city of the Central Plains Economic Zone, Zhengzhou’s energy consumption and motor vehicle ownership are increasing year by year as the population density and urbanisation rate increase. This has significant effects on urban air quality, climate change and human health (Luo et al., 2021; Wang et al., 2017). To control air pollution and improve air quality, China has formulated a series of measures and promulgated a series of administration policies. Additionally, Henan implemented various reinforcing emission control measures during the 2008 Beijing Olympic Games (Wang et al., 2010) and the Shanghai Cooperation Organisation Prime Ministers’ Meeting, which was hosted in Zhengzhou (Feng et al., 2018); these have resulted in remarkable improvements in air quality. Although the reinforcing air pollution control measures have proved to be successful, especially for major pollutants such as BC, air quality improvement in Zhengzhou remains a great challenge.
To sum up, this study selected Zhengzhou as the study region, which is the core city of the Central Plains Economic Zone, and used BC concentrations from MERRA-2 reanalysis data to 1) study the historical BC concentration variation from 1980 to 2020 and sources of BC in Zhengzhou, 2) clarify the potential source regions of BC in Zhengzhou and 3) evaluate the impact of ambient air control measures on BC.
MERRA-2 is a reanalysis data set formed after the assimilation and absorption of satellite aerosol data set based on the Goddard Earth Observing System (GEOS-5) and its data assimilation system (ADAS-5.12.4; Bali et al., 2017; Gelaro et al., 2017). MERRA-2 provides the spatial distribution of atmospheric BC concentration since 1980, with a spatial resolution of 0.5° × 0.625° and a temporal resolution of 1 h, 3 h and month. All products can be downloaded through the NASA Earth Science Data Website (https://earthdata.nasa.gov/). With the wide application of MERRA-2, many validations have been carried out on MERRA-2 by research. Qin et al. (2019) compared the 12 h average data of MERRA-2 BC and observation in each year during 2015–2016 in Beijing, showing the higher correlation coefficients between them. Xu et al. (2020) compared the BC concentration of 14 ground observation stations in eastern China with the BC data in MERRA-2 in each year from 2000 to 2016, and found that there was a high correlation between them. Additionally, the above results indicated that BC data in MERRA2 could be directly used to analyze the temporal and spatial variation of BC. In order to investigate the applicability and accuracy of the MERRA-2 BC product, the comparisons were performed between MERRA-2 BC product and ground observation in different time intervals at Zhengzhou in Section 3.1.
In the present study, hourly BC concentration data at Zhengzhou (Figure 1) were collected from the MERRA-2 reanalysis data during 1980–2020, for which the spatial distribution resolution was 0.5 × 0.625°, which using the Goddard Earth Observing System, Data Assimilation System, Version. 5.12.4 (GEOS-5, DAS, NASA Global Modeling and Assimilation Office). The global MERRA-2 reanalysis data shows a slightly better accuracy and greater stability than the satellite data, although the value is slightly higher (Qin et al., 2019).
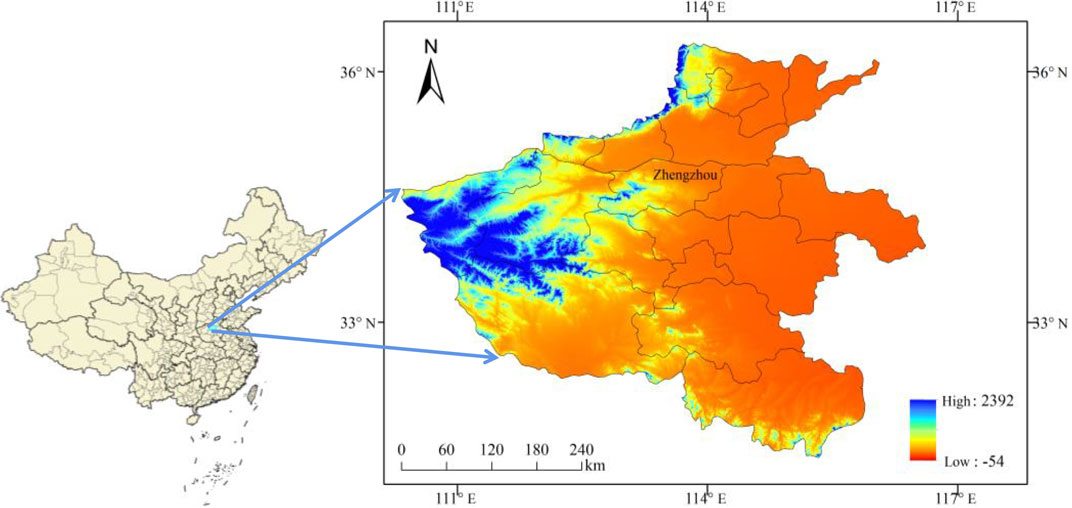
FIGURE 1. The location and surrounding landform of Zhengzhou (The unit on the color contour is metre).
The Hybrid Single-Particle Lagrangian Integrated Trajectory (HYSPLIT) modeling system (Yu et al., 2020; Yu et al., 2019; Stein, A. F et al., 2015; Rolph, 2003; Draxler and Rolph, 2003) was used to calculate back trajectories from gridded meteorological data. HYSPLIT was developed at the Air Resources Laboratory (ARL) of the National Oceanic and Atmospheric Administration (NOAA). It is a complete system for computing trajectories of complex dispersion and deposition simulations using either puff or particle approaches. The details information of the model can be found on the NOAA website (http://www.emc.ncep.noaa.gov/modelinfo/index.html). In this study, the meteorological data were collected from the global data assimilation system (GDAS) of the National Centres for Environmental Prediction (NCEP), using a spatial resolution of 1 × 1 (http://ready.arl.noaa.gov/HYSPLIT_traj.php) was used to analyse the backward trajectories, potential source contribution function (PSCF) and concentration weighted trajectory (CWT).
24-h air mass back trajectories above the ground level over the monitoring site in Zhengzhou were calculated at each hour during 00–23 h for each day, with 100 m above ground level was calculated in this study. According to the publish literatures, there is no accepted ground-level starting height for the HYSPLIT model. Generally, reasons for using a specific altitude have not been given, and choices are based on previously experience (Karaca et al., 2009; Schwarz et al., 2016; Feng et al., 2017; Yu et al., 2020). In this study, the potential sources of BC in Zhengzhou was conducted using the potential source contribution function (PSCF) and the concentration weighted trajectory (CWT), which was implemented based on the GIS-based software TrajStat (Wang et al., 2009). Hourly BC concentration was used to calculated its PSCF and CWT, where the average concentration of BC was used as the pollution criterion (Ren et al.,. 2021; Wang et al., 2021; Cao et al., 2022; Xing et al., 2022). When the concentration corresponding to a given backward trajectory exceeds the pollution criterion, the trajectory is considered polluted. Higher values of PSCF and CWT represent higher probability of potential sources and higher potential contributions to a high pollution level in the receptor sites.
This study collected the total amount of BC emitted by industrial, power, residential and transportation sources in Zhengzhou, Henan Province and the surrounding regions from 2008 to 2017 from the China Multi-Resolution Emission Inventory (MEIC) developed by Tsinghua University (http://www.MEICmodel.org), including monthly and annual emissions.
Past studies have suggested that the MERRA-2 reanalysis data corrected the total column aerosol mass by assimilating and absorbing the deviation-corrected AOD from the Terra MODIS and Aqua MODIS satellites, but the loss of nitrate aerosols could not be eliminated during severe pollution (Song et al., 2018). Therefore, it was necessary to validate MERRA-2 data with ground-level measurements before analyzing the data. In this study, the ground-level BC concentration data in Zhengzhou from 2006 to 2016 was collected from Xu et al. (2020), and BC concentration in that study was mainly from Zhengzhou site, which is one of the Chinese Meteorological Administration (CMA) Atmosphere Watch Network (CAWNET) site. The CAWNET was established by China Meteorological Administration, is designed to monitor the BC surface mass concentration over China since 2006 with a seven-channel Aethalometer (Model AE-33, Magee Scientific Company, United States).
In this study, the Pearson correlation coefficient, root mean squared errors (RMSE) and mean bias errors (MBE) were used to verify the difference between the monthly concentration of MERRA-2 and ground observation BC. The correlation between MERRA-2 and ground measurements was 0.66 (N = 107, p < 0.01) (Supplementary Figure S1), and the root mean squared errors (RMSE) in Zhengzhou was 2.40 μg m−3, which was close to that in the study of Xu et al. The MBE was 7.59% in Zhengzhou, which indicated that the ground measurements BC concentration was higher than that in MERRA-2. In previous studies, MERRA-2 has negative bias in some areas, mainly due to the limited retrieval ability of assimilation satellites under heavy air pollution, and the lack of retrieval ability is one of the reasons for low correlation and large RMSE in Zhengzhou (Song et al., 2018). Moreover, the different resolutions of MERRA-2 and ground observation data may result in deviation to some extent. In this study, MERRA-2 reanalysis data resolutions was the grid remote sensing data of 0.5 × 0.625, while the ground measurement data was from Zhengzhou National Basic Meteorological Station (113.39°E, 34.43°N). As meteorological parameters and emissions will affect the BC concentration (Zhao et al., 2021), the bias of MERRA-2 data in different seasons also needed to be determined. Accordingly, the correlation between BC concentrations from the MERRA-2 and ground measurements in different seasons was analyzed, revealing the two data sets to be highly correlated in every season (r > 0.90, p < 0.01) except for summer (Figure 2). The lowest correlation coefficient between the MERRA-2 and ground measurement BC concentrations was 0.014, which was similar to that obtained by Qin et al. (Qin et al., 2019). Previous studies have found that precipitation may result in a weak correlation between MERRA-2 and ground-level measurements of BC concentration (Qin et al., 2019). In summer in Zhengzhou, the precipitation is about 352.9 mm, accounting for 55% of the total annual precipitation. Although the BC concentrations from the MERRA-2 reanalysis data and ground-level measurements were more weakly correlated in summer, the ratio of the concentrations of these two data sets ranged between 0.90 and 1.20 for each month from 2006 to 2016, and without apparent seasonal difference. Thus, it was determined that the BC concentrations from the MERRA-2 reanalysis data could be used directly to analyse the annual and seasonal variations in BC in Zhengzhou.
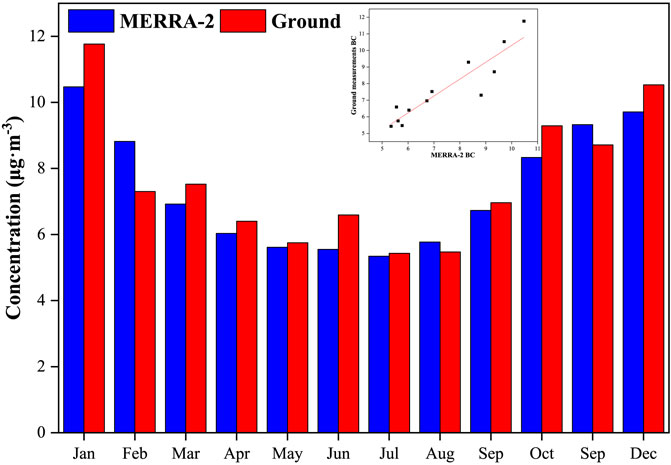
FIGURE 2. Monthly variations in BC concentrations from ground-level measurements and MERRA-2 reanalysis data in Zhengzhou from 2006 to 2016.
In this study, BC concentration was analyzed based on the BC data in MERRA2. The average annual variation in BC in Zhengzhou from 1980 to 2020 was 6.11 ± 1.21 μg m−3 (Figure 3). The highest BC concentration was 7.74 μg m−3 in 2011 and the lowest was 4.00 μg m−3 in 1982. Compared with other cities and regions in China, the BC concentration in Zhengzhou was higher than that in Shanghai (2.55 ± 0.59 μg m−3; Cao et al., 2021) Anhui Province (2.82 ± 1.76 μg m−3) and Zhengjiang Province (2.54 ± 1.34 μg m−3; Jing et al., 2019), lower than that in Beijing (10.10 μg m−3; Song et al., 2013) and close to that in Guangzhou (6.50 μg m−3; Cao et al., 2021).
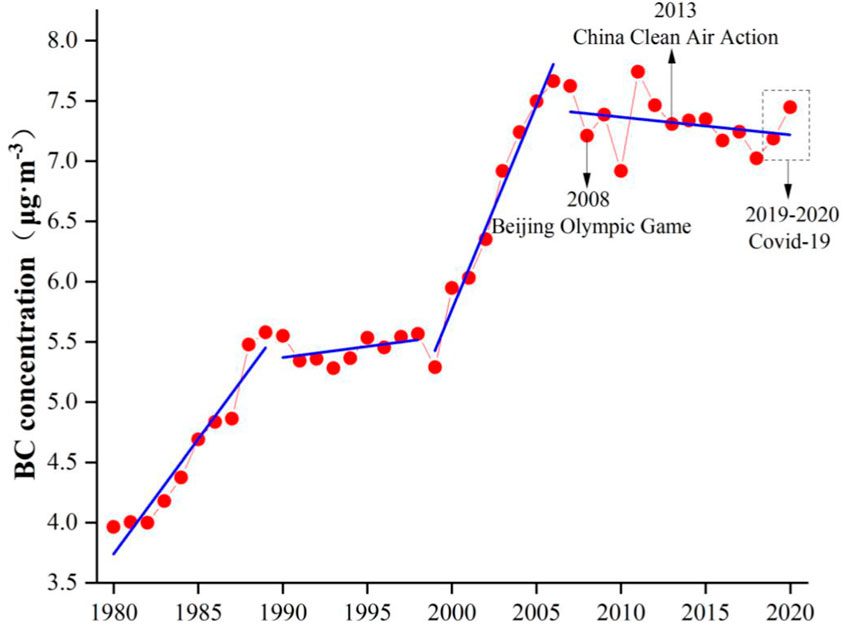
FIGURE 3. Trend in BC concentration from MERRA-2 data from 1980 to 2020 at Zhengzhou.
Overall, the BC concentration showed an increasing trend, with two rapid increasing periods in 1980–1989 and 1999–2006. However, the trend in BC concentration in Zhengzhou has slowly declined since 2007. According to the China Statistical Yearbook, the annual consumption of coal and coke in 1995–2003 in Henan Province was lower than 120 × 106 t·a−1, markedly increased during 2004–2011 and steadily decreased since 2012 (Supplementary Figure S2). Simultaneously, the annual consumption of gasoline, kerosene and diesel has been steadily increasing since 2002.
In 2008, the Olympic Games were hosted in Beijing. This had a tremendous impact on the environmental policy in Zhengzhou and other surrounding regions of Henan Province, resulting in slow growth in coal and coke consumption since 2007. It has been shown that reducing the use of industrial coal and adopting new vehicle emission standards helped to retard BC concentrations in the early stage of the Olympic Games (Chen et al., 2013). Additionally, following the Olympic Games, coal consumption by industry increased from 2009 to 2011, and resulted in increased BC emissions from industry in Zhengzhou, which was twice the emissions from transportation and residential, and peaked in 2011 (Figure 4). However, after China began to formulate a series of energy conservation and emission reduction plans in 2012 (Yuan and Zuo, 2011), the use of coal and coke decreased significantly (with an average annual decrease of 4% from 2012 to 2020) and the total BC emissions also showed a decreasing trend (Figure 4).
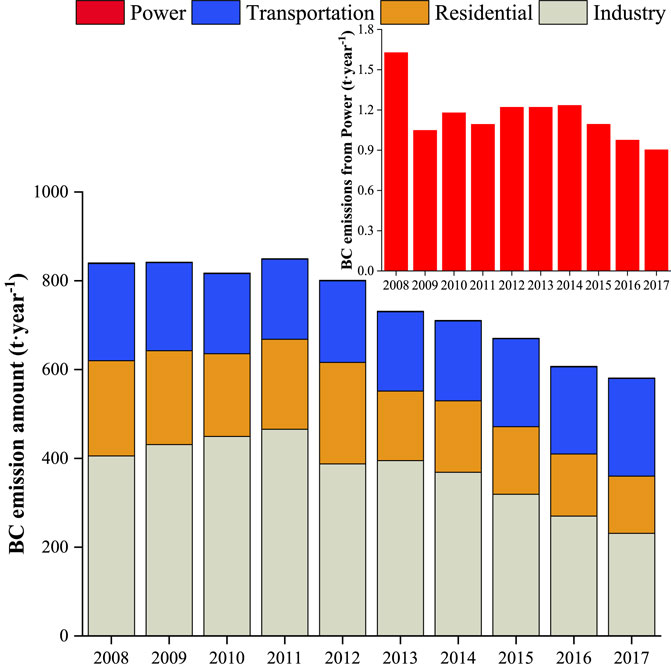
FIGURE 4. Annual emissions from different sources in Zhengzhou based on the 2008–2017 MEIC emission inventory.
BC emissions have been caused primarily by transportation in Henan in 2017 (Supplementary Figure S3) and its contribution to BC in Zhengzhou has been particularly important. From 2008 to 2017 in Henan Province, the total gasoline, kerosene and diesel consumption increased from 7.5 to 18.4 million tons, which may have profoundly impacted BC concentrations in the ambient air. Zhang et al. found that motor vehicles powered by gasoline or diesel are one of the main sources of air pollutants (Zhang et al., 2017), and the study suggested that aerosols from such ground-level sources can easily accumulate in the atmosphere due to topographic barriers, as compared to those from elevated sources.
From 2005 to 2020, the BC concentration in Zhengzhou has shown a decreasing trend. This was mainly due to the overall decrease in energy consumption in Zhengzhou from 2008 to 2017 (Figure 4). However, it is interesting that BC concentration displayed an uptrend from 2018 to 2020, which was not affected by the COVID-19 lockdown. According to previous studies, fossil fuel combustion and vehicle exhaust emissions are the main factors causing the variation in BC concentration in the atmosphere (Bond et al., 2013; Wang et al., 2016). In 2019, the motor vehicle ownership in Zhengzhou have been reached 600,000, which was 1.03 times than that in 2018, and although the consumption of coal and coke decreased during this period, the consumption of kerosene and diesel increased (Supplementary Figure S2), which has caused the increase of BC concentration during 2018–2020.
To better understand the relationship between the BC concentration in ambient air and its emission sources in Zhengzhou, this study also analyzed the correlation coefficients between BC in ambient air and different typical fossil fuel consumption in Zhengzhou from 1995 to 2019 (Table 1). Higher, positive correlation coefficients were observed for coal, coke and diesel, while lower and positive correlation coefficients were observed with gasoline and kerosene. This result suggested that BC concentration was still influenced primarily by local coal and coke in Zhengzhou, while liquid fuel was widely used in vehicle engines and jet engines may also be an important factor affecting the BC in Zhengzhou in recent years.
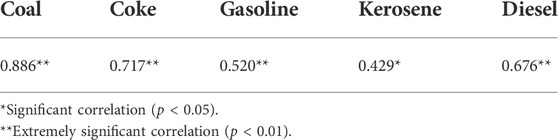
TABLE 1. Correlation coefficients between BC concentration and different fossil fuels consumed from 1995 to 2019.
In this study, the seasonal variation in BC concentrations also was explored from 1980 to 2020 (Figure 5). The monthly averages of the BC concentration from March to May (spring), June to August (summer), September to November (autumn) and December to February (winter) were obtained to represent the BC variation in different seasons. Overall, the concentration of BC exhibited the following trend: winter > autumn > spring > summer, and with the highest average concentration was found in winter in past 40 years (98%). This result was similar to other cities such as Beijing and Shanghai (Qin et al., 2019; Cao et al., 2021). Supplementary Figure S4 also displayed the BC different sources seasonal variation based on the 2008–2017 emission inventory, which provided by MEIC. In Zhengzhou, the dominant emission source of BC was industrial emission, and with the highest emission in winter, similarly to the BC concentration variation in winter. Transportation emissions showed similarly high emissions in all seasons. In contrast, the residential emissions in Winter were about four-fold higher than in other seasons. This phenomenon also showed that the significant increase in BC emissions from residential heating in winter could lead to increased BC concentrations. Additionally, adverse meteorological factors can readily cause BC to accumulate in winter, thus increasing the BC concentration (Feng et al., 2018; Zhao et al., 2021). However, in summer, due to the increased temperature and meteorological conditions that are conducive to the diffusion of pollutants, the BC concentration was reduced.
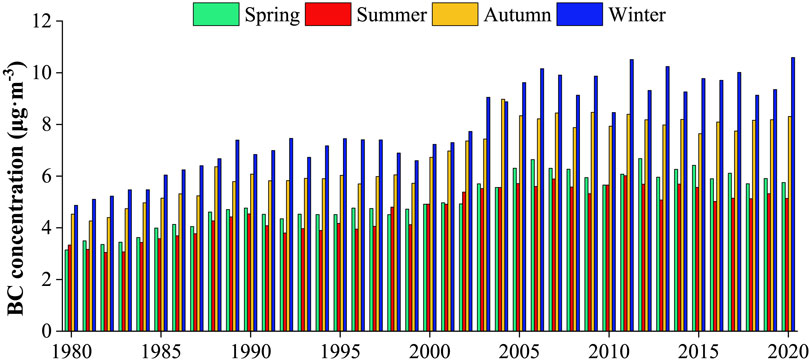
FIGURE 5. Seasonal variation in BC concentrations from MERRA-2 data in Zhengzhou from 1980 to 2020.
The HYSPLIT 4 model was used to calculate 24-h backward trajectories for Zhengzhou. Figure 6 shows the backward trajectory cluster distributions from 2008 to 2017. In these 10 years, there were four types of air masses each year with similar transmission directions. The first type air masses cluster accounted for 4.84%-20.41 (10.45% on average), which originated from Inner Mongolia and was transported across Shaanxi Province, Shanxi Province and northwest Henan Province. Second type air masses were mainly from Shaanxi and Shanxi Province, accounted for 8.84%–29.22% (19.39% on average). Third type air masses accounted for 14.06%–38.99% (30.15% on average), and originated from the south of Hebei and north of Henan Province. Fourth type air masses mainly originated from local emission and the south of Henan Province, which accounted for 24.25%–58.20% (40.01% on average). From 2008 to 2016, the proportion of air masses from local emissions in Zhengzhou was the largest, and this type air masses cluster was shorter than that of other clusters. According to the previous literature, a short cluster means that the air mass moves slowly and can readily cause the accumulation of pollutants (Yu et al., 2020). Thus, this result suggested that local emissions were the main source of BC in Zhengzhou.
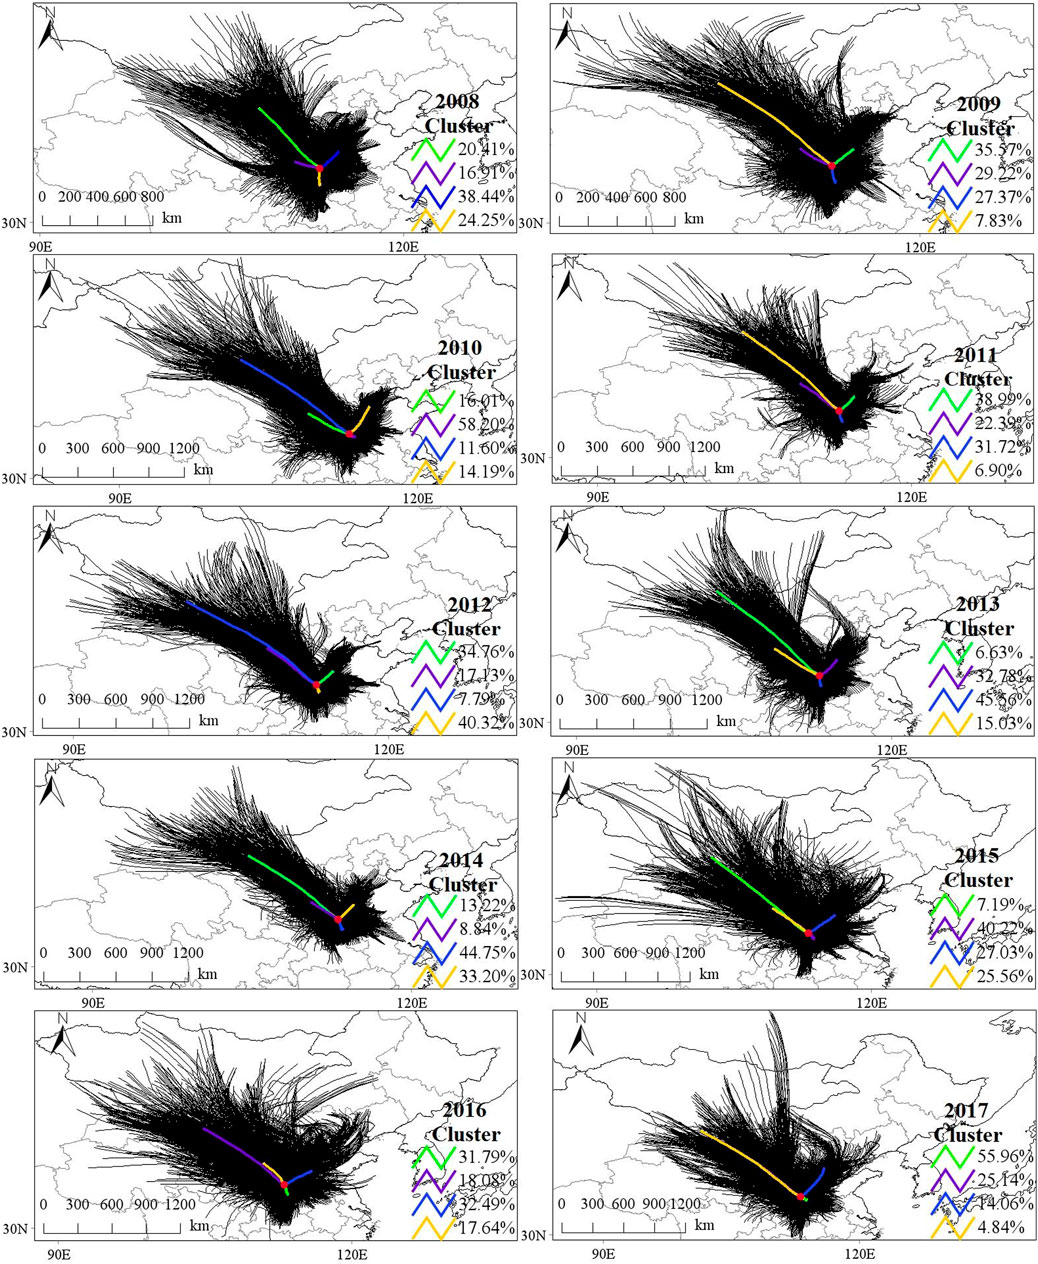
FIGURE 6. Trajectory cluster maps for Zhengzhou from 2008 to 2017.
It has been reported that the source direction and spatial distribution of air mass trajectories affecting a city can be determined by their backward trajectory, but the potential source regions and its contribution of BC cannot be identified (Yu et al., 2019). Therefore, the PSCF and CWT were used to identify potential source regions and their contribution to BC in Zhengzhou. Yu et al. reported that high PSCF and CWT values identify potential source regions of the study target region (Yu et al., 2019; Yu et al., 2020). From 2008 to 2017, Shaanxi, Shanxi and Hubei provinces and the east and southeast of Zhengzhou were the main potential contributors to BC in Zhengzhou, with a weighted PSCF of >0.5 (Figure 7). A high CWT value was also found for the same region as PSCF, with BC contributions of >8 μg m−3 (Supplementary Figure S5). Overall, the PSCF and CWT results identified the regions to the north and northwest of Henan Province—especially southeast of Shaanxi Province, south of Shanxi Province, northeast of Hubei Province, and locally in Zhengzhou—as the potential source regions of BC in Zhengzhou. Residential was the main BC emission source, contributing 59%, 46% and 39% from Hubei, Shaanxi and Henan Province, respectively, and industry (53%) in Shanxi Province based on the MEIC BC emission inventory.
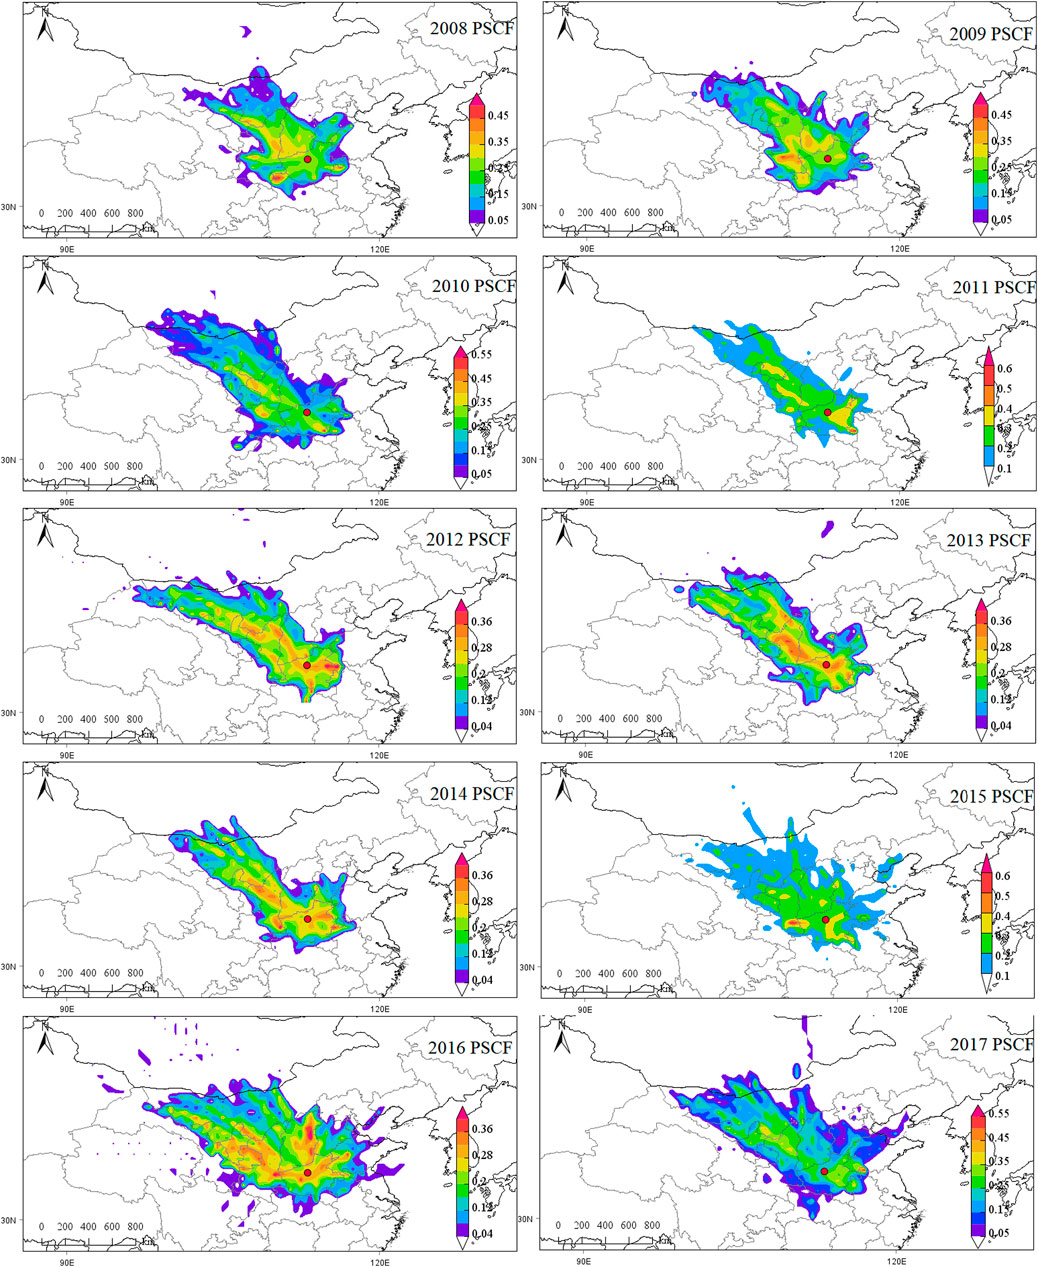
FIGURE 7. The potential source regions of BC in Zhengzhou from 2008 to 2017 based on the PSCF analysis (μg·m−3).
In this study, the historical trend variations in BC in Zhengzhou were analysed based on 1980–2020 MERRA-2 reanalysis data. The BC concentrations from the MERRA-2 reanalysis data and ground measurements were highly correlated, indicating that the MERRA-2 data could be effectively applied to reveal the long-term variations in the ground-level BC concentrations. The average annual concentration of BC in Zhengzhou from 1980 to 2020 was 6.11 ± 1.21 μg m−3, with the highest BC concentration in 2011 (7.74 μg m−3) and the lowest in 1982 (4.00 μg m−3). The BC concentration in Zhengzhou has decreased since 2007. The use of coal and coke decreased by 4% each year from 2012 to 2020, and the total BC emissions also showed a decreasing trend, which was attributable to both the adjustment of the emission control strategy in Zhengzhou and the region-wide implementation of emission control strategies. Although coal and coke consumption decreased year by year since 2012, it was still the main factor affecting the BC concentration in Zhengzhou. Additionally, BC was mainly generated by transportation since 2017 in Henan and its contribution to BC in Zhengzhou was particularly important. The significant increase in industry and residential heating in winter could explain the increase in BC concentration in winter. The backward trajectory, PSCF and CWT results suggested that the intensification of energy consumption and BC emissions in Zhengzhou and the surrounding regions of Henan Province might be the reasons for the high BC loading in Zhengzhou through regional transport.
The original contributions presented in the study are included in the article/Supplementary Material, further inquiries can be directed to the corresponding authors.
GY: Supervision, Writing—review and editing, Funding acquisition. HY: Conceptualization, Writing—original draft, Writing—review and editing. ML: Methodology, Writing—original draft, Writing—review and editing, Data curation, Visualization. XZ: Resources. SL: Resources. DY: Visualization. ML: Data curation, Writing—review and editing. PH: Writing—review.
This study was supported by the Postdoctoral Research Foundation of Henan Normal University (5101219470244), the Scientific Research Starting Foundation of Henan Normal University (5101219170828), the Henan Postdoctoral Scientific Research Project (No 202102065).
We greatly appreciate NASA GMAO providing MERRA-2 aerosol reanalysis data and Tsinghua University providing MEIC Emission Inventory.
The authors declare that the research was conducted in the absence of any commercial or financial relationships that could be construed as a potential conflict of interest.
All claims expressed in this article are solely those of the authors and do not necessarily represent those of their affiliated organizations, or those of the publisher, the editors and the reviewers. Any product that may be evaluated in this article, or claim that may be made by its manufacturer, is not guaranteed or endorsed by the publisher.
The Supplementary Material for this article can be found online at: https://www.frontiersin.org/articles/10.3389/fenvs.2022.1028572/full#supplementary-material
Bali, K., Mishra, A. K., and Singh, S. (2017). Impact of anomalous forest fire on aerosol radiative forcing and snow cover over Himalayan region. Atmos. Environ. 150, 264–275. doi:10.1016/j.atmosenv.2016.11.061
Bond, T. C., Doherty, S. J., Fahey, D. W., Forster, P. M., Berntsen, T., DeAngelo, B. J., et al. (2013). Bounding the role of black carbon in the climate system: A scientific assessment. J. Geophys. Res. Atmos. 118, 5380–5552. doi:10.1002/jgrd.50171
Boys, B. L., Martin, R. V., van Donkelaar, A., MacDonell, R. J., Hsu, N. C., Cooper, M. J., et al. (2014). Fifteen-year global time series of satellite-derived fine particulate matter. Environ. Sci. Technol. 48, 11109–11118. doi:10.1021/es502113p
Cao, M. Y., Li, W. J., Ge, P. X., Chen, M. D., and Wang, J. F. (2022). Seasonal variations and potential sources of biomass burning tracers in particulate matter in Nanjing aerosols during 2017–2018. Chemosphere 303, 135015. doi:10.1016/j.chemosphere.2022.135015
Cao, S., Duan, Y., Gao, C., Su, L., Yang, Y., Zhang, Y., et al. (2021). Changes and potential sources of atmospheric black carbon concentration in Shanghai over the past 40 Years based on MERRA-2 reanalysis data. Environ. Sci. (in chinese) 42, 2668–2678. doi:10.13227/j.hjkx.202009217
Chen, Y., Jin, G. Z., Kumar, N., and Shi, G. (2013). The promise of Beijing: Evaluating the impact of the 2008 Olympic Games on air quality. Journal of Environmental Economics and Management 66, 424–443. doi:10.1016/j.jeem.2013.06.005
Draxler, R. R., and Rolph, G. D., 2003. HYSPLIT (HYbrid single-particle Lagrangian integrated trajectory) NOAA air Resources laboratory, silver spring, MD. Available at: http://www.arl.noaa.gov/ready/hysplit4.html.
Dumka, U. C., Kaskaoutis, D. G., Tiwari, S., Safai, P. D., Attri, S. D., Soni, V. K., et al. (2018). Assessment of biomass burning and fossil fuel contribution to black carbon concentrations in Delhi during winter. Atmospheric Environment 194, 93–109. doi:10.1016/j.atmosenv.2018.09.033
Feng, J., Yu, H., Liu, S., Su, X. F., Li, Y., Pan, Y. P., et al. (2017). PM2.5 levels, chemical composition and health risk assessment in Xinxiang, a seriously air-polluted city in North China. Environ. Geochem. Health 39, 1071–1083. doi:10.1007/s10653-016-9874-5
Feng, J., Yu, H., Mi, K., Su, X., Chen, Y., Sun, J.-H., et al. (2018). The pollution characteristics of PM2.5 and correlation analysis with meteorological parameters in xinxiang during the Shanghai cooperation organization Prime Ministers' meeting. Environ. Geochem. Health 40, 1067–1076. doi:10.1007/s10653-017-9976-8
Gelaro, R., McCarty, W., Suarez, M. J., Todling, R., Molod, A., Takacs, L., et al. (2017). The Modern-Era retrospective analysis for research and applications, version 2 (MERRA-2). J. Clim. 30, 5419–5454. doi:10.1175/jcli-d-16-0758.1
Gustafsson, O., and Ramanathan, V. (2016). Convergence on climate warming by black carbon aerosols. Proc. Natl. Acad. Sci. U. S. A. 113, 4243–4245. doi:10.1073/pnas.1603570113
Isley, C. F., Nelson, P. F., Taylor, M. P., Mani, F. S., Maata, M., Atanacio, A., et al. (2017). PM2.5 and aerosol black carbon in Suva, Fiji. Atmospheric Environment 150, 55–66. doi:10.1016/j.atmosenv.2016.11.041
Jing, A., Zhu, B., Ding, D., Zhao, D., Yan, S., Dai, M., et al. (2019). Characteristics and source apponionment of black carbon in the yangtze river DeIta region of China. China Environmental Science 39, 3585–3594. (in chinese).
Karaca, F., Anil, I., and Alagha, O. (2009). Long-range potential source contributions of episodic aerosol events to PM10 profile of a megacity. Atmospheric Environment 43 (36), 5713–5722. doi:10.1016/j.atmosenv.2009.08.005
Li, B., Gasser, T., Ciais, P., Piao, S., Tao, S., Balkanski, Y., et al. (2016). The contribution of China's emissions to global climate forcing. Nature 531, 357–361. doi:10.1038/nature17165
Liakakou, E., Kaskaoutis, D. G., Grivas, G., Stavroulas, I., Tsagkaraki, M., Paraskevopoulou, D., et al. (2020). Long-term Brown carbon spectral characteristics in a Mediterranean city (Athens). Science of the Total Environment 708, 135019. doi:10.1016/j.scitotenv.2019.135019
Liu, X., Zhang, X., Schnelle-Kreis, J., Jakobi, G., Cao, X., Cyrys, J., et al. (2021). Spatiotemporal characteristics and driving factors of black carbon in augsburg, Germany: Combination of mobile monitoring and street view images. Environ. Sci. Technol. 55, 160–168. doi:10.1021/acs.est.0c04776
Lund, M. T., and Berntsen, T. (2012). Parameterization of black carbon aging in the OsloCTM2 and implications for regional transport to the Arctic. Atmos. Chem. Phys. 12, 6999–7014. doi:10.5194/acp-12-6999-2012
Luo, L., Tian, H., Liu, H., Bai, X., Liu, W., Liu, S., et al. (2021). Seasonal variations in the mass characteristics and optical properties of carbonaceous constituents of PM2.5 in six cities of North China. Environmental Pollution 268, 115780. doi:10.1016/j.envpol.2020.115780
Mao, Y.-H., Liao, H., Han, Y., and Cao, J. (2016). Impacts of meteorological parameters and emissions on decadal and interannual variations of black carbon in China for 1980-2010. J. Geophys. Res. Atmos. 121, 1822–1843. doi:10.1002/2015jd024019
Ni, M., Huang, J., Lu, S., Li, X., Yan, J., and Cen, K. (2014). A review on black carbon emissions, worldwide and in China. Chemosphere 107, 83–93. doi:10.1016/j.chemosphere.2014.02.052
Pani, S. K., Wang, S. H., Lin, N. H., Chantara, S., Lee, C. T., and Thepnuan, D. (2020). Black carbon over an urban atmosphere in northern peninsular Southeast Asia: Characteristics, source apportionment, and associated health risks. Environmental Pollution 259, 113871. doi:10.1016/j.envpol.2019.113871
Peng, X., Liu, M., Zhang, Y., Meng, Z., Achal, V., Zhou, T., et al. (2019). The characteristics and local-regional contributions of atmospheric black carbon over urban and suburban locations in Shanghai, China. Environmental Pollution 255, 113188. doi:10.1016/j.envpol.2019.113188
Qin, W., Zhang, Y., Chen, J., Yu, Q., Cheng, S., Li, W., et al. (2019). Variation, sources and historical trend of black carbon in Beijing, China based on ground observation and MERRA-2 reanalysis data. Environmental Pollution 245, 853–863. doi:10.1016/j.envpol.2018.11.063
Ren, B., Xie, P. H., Xu, J., Li, A., Tian, X., Hu, Z, K., et al. (2021). Use of the PSCF method to analyze the variations of potential sources and transports of NO2, SO2, and HCHO observed by MAX-DOAS in Nanjing, China during 2019. Science of the Total Environment 782, 146865. doi:10.1016/j.scitotenv.2021.146865
Rolph, G. D., 2003. Real-time environmental applications and display system (READY) NOAA air Resources laboratory, silver spring, MD. Available at: http://www.arl.noaa.gov/ready/hysplit4.html.
Schwarz, J., Cusack, M., Karban, J., Chalupnıckova, E., Havranek, V., Smolık, J., et al. (2016). PM2.5 chemical composition at a rural background site in central Europe, including correlation and air mass back trajectory analysis. Atmospheric Research 176, 108–120. doi:10.1016/j.atmosres.2016.02.017
Singh, V., Ravindra, K., Sahu, L., and Sokhi, R. (2018). Trends of atmospheric black carbon concentration over the United Kingdom. Atmospheric Environment 178, 148–157. doi:10.1016/j.atmosenv.2018.01.030
Song, S., Wu, Y., Xu, J., Ohara, T., Hasegawa, S., Li, J., et al. (2013). Black carbon at a roadside site in Beijing: Temporal variations and relationships with carbon monoxide and particle number size distribution. Atmospheric Environment 77, 213–221. doi:10.1016/j.atmosenv.2013.04.055
Song, Z., Fu, D., Zhang, X., Wu, Y., Xia, X., He, J., et al. (2018). Diurnal and seasonal variability of PM2.5 and AOD in North China plain: Comparison of MERRA-2 products and ground measurements. Atmospheric Environment 191, 70–78. doi:10.1016/j.atmosenv.2018.08.012
Stein, A. F., Draxler, R. R., Rolph, G. D., Stunder, B. J. B., Cohen, M. D., and Ngan, F. (2015). NOAA’s HYSPLIT atmospheric transport and dispersion modeling system. Bulletin of the American Meteorological Society 96 (12), 2059–2077. doi:10.1175/bams-d-14-00110.1
Wang, C. J., Hui, F., Gao, Y., Wang, Z. W., and Zhang, X. S. (2021). Temporal variation of speciated atmospheric Hg and characteristics of size-fractioned HgP at a suburban site in Shijiazhuang City, North China. Atmospheric Pollution Research 12 (12), 101253. doi:10.1016/j.apr.2021.101253
Wang, H., Nie, L., Liu, D., Gao, M., Wang, M., and Hao, Z. (2015). Physico-chemical characterization and source tracking of black carbon at a suburban site in Beijing. Journal of Environmental Sciences 33, 188–194. doi:10.1016/j.jes.2015.05.001
Wang, Q., Huang, R. J., Cao, J., Tie, X., Shen, Z., Zhao, S., et al. (2016). Contribution of regional transport to the black carbon aerosol during winter haze period in Beijing. Atmospheric Environment 132, 11–18. doi:10.1016/j.atmosenv.2016.02.031
Wang, Q., Jiang, N., Yin, S., Li, X., Yu, F., Guo, Y., et al. (2017). Carbonaceous species in PM 2.5 and PM 10 in urban area of Zhengzhou in China: Seasonal variations and source apportionment. Atmospheric Research 191, 1–11. doi:10.1016/j.atmosres.2017.02.003
Wang, T., Nie, W., Gao, J., Xue, L. K., Gao, X. M., Wang, X. F., et al. (2010). Air quality during the 2008 beijing olympics: Secondary pollutants and regional impact. Atmos. Chem. Phys. 10, 7603–7615. doi:10.5194/acp-10-7603-2010
Wang, Y. Q., Zhang, X. Y., and Draxler, R. R. (2009). TrajStat: GIS-based software that uses various trajectory statistical analysis methods to identify potential sources from long-term air pollution measurement data. Environ. Model. Softw. 24 (8), 938–939. doi:10.1016/j.envsoft.2009.01.004
Wei, C., Wang, M. H., Fu, Q. Y., Dai, C., Huang, R., and Bao, Q. (2020). Temporal characteristics and potential sources of black carbon in megacity Shanghai, China. J. Geophys. Res. Atmos. 125. doi:10.1029/2019jd031827
Xing, C. Z., Liu, C., Hong, Q. Q., Liu, H. Y., Wu, H. Y., Lin, J., et al. (2022). Vertical distributions and potential sources of wintertime atmospheric pollutants and the corresponding ozone production on the coast of Bohai Sea. Journal of Environmental Management 319, 115721. doi:10.1016/j.jenvman.2022.115721
Xu, X., Yang, X., Zhu, B., Tang, Z., Wu, H., and Xie, L. (2020). Characteristics of MERRA-2 black carbon variation in east China during 2000–2016. Atmospheric Environment 222, 117140. doi:10.1016/j.atmosenv.2019.117140
Yu, H., Feng, J., Su, X., Li, Y., and Sun, J. (2020). A seriously air pollution area affected by anthropogenic in the central China: Temporal-spatial distribution and potential sources. Environ. Geochem. Health 42, 3199–3211. doi:10.1007/s10653-020-00558-7
Yu, H., Yang, W., Wang, X., Yin, B., Zhang, X., Wang, J., et al. (2019). A seriously sand storm mixed air-polluted area in the margin of Tarim Basin: Temporal-spatial distribution and potential sources. Science of the Total Environment 676, 436–446. doi:10.1016/j.scitotenv.2019.04.298
Yuan, X., and Zuo, J. (2011). Transition to low carbon energy policies in China—From the five-year plan perspective. Energy Policy 39, 3855–3859. doi:10.1016/j.enpol.2011.04.017
Zhang, X., Rao, R., Huang, Y., Mao, M., Berg, M. J., and Sun, W. (2015). Black carbon aerosols in urban central China. Journal of Quantitative Spectroscopy and Radiative Transfer 150, 3–11. doi:10.1016/j.jqsrt.2014.03.006
Zhang, Y., Chen, J., Yang, H., Li, R., and Yu, Q. (2017). Seasonal variation and potential source regions of PM2.5-bound PAHs in the megacity Beijing, China: Impact of regional transport. Environmental Pollution 231, 329–338. doi:10.1016/j.envpol.2017.08.025
Zhao, J., Liu, Y., Shan, M., Liang, S., Cui, C., Chen, L., et al. (2021). Characteristics, potential regional sources and health risk of black carbon based on ground observation and MERRA-2 reanalysis data in a coastal city, China. Atmospheric Research 256, 105563. doi:10.1016/j.atmosres.2021.105563
Keywords: black carbon, historical trend, emission inventory, potential source region, regional transport
Citation: Yan G, Yu H, Li M, Zheng X, Li S, Yao D, Liu M and Hu P (2022) Pollution characteristics of black carbon based on MERRA-2 reanalysis data in core city of Central Plains Economic Zone, China: Historical trend and potential sources. Front. Environ. Sci. 10:1028572. doi: 10.3389/fenvs.2022.1028572
Received: 26 August 2022; Accepted: 28 October 2022;
Published: 11 November 2022.
Edited by:
Tirthankar Banerjee, Banaras Hindu University, IndiaReviewed by:
Xiaofeng Xu, Nanjing University of Information Science and Technology, ChinaCopyright © 2022 Yan, Yu, Li, Zheng, Li, Yao, Liu and Hu. This is an open-access article distributed under the terms of the Creative Commons Attribution License (CC BY). The use, distribution or reproduction in other forums is permitted, provided the original author(s) and the copyright owner(s) are credited and that the original publication in this journal is cited, in accordance with accepted academic practice. No use, distribution or reproduction is permitted which does not comply with these terms.
*Correspondence: Hao Yu, eXVoYW9AaHR1LmVkdS5jbg==; Menglin Liu, bGl1bWVuZ2xpbkBodHUuZWR1LmNu
†These authors have contributed equally to this work and share first authorship
Disclaimer: All claims expressed in this article are solely those of the authors and do not necessarily represent those of their affiliated organizations, or those of the publisher, the editors and the reviewers. Any product that may be evaluated in this article or claim that may be made by its manufacturer is not guaranteed or endorsed by the publisher.
Research integrity at Frontiers
Learn more about the work of our research integrity team to safeguard the quality of each article we publish.