 Yixuan Wu
 Yuying Wang
 Yuquan Zhou2*
 Zhanqing Li
94% of researchers rate our articles as excellent or good
Learn more about the work of our research integrity team to safeguard the quality of each article we publish.
Find out more
ORIGINAL RESEARCH article
Front. Environ. Sci., 04 October 2022
Sec. Atmosphere and Climate
Volume 10 - 2022 | https://doi.org/10.3389/fenvs.2022.1027902
In this study, the impact of artificial precipitation enhancement operation on the wet scavenging of air pollutants is investigated based on an aircraft precipitation enhancement operation in the Yangtze River Delta region of China on 1 November 2020. Multiple measurement data are used, including the regional meteorological and environmental data and the comprehensive field observation data at the Nanjing University of Information Science and Technology (NUIST) campus site. The results show that the affected areas of this operation cover part of Anhui and Jiangsu provinces. The precipitation ratio between the target and contrast areas is always greater than 1, indicating the effectiveness of the seeding operation of silver iodide for precipitation enhancement. The regional analysis of air pollutants suggests that the enhanced precipitation can prevent the increase of air pollutants, especially for the particulate matter. The impact of enhanced precipitation on regional trace gases is complex because they are easily affected by the primary emissions. More data analysis at NUIST indicates that two cloud layers appear before the precipitation and merge into one thick cloud layer during the precipitation likely due to the impact of catalysis operation on the upper cloud. After the precipitation, the number concentration of aerosols with a diameter lower than 300 nm reduces significantly, the mass concentration of particulate matter with an aerodynamic diameter less than 2.5 μm decreases by about 39%, and the mass concentrations of nitrogen dioxide, sulfur dioxide, and carbon monoxide also decrease in different degrees. These results indicate that it is effective to reduce air pollutants by artificial precipitation enhancement. More studies are needed in the future.
In recent years, air pollution has attracted much attention because of its significant impact on climate, environment, and human health (e.g., Li et al., 2019; Ma et al., 2021). Air pollution can cause considerable morbidity and is one of the reasons for a significant number of premature deaths each year. Air pollutants can be divided into gaseous and particulate matters (i.e., aerosol). Aerosol can affect the upper respiratory tract, causing mucosal irritation and cough. Ultrafine aerosols can easily cross the alveolar-capillary membrane and enter the bloodstream, inducing oxidative stress and inflammation after inhalation, and increase the risk of non-communicable chronic diseases affecting the brain, lungs, heart, and so on (e.g., Chen et al., 2022). Previous studies suggest that premature death caused by particulate matter with an aerodynamic diameter less than 2.5 μm (PM2.5) accounts for 6.54%–7.79% of all global deaths (e.g., Maji, 2020; Yang et al., 2022). In addition, long-term exposure to gaseous pollutants, such as carbon monoxide (CO2), ozone (O3), and nitrogen dioxide (NO2), will lead to asthma and other diseases (e.g., Gasana et al., 2012). With people’s more attention to the environmental and health effects of air pollution, the monitoring, forecasting, and prevention of air pollutants have become a hot issue.
In order to solve the problem of air pollution, it is necessary to seek more prevention and control measures. The factors affecting the concentration of air pollutants are various. The wet scavenging of air pollutants by precipitation is one of the most effective methods. Wet scavenging of aerosols can be divided into intra-cloud scavenging and below-cloud scavenging (e.g., Roy et al., 2019; Ge et al., 2021; Jones et al., 2022; Jung et al., 2022). The intra-cloud scavenging means that aerosols in the atmosphere can act as cloud condensation nuclei to form cloud droplets, or can be coagulated by cloud droplets during cloud development processes. The below-cloud scavenging refers to the coagulation occurring during cloud precipitation processes (e.g., Henzing et al., 2006; Seinfeld and Pandis, 2006; Chate et al., 2011; Bourcier et al., 2012; Hao et al., 2017).
Some studies find that the scavenging efficiency of precipitation on air pollutants is related to the precipitation amount, duration, and raindrop size distribution (e.g., Chate, 2005; Li et al., 2016; Luan et al., 2019; Zhao et al., 2020). Tai et al. (2010) find that precipitation amount is negatively correlated with PM2.5 and its chemical components. Yoo et al. (2014) analyze the relationships between the precipitation amount and several air pollutants in Korea by defining three new washout indices: absolute washout index, relative washout index, and the negative correlation fraction. It is found that all air pollutants have negative correlations with the precipitation amount but the influence degrees are different. It is also found that the influence of precipitation on the concentration of air pollutants is in the following order: PM10 (particulate matter with an aerodynamic diameter less than 10 μm)> SO2 (sulfur dioxide)> NO2>CO (carbon monoxide)> O3. Long et al. (2020) indicate that persistent light rain can significantly reduce PM2.5, PM10, SO2, and NO2 except for O3, but there is an upper limit of the impact of light rain on air pollutants. The scavenging efficiency of air pollutants by precipitation is also limited by the concentrations of air pollutants before precipitation. Olszowski. (2016) suggest that the scavenging efficiency is weaker in areas with a low concentration of air pollutants than those with a high concentration of air pollutants. These studies suggest that the precipitation is effective to scavenge multiple air pollutants, which can be enhanced by cloud seeding through increasing precipitation amount or duration.
By seeding artificial nuclei (such as hygroscopic nuclei or ice nuclei) in the cloud, the microphysical processes of clouds can be changed, then the precipitation intensity or duration can be enhanced in a certain region, which is called artificial precipitation enhancement. This seeding operation is also called “cloud catalysis.” For example, the seeding of silver iodide (AgI) and dry ice in cold clouds can promote the formation of ice crystals. The increased ice crystals can grow to large droplets through the Bergeron and the collision coalescence processes. Finally, more conversions from cloud droplets to raindrops make more precipitations (e.g., Mason, 1978; Dennis, 1980; Tonttila et al., 2021). More and more studies suggest that cloud seeding is effective to the enhancement of precipitation (e.g., Zheng et al., 2020; Dong et al., 2021). As an example, Wang et al. (2021a) analyze the effect of a cloud seeding operation on precipitation using the observation results of radar, satellite, and raindrop spectrometer. It is found that the AgI seeding significantly influences the cloud and precipitation. From the satellite image, the falling ice crystals produce a “trench” in the cloud, and the enhanced surface rainfall is observed after seeding.
As discussed above, precipitation has an important scavenging effect on air pollutants and the precipitation can be enhanced through the cloud seeding operation. To our knowledge, so far there are no studies about the impact of artificial precipitation enhancement on the scavenging of air pollutants. Since 2018, the Weather Modification Centre (WMC), China Meteorological Administration (CMA) conducts some precipitation enhancement experiments to improve air quality in the Yangtze River Delta. This study investigates for the first time the impact of artificial precipitation enhancement on the scavenging of air pollutants based on one case on 1 November 2020, using multiple data. The results presented in this study affirms the feasibility of reducing air pollutants through artificial precipitation enhancement, which is meaningful for future air pollution prevention and control.
The hourly precipitation (unit: mm) and wind data are measured by the CMA meteorological stations (data sources: http://data.cma.cn/site/index.html). Air quality data are measured by the Chinese Ministry of Ecology and Environment network (data source: http://www.cnemc.cn/), including the data of PM2.5, PM10, SO2, NO2, O3, and CO. The units of PM2.5, PM10, SO2, NO2, and O3 are in micrograms per cubic meter (μg/m3), and that of CO is in milligrams per cubic meter (mg/m3).
More data on aerosol, cloud, and precipitation are measured at a supersite on the campus of Nanjing University of Information Science & Technology (NUIST). The instruments used in this study at NUIST are listed in Table 1. At this site, a Parsivel disdrometer is used to measure precipitation properties and several gas analyzers are used to measure the mass concentrations of SO2, NO2, O3, and CO (model 43i, 42i, 49i, and 48i, respectively). The droplet size range measured by the Parsivel disdrometer is 0.062–24.5 mm. Moreover, a Ka-band millimeter wave cloud measuring radar (MWCMR), an aerosol chemical species monitor (ACSM), and a scanning mobility particle sizer (SMPS) equipped with a long differential mobility analyzer (DMA, model 3081L) and a condensation particle counter (model 3,775) are used to measure cloud macroscopic and microphysical properties and aerosol physicochemical properties.
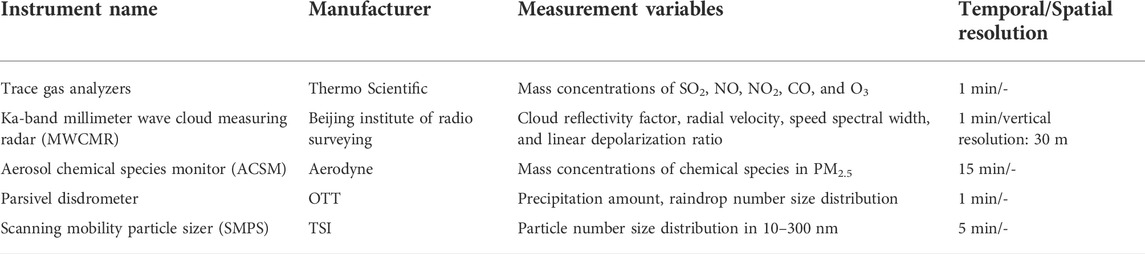
TABLE 1. Information of instruments used in this study at NUIST.
The light air pollution forms in the Yangtze River Delta before 9:00 Beijing Time (BT) on 1 November 2020 (Supplementary Figure S1). For restraining the pollution aggravation, an aircraft precipitation enhancement operation is carried out. According to the meteorological conditions, a Y-12 aircraft conducts the flight operation in Anhui province in 9:00–11:00 BT. The catalytic layer height during this operation is about 4,300 m, and the catalytic layer temperature is −5°C (zero-layer height is about 3,900 m). A total of 24 silver iodide (AgI) catalyst flame strips are burned during the flight. Supplementary Figure S2 shows the flight trajectory and the altitude of the seeding routes.
To confirm the target area of this aircraft precipitation enhancement operation, the hourly diffusion area of AgI is calculated based on the common analytical scheme (see Supplementary Text S1 in the supplement). The aircraft flights at an altitude of about 4,300 m from west to east, while the cloud system also moves from west to east (Supplementary Figure S3). The sounding data at 08:00 BT in Nanjing shows that the wind speed are about 16 m/s and the wind direction is westerly at 4,300 m altitude (Supplementary Figure S4). The hourly diffusion area of AgI is shown in Figure 1. It suggests that the diffusion area is mainly in Anhui province at 10:00–11:00 BT, then extended to Jiangsu province (including the NUIST site) after 12:00 BT. Figure 1 also suggests that the precipitation in the northern non-diffusion area becomes weaker from 10:00 to 14:00 BT, while that in the diffusion area becomes stronger.
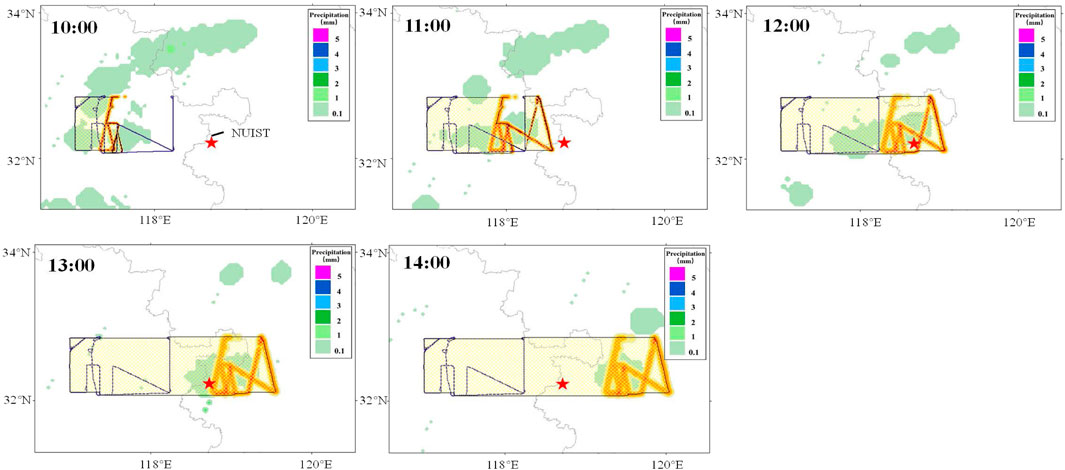
FIGURE 1. The hourly precipitation (background color, 10:00–14:00 BT) and the calculated diffusion areas of silver iodide (AgI) (yellow areas) after the seeding by the Y-12 aircraft on 1 November 2020. The blue lines show the AgI seeding track.
For verifying the effect of the catalytic operation on precipitation, the influence (target) and non-influence (contrast) areas are selected. The selection of target and contrast areas follows the principles: First, two areas are affected by the same or similar weather systems. Second, the size of the two areas should be the same and there are similar geographic features. Third, the contrast area should be selected upwind or sidewind of the target area, which is not affected by the catalytic operation. Finally, there are same observed variables (such as precipitation amount) in two areas. The selected target and contrast areas in different hours are shown in Figure 2A. The K value method (
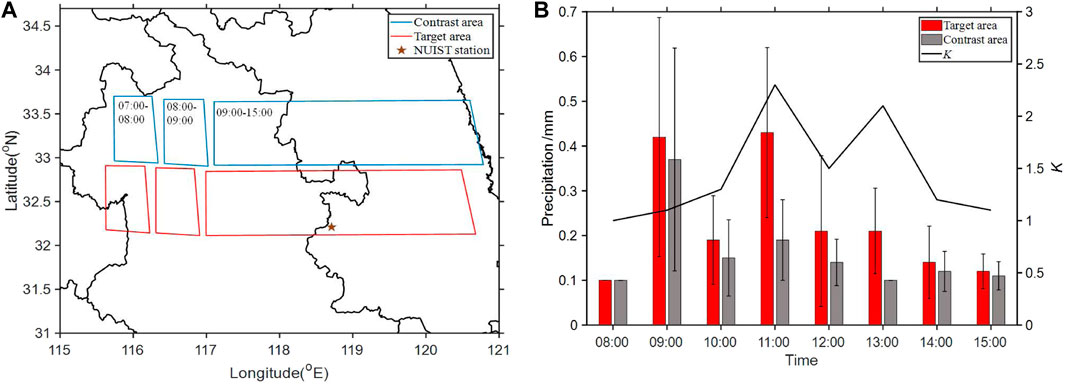
FIGURE 2. (A) Selected target and contrast areas in different hours, (B) hourly precipitations with their standard deviations (error bars) in the target and contrast areas and their ratios (K).
The comparison results of hourly precipitation between the target and contrast areas are shown in Figure 2B. It shows that the hourly precipitation amount in the two areas is similar before the catalytic operation (08:00 BT) when the K value is approximately equal to 1. During the operation period (09:00–11:00 BT), the K value increases obviously, reaching the maximum (2.3) at 11:00 BT. After that, the K value has a weak decrease at 12:00 BT and then increases to the second peak (2.1) at 13:00 BT. After 13:00 BT, the K value gradually decreases but is still larger than 1. Overall, the K value is significantly greater than 1 during and after the catalytic operation, verifying that this operation has an enhancement effect on the precipitation.
To study the influence of precipitation on air pollutants, it is necessary to compare the change of air pollutants in the target and contrast areas. The data of air pollutants with high quality is from the measurements in the environmental monitoring stations.
As discussed above, the precipitation is enhanced by the catalytic operation in the target areas. The mass concentrations of several air pollutants (PM2.5, PM10, SO2, NO2, and CO) between the target and contrast areas are compared before (0:00–07:00 BT, 08:00 BT data missing), during (9:00–11:00 BT), and after (12:00–15:00 BT and 16:00–24:00 BT) the operation (Table 2 and Supplementary Figure S5). It shows that the average PM2.5 mass concentration in the target area is slightly lower than that in the contrast area before and during the operation period (38.50 vs. 43.56 μg/m3, and 50.73 vs. 58.88 μg/m3), PM2.5 increases in two areas likely due to the daytime atmospheric chemical reactions but the increase in the target area is much lower than that in the contrast area during and after the operation. PM10 has similar trends during these periods. These results suggest that the enhanced precipitation by the catalytic operation has a good negative effect on the regional accumulation of aerosols, which is likely caused by the wet scavenging of enhanced precipitation in the target area.
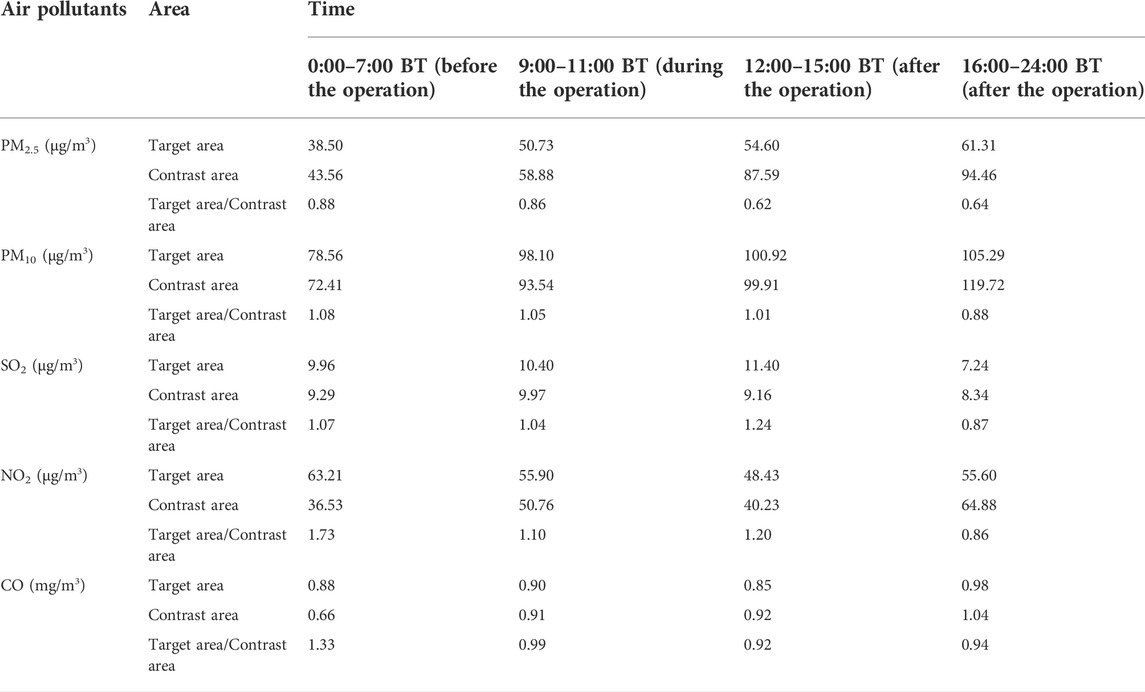
TABLE 2. The concentrations of air pollutants in the target and contrast areas and their ratios.
The variations in trace gas concentrations between the two areas are different. The mass concentrations of SO2, NO2, and CO are larger in the target area than those in the contrast area before the operation (Table 2 and Supplementary Figure S5). During the operation, the ratios of their concentrations between the target and contrast areas reduce rapidly. After the operation, the ratios of SO2 and NO2 have an increase during 12:00–15:00 BT. This is likely because there are more primary emissions of SO2 and NO2 in the target area. However, during 16:00–24:00 BT, the concentrations of SO2 and NO2 in the target area are lower than those in the contrast area. The mass concentration of CO is higher in the target area than that in the contrast area before the operation, indicating more CO emission in the target area. The variation of CO ratio between two areas during and after the operation (always lower than 1) is different from these of SO2 and NO2. This means that CO mass concentration is always lower in the target area than that in the contrast area, implying some effective scavenging of precipitation on CO (Yoo et al., 2014).
In summary, enhanced precipitation can reduce the regional air pollutants, especially for the particulate mattes (PM2.5 and PM10). However, the impact on regional trace gases is complex because some trace gases are simultaneously affected by the enhanced primary emissions in the daytime.
To further investigate the role of enhanced precipitation on the removal of different air pollutants, more measurement data at NUISTare used to study this effect. Bivariate polar plots by different wind speeds and directions for different air pollutants (PM2.5, NO2, SO2, and O3) are shown in Figure 3, which can be used to analyze potential sources of air pollutants (Carslaw and Beevers, 2013). It shows that high mass concentrations of SO2 are mainly from the transport by westerly winds (Figure 3C), but high concentrations of PM2.5, NO2, and O3 are from the combined effect of local sources and the transport (Figures 3A,C,D). However, different pollutants are transported in different directions. High PM2.5 is associated with high northwesterly winds. High NO2 is related to the southwesterly or westerly winds. There are highways and railroads to the west and a high way to the east of NUIST, which are responsible for the high NO2. High O3 concentrations are mainly in the southeasterly and northerly winds. More industrial emissions may play an important role in the O3 formation in these directions (Trainer et al., 2000; Tan et al., 2018; Yao et al., 2021). All these suggest that the NUIST site is affected by regional pollution sources.
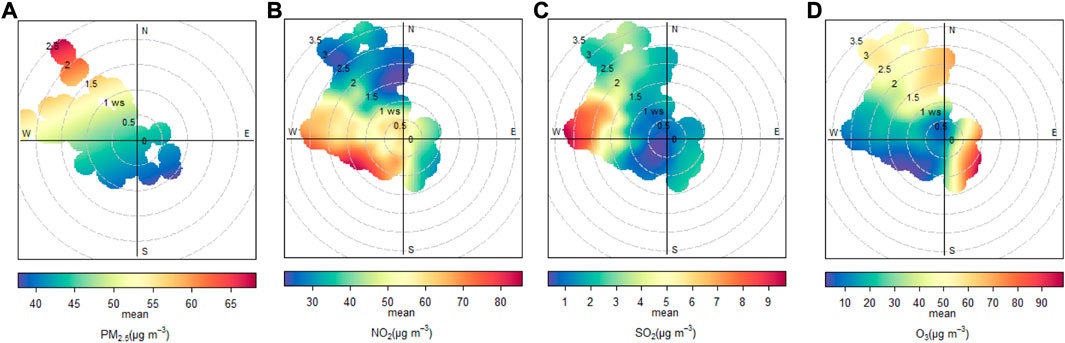
FIGURE 3. Bivariate polar plots by different wind speeds (unit: m/s) and directions for (A) PM2.5, (B) NO2, (C) SO2 and (D) O3 at NUIST on 1 November 2020.
Supplementary Figure S6 in the supplement suggests that the prevailing wind at NUIST during the day is northwest westerly, and the wind speed is always smaller than 2 m/s. It means the small influence of winds on the removal of air pollutants due to the weak winds. Figure 4A shows the cloud reflectivity factor measured by the Ka-band Millimeter Wave Cloud Measuring Radar (MWCMR) at NUIST. It suggests that two cloud layers appear before 12:00 BT with the upper layer at the height of 4–6 km and its reflectivity factor in the range from −25 to −10 dBZ, and the lower layer at around 2 km and its reflectivity factor in the range from −25 to 0 dBZ.
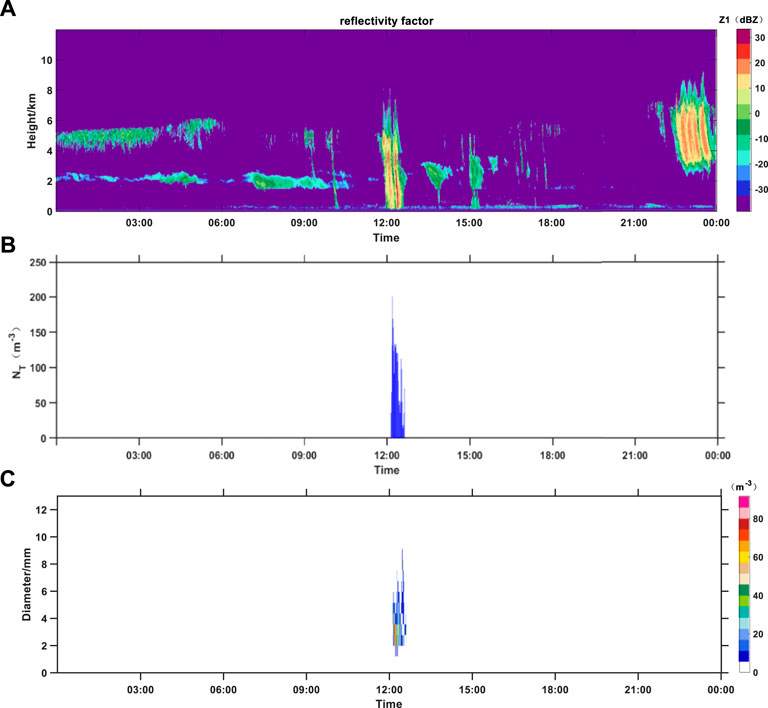
FIGURE 4. Time series of (A) the cloud reflectivity factor detected by the MWCMR, (B) the total number concentration (
Figures 4B,C depict the time series of the total number concentration (
Figure 5A shows the time series of aerosol particle number size distribution (PNSD) in 10–300 nm measured by the scanning mobility particle sizer (SMPS) at NUIST. In general, the number concentration and the size of particles increase obviously before 12:00 BT. This is attributed to the accumulation of particles due to the weak diffusion condition (low winds) and the enhanced anthropogenic emissions in the daytime (Wang et al., 2017). When the precipitation starts, the number concentration of particles in all sizes reduces sharply, implying the strong wet scavenging of precipitation on the fine particles. After the precipitation, particles accumulate again after 16:00 BT.
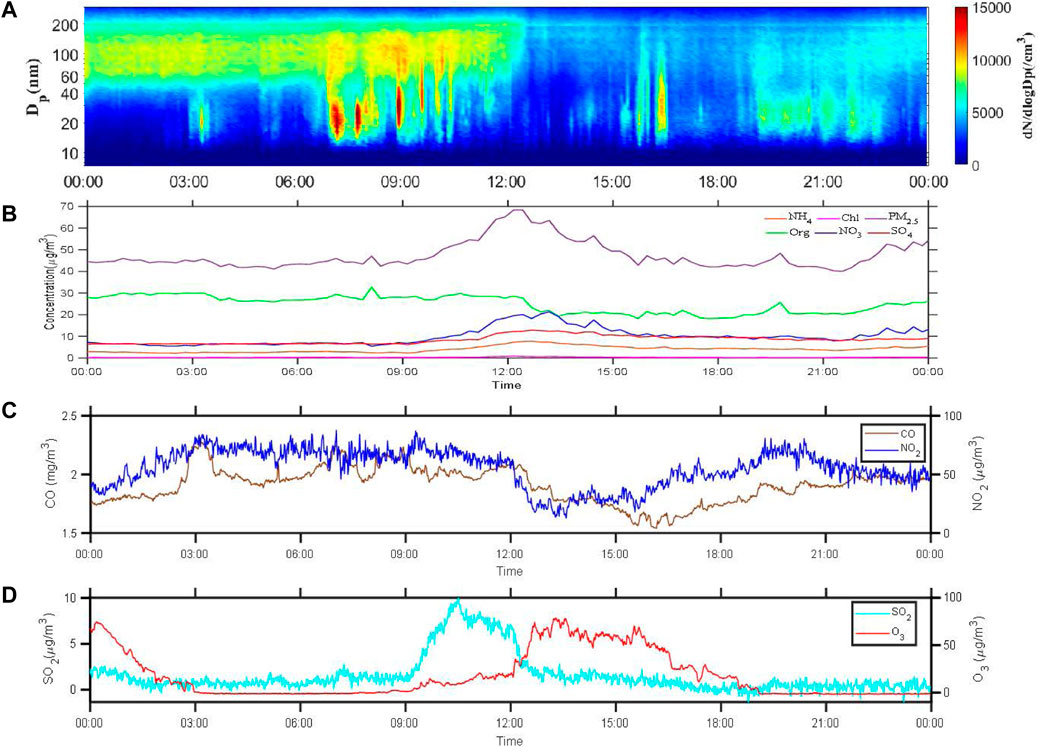
FIGURE 5. Time series of (A) particle number size distribution in 10–300 nm measured by SMPS, the mass concentrations of (B) PM2.5 and its chemical species measured by ACSM, (C) CO, NO2, (D) SO2, and O3 measured by trace gas analyzer at NUIST on 1 November 2020.
The time series of the mass concentrations of PM2.5 and its chemical species at NUIST measured by the aerosol chemical species monitor (ACSM) are shown in Figure 5B. It depicts that the mass concentration of PM2.5 increases before 12:00 BT and decreases after the precipitation, which is consistent with the measurement of PNSD. It also shows that the mass concentrations of organics (Org) and nitrate (
Figures 5C,D show the time series of SO2, NO2, O3, and CO mass concentrations at NUIST. They indicate that NO2 and CO mass concentrations remain at high levels before 12:00 BT, with NO2 at around 70 μg/m3 and CO at around 2 mg/m3. SO2 mass concentration remains at a relatively low value before 09:00 BT but increases to ∼7 μg/m3 at 12:00 BT due to the enhanced anthropogenic emission in the daytime. After the precipitation, all the mass concentrations of SO2, NO2, and CO reduce sharply, with NO2 mass concentration reducing to about 17 μg/m3, a reduction percentage of about 75%, CO mass concentration reducing to about 1.5 mg/m3, a reduction percentage of 25%, and SO2 mass concentration reducing to about 2 μg/m3, a reduction percentage of about 70%. This suggests the effective wet scavenging of enhanced precipitation on these trace gases. However, O3 mass concentration increases obviously after the precipitation, suggesting that the low impact of precipitation on O3 and other factors (such as photochemical reactions) play more important roles in the variation of O3. Wang et al. (2021b) suggest that O3 can increase induced by the decrease of NO2 due to the O3-titration effect. In this case, the precipitation can scavenge NO2, promoting the formation of O3.
In summary, the precipitation induced by the catalytic operation has a good removal effect on most of the air pollutants except O3.
This study analyzes the effect of enhanced precipitation on the scavenging of air pollutants based on an aircraft precipitation enhancement operation in the Yangtze River Delta region of China on 1 November 2020. The calculation of the common analytical scheme about the AgI diffusion suggests that the catalytic operation implemented by a Y-12 aircraft influences part of Anhui and Jiangsu provinces. Target and contrast areas are selected to validate the effectiveness of artificial precipitation enhancement and analyze its effect on the concentrations of air pollutants.
The K value of precipitation amount between target and contrast areas is significantly greater than 1 during and after the catalytic operation, indicating that this operation has an enhancement effect on the precipitation. The analysis of regional air pollutants suggests that PM2.5 and PM10 increase after the operation likely due to the daytime atmospheric chemical reactions, but the increase in the target area is much lower than that in the contrast area. Compared to particulate matters, trace gases are easily affected by primary emissions. The results suggest that the ratios of SO2 and NO2 mass concentrations between target and contrast areas reduce rapidly during the operation but increase after the operation, suggesting more primary emissions of SO2 and NO2 in target areas. However, CO mass concentration is always lower in the target area than that in the contrast area during and after the operation, implying the effective scavenging of enhanced precipitation on CO.
More data in this case are measured at the supersite of NUIST. They suggest that the NUIST site is affected by regional pollution sources. Two cloud layers appear before the precipitation and merge to one thick cloud layer during the enhanced precipitation likely due to the impact of catalysis operation on the upper cloud layer. The precipitation is efficient in removing fine particles with diameters ranging from 10 to 300 nm. Meanwhile, the mass concentration of PM2.5, organics, and nitrate also decrease obviously during and after the precipitation, indicating the large impact of precipitation on these particulate matters. The mass concentrations of SO2, NO2, and CO also decrease sharply after the precipitation. However, the mass concentration of O3 increases, suggesting that other factors (such as photochemical reactions or the O3-titration effect) play more important roles on O3 concentration.
The above results indicate that the precipitation enhancement induced by the artificial catalytic operation can scavenge some air pollutants, and then restrain the development of air pollution event. However, all the analyses are based on one case study. More studies are needed in the future.
The raw data supporting the conclusion of this article will be made available by the authors, without undue reservation.
YXW: conceptualization, analysis of data, and writing original draft; YYW: supervision, conceptualization, and writing-review and editing; YZ: conceptualization and writing review and editing; XL, YT, YW, RZ, and ZL: review and editing.
This study is supported by the CMA’s innovative development project (no. CXFZ 2021J039), the National Natural Science Foundation of China (NSFC) research projects (grant nos. 42030606, 42005067, and 92044303), and the National Key Research and Development Program of China (no. 2016YFA0601700).
We thank the weather modification center (WMC), China meteorological administration (CMA) for providing meteorological data and information about the artificial precipitation enhancement operation. We also thank the CMA integrated meteorological observation and training center (Nanjing) for providing the disdrometer observation data.
The authors declare that the research was conducted in the absence of any commercial or financial relationships that could be construed as a potential conflict of interest.
All claims expressed in this article are solely those of the authors and do not necessarily represent those of their affiliated organizations, or those of the publisher, the editors and the reviewers. Any product that may be evaluated in this article, or claim that may be made by its manufacturer, is not guaranteed or endorsed by the publisher.
The Supplementary Material for this article can be found online at: https://www.frontiersin.org/articles/10.3389/fenvs.2022.1027902/full#supplementary-material
Bourcier, L., Masson, O., Laj, P., Chausse, P., Pichon, J. M., Paulat, P., et al. (2012). A new method for assessing the aerosol to rain chemical composition relationships. Atmos. Res. 118, 295–303. doi:10.1016/j.atmosres.2012.07.020
Carslaw, D. C., and Beevers, S. D. (2013). Characterising and understanding emission sources using bivariate polar plots and k-means clustering. Environ. Model. Softw. 40, 325–329. doi:10.1016/j.envsoft.2012.09.005
Chate, D. M., Murugavel, P., Ali, K., Tiwari, S., and Beig, G. (2011). Below-cloud rain scavenging of atmospheric aerosols for aerosol deposition models. Atmos. Res. 99, 528–536. doi:10.1016/j.atmosres.2010.12.010
Chate, D. M. (2005). Study of scavenging of submicron-sized aerosol particles by thunderstorm rain events. Atmos. Environ. X. 39, 6608–6619. doi:10.1016/j.atmosenv.2005.07.063
Chen, H., Oliver, B. G., Pant, A., Olivera, A., Poronnik, P., Pollock, C. A., et al. (2022). Effects of air pollution on human health – mechanistic evidence suggested by in vitro and in vivo modelling. Environ. Res. 212, 113378. doi:10.1016/j.envres.2022.113378
Dong, X., Zhao, C., Huang, Z., Mai, R., Lv, F., Xue, X., et al. (2021). Increase of precipitation by cloud seeding observed from a case study in November 2020 over Shijiazhuang, China. Atmos. Res. 262, 105766. doi:10.1016/j.atmosres.2021.105766
Gasana, J., Dillikar, D., Mendy, A., Forno, E., and Ramos Vieira, E. (2012). Motor vehicle air pollution and asthma in children: A meta-analysis. Environ. Res. 117, 36–45. doi:10.1016/j.envres.2012.05.001
Ge, B., Xu, D., Wild, O., Yao, X., Wang, J., Chen, X., et al. (2021). Inter-annual variations of wet deposition in beijing from 2014–2017: Implications of below-cloud scavenging of inorganic aerosols. Atmos. Chem. Phys. 21, 9441–9454. doi:10.5194/acp-21-9441-2021
Hao, J., Yin, Y., Kuang, X., Chen, J., Yuan, L., Xiao, H., et al. (2017). Aircraft measurements of the aerosol spatial distribution and relation with clouds over eastern China. Aerosol Air Qual. Res. 17, 3230–3243. doi:10.4209/aaqr.2016.12.0576
Henzing, J. S., Olivié, D. J. L., and Velthoven, P. F. J. (2006). A parameterization of size resolved below cloud scavenging of aerosols by rain. Atmos. Chem. Phys. 6, 3363–3375. doi:10.5194/acp-6-3363-2006
Jones, A. C., Hill, A., Hemmings, J., Lemaitre, P., Quérel, A., Ryder, C., et al. (2022). Below-cloud scavenging of aerosol by rain: A review of numerical modelling approaches and sensitivity simulations with mineral dust. Atmos. Chem. Phys. 22, 11381–11407. doi:10.5194/acp-2022-409
Jung, C. H., Lee, H., Park, D., Yoon, Y. J., Choi, Y., Um, J., et al. (2022). Parameterization of below-cloud scavenging for polydisperse fine mode aerosols as a function of rain intensity. J. Environ. Sci. doi:10.1016/j.jes.2022.07.031
Li, X., Dong, Y., Dong, Z., Du, C., and Chen, C. (2016). Observed changes in aerosol physical and optical properties before and after precipitation events. Adv. Atmos. Sci. 33, 931–944. doi:10.1007/s00376-016-5178-z
Li, Z., Wang, Y., Guo, J., Zhao, C., Cribb, M. C., Dong, X., et al. (2019). East asian study of tropospheric aerosols and their impact on regional clouds, precipitation, and climate (EAST-AIRCPC). JGR. Atmos. 124, 13026–13054. doi:10.1029/2019JD030758
Long, W., Zhou, Y., and Liu, P. (2020). Numerical simulation of the influence of major meteorological elements on the concentration of air pollutants during rainfall over Sichuan Basin of China. Atmos. Pollut. Res. 11, 2036–2048. doi:10.1016/j.apr.2020.08.019
Luan, T., Guo, X., Zhang, T., and Guo, L. (2019). Below-cloud aerosol scavenging by different-intensity rains in beijing city. J. Meteorol. Res. 33, 126–137. doi:10.1007/s13351-019-8079-0
Ma, X., Zhang, T., Ji, C., Zhai, Y., Shen, X., and Hong, J. (2021). Threats to human health and ecosystem: Looking for air-pollution related damage since 1990. Renew. Sustain. Energy Rev. 145, 111146. doi:10.1016/j.rser.2021.111146
Maji, K. J. (2020). Substantial changes in PM2.5 pollution and corresponding premature deaths across China during 2015–2019: A model prospective. Sci. Total Environ. 729, 138838. doi:10.1016/j.scitotenv.2020.138838
Olszowski, T. (2016). Changes in PM10 concentration due to large-scale rainfall. Arab. J. Geosci. 9, 160. doi:10.1007/s12517-015-2163-2
Roy, A., Chatterjee, A., Ghosh, A., Das, S. K., Ghosh, S. K., and Raha, S. (2019). Below-cloud scavenging of size-segregated aerosols and its effect on rainwater acidity and nutrient deposition: A long-term (2009–2018) and real-time observation over eastern himalaya. Sci. Total Environ. 674, 223–233. doi:10.1016/j.scitotenv.2019.04.165
Seinfeld, J. H., and Pandis, S. N. (2006). Atmospheric chemistry, and physics from air pollution to climate change. New York: John Willey & Sons, Inc.
Tai, A. P. K., Mickley, L. J., and Jacob, D. J. (2010). Correlations between fine particulate matter (PM2.5) and meteorological variables in the United States: Implications for the sensitivity of PM2.5 to climate change. Atmos. Environ. X. 44, 3976–3984. doi:10.1016/j.atmosenv.2010.06.060
Tan, Z., Lu, K., Dong, H., Hu, M., Li, X., Liu, Y., et al. (2018). Explicit diagnosis of the local ozone production rate and the ozone-NOx-VOC sensitivities. Sci. Bull. 63, 1067–1076. doi:10.1016/j.scib.2018.07.001
Tonttila, J., Afzalifar, A., Kokkola, H., Raatikainen, T., Korhonen, H., and Romakkaniemi, S. (2021). Precipitation enhancement in stratocumulus clouds through airborne seeding: Sensitivity analysis by UCLALES-SALSA. Atmos. Chem. Phys. 21, 1035–1048. doi:10.5194/acp-21-1035-2021
Trainer, M., Parrish, D. D., Goldan, P. D., Roberts, J., Fehsenfeld, F. C., Wang, J., et al. (2000). Review of observation-based analysis of the regional factors influencing ozone concentrationsThe evolution of an AgI cloud-seeding track in central China as seen by a combination of radar, satellite, and disdrometer observations. JGR. Atmos. Geophys. Res. Atmos. 34126, 2045e2020JD033914–2061. doi:10.1016/S1352-2310(99)00459-810.1029/2020JD033914
Wang, J., Yue, Z., Rosenfeld, D., Zhang, L., Zhu, Y., Dai, J., et al. (2021a). The evolution of an AgI cloud-seeding track in central China as seen by a combination of radar, satellite, and disdrometer observations. JGR. Atmos. 126, e2020J–e33914J. doi:10.1029/2020JD033914
Wang, Y., Li, Z., Wang, Q., Jin, X., Yan, P., Cribb, M., et al. (2021b). Enhancement of secondary aerosol formation by reduced anthropogenic emissions during Spring Festival 2019 and enlightenment for regional PM2.5 control in Beijing. Atmos. Chem. Phys. 21, 915–926. doi:10.5194/acp-21-915-2021
Wang, Y., Zhang, F., Li, Z., Tan, H., Xu, H., Ren, J., et al. (2017). Enhanced hydrophobicity and volatility of submicron aerosols under severe emission control conditions in Beijing. Atmos. Chem. Phys. 17, 5239–5251. doi:10.5194/acp-17-5239-2017
Yang, X., Wang, Y., Zhao, C., Fan, H., Yang, Y., Chi, Y., et al. (2022). Health risk and disease burden attributable to long-term global fine-mode particles. Chemosphere 287, 132435. doi:10.1016/j.chemosphere.2021.132435
Yao, S., Wang, Q., Zhang, J., Zhang, R., Gao, Y., Zhang, H., et al. (2021). Ambient volatile organic compounds in a heavy industrial city: Concentration, ozone formation potential, sources, and health risk assessment. Atmos. Pollut. Res. 12, 101053. doi:10.1016/j.apr.2021.101053
Yoo, J., Lee, Y., Kim, D., Jeong, M., Stockwell, W. R., Kundu, P. K., et al. (2014). New indices for wet scavenging of air pollutants (O3, CO, NO2, SO2, and PM10) by summertime rain. Atmos. Environ. X. 82, 226–237. doi:10.1016/j.atmosenv.2013.10.022
Zhao, X., Sun, Y., Zhao, C., and Jiang, H. (2020). Impact of precipitation with different intensity on PM2.5 over typical regions of China. Atmosphere 11, 906. doi:10.3390/atmos11090906
Keywords: precipitation, artificial precipitation enhancement, air pollutants, wet scavenging, particle matter
Citation: Wu Y, Wang Y, Zhou Y, Liu X, Tang Y, Wang Y, Zhang R and Li Z (2022) The wet scavenging of air pollutants through artificial precipitation enhancement: A case study in the Yangtze River Delta. Front. Environ. Sci. 10:1027902. doi: 10.3389/fenvs.2022.1027902
Received: 25 August 2022; Accepted: 20 September 2022;
Published: 04 October 2022.
Edited by:
Caiqing Yan, Shandong University, ChinaReviewed by:
Hao Wu, Chengdu University of Information Technology, ChinaCopyright © 2022 Wu, Wang, Zhou, Liu, Tang, Wang, Zhang and Li. This is an open-access article distributed under the terms of the Creative Commons Attribution License (CC BY). The use, distribution or reproduction in other forums is permitted, provided the original author(s) and the copyright owner(s) are credited and that the original publication in this journal is cited, in accordance with accepted academic practice. No use, distribution or reproduction is permitted which does not comply with these terms.
*Correspondence: Yuying Wang, eXV5aW5nd2FuZ0BudWlzdC5lZHUuY24=; Yuquan Zhou, emhvdXlxMDVAMTYzLmNvbQ==
Disclaimer: All claims expressed in this article are solely those of the authors and do not necessarily represent those of their affiliated organizations, or those of the publisher, the editors and the reviewers. Any product that may be evaluated in this article or claim that may be made by its manufacturer is not guaranteed or endorsed by the publisher.
Research integrity at Frontiers
Learn more about the work of our research integrity team to safeguard the quality of each article we publish.