 Yiwei Diao
 Ankang Liu2
94% of researchers rate our articles as excellent or good
Learn more about the work of our research integrity team to safeguard the quality of each article we publish.
Find out more
ORIGINAL RESEARCH article
Front. Environ. Sci., 20 September 2022
Sec. Atmosphere and Climate
Volume 10 - 2022 | https://doi.org/10.3389/fenvs.2022.1027397
This article is part of the Research TopicAir Pollution Remote Sensing and the Subsequent Interactions with Ecology on Regional Scales - Volume IIView all 10 articles
The source of PM2.5 varies at different stages of urban haze pollution. In addition, there is obvious regional transport of pollutants between urban agglomerations. PM2.5 and its major chemical compositions in a regional haze episode were measured continuously from 16 to 27 November 2018 in Nanjing, China. The types of primary sources resolved by principal component analysis (PCA) and positive matrix factorization (PMF) were similar, and the result of PMF was more refined. The average contribution of each source by PMF was: secondary nitrate (64.01%), secondary sulfate (11.62%), incomplete combustion (4.49%), sea salt (8.61%), biomass burning (6.90%), and crustal dust (4.37%). In different haze stages, the distribution characteristics of air pollutants differed. The concentrations of SO42-, NO3−, NH4+, and black carbon were the highest in the haze developing stage, which was 2.0, 3.1, 3.0, and 2.4 times, respectively, higher than that under clean conditions. The increment of NO3− dominated the development of haze, and the proportion of NO3− from haze generation to development increased by 4.05%. The concentration contributions of secondary nitrate, sea salt, and biomass burning were highest in haze development, secondary sulfate was highest in haze generation, and incomplete combustion was highest in haze dissipation, which was 3.5, 1.8, 3.3, 1.7, and 9.5 times higher than the clean stage, respectively. In the haze episode, the contribution of crustal dust was lower than in the clean stage. Potential source contribution function (PSCF) and concentration weighted trajectory (CWT) revealed that the major source area of air pollutants in Nanjing came from the southeast, and the northwest was the major impact area.
In China, haze pollution has become a hot topic of common concern among the public, government, and researchers (Wang Q. et al., 2009; Peplow, 2014; Fu and Chen, 2017; Shen et al., 2022). PM2.5 has become as much a concern for people’s daily life as temperature, wind, and other meteorological variables (Zhang et al., 2013; Ding and Liu, 2014; Maji et al., 2018). The most intuitive effect of the increases of fine particle concentrations is the atmospheric visibility degradation (Chang et al., 2009; Zhang et al., 2010), affecting radiation and climate (Ramanathan et al., 2001; Andreae et al., 2005; Lohmann and Feichter, 2005), and harmful health effects in human (Steinle et al., 2015).
Studies on the analysis and quantitative assessment of PM2.5 source have been conducted in China, Song et al. (2006) employed the PCA model to discover five sources of PM2.5 in Beijing, where the major chemical contributors to PM2.5 mass were secondary sulfate and nitrate, mixed sources of coal combustion and biomass burning, industrial emissions, traffic, and dust. Compared with the PCA model, the PMF model can effectively reduce the deviation caused by the “mixing factor” (Gao et al., 2018; Han et al., 2016). The regional transport of air pollutants also play a key role on the pollutant concentrations in a specific area (Liu et al., 2016). Sun et al. (2015) used the potential source contribution function (PSCF) model to find that Beijing’s high potential pollution source area located in its southwest. Using concentration weighted trajectory (CWT) model, Jing et al. (2019) found that the episodes of high BC concentrations in Nanjing during the autumn and winter were caused by the long-range transport from the southwestern region. The CAMx model extended by particulate matter source spportionment technology (PSAT) tool was used for tracking and accounting for particulate matter concentrations that originate or are formed as a result of emissions form long-range transportation. With CAMx-PSAT, Wu et al. (2013) found that the primary sources of particulate pollution in the Pearl River Delta region were regional transmission (42%) and vehicle emissions (21%).
The Yangtze River Delta (YRD) is one of the fastest-growing regions in East Asia. The rapid development of urbanization and industrialization has resulted in the increasingly severe pollution problem and health risk. (Kang et al., 2013; Liu et al., 2013; Wang et al., 2016). Using the CAMx model, Li et al. (2015) found that the main sources of haze pollution in the YRD region are industrial processing, combustion emissions, vehicle emissions, and fugitive dust. Both local emission and regional transportation can cause heavy haze pollution in YRD, which usually depends on meteorological conditions (Wang et al., 2013). Long-range transportation of pollutants was more conducive to the growth of organic carbon therein, while particles mixed with more chloride and nitrate/sulfate (Hu et al., 2018).
At present, there are relatively few studies on the source analysis of persistent and regional haze pollution events in the YRD based on high-resolution online measurements. Exploring the difference of sources and the pollutant transport characteristics at different stages of haze was very important for control strategy in urban agglomerations of the YRD. At different stages of urban haze pollution, the emission of atmospheric aerosols is quite different. The pollutants exchange and transportation between cities will also affect the emission variations of atmospheric aerosols. In this study, the concentration of water-soluble ions, BC, and number concentration of aerosol was observed with high-resolution online monitoring instruments during a haze pollution event in Nanjing from November 16 to 27, 2018. In this article, we will combine with receptor models (PCA, PMF, PSCF, CWT), to explore the different emission sources of PM2.5 at different stages and its impact on upstream and downstream areas on the regional haze pollution event in YRD.
The Yangtze River Delta lies in the middle and lower Yangtze Plain of East China, which is one of the most developed regions. Nanjing is an important typical industry city in YRD, with comprehensive manufacturing and transportation hub, where the regional haze pollution breaks out frequently (Leng et al., 2016; Sun et al., 2018; Liu et al., 2019). The measurement site is installed on the top of the Meteorological Building (40 m above the ground and 62 m above sea level) of Nanjing University of Information Science and Technology (NUIST, 32.21°N, 118.72°E) (Figure 1).
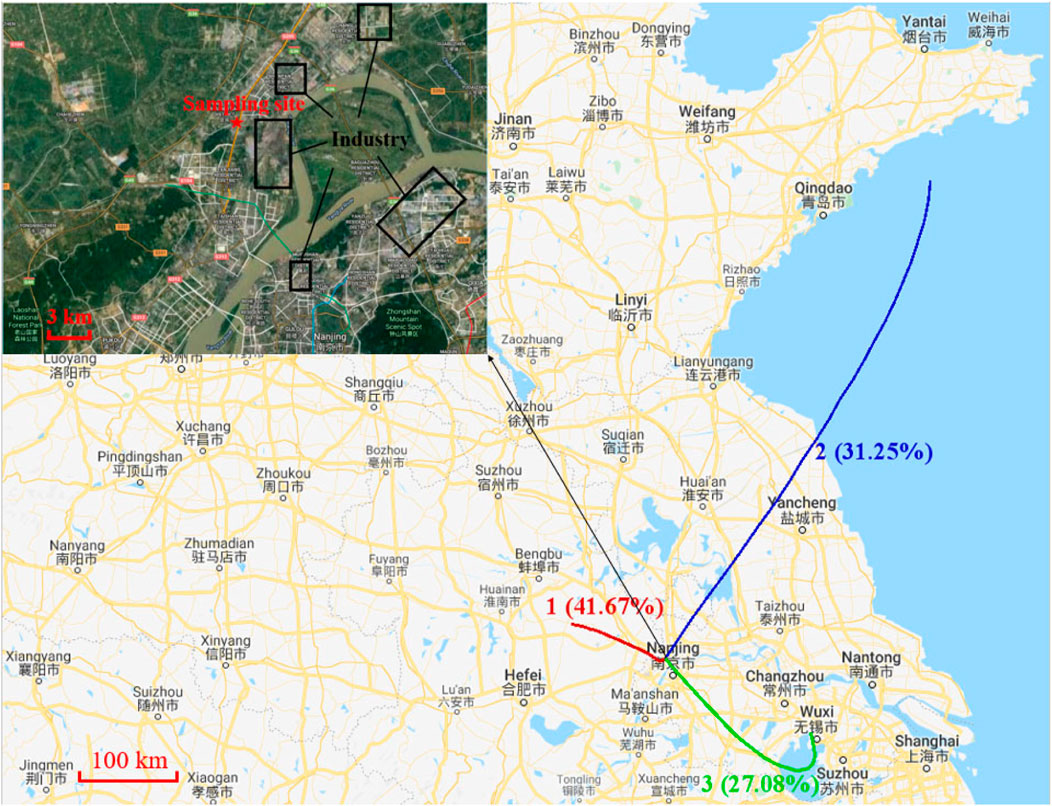
FIGURE 1. Measurement site and 24 h backward trajectory cluster at 500 m altitude.
The online system MARGA (Monitor for AeRosols and Gases in Ambient air, ADI 2080) with 1-h resolution implemented the measurement of water-soluble ions and trace gases (Rumsey et al., 2014). The BC concentration was measured by the Aethalometer (AE33) with 5-min resolution. Particle size distribution is important for understanding the sources and effects of atmospheric aerosols. The aerosol number concentrations (5 nm–10 μm) were measured with a Wide-Range Particle Spectrometer (WPS) with 5-min resolution (Wang et al., 2014). PM2.5 was measured using a β-ray duster meter (Model 5030 SHARP) (Zou et al., 2014). The meteorological variables (temperature, RH, wind speed, wind direction, and precipitation) were obtained from the comprehensive meteorological measurement site in NUIST, and the time resolution is 1 h.
A preliminary source analysis of the water-soluble ions was carried out by principal component analysis (PCA, SPSS version 19.0, SPSS Inc. 1988). PCA is a statistical procedure that is used to reduce the dimensionality. It uses an orthogonal transformation to convert a set of observations of possibly correlated variables into a set of values of linearly uncorrelated variables called principal components (Song et al., 2006).
Positive matrix factorization is a multivariate factorization tool that can decompose the sample concentration matrix of the sample into two non-negative constant matrices factor contribution matrix and factor profile matrix, which was used successfully at the US Environmental Protection Agency for the chemometric evaluation and modelling of environmental data sets. Compared to other methods it offers some advantage that consent to better resolve the problem under analysis (Shi et al., 2017).
The PSCF developed by Ashbaugh et al. (1985) has been widely used in many studies (Lucey et al., 2001; Wang Y. Q. et al., 2009; Zhang et al., 2019). It is calculated based on the spatial grid, which is defined as the ratio of the pollution trajectories. Detailed principles can be found in Ji et al. (2018).
The CWT model was established by Seibert et al. (1994). In order to avoid the laminations of the PSCF method whereby some grid cells could have the same PSCF value when sample concentrations could either be slightly higher or much higher than the criterion required as a result, it could be much more difficult to distinguish moderate sources from strong ones. Hence CWT method, with a weight concentration for each grid, was used with the aiming of producing a geographical overview of emission source areas within the study region (Wang et al., 2006; Shen et al., 2021).
The Yangtze River Delta region was mainly controlled by the continental cold high-pressure system during the study period. The weather situation was relative stability under strong high-pressure, and affected by the middle branch trough. As the YRD located in front of the trough, the water vapor transport from the southwest made the humidity higher, which was conducive to the accumulation and development of pollutants. As shown in Figure 2, haze pollution occurred in YRD around 20–22 and 24–27. During the haze period, the PM2.5 concentration in YRD changed greatly, and the PM2.5 maximum concentrations in Xuzhou, Hefei, Wuhu, Nanjing, Suzhou, and Shanghai were 241, 162, 175, 191, 162, and 125 μg m−3, respectively.

FIGURE 2. Time series of PM2.5 in major cities in YRD during the study period.
Concerning the locations of six cities, Figure 1 also showed it was the regional haze pollution occurred in the central and northern regions of YRD, while the concentration of PM2.5 decreased from north to south. Although the emissions and locations were different in the six major cities, the trends of PM2.5 variation of them are similar. The correlation between Nanjing and other five cities on PM2.5 concentrations was 0.43–0.83 (t-test, p = 0.01), so Nanjing selected as the typical city for study is reasonable.
According to Table 1, the average of wind speed was 1.2 ± 0.8 m s−1 during the study period in Nanjing. The wind speed on clean days was slightly higher than that on haze days. The relative humidity (RH) was high and the average value was 80.23 ± 15.14%, which was helpful to pollutants accumulation. During the early measurement period, the light rain occurred in Nanjing from November 18 to 19, the rainfall intensity was about 0.4 mm h−1. HCl is mainly produced by industrial emissions, and which concentrations variation between clean days and haze days is not obvious. The concentration of SNA (SO42-, NO3− and NH4+) is closely related to its gaseous precursors (HNO2, HNO3, SO2, and NH3) (Chen et al., 2015), and the latter concentrations on haze days were about 1.7–5 times higher than that in clean days.
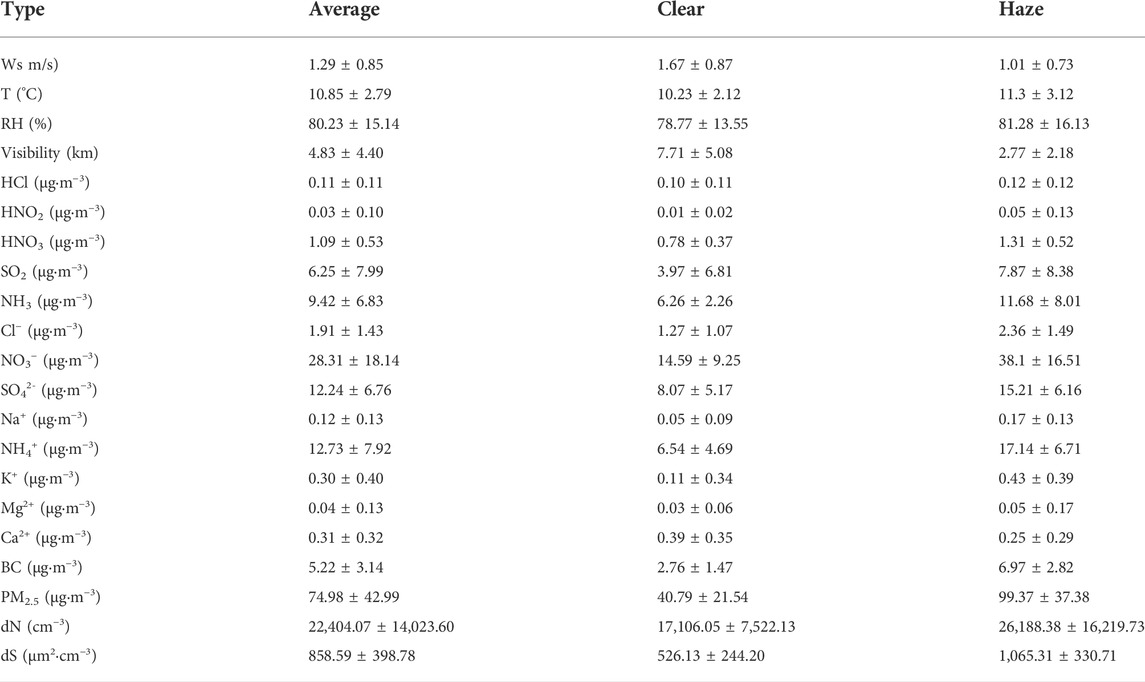
TABLE 1. Summary of average meteorological variables and pollutants during the study period.
The average PM2.5 value over Nanjing was 74.98 ± 42.99 μg m−3 (Table 1), slightly lower than the 75 μg m−3 limitation of Grade-II regulation (Ambient Air Quality Standards of China, GB 3095–2012). Overall, water-soluble ions and BC contributed 81.57% of PM2.5, the mass concentration of inorganic components showed a strong positive correlation with PM2.5 (R = 0.94, p = 0.01). The correlation between anion and cation in water-soluble ions was also very high (R2 = 0.99, p = 0.01). SNA was still the most important component of PM2.5 (up to 71.06%), whose order of proportion was NO3− (37.76%), NH4+ (16.96%), and SO42- (16.32%). NO3−/SO42- = 2.31 (>1), so indicated that the vehicle emission occupied main contribution (Yao et al., 2002). The contributions of Cl−, Ca2+, K+, Na+, and Mg2+ were fewer, totaling 3.57%.
The average concentration of BC on haze days was 6.97 ± 2.82 μg m−3, which was 2.5 times that of clean days, and the BC concentration showed an ascending trend during the measurement period. The average aerosol number concentration was 17,106.05 ± 7,522.125 cm−3 on clean days, while on haze days it increased to 1.5 times. The dominant size in PM distribution was 25–55 nm. The average aerosol surface area concentration on haze days was 1,065.31 ± 330.71 μm2 cm−3, increased to 2.0 times on the clean days, and the dominant particle size in particle surface area distribution was around 170 and 450 nm.
As shown in Table 2, PCA method was reliable, since KMO = 0.64 (>0.6) (Kaiser-Meyer-Olkin test). All eigenvalues of three principal factors groups were greater than one that resolved 82.52% sources of PM2.5 mass concentrations.
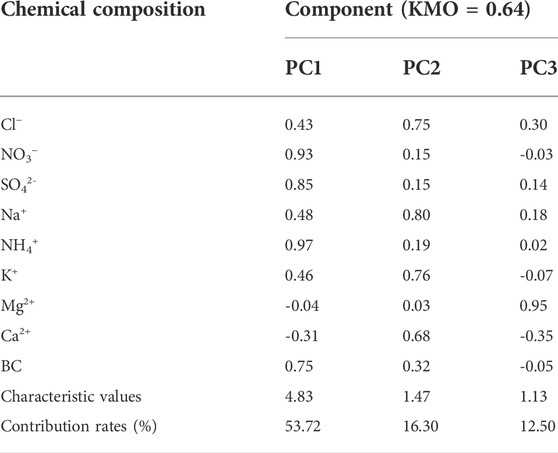
TABLE 2. Rotated component matrix of the principal component analysis during the measurement period.
Factor 1 resolved a mixture of secondary sources and incomplete combustion accounting for 53.72% of the total variance. It was strongly loaded with SO42-, NO3−, and NH4+ (all around 0.9), suggesting probably contribution from secondary sources (Taghvaee et al., 2018). The partial correlation coefficient of BC also reached 0.75, indicating that the above process was accompanied by incomplete combustion (Rehman et al., 2011).
Factor 2 was identified as a mixture of sea salt and biomass burning because of high factor loadings by Cl−, Na+, and K+, which accounted for 16.30% of the total variance. Cl− is the identification component of sea salt (Liu et al., 2017), K+ is the identification component of biomass burning (Santoso et al., 2008), and Na+ can be produced in both processes.
Factor 3 was explained by crustal dust and accounted for 12.50% of the total variance. It was mainly loaded with Mg2+ (0.95), Mg2+ and Ca2+ abundant elements in the crust, both of which are considered to be the identification components of crustal dust in related studies (Almeida et al., 2005). So, in this haze pollution event, the inorganic components of PM2.5 primarily controlled by secondary sources, incomplete combustion, sea salt, biomass burning, and crustal dust.
The PMF model resolved the six sources as the PCA method proceeded: secondary nitrate, secondary sulfate, incomplete combustion, sea salt, biomass burning, and crustal dust. (Figure 3).
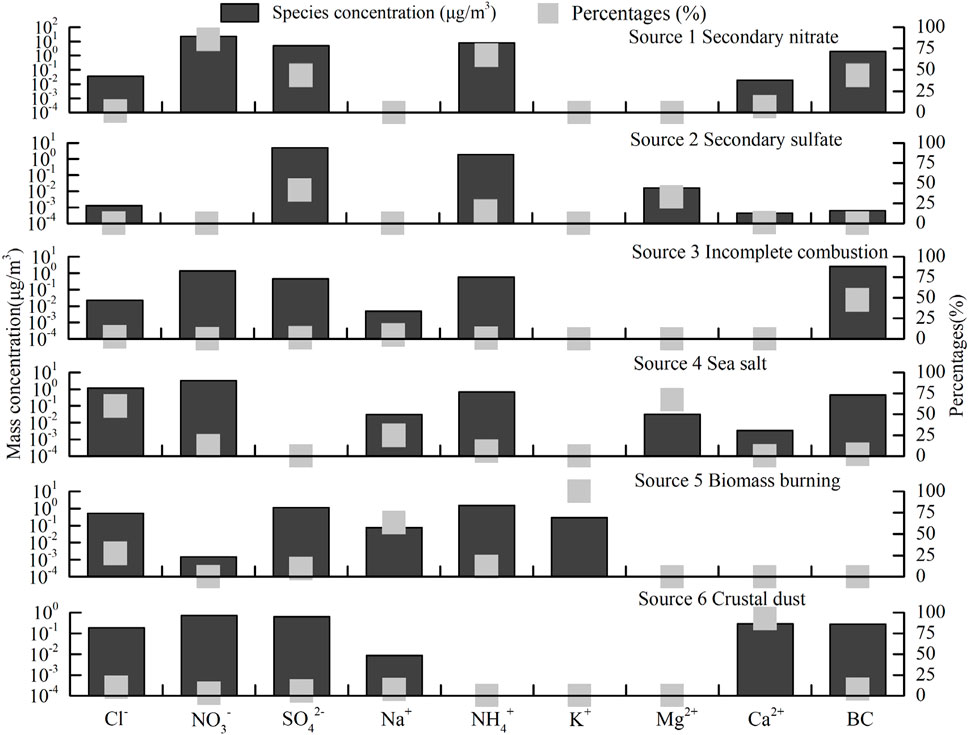
FIGURE 3. The resolved percentage for the source profiles derived by PMF.
Source 1 was identified as secondary nitrate, it mainly consisted of NO3− (85.66%) and NH4+ (66.87%), these species could indicate secondary nitrate. The contribution of source one to inorganic components was up to 64.01%. The correlation coefficient between the time series of secondary nitrate contribution and PM2.5 was 0.91 (p < 0.01), indicating that secondary nitrate was a major source of PM2.5. Source two was secondary sulfate with an average contribution of 11.62%, of which the characteristic value of SO42- is the highest (41.15%), and the concentration contribution of NH4+ in this source was also high, which was the second generation of sulfate process. Source three was incomplete combustion with an average contribution of 4.49%. The concentration contribution of BC is the highest (47.09%), which is mainly from various incomplete combustion processes. The above three types of sources correspond to factor 1 analyzed by PCA. The total contribution of these three types of sources accounts for up to 80.12%, which was 26.40% higher than factor 1 of PCA.
Source 4 was sea salt with an average contribution of 8.61%, of which the characteristic value of Mg2+ (67.07%) and Cl− (59.69%) had high loadings and contained a certain amount of Na+ (24.73%). It is the common sea salt in the coastal area, which is in line with the actual situation in Nanjing. Source five was relevant with biomass burning, with an average contribution of 6.90%, which was identified by higher loadings of K+ and Na+. They were related to combustion activities. The above two types of sources correspond to factor 2 analyzed by PCA. The total contribution of these two types of sources accounts for up to 15.51%, which was 0.79% lower than factor 2 of PCA.
Source 6 was crustal dust, with high loading of Ca2+. The average contribution of the crustal dust was 4.37%, corresponding to factor 3 analyzed by PCA, and 8.13% lower than that.
The comparison of PCA and PMF results showed that the types of main sources resolved by the two models were similar, both delivered the source of PM2.5. The PMF result was more refined than that of PCA: the secondary nitrate and secondary sulfate was treated independently, the uncertainty of the mixing factor was reduced, and the average contribution of each source was obtained.
Based on the Grade-II limit (75 μg m−3) of Ambient Air Quality Standards of China and visibility data, the PM2.5 concentration >75 μg m−3 was defined as a haze process. PM2.5 and visibility changed from good to poor and reached 75 μg m−3 < PM2.5 h concentration <115 μg m−3 was classified as a haze generation process. When PM2.5 h concentration was> 115 μg m−3, it was divided into the haze development process. PM2.5 and visibility have improved from poor, and the PM2.5 h concentration of <115 μg m−3 and finally less than 75 μg m−3 was defined in the haze dissipation process. According to the above classification criteria, in this study, haze process was divided into five processes: clean, precipitation, haze generation, haze development, and haze dissipation.
As shown in Figure 4, the concentrations of NO3−, NH4+, and SO42- were increasing along with the haze developing, and decreased during the dissipation stage. Their concentrations in the haze development stage were 52.69, 23.00, and 18.34 μg/m3, which were 3.1, 3.0, and 2.0 times than that in the clean condition. From the perspective of the proportion, the proportion of NO3− increased by 4.05% from the generation to the development, the proportion of SO42- decreased by 4.54%, and the proportion of NH4+ increased by only 0.22%. It indicated that the increase of NO3− dominated the development of haze pollution.
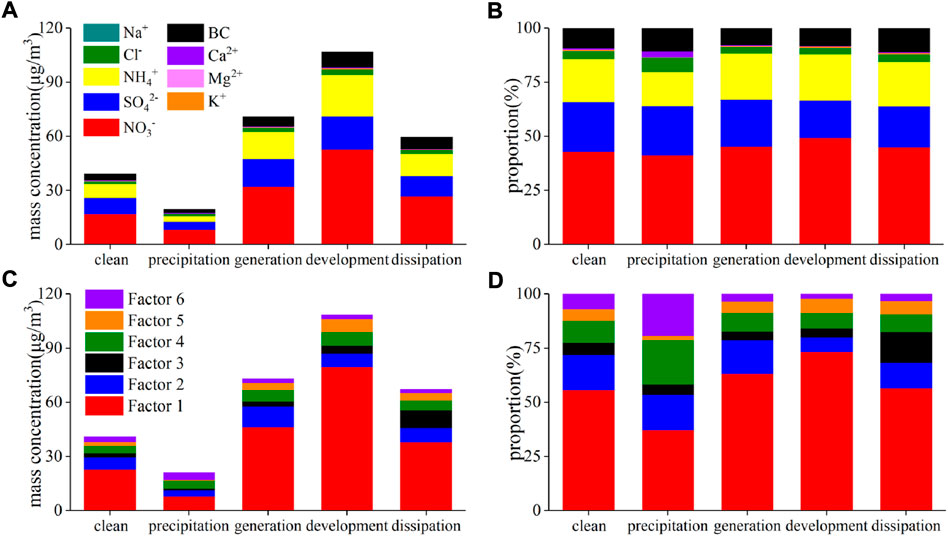
FIGURE 4. The concentration contribution and proportion of inorganic components and factors under different conditions.
The concentrations of BC, Cl−, K+, and Na+ were 8.83, 2.92, 0.61, and 0.21 μg/m3, keeping highest values during the haze development stage, which were 2.4, 2.1, 3.6, and 2.6 times than that in the clean stage. Due to the higher humidity and less dust in the haze, the concentration of Ca2+ in the whole haze episode showed lower level. The concentration and proportion of Mg2+ were highest in the haze generation stage. The proportion of K+ and BC continued to rise during the generation, development, and dissipation stages of haze, which implied that biomass burning may contribute to haze formation.
Figure 4 showed that the precipitation process can effectively remove pollutants. Compared with the clean process, the concentration of SNA had decreased by 50.44, 51.43, and 59.72%, respectively. Cl− had the highest proportion in the precipitation process (6.74%), which was related to the source of sea salt. It was worth mentioning that the concentration and proportion of Ca2+ were significantly higher than others in the precipitation process, which may be due to rainwater being sucked into the inlet of the instrument. According to previous studies (Zhang et al., 2015), the Ca2+ content in precipitation in Nanjing is high.
The mass concentration and proportion of each source of PM2.5 varied at different haze stages. The source of PM2.5 was the primary secondary nitrate, which accounted for 56.56–73.23%. The secondary nitrate concentration in the haze development stage was the highest with 79.47 μg/m3, 3.5 times than that in clean stage. The concentration of secondary sulfate was the highest value 11.43 μg/m3 in the haze generation, which was 1.7 times than that of the clean stage. In the haze’s development and dissipation process, the concentration of the secondary sulfate decreased first and then increased.
With the generation, development, and dissipation of haze, the concentration and proportion of incomplete combustion kept increasing. The concentration during the dissipation phase was 9.56 μg/m3, which was 9.5 times than that in the clean process. Both sea salt and biomass burning had the highest concentrations during the haze development stage, 7.66 and 7.17 μg/m3, respectively, which were 1.8 and 3.3 times than that in the clean process. The concentration and proportion of crustal dust in the different stages of haze were all lower than that in the clean stage.
During the precipitation phase, the mass concentration and proportion of different sources have changed significantly. The concentration of secondary sulfate had decreased by 65.41% compared to the clean phase. The sea salt contribution in the precipitation process had reached the largest, up to 20.36%. Biomass combustion had the lowest contribution (2.04%) in the precipitation process. The concentration and proportion of crustal dust in the precipitation process were significantly larger than in other stages, which may be related to the measurement error of Ca2+.
Figure 1 showed that the cluster of air masses in Nanjing during the study period can be divided into three directions: west (central Anhui province, 41.67%), northeast (northern Jiangsu province and the sea, 31.25%), and southeast (southern Jiangsu province, 27.08%). As shown in Figure 5, High PSCF values (>0.7) of PM2.5 loading was distributed in three pathways, which agreed with the cluster of air mass trajectories. The largest potential source area was located in the Suzhou-Wuxi-Changzhou Metropolitan area (SWC), southern Jiangsu, indicating that the source of PM2.5 was primarily from urban areas.
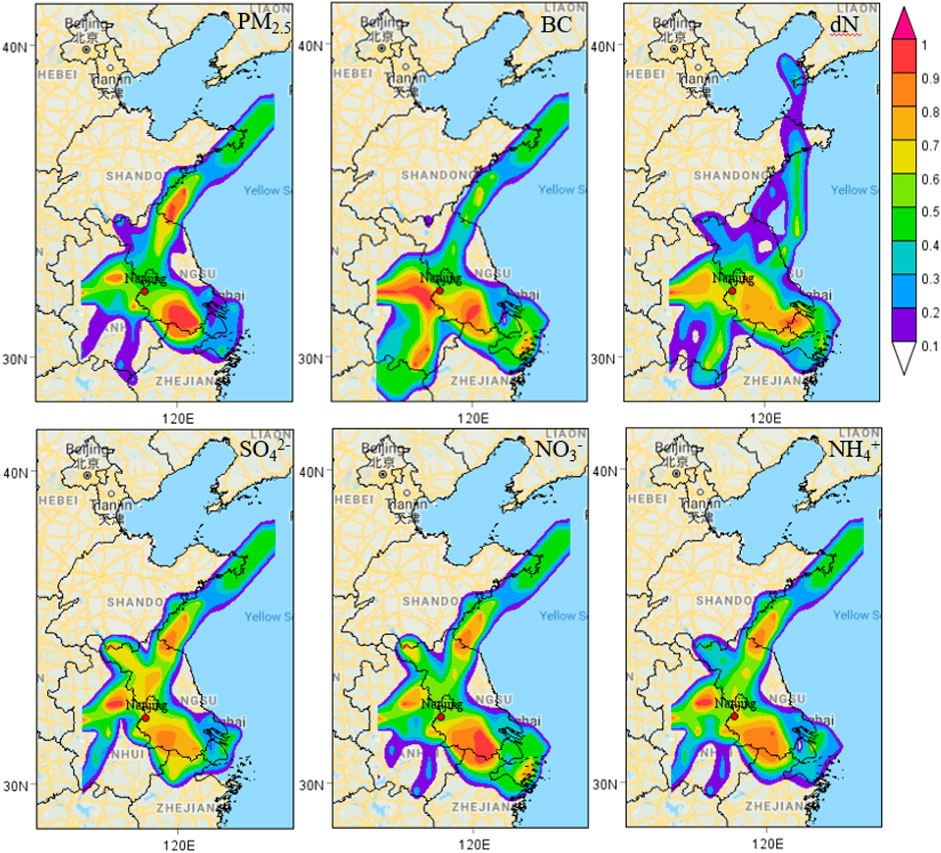
FIGURE 5. The PSCF analysis of major pollutants with backward trajectory.
The potential source area of BC and aerosol number concentration (dN) were slightly different from PM2.5, and the effect from the maritime pathway was low. The main source areas of BC were distributed over Central Anhui, northern Anhui, and SWC, and that of dN originated from central Anhui, SWC, and Shanghai. The potential source area distribution of SNA was similar to the three-pathway distribution of PM2.5. The red zone size of all components showed remarkable difference, that demonstrating each component was controlled by the local emissions characteristic.
The results of the potential source area identified by CWT model were very similar to production of PSCF model (Figure 6). The total source area obtained by CWT was significantly larger than that of PSCF, and the distribution of the potential source area got smoother. The reason for these phenomena suggested that once the trajectory related pollutant concentrations at the measurement site was higher than the pollutant threshold value in PSCF, all points on the trajectory were treated as polluting points, so a thinner linear distribution of the source area would stand out. The CWT model can avoid this problem, there was no specific pollution threshold, the impact of each trajectory on the observation points is equal, and the distribution of source areas with different levels of contribution can be quantified.
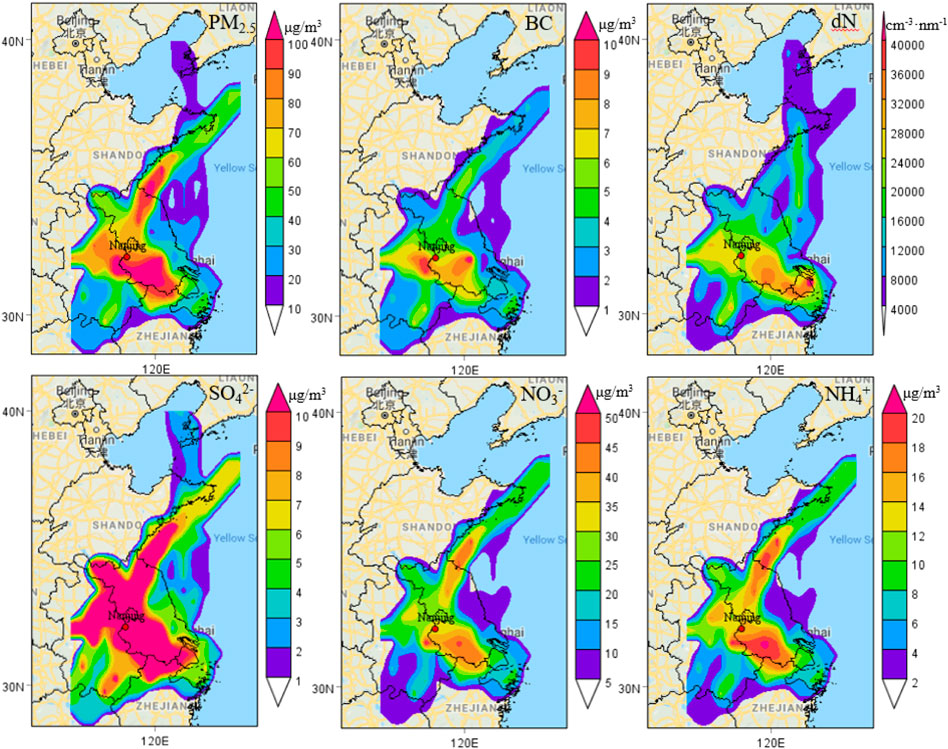
FIGURE 6. The CWT analysis of major pollutants with a backward trajectory during the measurement.
As shown in Figure 6, the highest CWT values for PM 2.5 originating from SWC appeared, and another strong source area located in the northeast of Nanjing. The distribution of the strong source areas of different components in PM 2.5 was different. The largest source area of BC existed in the west of Nanjing, while dN was located in the southeast (SWC and Shanghai). The area of strong potential source area of SO42- was very large, which meant all of the Nanjing surrounding areas provided contributions. As the primary components of PM2.5, the strong potential source area of NO3− and NH4+ and PM2.5 showed the most similar.
To explore the impact of Nanjing pollutant transport on its surrounding regions, PSCF (Figure 7) and CWT (Figure 8) models were performed using the 24 h forward trajectory data and pollutant concentration data. The PSCF results showed the main impact area of PM2.5 existed in central Anhui and southern Jiangsu, and the strongest impact area of BC was located in the southeast of Nanjing (SWC). High PSCF values of dN were found in northern Anhui. The distribution of the SNA was similar, located in the north and central regions of Jiangsu and Anhui.
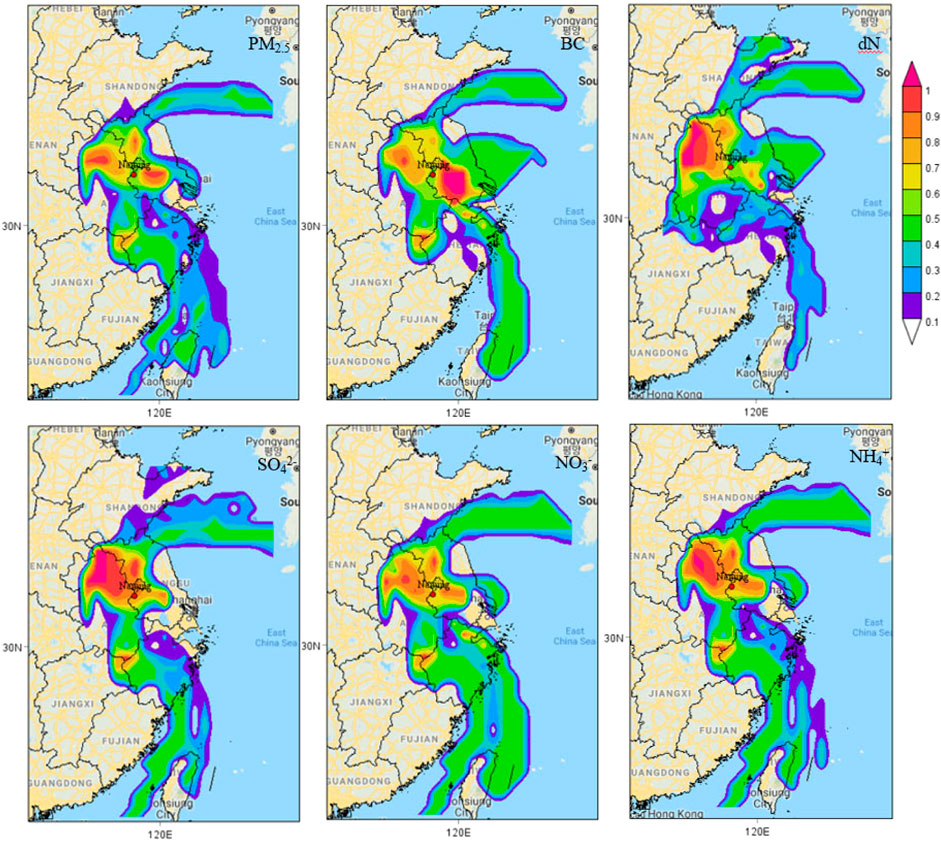
FIGURE 7. The PSCF analysis of major pollutants with forward trajectory during the measurement.
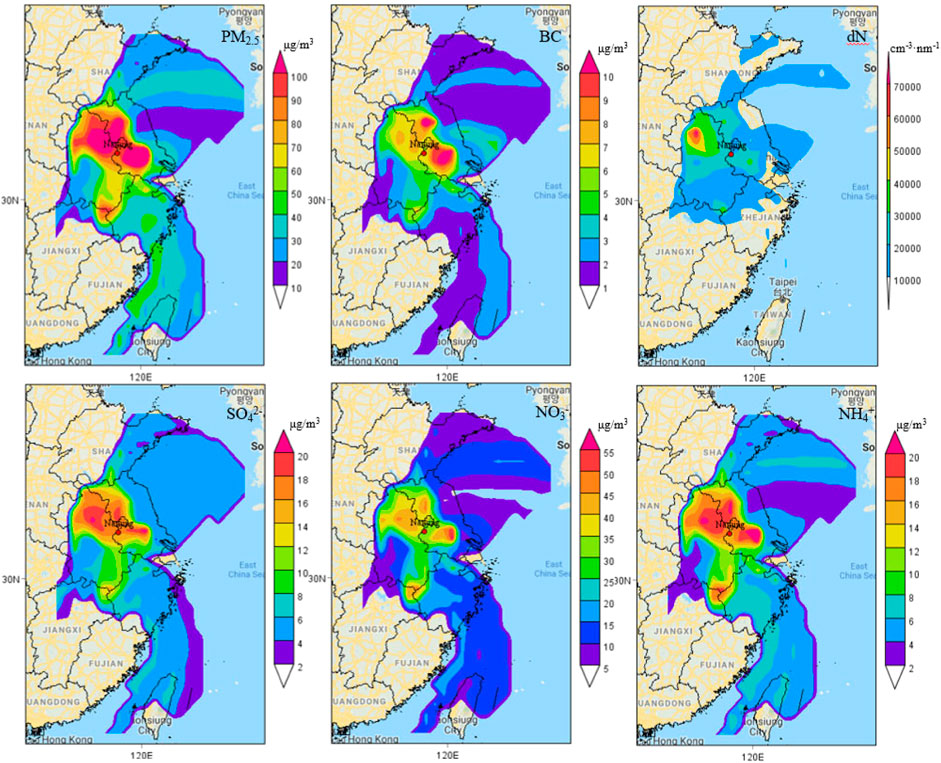
FIGURE 8. The CWT analysis of major pollutants with forward trajectory during the measurement.
The impact area produced by CWT was larger than that of PSCF, but the main scope with high CWT values was similar. The strong impact area contributed by PM2.5 was mainly from the west to the southeast around Nanjing. The main impact areas of BC were located in Jiangsu Province (Huaian and SWC). The impact area of dN was smaller than that of other pollutants and mainly distributed in the north of Anhui, northwest of Nanjing. The distribution of the SNA’s strong impact range was similar to PM2.5, mainly from northwest to east in the vicinity of Nanjing.
Overall, the air masses transport from Nanjing, on the farthest northward possibly impact on the Yellow Sea region, while on the farthest southward may affect the northern region of Taiwan. The most important impact area was located in the southeast and northwest areas around Nanjing (SWC and north central Anhui).
To explore the source variations of PM2.5 at different stages on regional haze pollution event and the regional pollutant transport in urban agglomeration, receptor models (PCA, PMF, PSCF, and CWT) were employed to analyze the sources of haze in Nanjing on November 16–27, 2018. PCA showed that the main sources of PM2.5 were a mixture of secondary sources and incomplete combustion, a mixture of sea salt and biomass burning, and crustal dust. PMF results were more refined than PCA. Secondary nitrate and secondary sulfate were separated in the secondary sources, and the average contribution from each source was obtained: secondary nitrate (64.01%), secondary sulfate (11.62%), incomplete combustion (4.49%), sea salt (8.61%), biomass burning (6.90%) and crustal dust (4.37%). According to the different stages of the haze, the measurement was divided into clean, precipitation, haze generation, haze development, and haze dissipation. In the haze development stage, the concentrations of SO42-, NO3−, NH4+, and BC were 18.34, 52.69, 23.00, 8.83 μg/m3, respectively, occupied the highest value during the whole pollution event, which were 2.0, 3.1, 3.0, and 2.4 times higher than the clean stage. The increase of NO3− dominated the development of haze, and the proportion of NO3− from haze generation to development increased by 4.05%. The concentration contributions of secondary nitrate, sea salt, and biomass burning were highest in haze development, secondary sulfate was highest in haze generation, and incomplete combustion was highest in haze dissipation, which was 3.5, 1.8, 3.3, 1.7, and 9.5 times higher than that in the clean stage. The crustal dust contribution in different haze stages was all lower than that in the clean stage. The potential source areas of PM2.5 in Nanjing were distributed in three pathways: west, northeast, and southeast (central Anhui, northern Jiangsu province, and the sea, SWC). The main potential source areas of SNA, BC, and dN were in SWC, southeast of Nanjing. The impact area of air pollutants in Nanjing can reach Taiwan and Shandong, and the most important impact area was in the southeast and northwest areas around Nanjing.
The raw data supporting the conclusion of this article will be made available by the authors, without undue reservation.
Conceptualization: AL and YD Methodology: Writing–Original Draft: AL, YD, XK, and TZ Methodology, Software: AL, YD, QH, XK, and MY Writing–Review and Editing: YD Data curation, Resources: YC and SS. Funding acquisition, Supervision: TZ Project administration: TZ.
This study was supported by the National Key Research and Development Program of China (2019YFC0214604) and the National Natural Science Foundation of China (41830965 and 41805096).
The authors declare that the research was conducted in the absence of any commercial or financial relationships that could be construed as a potential conflict of interest.
All claims expressed in this article are solely those of the authors and do not necessarily represent those of their affiliated organizations, or those of the publisher, the editors and the reviewers. Any product that may be evaluated in this article, or claim that may be made by its manufacturer, is not guaranteed or endorsed by the publisher.
Almeida, S. M., Pio, C. A., Freitas, M. C., Reis, M. A., and Trancoso, M. A. (2005). Source apportionment of fine and coarse particulate matter in a sub-urban area at the western european coast. Atmos. Environ. X. 39, 3127–3138. doi:10.1016/j.atmosenv.2005.01.048
Andreae, M. O., Jones, C. D., and Cox, P. M. (2005). Strong present-day aerosol cooling implies a hot future. Nature 435, 1187–1190. doi:10.1038/nature03671
Ashbaugh, L. L., Malm, W. C., and Sadeh, W. Z. (1985). A residence time probability analysis of sulfur concentrations at Grand Canyon National park. Atmos. Environ. X. 19 (8), 1263–1270. doi:10.1016/0004-6981(85)90256-2
Chang, D., Song, Y., and Liu, B. (2009). Visibility trends in six megacities in China 1973–2007. Atmos. Res. 94, 161–167. doi:10.1016/j.atmosres.2009.05.006
Chen, J., Yang, P., Han, J. C., and Qian, W. M. (2015). Analysis of PM2.5 spectrum characteristics in Shijiazhuang based on high-resolution MARGA data. China. Environ. Sci. 35 (9), 2594. doi:10.3969/j.issn.1000-6923.2015.09.005
Ding, Y. H., and Liu, Y. J. (2014). Analysis of long-term variations of fog and haze in China in recent 50 years and their relations with atmospheric humidity. Sci. China Earth Sci. 57, 36–46. doi:10.1007/s11430-013-4792-1
Fu, H. B., and Chen, J. M. (2017). Formation, features and controlling strategies of severe haze-fog pollutions in China. Sci. Total Environ. 578, 121–138. doi:10.1016/j.scitotenv.2016.10.201
Gao, J. J., Wang, K., Wang, Y., Liu, S. H., Zhu, C. Y., Hao, J. M., et al. (2018). Temporal-spatial characteristics and source apportionment of PM2.5 as well as its associated chemical species in the Beijing-Tianjin-Hebei region of China. Environ. Pollut. 233, 714–724. doi:10.1016/j.envpol.2017.10.123
Han, B., Zhang, R., Yang, W., Bai, Z. P., Ma, Z. Q., and Zhang, W. J. (2016). Heavy haze episodes in Beijing during January 2013: Inorganic ion chemistry and source analysis using highly time-resolved measurements from an urban site. Sci. Total Environ. 544, 319–329. doi:10.1016/j.scitotenv.2015.10.053
Hu, R., Wang, H., Yin, Y., Chen, K., Zhu, B., Zhang, Z. F., et al. (2018). Mixing state of ambient aerosols during different fog-haze pollution episodes in the Yangtze River Delta, China. Atmos. Environ. X. 178, 1–10. doi:10.1016/j.atmosenv.2018.01.032
Ji, D. S., Yan, Y. C., Wang, Z. S., He, J., Liu, B. X., Sun, Y., et al. (2018). Two-year continuous measurements of carbonaceous aerosols in urban beijing, China: Temporal variations, characteristics, and source analyses. Chemosphere 200, 191–200. doi:10.1016/j.chemosphere.2018.02.067
Jing, A. K., Zhu, B., Wang, H. L., Yu, X. N., An, J. L., and Kang, H. (2019). Source apportionment of black carbon in different seasons in the northern suburb of Nanjing, China. Atmos. Environ. X. 201, 190–200. doi:10.1016/j.atmosenv.2018.12.060
Kang, H. Q., Zhu, B., Su, J. F., Wang, H. L., Zhang, Q. C., and Wang, F. (2013). Analysis of a long-lasting haze episode in Nanjing, China. Atmos. Res. 120-121, 78–87. doi:10.1016/j.atmosres.2012.08.004
Leng, C. P., Duan, J. Y., Xu, C., Zhang, H. F., Wang, Y. F., Wang, Y. Y., et al. (2016). Insights into a historic severe haze event in Shanghai: Synoptic situation, boundary layer, and pollutants. Atmos. Chem. Phys. 16 (14), 9221–9234. doi:10.5194/acp-16-9221-2016
Li, L., An, J. Y., Zhou, M., Yan, R. S., Huang, C., Lu, Q., et al. (2015). Source apportionment of fine particles and its chemical components over the Yangtze River Delta, China during a heavy haze pollution episode. Atmos. Environ. X. 123, 415–429. doi:10.1016/j.atmosenv.2015.06.051
Liu, A. K., Wang, H. L., Chen, K., Lu, W., Shi, S. S., and Liu, Z. (2019). Distribution characteristics of water-soluble ions during a haze pollution process in Nanjing. China Environ. Sci. 39 (5), 1793. doi:10.3969/j.issn.1000-6923.2019.05.001
Liu, B. S., Yang, J. M., Yuan, J., Wang, J., Dai, Q. L., Li, T. K., et al. (2017). Source apportionment of atmospheric pollutants based on the online data by using PMF and ME2 models at a megacity, China. Atmos. Res. 185, 22–31. doi:10.1016/j.atmosres.2016.10.023
Liu, X. H., Zhu, B., Wang, H. L., and Zhang, E. H. (2013). Haze variations over 1980-2009 and connecting factors over the Yangtze River Delta region. China Environ. Sci. 33 (11), 1929. doi:10.3969/j.issn.1000-6923.2013.11.002
Liu, Z. R., Wang, Y. S., Hu, B., Ji, D. S., Zhang, J. K., Wu, F. K., et al. (2016). Source appointment of fine particle number and volume concentration during severe haze pollution in Beijing in January 2013. Environ. Sci. Pollut. Res. 23 (7), 6845–6860. doi:10.1007/s11356-015-5868-6
Lohmann, U., and Feichter, J. (2005). Global indirect aerosol effects: A review. Atmos. Chem. Phys. 5 (3), 715–737. doi:10.5194/acp-5-715-2005
Lucey, D., Hadjiiski, L., Hopke, P. K., Scudlark, J. R., and Church, T. (2001). Identification of sources of pollutants in precipitation measured at the mid-Atlantic US coast using potential source contribution function (PSCF). Atmos. Environ. X. 35 (23), 3979–3986. doi:10.1016/s1352-2310(01)00185-6
Maji, K. J., Dikshit, A. K., Arora, M., and Deshpande, A. (2018). Estimating premature mortality attributable to PM2.5 exposure and benefit of air pollution control policies in China for 2020. Sci. Total Environ. 612, 683–693. doi:10.1016/j.scitotenv.2017.08.254
Peplow, M. (2014). Beijing smog contains witches’ brew of microbes. Nature. doi:10.1038/nature.2014.14640
Ramanathan, V., Crutzen, P. J., Kiehl, J. T., and Rosenfeld, D. (2001). Aerosols, climate, and the hydrological cycle. Science 294, 2119–2124. doi:10.1126/science.1064034
Rehman, I. H., Ahmed, T., Praveen, P. S., Kar, A., and Ramanathan, V. (2011). Black carbon emissions from biomass and fossil fuels in rural India. Atmos. Chem. Phys. 11, 7289–7299. doi:10.5194/acp-11-7289-2011
Rumsey, I. C., Cowen, K. A., Walker, J. T., Kelly, T. J., Hanft, E. A., Mishoe, K., et al. (2014). An assessment of the performance of the monitor for aerosols and gases in ambient air (MARGA): A semi-continuous method for soluble compounds. Atmos. Chem. Phys. 14 (11), 5639–5658. doi:10.5194/acp-14-5639-2014
Santoso, M., Hopke, P. K., Hidayat, A., and Diah Dwiana, L. (2008). Sources identification of the atmospheric aerosol at urban and suburban sites in Indonesia by positive matrix factorization. Sci. Total Environ. 397, 229–237. doi:10.1016/j.scitotenv.2008.01.057
Seibert, P., Kromp-Kolb, H., Baltensperger, U., Jost, D. T., Schwikowski, M., Kasper, A., et al. (1994). “Trajectory analysis of aerosol measurements at high Alpine sites,” in Transport and transformation of pollutants in the troposphere. Editors P. M. Borrell, P. Borrell, T. Cvitas, and W. Seiler (Den Haag: Academic Publishing), 689.
Shen, L., Wang, H., Kong, X., Zhang, C., Shi, S., and Zhu, B. (2021). Characterization of black carbon aerosol in the yangtze river delta, China: Seasonal variation and source apportionment. Atmos. Pollut. Res. 12 (1), 195–209. doi:10.1016/j.apr.2020.08.035
Shen, L., Zhao, T., Liu, J., Wang, H., Bai, Y., Kong, S., et al. (2022). Regional transport patterns for heavy PM2.5 pollution driven by strong cold airflows in Twain-Hu Basin, Central China. Atmos. Environ. 269, 118847. doi:10.1016/j.atmosenv.2021.118847
Shi, S. S., Wang, H. L., Zhu, B., Lin, X., Guo, T., Sha, D. D., et al. (2017). Source apportionment and size distribution of aerosols at Lin’an atmosphere regional background station during winter. Environ. Sci. 38 (10), 4024–4033. doi:10.13227/j.hjkx.201703239
Song, Y., Xie, S. D., Zhang, Y. H., Zeng, L. M., Salmon, L. G., and Zheng, M. (2006). Source apportionment of PM2.5 in Beijing using principal component analysis/absolute principal component scores and UNMIX. Sci. Total Environ. 372, 278–286. doi:10.1016/j.scitotenv.2006.08.041
Steinle, S., Reis, S., Sabel, C. E., Semple, S., Twigg, M. M., Braban, C. F., et al. (2015). Personal exposure monitoring of PM2.5 in indoor and outdoor microenvironments. Sci. Total Environ. 508, 383–394. doi:10.1016/j.scitotenv.2014.12.003
Sun, T. Z., Che, H. Z., Qi, B., Wang, Y. Q., Dong, Y. S., Xia, X. G., et al. (2018). Aerosol optical characteristics and their vertical distributions under enhanced haze pollution events: Effect of the regional transport of different aerosol types over eastern China. Atmos. Chem. Phys. 18, 2949–2971. doi:10.5194/acp-18-2949-2018
Sun, Y. L., Wang, Z. F., Du, W., Zhang, Q., Wang, Q. Q., Fu, P. Q., et al. (2015). Long-term real-time measurements of aerosol particle composition in Beijing, China: seasonal variations, meteorological effects, and source analysis. Atmos. Chem. Phys. 15, 10149–10165. doi:10.5194/acp-15-10149-2015
Taghvaee, S., Sowlat, M. H., Mousavi, A., Hassanwand, M. S., Yunesian, M., Naddafi, K., et al. (2018). Source apportionment of ambient PM2.5 in two locations in central tehran using the positive matrix factorization (PMF) model. Sci. Total Environ. 628-629, 672–686. doi:10.1016/j.scitotenv.2018.02.096
Wang, H. L., An, J. L., Cheng, M. T., Shen, L. J., Zhu, B., Li, Y., et al. (2016). One year online measurements of water-soluble ions at the industrially polluted town of Nanjing, China: Sources, seasonal and diurnal variations. Chemosphere 148, 526–536. doi:10.1016/j.chemosphere.2016.01.066
Wang, H. L., An, J. L., Shen, L. Q., Zhu, B., Pan, C., Liu, Z. R., et al. (2014). Mechanism for the formation and microphysical characteristics of submicron aerosol during heavy haze pollution episode in the Yangtze River Delta, China. Sci. Total Environ. 490, 501–508. doi:10.1016/j.scitotenv.2014.05.009
Wang, Q., Shao, M., Zhang, Y., Wei, Y., Hu, M., and Guo, S. (2009a). Source apportionment of fine organic aerosols in Beijing. Atmos. Chem. Phys. 9, 8573–8585. doi:10.5194/acp-9-8573-2009
Wang, Y. J., Li, L., Chen, C. H., Huang, C., Huang, H. Y., Feng, J. L., et al. (2013). Source apportionment of fine particulate matter during autumn haze episodes in Shanghai, China. J. Geophys. Res. Atmos. 119, 1903–1914. doi:10.1002/2013jd019630
Wang, Y. Q., Zhang, X. Y., and Arimoto, R. (2006). The contribution from distant dust sources to the atmospheric particulate matter loadings at xi’an, China during spring. Sci. Total Environ. 368, 875–883. doi:10.1016/j.scitotenv.2006.03.040
Wang, Y. Q., Zhang, X. Y., and Draxler, R. R. (2009b). TrajStat: GIS-based software that uses various trajectory statistical analysis methods to identify potential sources from long-term air pollution measurement data. Environ. Model. Softw. 24 (8), 938–939. doi:10.1016/j.envsoft.2009.01.004
Wu, D. W., Fung, J. C. H., Yao, T., and Lau, A. K. H. (2013). A study of control policy in the pearl river delta region by using the particulate matter source apportionment method. Atmos. Environ. X. 76, 147–161. doi:10.1016/j.atmosenv.2012.11.069
Yao, X. H., Chan, C. K., Fang, M., Cadle, S., Chan, T., Mulawa, P., et al. (2002). The water-soluble ionic composition of PM2.5 in Shanghai and Beijing, China. Atmos. Atmos. Environ. X. 36, 4223–4234. doi:10.1016/s1352-2310(02)00342-4
Zhang, K., Shang, X. N., Herrmann, H., Meng, F., Mo, Z. Y., Chen, J. H., et al. (2019). Approaches for identifying PM2.5 source types and source areas at a remote background site of South China in spring. Sci. Total Environ. 691, 1320–1327. doi:10.1016/j.scitotenv.2019.07.178
Zhang, Q. H., Zhang, J. P., and Xue, H. W. (2010). The challenge of improving visibility in Beijing. Atmos. Chem. Phys. 10, 7821–7827. doi:10.5194/acp-10-7821-2010
Zhang, X. Y., Sun, J. Y., Wang, Y. Q., Li, W. J., Zhang, Q., Wang, Y. G., et al. (2013). Factors contributing to haze and fog in China. Chin. Sci. Bull. 58, 1178–1187. doi:10.1360/972013-150
Zhang, Z. F., Shen, L. J., Zhu, B., Yue, J., Wang, H. L., and Zhang, Q. C. (2015). Chemical characteristics and potential sources of precipitation in Nanjing. Trans. Atmos. Sci. 38 (4), 473. doi:10.13878/j.cnki.dqkxxb.20140102010
Keywords: haze, PM2.5, chemical composition, Source apportionment, the yangtze river delta
Citation: Diao Y, Liu A, Hu Q, Yang M, Zhao T, Cui Y, Shi S and Kong X (2022) Characteristics of chemical composition and source apportionment of PM2.5 during a regional haze episode in the yangtze river delta, china. Front. Environ. Sci. 10:1027397. doi: 10.3389/fenvs.2022.1027397
Received: 25 August 2022; Accepted: 06 September 2022;
Published: 20 September 2022.
Edited by:
Xinyao Xie, Institute of Mountain Hazards and Environment (CAS), ChinaReviewed by:
Hui Xiao, Guangzhou Institute of Tropical and Marine Meteorology (GITMM), ChinaCopyright © 2022 Diao, Liu, Hu, Yang, Zhao, Cui, Shi and Kong. This is an open-access article distributed under the terms of the Creative Commons Attribution License (CC BY). The use, distribution or reproduction in other forums is permitted, provided the original author(s) and the copyright owner(s) are credited and that the original publication in this journal is cited, in accordance with accepted academic practice. No use, distribution or reproduction is permitted which does not comply with these terms.
*Correspondence: Yiwei Diao, ZGlhb3l3QGN3eHUuZWR1LmNu
Disclaimer: All claims expressed in this article are solely those of the authors and do not necessarily represent those of their affiliated organizations, or those of the publisher, the editors and the reviewers. Any product that may be evaluated in this article or claim that may be made by its manufacturer is not guaranteed or endorsed by the publisher.
Research integrity at Frontiers
Learn more about the work of our research integrity team to safeguard the quality of each article we publish.