 Latifa O. Nyembo1†
 Mohamed Mwabumba
 Jahangeer Jahangeer
 Vikram Kumar
- 1Petroleum Upstream Regulatory Authority, Dar es Salaam, Tanzania
- 2Tanzania Meteorological Authority (TMA), Dar es Salaam, Tanzania
- 3Department of Environmental Science, Jamia Millia Islamia, New Delhi, India
- 4Bihar Mausam Seva Kendra, Patna, India
Dar es Salaam, like other cities in Africa, experiences flash floods during the rainfall season that destroy infrastructure due to the overflow of rivers and blocked sewage. This study investigates the historical and future variability and changes in spatial and temporal rainfall over Dar es Salaam. Station data and Climate Hazards Group Infrared Precipitation with Stations (CHIRPS) gridded data crossing 38 years (1982–2019) were used as a baseline and the Coordinated Regional Climate Downscaling Experiment (CORDEX) dataset from 2021 to 2050 was used for projection under Representative Concentration Pathway (RCP 4.5) forcing scenarios. A trend analysis of historical data was conducted at monthly, seasonal, and annual timescales. Mann–Kendall statistical tests and Sen’s slope estimator were applied to identify the current trend direction and magnitude of changes in rainfall patterns over time. A standardized anomaly index (SAI) was also employed to detect the region’s trends in wetness and dryness. The spatial distribution of rainfall in the city was investigated using an inverse distance weighted (IDW) interpolation technique. The statistical results reveal that a non-significant trend in rainfall was observed on monthly, seasonal, and annual timescales. Generally, in the future (2021–2050), the annual cycle of rainfall shows a slight decrease in monthly rainfall, especially from January to August, and an increase from September to December compared to historical (1982–2019) rainfall, for most of studied locations. Spatially, the distribution of projected rainfall shows that the southern part of the city will experience higher rainfall than other parts. The most significant findings were a decrease in annual projected rainfall by 20%, the MAM projected rainfall season increased by 42%, and an increase of 38% of the OND-projected rainfall season. The findings of this study will be useful for the improved management and planning of the city.
1 Introduction
Globally, climate change challenge is the latest challenge facing humanity, and nations must unite to address it in their communities (Nyatichi, 2015; Mwabumba et al., 2022a). Climate change and variability are believed to be a catastrophic phenomenon, which have potential implications for almost every global goal for sustainable development. Changes and variability have already been observed and associated with extreme weather events like floods, drought, and heat waves. These extreme events are becoming increasingly unpredictable and result in worsening climatic impact on socioeconomic activities (Pachauri and Meyer, 2014; JahangeerGupta and Yadav, 2017; Kumar, 2017). Furthermore, the uneven distribution of climate change and variability impacts are a specific feature in some parts of the world with significant reductions in precipitation or major alterations in the timing of future wet and dry seasons (Kumar, 2017; Kumar et al., 2022). In Sub-Saharan Africa, climate change and variability pose a very serious challenge to the social, economic, and ecological system (Kotir, 2011). Several researchers in Africa observed that the current changes in climate conditions have resulted in changes in the rainfall patterns of different regions (Meshram et al., 2018; Sipayung et al., 2018).
These major patterns include increased rainfall trends in wet areas and decreases in dry areas (Luhunga et al., 2018; Borhara et al., 2020). In recent decades, East Africa has been affected by increased extreme rainfall events, which often translate into hazards (Odulami et al., 2018). The socio-climatic impacts of such climate-related extremes include the alteration of ecosystems (Palmate et al., 2021), disruption of food production (Palmate et al., 2022) and water supply (Kumar and Sen, 2020), and damage to infrastructure (JahangeerGupta and Yadav, 2018; Zakwan et al., 2018) and settlements (Maskrey et al., 2007). Unfortunately, these social and economic impacts, which threaten some sectors, such as food security, tourism, and hydropower plants, directly affect economic development around the country (Irish, 2016; Umar et al., 2022; Kumar et al., 2021). These effects are most consistently experienced during rainfall seasons with a significant lack of preparedness for current climate variability in many sectors (Tschakert et al., 2010; Ddamulira, 2016).
In Tanzania, the impact of climate change has already been felt in various parts of the country, and studies (Luhunga et al., 2018; Borhara et al., 2020) indicate that rainfall will be significantly impacted in future scenarios. For instance, Luhunga et al. (2018) predicted an increased intensity of extreme rainfall events in the northeastern highlands and coastal parts of the country. However, due to the complexity of the geographical patterns of the country, the future variability of weather and climate and occurrence of extreme events differ from place to place.
Therefore, localized studies to capture climate variability and the associated extremes and impacts are vital for planning climate change adaptation measures. Studies have been conducted to explore the spatial and temporal climate change and climate variability around the country (Luhunga et al., 2018; Borhara et al., 2020), but few studies (Mzava et al., 2020; Nyembo et al., 2021; Mwabumba et al., 2022b) have analyzed the climate variability at local scales. However, little has been carried out to determine climate variability and its associated extremes and impacts in the cities and towns with large populations and major economic activities. For example, Anande and Park (2021) examined the local climatic impacts associated with projected urban growth by simulating rainfall and temperature over the rapidly growing cities of the middle-eastern region in Tanzania. However, this study was only conducted for 10 days during the rainfall season in April 2018 and suggests further research to understand the effects of urbanization on the future climate in large cities. Therefore, this study investigates the historical and future variability and changes in spatial and temporal rainfall over Dar es Salaam city in planning for adaptation measures.
Dar es Salaam plays an important role as a major city and has a large port and harbor that provides services and goods for the neighboring countries. The city has experienced rapid urbanization, population growth, climate change, and variability with the increase in frequency and intensity of flood occurrence. However, the combination of the challenges in the region lead to flash floods during the rainfall season that lead to the destruction of infrastructure due to the overflow of rivers and blockage of sewage. Considering the high vulnerability of Dar es Salaam to climate extremes, an in-depth local-scale climatic assessment is required. Therefore, the focus of the present study was to analyze the future changes in precipitation under Representative Concentration Pathway (RCP 4.5) forcing scenarios. The study considered RCP 4.5 to accommodate stabilized radiative forces around 2050 and influenced by the current effort to reduce greenhouse gas emissions (San José et al., 2016). The study applied station data and Climate Hazards Group Infrared Precipitation with Stations (CHIRPS) data spanning 38 years (1982–2019) as a baseline and the CORDEX dataset from 2021–2050 for projection under RCP 4.5 forcing scenarios. These findings will provide a better understanding of the future changes in precipitation that may have critical impacts on the development of Dar es Salaam. The findings will further help meet the Sustainable Development Goal (SDG) 11 in building sustainable cities and communities in the 2030s.
2 Methods
2.1 Study area
This study was conducted in Dar es Salaam, located on the northern coast of Tanzania, between latitudes 6.36˚S and 7˚S and longitude 33.33˚S and 39˚E with an elevation of 53 m above the mean sea level (Figure 1). The area is also characterized by the variation of the elevation level in which the western part experiences the highest elevation and the southern part experiences the lowest elevation. The climate is a tropical type characterized by the warm Indian Ocean. Climatologically, the city experiences two different rainfall seasons: the long rainfall seasons and the short rainfall seasons. The long seasons (Masika) start in March, April, and May (MAM), while the shortest rainfall seasons start in October, November, and December. These rainfall seasons are mainly attributed to the Inter-Tropical Convergence zone (ITCZ) movement, which moves southward in October, reaches the southern part of the country in January or February, and reverses northward in March, April, and May. The average annual rainfall at Dar es Salaam is approximately 1146 mm. The main economic activities of the study area are business and industrial development. The area also has a large population compared to the other regions of the country.
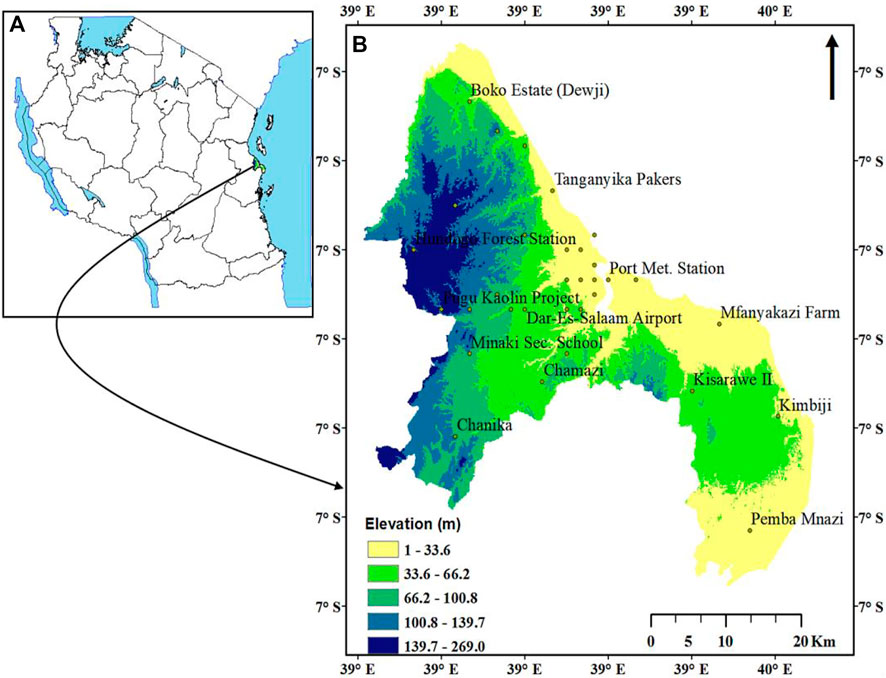
FIGURE 1. The study area map, showing Tanzania (A) and Dar es Salaam region with the location of meteorological stations (B).
2.2 Climate data
Monthly observed rainfall data from 1982 to 2019 were collected from the Tanzania Meteorological Authority (TMA). The study used rainfall data only for the Julius Nyerere International Airport (JNIA) and Port Meteorological stations due to poor observation networks and the unavailability of station data for an extended period (more than 30 years). The city has more than 30 stations but only two have adequate climatic data; therefore, the study applied daily precipitation data from the Climate Hazards Group Infrared Precipitation with Station (CHIRPS) at 0.05° resolution (Funk et al., 2015) for analysis. The study used fourteen (14) station points (Table1), including two stations (Julius Nyerere International Airport and Port Met) with observed data, to analyze the climate of the study area.
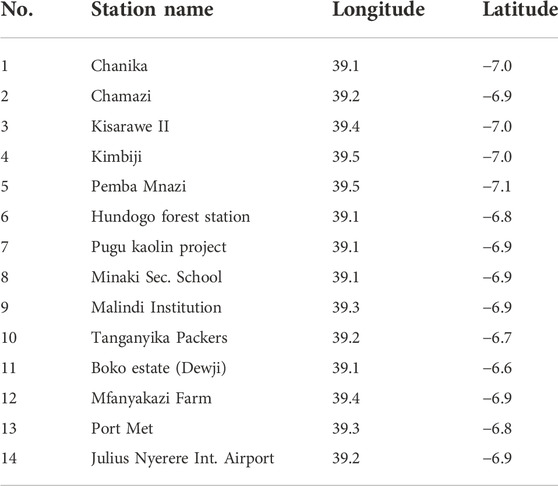
TABLE 1. Stations used in the study.
2.3 Data quality control
A data quality control was performed by validation of the CHIRPS data using two TMAs observed stations’ data for the period 1990–2000 and using the Pearson correlation coefficient (r), the Nash–Sutcliffe efficiency (NSE) and the percentage bias (PBIAS) described in Larbi et al. (2018) and Mwabumba et al. (2022b). Furthermore, CHIRPS data were applied in the gape and filled in for the missing values in observed rainfall data.
2.4 Trend and magnitude detection of the historical period
Using the Mann–Kendall (MK) statistical test, the monthly and annual trend analysis for twelve chosen stations was investigated. The World Meteorological Organization (WMO) recommended the Mann–Kendall statistical test as the most effective method for evaluating trends in the environmental data time series (Huret and Legras, 2014). The test to determine whether specific climate parameters, such as rainfall, were statistically significant was performed using the R software version 4.1.1. Trend analysis of climatic parameters is very sensitive to various factors, and the selection of appropriate statistical techniques is important among the available tests to reach reliable trend results (Abolverdi et al., 2016). Therefore, in the present study, the following methodology was followed for rainfall trend analysis:
1. Descriptive statistics of monthly and seasonal rainfall for the study location were calculated and used for the period 1982–2019.
2. MK and linear regression techniques were used to extract months and seasons and showed a significant trend at a 90% level. Only those periods, which commonly fall into the 90% level of significance of MK and the linear regression test, were extracted and used in the analysis. The results and therefore the extracted data obtained using linear regression and MK in this study were not supplementary but complementary to each other.
The significant period obtained using linear regression was used to obtain the MMKT trend. The annual rainfall trends in the current study were computed with a 95% confidence level (Yavuz and Erdoan, 2012). The MK tests (Eqs 1–5) were used to calculate the slope of the line formed by plotting the variable of interest against time but only considers the sign and not the magnitude of the slope. The MK statistic S was computed as follows:
where xj and xk are sequential data values for the time series data of length n. The sgn series is defined as:
Whenever there is an identical and independent dataset distribution, the mean of S is zero, whereas the variance of S is given by Eq. 3.
where ti is the extent of any given tie. Σti denotes the summation over all ties and is only used if the data series contains tied values. The standard normal variate Z is calculated as indicated in Eq. 4:
The trend decreases if Z is negative and increases if Z is positive. H0, the null hypothesis of no trend, is rejected if the absolute value of Z is greater than Z1- α/2, where Z1- α/2 is obtained from the standard normal cumulative distribution tables.
2.4.1 Significance of the MK test
For the statistical hypothesis test, the significance level α is the probability of rejecting the null hypothesis when there is no trend. The power of the MK test is the probability of rejecting the null hypothesis, 1−β, when there is a trend contained in the data sample as shown in Figure 2.
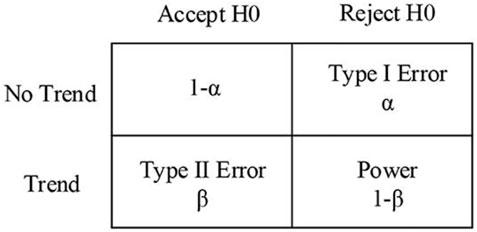
FIGURE 2. Probability matrix for the MK test.
While applying the hypothesis test, the Type I error can be controlled by the significance level α, but the Type II error depends on the sample length in addition to α. In specific cases, the Type II error should also be controlled in addition to reducing the Type I error, especially when the MK test is associated with hydropower station design, flood risk assessment, and water quality evaluation.
2.4.2 Sen’s slope estimator
Sen’s slope estimation technique is a typical non-parametric method of estimating the slope of the regression line, which fits a pair of elements in the vector of (x, y) based on the least square method. The median of all Sen’s slope values for different years is the final slope indicating the magnitude of the whole vector of data. Eqs 5, 6 are other nonparametric methods for trend analysis of the rainfall dataset. They are used to detect the magnitude of the trend from the direction trend of the Mann–Kendall statistical test (Sen, 1968). The methods use a linear model to calculate the change of the slope, and the variance of the residuals should be constant in time
where Qi is the slope between data points Xj and Xk and Qmed is the median slope estimator, which reflects the direction of the trend in the data.
2.5 Standardized anomaly index
A standard anomaly index of rainfall was calculated to examine the nature of trends. It enables the determination of dry and wet years in the record and is used to assess the frequency and severity of drought; it is computed as Eq. 7.
where Xi is the annual rainfall of the particular year, X is the long-term mean annual rainfall throughout the observation period, and σ is the standard deviation of annual rainfall throughout the observation. Negative values indicate a drought period compared to the chosen reference period, while the positive values indicate a wet situation. SAI is also computed for the seasonal scale, and the SAI value classification is presented in Table 2.
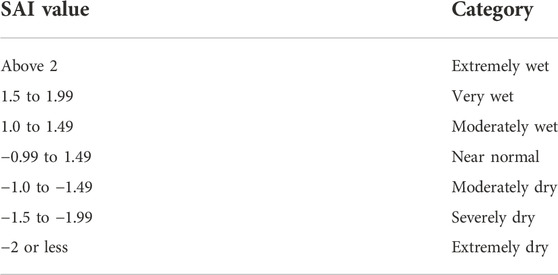
TABLE 2. SAI value classification (McKee et al., 1993).
2.6 Future projection data 2021–2050
The ensemble model can be downloaded from http://www.cordexesg.dmi.dk/esgf-web-fe/. Africa datasets provided the future climate information used in this investigation. Furthermore, future climatic data over the city of Dar es Salaam were obtained using the Coordinated Regional Climate Downscaling Experiment (CORDEX) Africa simulation data from four regional climate models (Table 3). For the typical concentration pathway (RCP 4.5) scenario of climate change, the simulated data were from the historical period (1971–2005) and then for the near future (2021–2050). To observe regional and temporal variability, the climatic data for Dar es Salaam were evaluated per historical data.
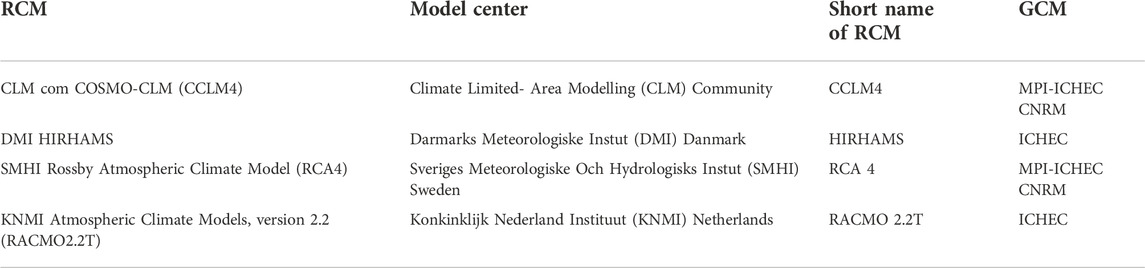
TABLE 3. Characteristics of the CORDEX-Africa models used (Luhunga et al., 2018).
2.7 Spatial distribution analysis of rainfall
The study applied an inverse distance weighted (IDW) interpolation technique in Arc GIS to analyze the spatial distribution of rainfall in the study area for the historical (1982–2019) and future (2021–2050) periods. The IDW interpolation method averages the points while giving the closest neighbors’ points greater weight (Shepard, 1968).
Eq. 8 provides the IDW approach as follows:
where p is the number of points, d is the distance between points, and w is the weighting function.
3 Results and discussion
3.1 Validation of CHIRPS data
The statistical results of CHIRPS rainfall data showed r = 0.96, NSE = 0.82, PBIAS = −8.2, and r = 0.97, NSE = 0.85, and PBIAS = −12.7 for the Nyerere International Airport and Port Met stations, respectively, on a monthly timescale. Therefore, CHIRPS rainfall data compare very well with observed data at monthly timescales.
3.2 Rainfall trend and magnitude of the historical period
The trend and magnitude direction of historical (1982–2019) rainfall were performed by the statistical test as indicated in Table 4. The results indicate annual and seasonal rainfall variability and change in most of the analyzed stations. However, Table 4 highlights the results of the seasonal (MAM and OND) and annual statistical trend test of rainfall for Dar es Salaam, Chanika, and Port Met stations. Seasonally, the MAM showed a slight increase in rainfall amount while the OND season indicated a decrease in seasonal rainfall. The annual trend showed increased rainfall, except for the Port Met station, which indicates a decreasing trend.
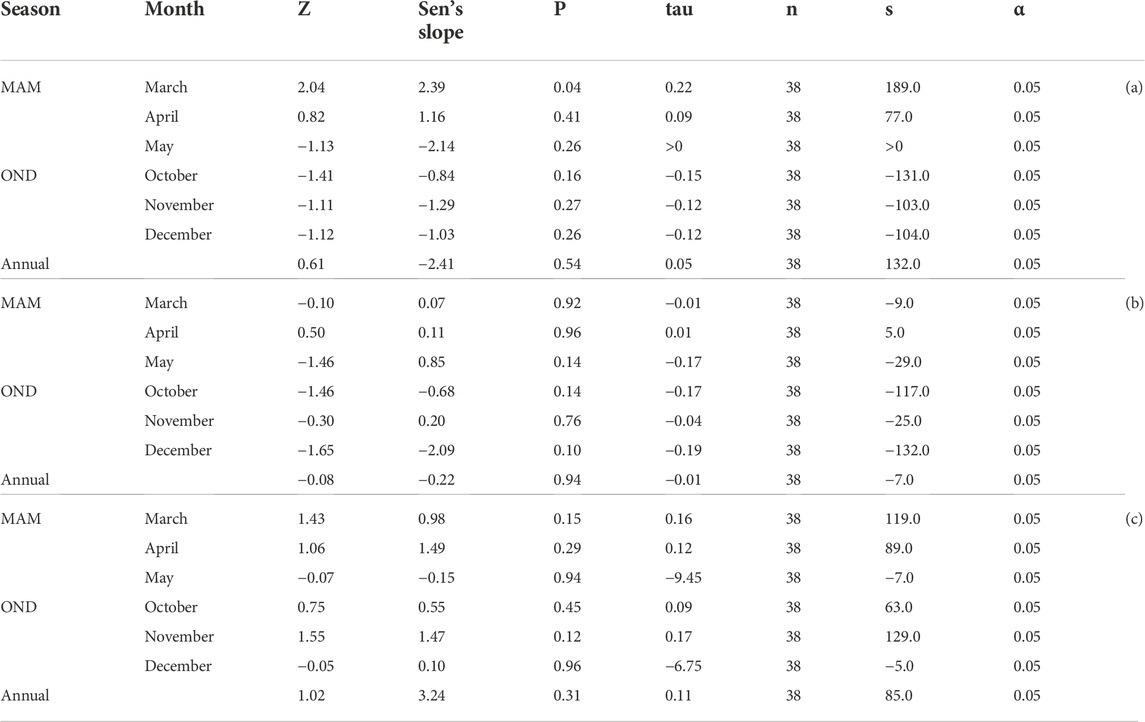
TABLE 4. Mann–Kendall statistical results of (a) Julius Nyerere International Airport (b), Port Met station, and (c) Chanika.
During the MAM season, the results indicated a falling trend in the month of May with significance at the 0.05 level, whereas significant rising trends were determined in March and April at the 0.05 level of significance. The annual precipitation in Dar es Salaam showed an increasing trend (Z value ranging from 0.61 to +1.70). An increasing trend in the annual and seasonal rainfall trends will agree well with the total water availability in Dar es Salaam. An increasing rainfall amount in Dar es Salaam has been associated with an increase in flood frequency, which poses a significant impact on the economy and communities’ livelihoods.
The results indicate that for most areas on the high ground of Dar es Salaam, rainfall is higher compared to the lower ground; for example, when we compare the results of Chanika station (high ground) and Port Met station (low ground) in Table 4. The presence of the forest around the Pugu area accelerates the availability of more rainfall compared to the other areas in the city. The stations around the area at high elevation showed an increase in annual rainfall, including Chanika and Hundogo forest, while the area around JNIA and Port Met showed a decrease in rainfall. These results were supported by Sen’s slope estimator as indicated in Table 4. Several studies detected similar results for the heterogeneity of the station due to the different geographical locations during rainfall formation (Mzava et al., 2020; Nyembo et al., 2021). These results indicate that the amount of rainfall in the region is extremely variable. Generally, the variability was very high in the region due to highly variable year-to-year rainfall as indicated in the study results in Table 4. Variability in rainfall is of great importance for policymakers in their decision regarding the use of water availability in the region. An underdeveloped area like this, in particular, is highly susceptible to significant influences of climate variability in rainfall, which is the main driver of agricultural growth in the studied region, and hence its extreme occurrence during monsoon and also during post and pre-monsoon months is very crucial to growth.
3.3 Standardized anomaly index
The SAI was analyzed to detect the drought in the study area, and the results, as indicated in Figure 3, showed high variability of rainfall in seasons and annual time steps. MAM showed the highly positive and OND negative percentage of the SAI over the study area, indicating wetness and dryness of the area in the seasons. Generally, a large positive percentage in the region was observed in MAM at 55% and OND at 43% and 49% in the annual rainfall. That means more wetness is experienced in the MAM season compared to the OND rainfall season in Dar es Salaam.
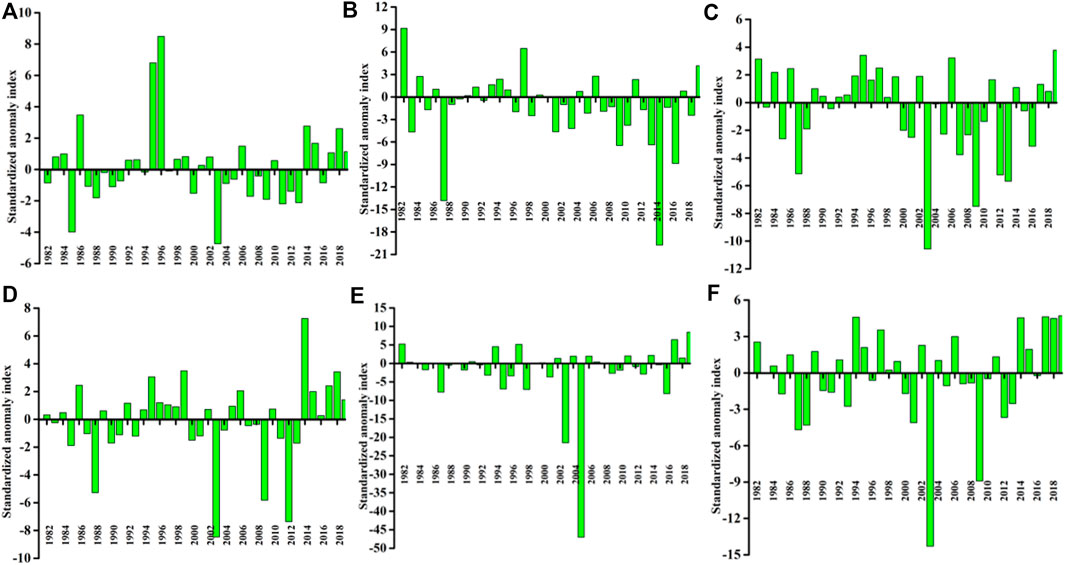
FIGURE 3. Observed historical (1982–2019) Standardized Anomaly Index (SAI) of JNIA meteorological stations for MAM (A), OND (B), and annual rainfall (C), and Boko stations for MAM (D), OND (E), and annual rainfall (F).
3.4 Comparison between future projection and historical rainfall
3.4.1 Future projection monthly cycle
The results in Figure 4 show the monthly cycle for the historical and future projected rainfall around Dar es Salaam. The results for most of the stations indicate that the highest rainfall month will be in April for 2021–2050, and this is similar for the historical rainfall; however, the future projection results indicate a decrease in the amount of rainfall for all months except August to December for JNIA, Chanika, and Port Met. In contrast, the results for Boko station indicate an increasing trend except for January and February. Furthermore, the season’s trends show a decrease in amounts of rainfall during MAM, while the OND showed an increase in rainfall in most areas around the city. The decrease in the amount of rainfall, especially during the MAM season, which normally contributes more to the annual rainfall, would result in a water shortage around the city in the future. This water shortage may lead to limited access to water for household purposes, such as drinking, cooking, and cleaning, and would also raise water prices, force rationing, and even devastate vital water sources like wells during dry conditions. The results on the increase in rainfall during the OND season coincide with previous studies (Gulacha and Mulungu, 2017; Luhunga et al., 2018), which also projected an increase in rainfall over some parts of Tanzania including Dar es Salaam. Another study by Anande and Park (2021) reported a decrease in precipitation on wet days in urbanized areas including Dar es Salaam.
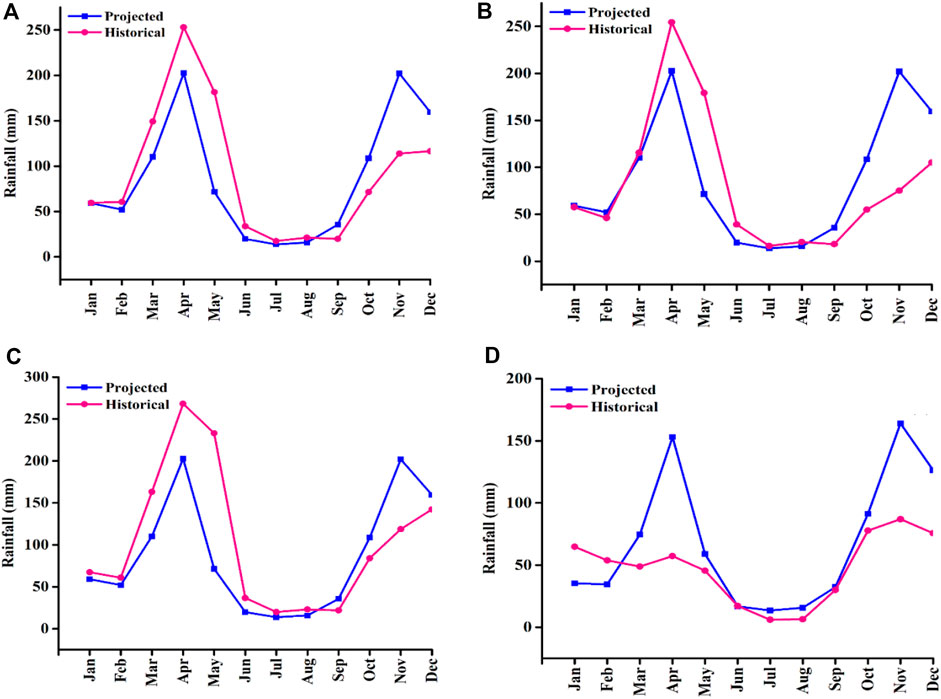
FIGURE 4. Projected monthly mean rainfall (2021–2050) compared to historical (1983–2019) rainfall of Dar es Salaam for JNIA (A), Port Met (B), Chanika (C), and Boko estate (D) meteorological stations.
Increased precipitation in coastal urban regions was mainly due to the strong updraft motion as there were large spatial variations in precipitation. Additionally, large increases or decreases in precipitation occurred along the shorelines. Precipitation in some areas near the coastal region increased, while in other adjacent areas precipitation slightly decreased. Overall, the intensity of rainfall increased, and the occurrence of precipitation became more frequent due to urbanization. As urbanization progresses, daily mean, maximum, and minimum air temperatures in urbanized regions will increase. The minimum temperature increases will be higher than the maximum temperature increases.
3.4.2 Historical and projected spatial rainfall distribution
The results showed that the Dar es Salaam average MAM rainfall was 655.7 mm/y, OND was 324.8 mm/y, and the annual amount was 1235.7 mm/y. Moreover, the results of the spatial distribution of rainfall are presented in Figure 5 for both historical and projected rainfall. Results conclude that the highest amount of rainfall was obtained over the MAM season. The historical spatial distribution results indicate that variability was very high in the city, where a higher amount of rainfall was experienced in the area around Kimbiji and a lower amount in the port met station areas. Also, the results of the future projection of the spatial rainfall distribution are divided into three parts. The northern part will receive a lower amount of rainfall, the middle region will experience a moderate amount of rainfall, and the lower (south) part will receive the highest amount of rainfall over the city.
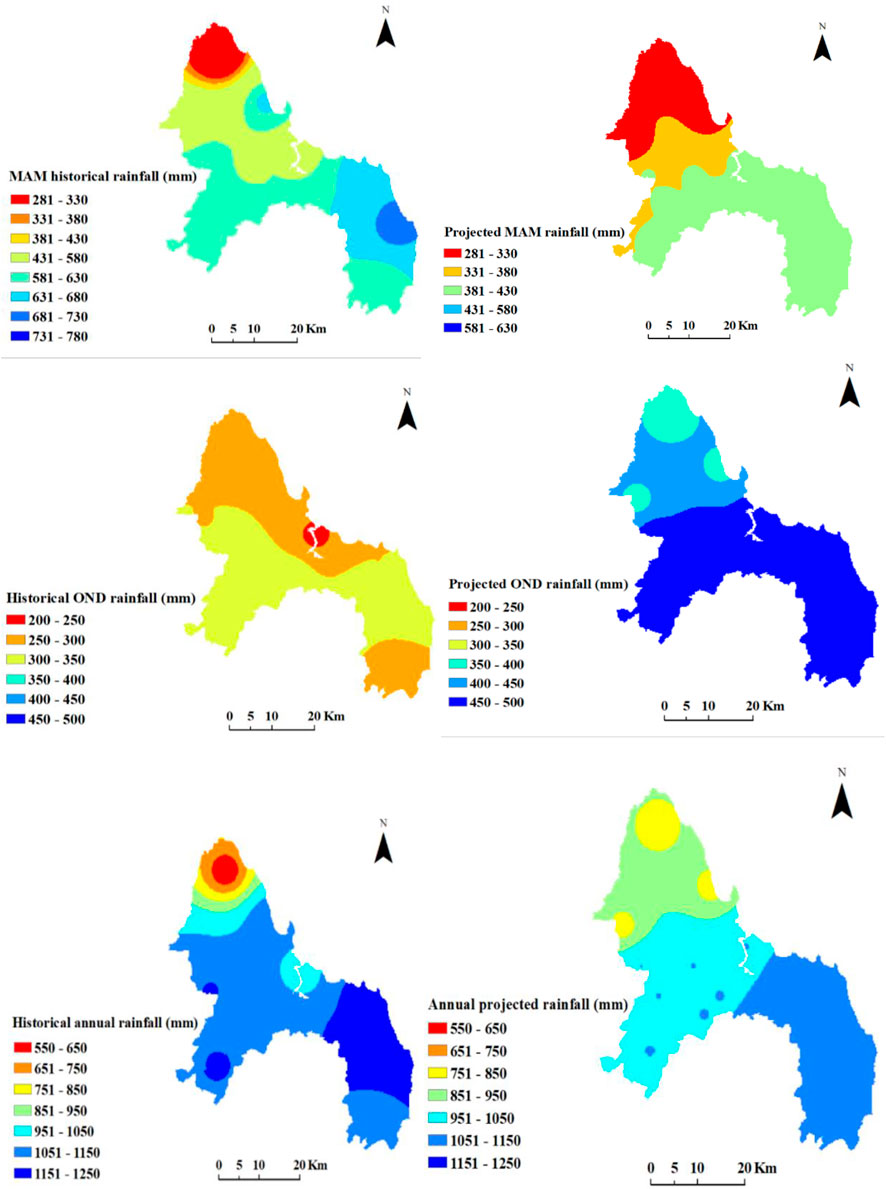
FIGURE 5. Spatial distribution of historical and projected rainfall at a season (MAM and OND) and annual timescale.
The OND results indicate most of the areas received a high amount of rainfall of approximately 354.4 mm compared to the other seasons. The area around Kimbiji and the southern region received a high amount of rainfall, contrary to the Port Met station, which received a 225.5 mm lower amount of rainfall in the city. In the future, the northern part of the city will receive the highest amount of rainfall, averaging 470.1 mm, while the lowest amount will occur around the southern region at approximately 381.7 mm. The annual rainfall distribution results show that the variability was very high in the city, whereby very few regions received a high amount of rainfall such as 1681.3 mm around JNIA station and surrounding areas, while the area around the Port Met station received the lowest amount of rainfall of approximately 960.1 mm.
3.4.3 Rainfall variations and changes
The spatial historical and projected rainfall seasons at Dar es Salaam were analyzed and the results are shown in Figure 5. The MAM historical variability was highly apparent in the study area, where a small part of the northern side experienced less rainfall than other areas. In the future, the spatial distribution showed a decrease in rainfall over the study area with increased coverage of rainfall reduction over the northern part. However, during the OND rainfall season, the spatial distribution of rainfall is projected to increase in many parts of the city by more than half of the historical rainfall amount. The historical annual rainfall distribution showed that a small part of the northern area experienced a lower amount of rainfall. In contrast, the remaining study areas showed a good amount of rainfall distribution. In the future, rainfall distribution in the northern part showed that a lower amount is expected compared to the southern part where more rainfall is expected compared to the rest of the study area.
The spatial rainfall distribution percentage change was also analyzed as indicated in Figure 6. The results showed that MAM’s future rainfall would experience a high decrease in rainfall in many parts of the city by −55%–25%; however, rainfall is expected to increase over a small area in the north. Furthermore, the OND rainfall seasonal change in large part is expected to have a slight increase of rainfall of approximately 40%–60% regarding the region’s average rainfall. The annual rainfall showed a normal to slight decrease in rainfall over a large area. However, small areas in the north will experience an increase in rainfall. The adaptation and execution of policies are highly dependent on climatic conditions, and therefore detection and understanding of rainfall patterns and future projections are of utmost important. According to an IPCC report, upcoming climate changes are likely to distress agriculture, which will amplify hunger and water paucity.
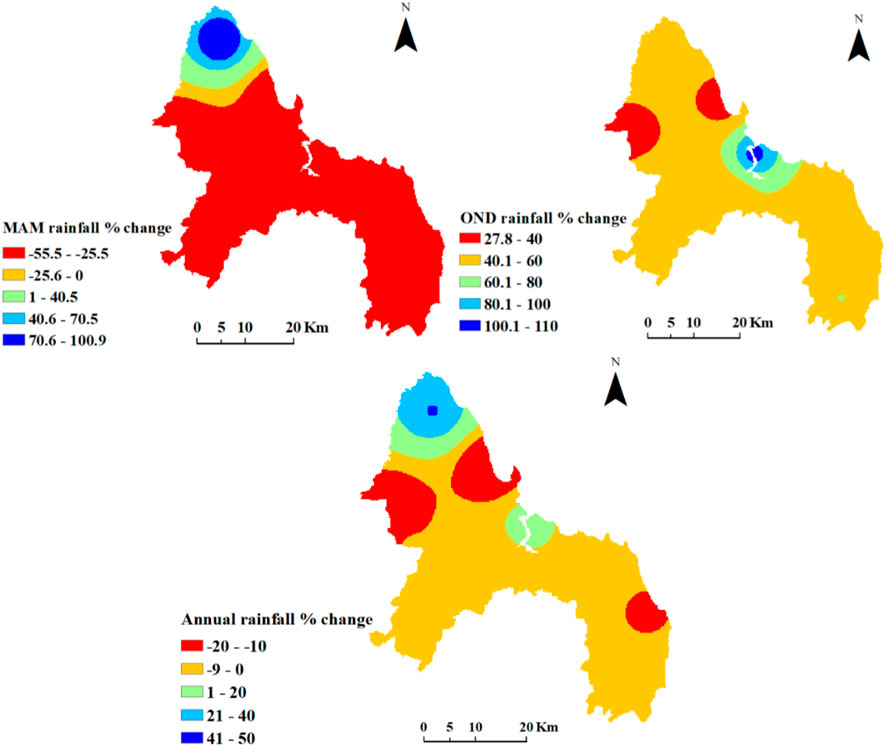
FIGURE 6. Spatial distribution of percentage change in rainfall at a season MAM, OND, and annual timescale.
4 Conclusion
The overall aim of this study was to characterize the historical and projected patterns of trends and rainfall variability over Dar es Salaam. However, some studies attempted to portray the climate variability of the area in a different context. This study analyses variations in seasonal rain patterns by looking at the rainfall amount and distribution over Dar es Salaam. April is the highest rainfall month for both historical and future projections. However, there is a seasonal shift in rainfall as a more elevated amount will be observed during the OND season in the future (2021–2050) and in contrast to the historical (1982–2019) period, which showed higher rainfall during the MAM season. The seasonal shifts and high rainfall over the few areas in Northern Dar es Salaam, while a decrease will occur in a large part of the city from the central to the south, calls for the development of adaptation measures and a strategic plan for managing the impacts associated with these changes. The increase or decrease of rainfall in some areas of Dar es Salaam would result in different social and economic impacts associated with dry conditions and floods in some parts. These changes in rainfall patterns over Dar es Salaam call for optimized urban planning to minimize the adverse climate change impacts on communities. Further studies are required on climate change impacts in urbanized areas to build a climate-resilient community and maintain flexibility in adaptation to future uncertainty. This will help concerned stakeholders to consider rainfall variability in their climate change adaptation strategy and allow policymakers to develop a robust framework for overall development.
Data availability statement
The raw data supporting the conclusion of this article will be made available by the authors, without undue reservation.
Author contributions
LN: investigation, data analysis, and writing—original draft. MM: review and editing and data analysis. JJ: conceptualization, methodology, and writing—reviewing and editing. VK: writing—review and editing.
Acknowledgments
The authors are thankful to the Tanzania Meteorological Authority (TMA) for quality input datasets to facilitate this study.
Conflict of interest
The authors declare that the research was conducted in the absence of any commercial or financial relationships that could be construed as a potential conflict of interest.
Publisher’s note
All claims expressed in this article are solely those of the authors and do not necessarily represent those of their affiliated organizations, or those of the publisher, the editors, and the reviewers. Any product that may be evaluated in this article, or claim that may be made by its manufacturer, is not guaranteed or endorsed by the publisher.
References
Abolverdi, J., Ferdosifar, G., Khalili, D., Kamgar-Haghighi, A. A., and Physics, A. (2016). Spatial and temporal changes of precipitation concentration in Fars province, southwestern Iran. Meteorol. Atmos. Phys. 128 (2), 181–196. doi:10.1007/s00703-015-0414-0
Anande, D. M., and Park, M. S. (2021). Impacts of projected urban expansion on rainfall and temperature during rainy season in the middle-eastern region in Tanzania. Atmosphere 12 (10), 1234. doi:10.3390/atmos12101234
Borhara, K., Pokharel, B., Bean, B., Deng, L., and Wang, S-Y. S. (2020). On Tanzania’s precipitation climatology, variability, and future projection. Climate 8 (2), 34. doi:10.3390/cli8020034
Ddamulira, R. (2016). Climate change and energy in East Africa. Development 59, 257–262. doi:10.1057/s41301-017-0101-1
Funk, C., Peterson, P., Landsfeld, M., Pedreros, D., Verdin, J., Shukla, S., et al. (2015). The climate hazards infrared precipitation with stations—A new environmental record for monitoring extremes. Sci. Data 2 (1), 1–21. doi:10.1038/sdata.2015.66
Gulacha, M. M., and Mulungu, D. M. (2017). Generation of climate change scenarios for precipitation and temperature at local scales using SDSM in Wami-Ruvu River Basin Tanzania. Phys. Chem. Earth Parts A/B/C 100, 62–72.
Huret, N., and Legras, B. (2014). Climate change and variability in sub-saharan Africa: A review of current and future trends and impacts on agriculture and food security. Environ. Dev. Sustain 13 (3), 587–605. doi:10.1007/s10668-010-9278-0
JahangeerGupta, P. K., and Yadav, B. K. (2018). “Spatial and temporal nitrate transport in deep heterogeneous vadose zone of India’s alluvial plain”. Groundwater. Water science and technology library. Editors V. Singh, S. Yadav, and R. Yadava (Singapore: Springer), Vol. 76. doi:10.1007/978-981-10-5789-2_13
JahangeerGupta, P. K., and Yadav, B. K. (2017). Transient water flow and nitrate movement simulation in partially saturated zone. J. Irrig. Drain. Eng. 143 (12), 04017048. doi:10.1061/(asce)ir.1943-4774.0001238
Kotir, J. H. (2011). Climate change and variability in Sub-Saharan Africa: A review of current and future trends and impacts on agriculture and food security. Environ. Dev. Sustain. 13 (3), 587–605.
Kumar, R., Kumar, A., Shankhwar, A. K., Vishkarma, D. K., Sachan, A., Singh, P. V., et al. (2022). Modelling of meteorological drought in the foothills of central Himalayas: A case study in uttarakhand state, India. Ain Shams Eng. J. 13 (3), 101595. doi:10.1016/j.asej.2021.09.022
Kumar, V., Chaplot, B., Omar, P. J., Mishra, S., and Md. Azamathulla, H. (2021). Experimental study on infiltration pattern: Opportunities for sustainable management in the northern region of India. Water Sci. Technol. 84 (10-11), 2675–2685. doi:10.2166/wst.2021.171
Kumar, Vikram, and Sen, Sumit (2020). Assessment of spring potential for sustainable agriculture: A case study in lesser Himalayas. Appl. Eng. Agric. 36 (1), 11–24. doi:10.13031/aea.13520
Kumar, V., Shanu, , and Jahangeer, (2017). Statistical distribution of rainfall in Uttarakhand, India. Appl. Water Sci. 7 (8), 4765–4776. doi:10.1007/s13201-017-0586-5
Larbi, I., Hountondji, F. C., Annor, T., Agyare, W. A., Mwangi Gathenya, J., and Amuzu, J. (2018). Spatio-temporal trend analysis of rainfall and temperature extremes in the Vea Catchment, Ghana. Climate 6 (4), 87.
Luhunga, P. M., Kijazi, A. L., Chang'a, L., Kondowe, A., Ng'Ongolo, H., and Mtongori, H. (2018). Climate change projections for Tanzania based on high-resolution regional climate models from the coordinated regional climate downscaling experiment (CORDEX)-Africa. Front. Environ. Sci. 6, 122. doi:10.3389/fenvs.2018.00122
Maskrey, A., Buescher, G., Peduzzi, P., and Schaerpf, C. (2007). “Disaster risk reduction: 2007 global review,” in Prepared for the Global Platform for Disaster Risk Reduction First Session, Geneva, Switzerland (Consultation Edition), 5–7.
McKee, T. B., Doesken, N. J., and Kleist, J. (1993). The relationship of drought frequency and duration to time scales. Proc. 8th Conf. Appl. Climatol. 17 (22), 179–183.
Meshram, S. G., Singh, S. K., Meshram, C., Deo, R. C., and Ambade, B. (2018). Statistical evaluation of rainfall time series in concurrence with agriculture and water resources of Ken River basin, Central India (1901–2010). Theor. Appl. Climatol. 134 (3), 1231–1243. doi:10.1007/s00704-017-2335-y
Mwabumba, M., Jahangeer, J., Beegum, S., Yadav, B. K., and Rwiza, M. J. (2022a). Assessment of groundwater quality under changing climate in ngorongoro conservation area, Tanzania. J. Irrig. Drain. Eng. 148 (10), 04022032. doi:10.1061/(asce)ir.1943-4774.0001702
Mwabumba, M., Yadav, B. K., Rwiza, M. J., Larbi, I., Dotse, S. Q., Limantol, A. M., et al. (2022b). Rainfall and temperature changes under different climate scenarios at the watersheds surrounding the Ngorongoro Conservation Area in Tanzania. Environ. Challenges 7, 100446. doi:10.1016/j.envc.2022.100446
Mzava, P., Valimba, P., and Nobert, J. (2020). Trends and frequencies of extreme rainfall events in the urban catchments of dar es salaam, Tanzania. J. Geogr. Assoc. Tanzan. 40 (1).
Nyatichi, J. M. (2015). Co-Operatives and employment creation: The kenyan case. Int. Co-op. Alliance Seminar Antalya Turk. 8th 13th November 2015 57, 743.
Nyembo, L. O., Larbi, I., and andd Rwiza, M. J. (2021). Analysis of spatio-temporal climate variability of a shallow lake catchment in Tanzania. J. Water Clim. Change 12 (2), 469–483. doi:10.2166/wcc.2020.197
Pachauri, R. K., and Meyer, L. A. (2014). Climate change 2014: Synthesis report. Contribution Work. Groups I, II III Fifth Assess. Rep. Intergov. Panel Clim. Change 743, 1876.
Palmate, Santosh S., Ashish Pandey, Rajendra P. Pandey, Mishra, Surendra K., and Mishra, S. K. (2021). Assessing the land degradation and greening response to changes in hydro-climatic variables using a conceptual framework: A case-study in central India. Land Degrad. Dev. 32 (14), 4132–4148. doi:10.1002/ldr.4014
Palmate, Santosh S., Kumar, Saurav, Poulose, Thomas, Ganjegunte, Girisha K., Chaganti, Vijayasatya N., and Sheng., Zhuping (2022). Comparing the effect of different irrigation water scenarios on arid region pecan orchard using a system dynamics approach. Agric. Water Manag. 265, 107547. doi:10.1016/j.agwat.2022.107547
San José, R., Pérez, J. L., González, R. M., Pecci, J., Garzón, A., and Palacios, M. (2016). Impacts of the 4.5 and 8.5 RCP global climate scenarios on urban meteorology and air quality: Application to Madrid, Antwerp, Milan, Helsinki and London. J. Comput. Appl. Math. 293, 192–207. doi:10.1016/j.cam.2015.04.024
Sen, P. K. (1968). Estimates of the regression coefficient based on kendall's tau. J. Am. Stat. Assoc. 63 (324), 1379–1389. doi:10.1080/01621459.1968.10480934
Shepard, D. (1968). “A two dimensional interpolation function for irregularly spaced data,” in Proceedings 23rd National Conference of the Association for Computing Machinery, Princeton, NJ (ACM), 517–524.
Sipayung, S. B., Nurlatifah, A., Siswanto, B., and Slamet S, L. (2018). Analysis of climate change impact on rainfall pattern of sambas district, west kalimantan IOP conference series: Earth and environmental science. IOP Conf. Ser. Earth Environ. Sci. 149 (1), 012029. doi:10.1088/1755-1315/149/1/012029
Tschakert, P., Sagoe, R., Ofori-Darko, G., and Codjoe, S. N. (2010). Floods in the Sahel: An analysis of anomalies, memory, and anticipatory learning. Clim. Change 103 (3), 471–502.
Umar, S., Lone, M. A., Goel, N. K., and Zakwan, M. (2022). Trend analysis of hydro-meteorological parameters in the Jhelum River basin, north Western Himalayas. Theor. Appl. Climatol. 148 (3), 1417–1428. doi:10.1007/s00704-022-04014-7
Yavuz, H., and Erdoğan, S. (2012). Spatial analysis of monthly and annual precipitation trends in Turkey. Water Resour. manage. 26 (3), 609–621. doi:10.1007/s11269-011-9935-6
Keywords: rainfall, historical, projection, spatial and temporal distribution, statistical analysis
Citation: Nyembo LO, Mwabumba M, Jahangeer J and Kumar V (2022) Historical and projected spatial and temporal rainfall status of Dar es Salaam, Tanzania, from 1982 to 2050. Front. Environ. Sci. 10:1025760. doi: 10.3389/fenvs.2022.1025760
Received: 23 August 2022; Accepted: 17 November 2022;
Published: 05 December 2022.
Edited by:
Dabang Jiang, Institute of Atmospheric Physics (CAS), ChinaReviewed by:
Mojisola Oluwayemisi Adeniyi, University of Ibadan, NigeriaMohammad Zakwan, Maulana Azad National Urdu University, India
Rajneesh Singh, University of Minnesota Twin Cities, United States
Santosh S. Palmate, Texas A&M AgriLife Research and Extension Center at El Paso, United States
Copyright © 2022 Nyembo, Mwabumba, Jahangeer and Kumar. This is an open-access article distributed under the terms of the Creative Commons Attribution License (CC BY). The use, distribution or reproduction in other forums is permitted, provided the original author(s) and the copyright owner(s) are credited and that the original publication in this journal is cited, in accordance with accepted academic practice. No use, distribution or reproduction is permitted which does not comply with these terms.
*Correspondence: Jahangeer Jahangeer, amFoYW5nZWVyLnRvbWFyQGdtYWlsLmNvbQ==; Vikram Kumar, MjUudmlrcmFtQGdtYWlsLmNvbQ==
†These authors have contributed equally to this work