 Qizhen Wang
 Shengyuan Wang
- Business School, Nanjing Xiaozhuang University, Nanjing, China
With the rapid development of economy and the increase of population, water consumption has increased in China. Meanwhile, water waste, water pollution and uneven distributions of water resources have posed a great challenge to China’s economic development. Hence, the improvement of water resources utilization efficiency has become an important measure to solve the shortage of water resources. In this study, the super efficiency Data envelopment analysis model and Tobit model are adopted to study the impact of environmental regulation on water resources utilization efficiency. The results show that water resources efficiency score is different in different regions in China, where the efficiency score in the eastern region is the highest, followed by the western region and the central region. Environmental regulation negatively affects water resources utilization efficiency and these effects are different effects in different regions. Environmental regulation affects three variables, foreign direct investment, technological innovation, industrial structure, and then affects water resources utilization efficiency through these variables. Based on the above research, we put forward some policy recommendations for increasing environmental regulation intensity to improve water resources utilization efficiency.
1 Introduction
Water resource is a kind of precious natural resource with both economic and ecological values. With the acceleration of urbanization and industrialization in China, the demand for water has been increasing year after year. The unbalanced regional distribution of water resources, serious water waste and pollution, and low utilization efficiency have made the shortage of water resources increasingly serious, which has gradually affected China’s ecological environment and economic development. To solve the problem of water shortage in China, we need to increase the water resources or improve water resources utilization efficiency (WRUE). Since water supply is restricted by the stock of water resources, improving WRUE, especially from the perspective of environment, has become a sustainable and important method.
The improvement of WRUE is very important. First, the type of industrial growth of China is resource-driven, therefore, improving WRUE remains necessary for China’s green development (Wang et al., 2021). The improvement of WRUE not only alleviates the rising trend of water resource demand, but also guarantees water resource supply. This is advantageous to solve the problem of water shortage. Second, the improvement of WRUE is good to develop a circular economy. The circular economy is a new economic model, which can resolve the problem of resource use and environmental protection, and at last decouple economic growth from environmental destruction (Wang et al., 2021). In recent years, China has experienced a rapid economic development. However, the economic expansion has seriously damaged natural resources and the environment, which has a negative impact on the sustainable development. In order to realize the sustainable development, developing a circular economy through the improvement of WRUE is necessary at the present stage of China.
The effective way to improve WRUE from the perspective of environment is environmental regulation (ER). ER is a restrictive measure, policy, regulation and implementation process for economic activities in order to improve ecological and economic efficiency. It can be classified into three types: command-and-control regulation, market-based regulation and voluntary regulation. Command-and-control regulation constrains the environmental behavior of enterprises through setting a technology standard, establishes the emission standards of air pollutants and punishes the enterprise which violates environment protection laws and regulations. Market-based ER establishes a system of emission charge, emission tax and emission trading. It controls the innovative cost and stimulates innovation vitality by levying punishment tax on enterprises with high pollutant discharge and subsidizing enterprises with low pollutant discharge. The pollution discharge fee and tradable emission allowances can promote the internalization of external costs, reduce enterprise costs and realize environmental and economic benefits, leading to the improvement of WRUE. Voluntary ER is that the pollution discharge of enterprises is under the supervision of the masses. For example, people will report to the government when they find out serious events of the environmental pollution. They will negotiate with polluting enterprises in terms of environmental pollution and economic compensation through the environmental protection organization, and expose various pollution events through network. Enterprises will be under pressure to take measures such as technological innovation and improving efficiency to reduce environmental pollution, which will affect WRUE.
Due to the existence of heterogeneity, the intensity of environmental regulation is different in different regions (Wang et al., 2021). The benefits of developing technological innovation to improve WRUE are lower than the ER cost paid by enterprises under low intensity of ER. Enterprises are intended to pay the cost of environmental supervision and do not conduct technological innovation, which is not conducive to the improvement of water resource utilization efficiency. Under the high intensity of ER, ER brings innovation compensation effects, and the innovation compensation benefit is greater than the cost of ER (Zhang et al., 2021). Enterprises will carry out technological innovation and improve water resource utilization efficiency. Therefore, the impact of ER on WRUE is unstable, which is affected by the intensity of ER.
In this study, the super efficiency DEA model is adopted to calculate water resource utilization efficiency values of 30 provinces and cities in China. The DEA method is a powerful analysis tool, which is proved as an effective method to evaluate the relative efficiency of decision-making units (Song et al., 2018; Wang and Sun, 2018). The Tobit model is adopted to analyze the impact of ER on China’s WRUE, and the differences among the eastern, central and western regions are compared.
2 Literature review
WRUE is an important comprehensive index reflecting the effective development, utilization and management of water resources. From the supply side, it refers to the supply efficiency of water resources in the process of aquatic products from production to terminal consumption. From the demand side, it refers to utilization efficiency of water resources in relevant social economic activities. At present, academic circles generally study regional water resources efficiency from the demand side (Dadabaev, 2016; Selvakumar et al., 2017; Lu, 2019).
2.1 Measurement of WRUE
Under the background of insufficient water resources and increasing environmental constraints, more and more scholars pay attention to the measurement of WRUE. At present, there are three ways to measure WRUE: single factor WRUE, total factor WRUE and multi-index comprehensive WRUE.
Single factor WRUE, reflecting water consumption through the input-output ratio, is measured by the intensity of water consumption. For example, water consumption per GDP (Yang and Liu, 2014), net income per unit of water consumption (Cai et al., 2003), productivity per unit of water consumption (Evans and Sadler, 2008), water consumption per mu for agricultural irrigation (Wallace, 2000; Deng et al., 2006; Singh, 2007; Fang et al., 2010). The measurement of single factor productivity is relatively simple and highly operational. However, it is not enough to describe the result of the joint action of various input factors, which cannot reflect the actual production process and the substitution relationship between various input factors. The total factor WRUE includes a variety of factors such as labor and capital, which puts the input-output factors into a unified analysis framework and is more in line with the actual production process (Cheng et al., 2016).
Total factor WRUE measures water resources use based on the relationship between total input and total output, incorporating with labor, capital and economy. Data envelopment analysis (DEA) and stochastic Frontier analysis (SFA) are used to measure total factor WRUE. Two methods measure the efficiency by comparing the gap between the actual input/output of each decision-making unit and the ideal input or output. Cao et al. (2018) used the generalized efficiency (GE) indicator, defined as the ratio of total water consumption (TWC) to total water inflow (TWI) entering the agricultural production system within 1 year, to evaluate WRUE. Kaneko et al. (2004) used SFA to measure agricultural WRUE of six regions in China. They found that agricultural WRUE of northwest China was the highest and that of south coast was the lowest.
With the continuous increase of public concern to environmental issues and the promotion of industrial green transformation and upgrading, The connotation of WRUE changes from focusing on economic benefits to take into account both economic and environmental benefits. A comprehensive index, multi-index comprehensive WRUE, is constructed, which evaluates WRUE from a multidimensional perspective. Xu et al. (2019) evaluated the water input and output efficiency with the aggregating comprehensive indicator calculated by appropriate mathematical methods. Huang et al. (2016) constructed an indicator to evaluate the ecosystem water-use efficiency, which was the ratio of carbon assimilation to evapotranspiration. The index considered not only economic attribute of water resources, but also ecological attribute of water resources.
2.2 Environmental regulation
In early studies, ER is a direct government intervention in the utilization of environmental resources, which is mainly through non-market means. In other words, policies and mandatory means are formulated by the government to ensure economic development while taking into account the ecological environment, so as to reduce the external impact of pollutant emission (Pashigian, 1984). With further research, scholars find that public concern on environmental pollution continues to increase, and media organizations and environmental groups also affect pollution emission of enterprises, which makes non-market means evolve into an informal ER. Pargal and Wheeler (1996) first put forward informal ER, who found that communities usually adopted channels such as negotiation or consultation with factories to promote local factories to reduce pollution through informal regulation when the intensity of formal ER was low.
Scholars have carried out a lot of research on both formal and informal ER. For example, Mulatu et al. (2010), Yuan and Xiang (2018) studied the relationship between ER and innovation. Vogel (2000), Bernauer and Caduff, 2004, Hashmi and Alam (2019) studied the relationship between ER and economic development. López-Gamero et al. (2010), Hao et al. (2018), Karplus et al. (2021) studied the effectiveness of ER. Hanna (2010), Chung (2014), Cai et al. (2016) studied the relationship between ER and foreign direct investment (FDI).
The research on the relationship between ER and resource utilization efficiency mainly focus on cost hypothesis and Porter hypothesis. The cost hypothesis thinks that enterprises have to pay pollution charges due to the ER, which increases the production cost of enterprises. When the technology of enterprises remains constant and the market price is fixed, the increase of cost reduces the profits of enterprises, crowds out the R&D investment of enterprises in production technology and leads to the decline of enterprise resource utilization efficiency. Greenstone et al. (2012) studied the impact of air quality regulations on manufacturing plants’ total factor productivity (TFP). The results showed that non-attainment designation was related to a roughly 2.6 percent decline in total factor productivity among surviving plants in heavily polluting industries. The regulations governing ozone had great negative impact on productivity, though negative effects were also evident among emitters of particulates and sulfur dioxide.
Porter hypothesis considered that appropriate ER could produce innovation compensation effects, partially or even completely offset environmental protection cost of enterprises, Innovation compensation effects meant that ER stimulated enterprises’ R&D investment and promoted technological innovation. Through technological innovation, country would achieve the “win-win” condition of both environmental protection and economic growth and acquire the first-mover advantage, which would promote the improvement of enterprise productivity and profit. Wang and Shen (2016) investigated the nonlinear relationship between ER and environmental productivity based on the assumption of industrial heterogeneity, and evaluated the optimal regulatory environment. Albrizio et al. (2017) constructed a new Porter Model to study the relationship between ER and total factor productivity. They found that the implementation of ER could promote the improvement of industry total factor productivity in high-technology countries.
2.3 Influencing factors of WRUE
A number of studies have been conducted to explore the impact of natural factors on WRUE. Lawson and Blatt (2014) found that the stomata ultimately controlled 95% of all gaseous fluxes between the leaf and the environment. Therefore, the stomata had an important impact on the water loss and WRUE. They also found that the photosynthesis affected WRUE. Peters et al. (2018), Leakey et al. (2019), Bertolino et al. (2019) reached the same conclusion as Lawson and Blatt (2014). Blankenagel et al. (2018) found that WRUE could be increased by restricting transpiration. Wang et al. (2014), Mbava et al. (2020) found that the climate had an important impact on WRUE. Farooq et al. (2019) found that WRUE was affected by many natural factors such as root system, water absorptivity, temperature, precipitation and photosynthetically active radiation. Mbava et al. (2020) used total water to measure water resource endowment and found that total water is negatively related to water use efficiency.
There are some economic and social factors affecting WRUE. Kaneko et al. (2004) firstly adopted stochastic Frontier analysis (SFA) to measure the technical and water efficiency in agricultural production in China from an economic perspective, and then employed the Tobit model to evaluate the determinants of its efficiency. The results showed that net income had a positive impact on water efficiency. Yao et al. (2018) also found that income level of residents was a variable affecting green total factor water efficiency of industry in China. In addition, open level, measured by the total import and export volume is one of influencing factors of green total factor water efficiency.
Song et al. (2018) analyzed the influencing factors of water resources utilization efficiency. They found that water resource endowment, population density and level of economic development were decisive variables of water resources utilization efficiency. The results showed both water resource endowment and level of economic development negatively affected water resources utilization efficiency, whereas population density positively affected water resources utilization efficiency. Deng et al. (2016) found that there were several economic and policy variables affecting water use efficiency. Among these variables, import dependency, export dependency and foreign trade dependence have a positive impact on water use efficiency while the ratio of added value in agricultural sector and sewage per unit of output has a negative impact on water use efficiency. Zhou and Tong (2022) investigated the impact of industrial urbanization, population urbanization, land urbanization, social urbanization, and urban-rural integration on green water-use efficiency. They found that Industrial urbanization and land urbanization positively affected green water-use efficiency, whereas social urbanization and urban-rural integration negatively affected green water-use efficiency. The findings were of great significance in accelerating the development of new type of urbanization and promoting industrial transformation and upgrading.
Few studies have been conducted to study the impact of ER on WRUE. Song et al. (2018) used the directional distance function and Malmquist (ML) index and Tobit model to estimate WRUE and influencing factors under environmental restrictions. The results showed that WRUE was lack and its regional heterogeneity existed, and water conservation awareness negatively affected WRUE. Jin et al. (2019) calculated green total factor efficiency (GTFE) of industrial water resources and its influencing factors. They found that ER had a negative impact on the improvement of China’s GTFE of industrial water resources, but ER in the eastern, central, and western regions had positive impacts on the improvement of industrial water resources.
To sum up, scholars have made fruitful research on WRUE, and they provide a theoretical foundation for this study. According to the existing studies, there is still room for improvements. First, limited attention is given to the impact of ER on WRUE. Is there a linear relationship between these two? Second, so far, little study has incorporated ER, FDI, technological innovation, industrial structure and WRUE into one analytical framework. More specifically, the possible mediating role of FDI, technological innovation and industrial structure has been neglected by most prior research. Third, analysis using sub-samples from different regions in China is insufficient, and the relationship between variables needs to be further investigated. Given this, this study examines the impact of ER on WRUE and assesses the mediating role of FDI, technological innovation and industrial structure based on the provincial-level data of China. Moreover, further analyses are conducted by testing the relationship between the key variables based on the sub-sample data from the eastern, central and western regions.
3 Methods and materials
3.1 Theoretical framework
3.1.1 The mechanism of ER affecting WRUE through FDI
ER affects WRUE through foreign direct investment (FDI). There are two views on ER and FDI location selection: pollution heaven effect and pollution halo effect. The former holds that the increase of ER intensity in the home country increases the production cost of polluting enterprises. In order to reduce production cost and maintain profits, polluting enterprises tend to transfer polluting industries to countries with low intensity of ER. The latter states that the home country of multinational corporations has strict environmental standards and requirements. Therefore, multinational corporations have advanced pollution treatment technology to reduce environmental costs. When investing in countries with high intensity of ER, multinational corporations usually continue to use previous pollution treatment technologies for production. This is conductive to improve environment in the host country.
In an open economy, multinational corporations play an important role in economic development. Local governments strive to attract foreign direct investment for economic growth, sometimes neglecting the cost of ecological environment. For the regions with low intensity of ER, lots of pollution-intensive multinational enterprises may agglomerate in these regions. This leads to the waste of resources and serious environmental pollution, and makes it difficult to improve resource utilization efficiency, including WRUE. The entry of multinational corporations is conducive to the economic development of the host country. With the economic development and the improvement of environmental protection requirements, the intensity of ER will increase. When the intensity of ER is high, multinational corporations have to rely on advanced technology and management to obtain competitive advantage. They achieve low consumption, low emission and low pollution in the process of production, which result in resources conservation and the improvement of resource utilization efficiency. On the other hand, multinational corporations have spillover effects on local enterprises. Local enterprises imitate advanced foreign technology and environmental requirements from multinational corporations and then carry on the technological innovation to obtain effective competitiveness, which leads to improve resource utilization efficiency. The advanced technology and management from both foreign corporations and domestic corporations leads to the overall improvement of water resource utilization efficiency of host country.
With this, we propose Hypothesis 1 and Hypothesis 2:
Hypothesis 1:. ER will affect WRUE.
Hypothesis 2:. ER will affect WRUE through FDI.
3.1.2 The mechanism of ER affecting WRUE through technological innovation
ER affects WRUE of enterprises through technological innovation. There are Porter hypothesis and cost hypothesis about the influence of ER on technological innovation. Porter hypothesis holds that ER will bring innovation compensation effects. Enterprise will carry out technological innovation, save production resources, improve productivity and reduce pollution under appropriate ER. According to Jaffe and Palmer (1997), Porter hypothesis can be distinguished into three different hypotheses: narrow version of the hypothesis, weak version of the hypothesis and strong version of the hypothesis. The narrow version of the hypothesis focuses on the impact of some ERs on technological innovation. With these flexible regulation policies, enterprises will improve the competitiveness by accelerating technological innovation, offsetting the cost brought by ER and increasing resource utilization efficiency. The weak version of the hypothesis states that ER has a threshold effect on technological innovation. ER has a crowding out effect on enterprises’ innovation and increases production cost. When the intensity of ER is over a certain threshold, it will promote environmental R&D investment, and in this process, the utilization efficiency of resource will be affected. The strong version of the hypothesis holds ER is beneficial to technological innovation, because innovation income is larger than ER costs. In other words, ER can make enterprises promote competitiveness, reduce costs and obtain more profits.
The cost hypothesis thinks that ER negatively affects technological innovation and technological diffusion, which is not good to resource utilization efficiency. In order to increase ER intensity, government will levy sewage charges on enterprises and set higher sewage standards. Therefore, the implementation of ER will urge enterprises to invest in environmental pollution treatment in order to meet environmental protection requirement. However, the enterprise resource allocation itself is also fixed. After part of the production investment is used for the construction and implementation of ER, the investment in other aspects will be reduced, including technological innovation investment. Low investment in technological innovation slows down the renewal of technology, backward production technology and aging production equipment, resulting in a large waste of resources. So the cost effect of the ER negatively affects technological innovation and resource utilization efficiency.
Based on the above, we propose Hypothesis 3:
Hypothesis 3:. ER will affect WRUE through technological innovation.
3.1.3 The mechanism of ER affecting WRUE through industrial structure
ER affects WRUE through industrial structure. ER is disadvantage to industrial structure and resource utilization efficiency as its intensity is low. According to neoclassical theory, enterprises’ production has a follow-up cost effect. Enterprises will increase production costs and reduce profits as the intensity of ER is not high. In order to make up for losses, enterprises will increase the market price of products, which leads to the loss of comparative advantage and crowding out effect on the investment in production equipment and pollution control equipment. Hence, the budget expenditure for industrial development will be reduced, which is not conductive to the industrial transformation and upgrading. On the other hand, enterprises have to make choices between pollution intensive industries with low costs and low polluted industries with high costs due to the ER. To maximize the profit, production factors will be transferred from the clean industrial sector to the high pollution industrial sector, and then the production will be locked in the pollution-intensive industries. This is bad to industrial structure and resource utilization efficiency.
When the intensity of ER increases, the cost of environmental governance is far lower than the sewage cost. Enterprises will introduce more advanced production equipment and pollution control equipment, accelerate the innovation of green technology and eliminate backward production equipment. Through correlative effects and demonstration effects, the industry will change the previous production mode of high consumption and high pollution into the production mode of low-carbon and environmental protection, which is conducive to the upgrading of industrial structure and the improvement of resource utilization efficiency. According to pollution heaven hypothesis, enterprises will actively be far away from regions with high intensity of ER and transfer their industries to regions with low intensity of ER. Different regions adopt different ER measures, resulting in high pollution enterprises in areas with strict ER tend to migrate to areas with low intensity of ER, which will affect industrial structure of moving-out and moving-in areas. At last, the industry in the moving-out areas will realize transformation and upgrading, and the moving-in areas will finally realize the transforming of industrial structure and the increase of resources utilization efficiency with the enhancement of ER.
Based on the above, we propose Hypothesis 4.
Hypothesis 4:. ER will affect the water resource utilization efficiency through industrial structure.
3.2 Methods
3.2.1 Super-efficiency DEA model
Data envelopment analysis (DEA) is a relatively effective evaluation means using input-output data. It is a common analysis tool to measure performance. Data envelopment analysis has two methods: one is CCR-DEA model, the other is BCC-DEA model. The CCR model assumes that the return to scale is constant and is mainly used to measure technical efficiency. By comparing the relationship between the combination of input and output of each decision-making unit (DMU) and production Frontier boundary, the model obtains the input-output efficiency score. The input-output score range is between (0, 1). If the score is 1, it means that the input has obtained effective output and the efficiency is the maximum. If the score is less than 1, it means that the input has obtained invalid output.
This method can comprehensively evaluate WRUE and the correlation degree of each index. The index has good inclusiveness, does not need to provide mathematical relationship of input and output variables, reduces the influence of subjective factors to a certain extent, and can comprehensively and objectively evaluate WRUE.
The BCC-DEA model is based on CCR model, which assumes that the return to scale is not constant. The model can measure overall technical efficiency, pure technical efficiency and scale efficiency. The overall technical efficiency is decomposed into pure technical efficiency score and scale efficiency score. The scores of three kinds of efficiency are between (0, 1). In the case of invalid output obtained from the input, the model can judge whether the return to scale is increasing or decreasing. If the return to scale is increasing, the scale should be expanded to focus on the role of input. If the return to scale is decreasing, the scale should be reduced to match the current input.
The BCC-DEA model can test whether the efficiency score of the decision-making unit is effective, but it cannot compare and analyze several decision-making units that are effective at the same time. In order to solve this problem, Andersen and Petersen, 1993 proposed super efficiency DEA based on the traditional DEA model, so that the efficiency of relatively effective decision-making units could also be compared.
It is assumed that the multiple-input-multiple-output evaluation system has s decision-making units, and the indicator system is composed of m input indicators and n output indicators.
where θ is the expected value of the goal programming,
In this study, we use the super-efficiency DEA model to estimate WRUE. Referring to relevant literature on ER and WRUE (Dadabaev, 2016; Han et al., 2020; Singh and Gundimeda, 2021) and considering the availability of data, we select capital (

TABLE 1. Regional water use efficiency evaluation index system.
In Table 1, capital is the stock of fixed capital, which is the weighted sum of previous investment flows measured at constant prices. Total current capital is total capital of the previous period minus depreciation plus current capital, which can be expressed as
3.2.2 Tobit model
Although the super efficiency DEA model can calculate overall technical efficiency, it cannot explore the influencing factors and degrees of the DMU. In order to measure the influencing factors and degrees of the DMU, regression analysis method will be used to establish functional relationship between WRUE and influencing factors. The efficiency scores of super efficiency DEA model are censored on the left, that is, there is a threshold value of 0 on the left of the overall technical efficiency and pure technical efficiency, and there is no restriction on the right. When we use the ordinary least square (OLS) method to investigate influencing factors of efficiency scores, the results may be biased. So we use the Tobit model to analyze the panel model.
The Tobit model is estimated by maximum likelihood method, which can be used when independent variables are discrete and dependent variable is constrained. This paper builds a regression model with WRUE as the explained variable and its influencing factors as explanatory variables.
where
In this study, ER is a series of policies and measures formulated by the government to normalize the enterprise operations in terms of environment, so as to realize the coordinated development of environment and economy. Since investment governance is the main way of ER in China, we use the ratio of environmental governance investment to GDP to measure the intensity of ER (envir). Based on previous studies, we add water resource endowment (endow), level of economic development (gdp), level of urbanization (urban), population density (popul), degree of openness (open) and water resource pollution (cod) as control variables to the model. Among them, water resource endowment is measured by per capita water resources and level of economic development is measured by per capita GDP. The level of urbanization is the proportion of urban population in the total population. Population density is the number of people per square kilometer. The degree of openness is the ratio of the total import and export to GDP and water resource pollution is measured by per capita chemical oxygen demand. The descriptive statistics of data are shown in Table 2. Through the VIF test, we find that there is no serious multicollinearity problem.
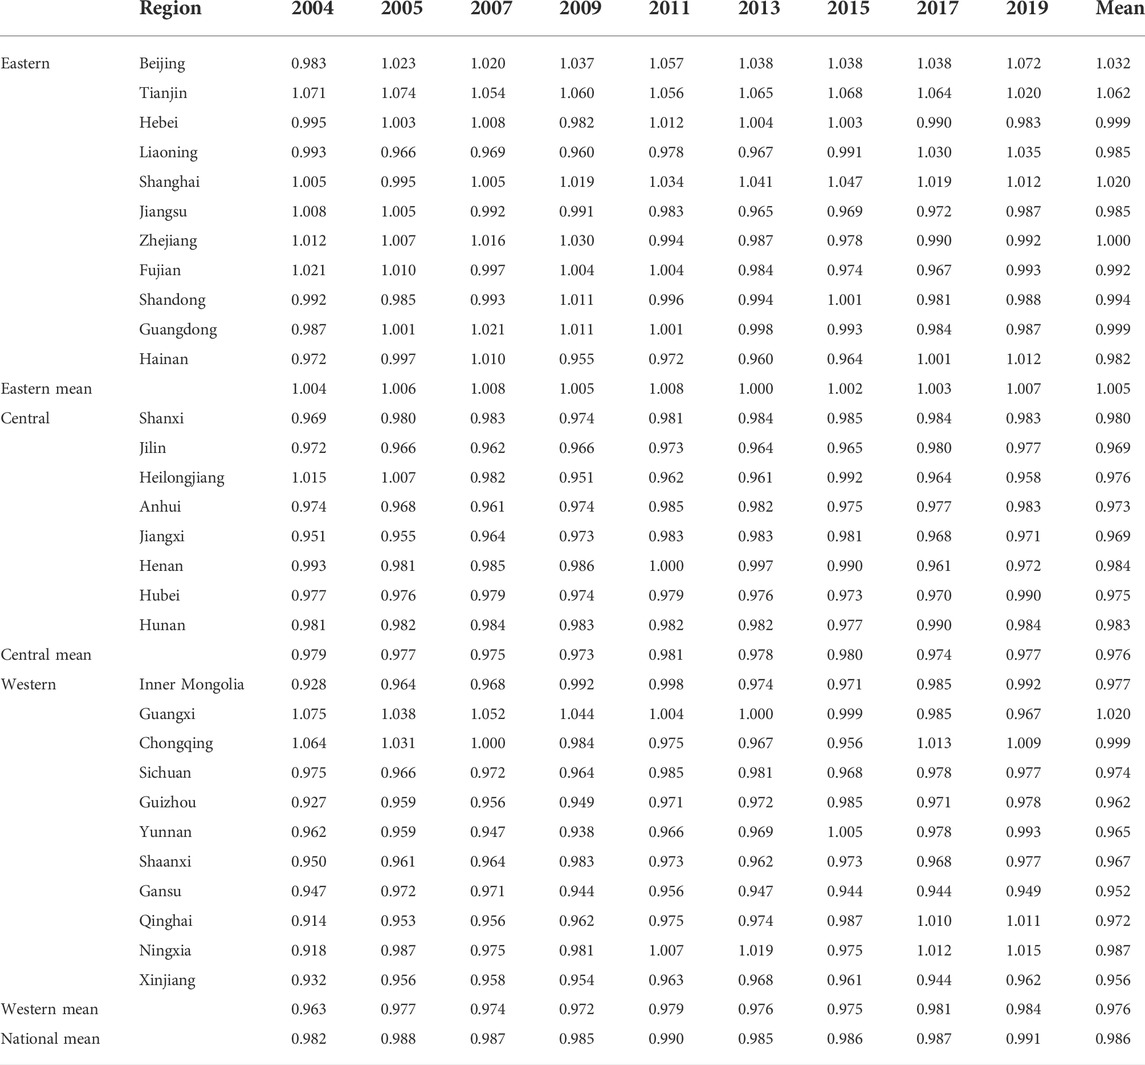
TABLE 2. Regional WRUE in China, 2004–2019.
According to the results of existing literatures, we adopt the Tobit model as follows:
where i represents province, t represents year,
3.2.3 Data source
Learning from previous research literature (Pei et al., 2021), the data cover 30 provinces. Tibet, Hong Kong, Macao and Taiwan are not included due to incomplete data. The sample periods cover the latest years that data is available. Relevant data are obtained from China Statistical Yearbook 2005–2020, China Science and Technology Statistical Yearbook 2005–2020, China Statistical Yearbook on Environment 2005–2020, and China Economic Network Statistical Database 2005–2020.
4 Research findings
4.1 WRUE and ER
The average value of WRUE is shown in Table 3. From Table 2, we find that there is no obvious trend in China’s WRUE and there exist heterogeneity in different regions. The score of WRUE in the eastern region is the highest, followed by the western region and the central region. In the eastern region, scores of WRUE of Tianjin, Beijing, Shanghai and Zhejiang are more than 1, and those of other regions are less than 1. Hainan, Jiangsu and Liaoning are in the bottom three. In the central region, Henan has the highest score of WRUE but Anhui has the lowest score. In the western region, Guangxi, Chongqing and Ningxia rank in the top three in WRUE scores, and the bottom three are Gansu, Xinjiang and Yunnan.

TABLE 3. Variables description statistics.
The chart of China’s ER from 2004 to 2019 is shown in Figure 1. China’s average intensity of ER is fluctuated and has an upward trend. The intensity decreased from 1.24 to 1.11% from 2004 to 2006, then began to rise, reached a peak of 1.65% in 2013. During the following years, the intensity first declined and fluctuated a little, and then increased rapidly after 2018. The intensity of ER in the western region was the largest, which had two peaks, 2.04% in 2013 and 2.94% in 2019, and two valley scores, 1.21% in 2005 and 1.66% in 2017. Among them, Ningxia and Qinghai has higher intensity of ER, which are 2.93% and 2.74% respectively, while Sichuan and Yunnan has lower intensity of ER, which are 0.88% and 1.08% respectively. The years with higher intensity of ER in the eastern region were 2012 and 2019. The years with lower intensity were 2015–2017 and the range of intensity was between 1.01% and 1.03%. The intensity of ER in Beijing is the largest, while the intensity of ER in Guangdong is the lowest. The trend of ER intensity in central China was similar to that in China, with the lowest score of 0.89% in 2005 and the highest score of 2.09% in 2019. Among them, Shanxi has the largest intensity of ER but Hunan has the lowest intensity of ER. Among three regions, the average intensity score is 1.22% in the eastern region, 1.30% in the central region and 1.71% in the western region. This reveals that the intensity of environmental regulation in three regions is low, and these regions should improve the intensity of environmental regulation to better protect the environment. On the other hand, the intensity of environmental regulation in three regions is heterogeneous. Hence, there will be great differences in environmental policies, production and foreign investment in three regions. The intensity of ER in the eastern region was higher than that in the central region before 2011, but lower than that in the central region after 2011. This indicates that the intensity of environmental regulation is not constant, so efforts should be made to improve the intensity of environmental regulation and adjust production and investment accordingly.
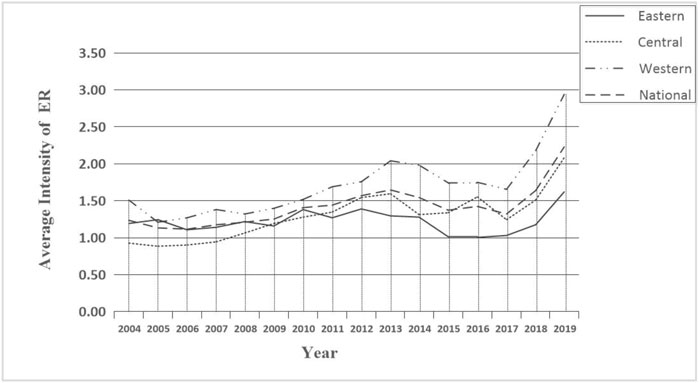
FIGURE 1. Average intensity of ER in China.
4.2 Tobit regression result
4.2.1 Analysis of ER’s impact on WRUE
We first study the impact of ER on WRUE and the results are shown in Table 4. ER has a negative impact on WRUE. If the intensity of ER increases by 1%, the scores of WRUE will decrease by 0.21%. This means that the increase of ER intensity is not conducive to the improvement of WRUE. The plausible explanation is that the intensity of ER in China is too low. In this study, we use the ratio of environmental governance investment to GDP to measure the intensity of ER. We find that the national average score of ER is 1.41%, where the highest is 1.71% in the western region but the lowest is 1.22% in the eastern region. According to international experience, the momentum of environmental deterioration can be controlled when the proportion of environmental governance investment in GDP is 1%–1.5%. When the ratio of environmental governance investment to GDP is 2%–3%, the environmental quality can be improved. In some developed countries, the ratio had reached 2% as early as the 1970s. Therefore, the intensity of ER in China is still relatively low. The innovation compensation income is less than the regulation cost when the intensity of ER is low. As a rational economic agent, the enterprise will pay the pollution discharge fee but carry out technological innovation. When the intensity of ER is high, the enterprise will find that the pollution treatment fee to be paid is expensive and innovation compensation income is greater than regulation cost. Hence, the enterprise will get rid of policy constraints by improving technology, which will improve WRUE (Porter and Linde, 1995). Thus, Hypothesis 1 is supported.
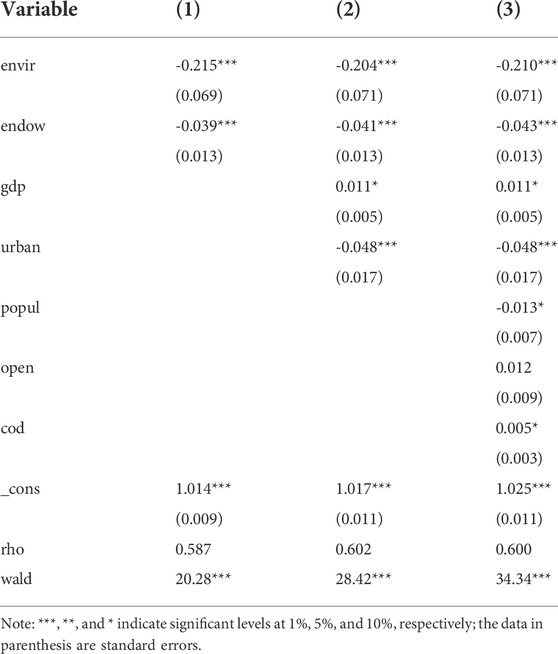
TABLE 4. Impact of ER on WRUE.
There is a negative correlation between water resource endowment and WRUE. The plausible explanation is that areas with abundant water resources have weak awareness of water resource protection and cannot promote enterprises to make water-saving technology innovation, which causes the waste of water resources and low utilization efficiency of water resources. The level of economic development has a positive impact on WRUE. When per capita GDP increases by 1%, WRUE will increase by 0.011%. The possible explanation is that the government has sufficient funds for R&D investment to improve industrial water-saving and emission reduction technologies. On the other hand, the public in developed areas has a strong awareness of environmental protection and high degree of autonomy in water conservation. Therefore, improving the level of regional economic development is a basic guarantee to improve China’s WRUE.
The level of urbanization has a negative impact on WRUE. There are three reasons for the result. First, the higher the level of urbanization is, the greater the agglomeration of urban population will be. Most of transferred people enter traditional service industries such as low-end manufacturing and real estate, which has low WRUE. Second, employment, infrastructure and capital pressure in the process of urbanization caused by the transfer of population lead to more extensive investment, and do not pay attention to resource conservation and the improvement of WRUE. Third, the water-saving management system is not perfect in the process of urbanization. For example, low utilization rate of water-saving facilities, low efficiency of rainwater reuse treatment system, and low utilization rate of reclaimed water are not conducive to the improvement of WRUE.
Population density has a negative impact on WRUE, indicating that the increase of population density will increase water consumption and water waste. The increase of population density is related to the acceleration of urbanization, which reflects the concentration of urban population. According to the original data, we find that the population density of 30 provinces in China has increased significantly, and water demand has also increased significantly. The increase of population will increase the demand for urban water, putting severe stress on the ecological environment.
Per capita chemical oxygen demand is the oxidation dose consumed when a certain strong oxidant is used to treat the organic matter in water samples under certain conditions. It can reflect the degree of industrial development and the intensity of pollution control in the region. In this paper, cod has a positive impact on WRUE, indicating that there are deficiencies in the investment and construction of pollution treatment facilities, which cannot improve the sewage treatment rate, reduce the discharge of cod and then reduce the utilization rate of water resources.
4.2.2 Sub-sample test
The intensity of ER in different regions is heterogeneous. In this section, total sample is divided into eastern, central and western sample based on the geographic location of provinces. The results are shown in Table 5. The ER in the eastern and western regions has negative impacts on WRUE, and the absolute value of the coefficient in the eastern region is greater than that in the western region. ER in central region has no significant impact on WRUE. This means that the intensity of ER is too low to exceed the cost threshold and cannot make the innovation compensation income greater than the regulation cost. Enterprises in three regions do not carry out technological innovation to improve WRUE.
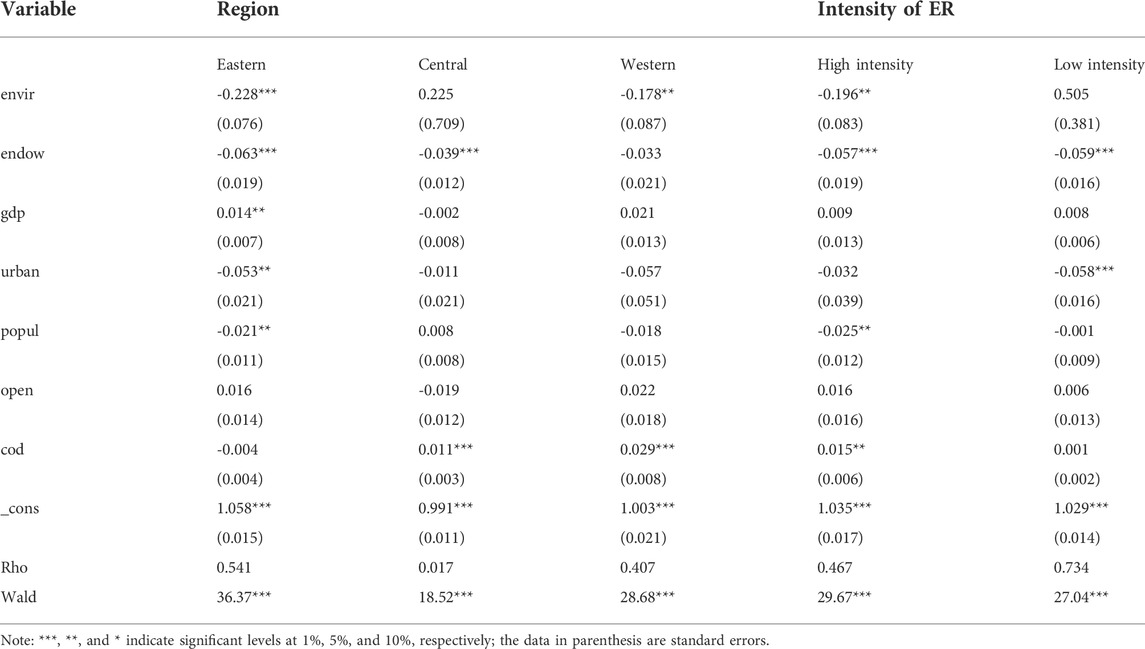
TABLE 5. Results of the sub-sample test.
The total sample is divided into high-intensity sample and low-intensity sample based on the intensity of ER. The high-intensity sample is the region where the score of ER intensity exceeds the national average, whereas the low-intensity sample is the region where the score of ER intensity is lower than the national average. The last two columns of Table 5 report the results. For high-intensity regions, ER has a negative impact on WRUE. For low-intensity regions, the impact of ER on WRUE is not significant. On the whole, the intensity of ER is relatively low, which cannot promote enterprises to carry out technological innovation, make up for the regulation cost, optimize the industrial structure and improve WRUE.
4.2.3 Mechanism test
ER affects WRUE through foreign direct investment (FDI), technological innovation and industrial structure. In order to further test influential mechanism of ER on WRUE, we carry out mechanism test through two steps. The first step is to test whether ER affects intermediate variables (FDI, technological innovation, industrial structure). The second step is to introduce the interaction term between intermediate variables and ER and test whether the interaction term affects WRUE. The results of the mechanism test are shown in Table 6. ER has a positive impact on FDI. This means that China’s FDI has a pollution haven effect in location selection. The high intensity of domestic ER increases FDI enterprises’ production costs, especially for pollution-intensive enterprises. Therefore, these enterprises will take advantage of differences in international ER intensity to transfer from home country with high intensity of ER to China, which will cause pollution haven effects (Naughton, 2014). The coefficient of the interaction term between ER and FDI indicates that the inflow of advanced technology and strict standards of multinational corporations is conductive to the improvement of WRUE. Thus, Hypothesis 2 is supported.
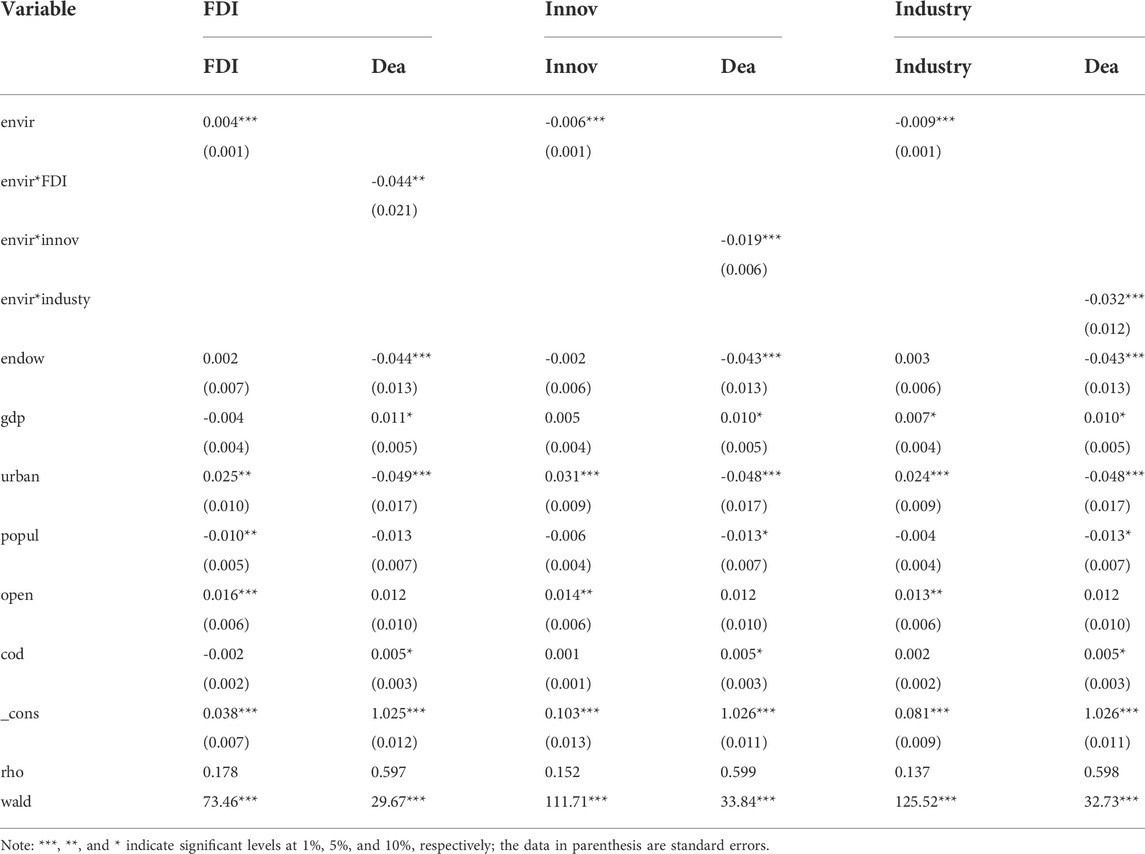
TABLE 6. Results of the mechanism test.
ER is not conducive to the development of technological innovation. In order to reach environmental standards, enterprises must purchase pollution control equipment or carry out pollution control, resulting in a significant increase in their production costs and a corresponding reduction in investment in R&D (Dean, et al., 2000; Shi and Xu, 2018). The influencing coefficient of the interaction term between ER and technological innovation is lower than that of ER on WRUE in Table 4. This means that technological innovation effect appears less evident when the intensity of ER is low. Hence, Hypothesis 3 is supported. ER has a negative and significant impact on industrial structure. Porter hypothesis holds that high intensity of ER can force enterprises to carry out innovation activities, which will enable enterprises to obtain core competitiveness and have a fundamental impact on industrial structure (Ngai and Pissarides, 2007). However, when the intensity of ER is low, the benefits obtained from technological innovation are lower than the cost caused by a series of ERs such as paying sewage charges. Therefore, enterprises will pay the cost of ER and give up the technological upgrading, which is ultimately not conducive to the upgrading of industrial structure. With this, Hypothesis 4 is supported.
5 Discussion
A large number of studies pay attention the mechanism of ER and FDI. There are two famous hypotheses: pollution heaven hypothesis (Nadeem et al., 2020) and pollution halo hypothesis (Liu et al., 2017). The difference between these two hypotheses is whether the inflow of FDI can increase environmental quality or not under different environmental regulations. Unlike existing study only focusing on the two hypotheses, we further analyze the mechanism of ER affecting WRUE through FDI.
Previous studies mostly focus on the mechanism of ER and technological innovation. Some studies think that ER can increase the internal production costs, weaken the product competitiveness and hinder technological innovation (Gray and Shadbegian 2003). On the contrary, other studies think that proper ER is important for enterprises, because proper ER can stimulate innovation and produce innovation compensate effects, leading to the improvement of enterprises competitiveness (Porter and Linde, 1995). The former and the latter are consistent with the cost hypothesis and Porter hypothesis respectively in our study. Different from existing studies, we further analyze the mechanism of ER affecting WRUE through technological innovation based on the cost hypothesis and Porter hypothesis.
There are few studies on the mechanism ER affecting WRUE through industrial structure. With the acceleration of industrialization and urbanization, city development depends on all kinds of resources. The development and agglomeration of the industry has formed great challenges to ER (Zhou and Tong, 2022). Unlike previous articles focusing on aspects such as resources utilization and industrial structure, ER and industrial structure, we discuss the mechanism through which ER affects WRUE from the perspective of industrial structure.
In this study, we use the super efficiency DEA method to obtain the scores of WRUE of 30 provinces and cities in China. It can be seen from Table 2 that efficiency scores have the feature of heterogeneity. The eastern region ranks the first and the central region ranks the third. Song et al. (2018) also found the heterogeneous characteristics of WRUE, but the greatest score was in the eastern region, and the score in the central and that in the western region ranked the second and third respectively. For the eastern region, we find that efficiency scores of Tianjin, Beijing and Shanghai are higher than that of other provinces, which is consistent with Song et al. (2018) and Deng et al. (2016). For the central and western region, we find that Anhui and Yunnan have low efficiency scores, which is similar to Deng et al. (2016).
The main reason for these differences is that, first, the method is different. Song et al. (2018) constructed ML productivity index with the DDF and ML index, and ML index included ML technical efficiency (MLTE) and ML technical change (MLTC). They presented environmental technical efficiency scores of 30 provinces and cities in China. Deng et al. (2016) used the slack based measure-data envelopment analysis (SBM-DEA) method to calculate the efficiency score. Second, input and output indicators selected are different. Song et al. (2018) selected social labor force, fixed asset investment and water consumption as input indexes, and selected gross regional domestic product and COD discharge as output indexes. We have the same index category with Deng et al. (2016), but the index form and data processing are different. Hence, we get to different results.
Compared the average efficiency scores in three regions, the trend of three regions are different. For the eastern region, the efficiency score is fluctuated, no evidently ascending or descending trend, and is similar to national average efficiency scores. For the central region, the efficiency score has an unstable fluctuation, fluctuating around a certain score. For the western region, the efficiency score fluctuates and has a general uptrend.
Previous studies have reported that appropriate ER will produce innovation compensation effects, which may offset environmental protection cost of enterprises and achieve the “win-win” goal of economic development and environmental protection (Wang and Shen, 2016; Albrizio et al., 2017). Hence, the proper regulation is of great significance for regional development. In this study, we find that the intensity of environmental regulation is different in different regions due to the existence of heterogeneity (Wang et al., 2021) and the greatest intensity of ER is 1.71% in the western region. According to international experience, the intensity of ER is between 2% and 3%, environmental quality can be improved. It is evident that the intensity of ER is too low to improve environmental quality in China. So these three regions should improve the intensity of ER to better protect environment. This is consistent with the results of the previous study (Zhang et al., 2021). The ER remained important to regional innovation, and both ER and innovation input are main paths for innovation’s spillover effect (Wang et al., 2021). This indicates that the Porter hypothesis is valid.
When studying the impact of ER on WRUE, we find that ER negatively affects WRUE. The plausible reason is the rational economic agent will choose to pay the pollution discharge fee but carry out technological innovation because of low intensity of ER. This indicates that there exists a threshold effect of environmental regulation. In the previous studies, the threshold effect of environmental regulation was investigated. Whether environmental regulation was effective on environmental pollution and resource utilization depended on a certain value. When the ER exceeded a certain value, it could significantly reduce environmental pollution and increase resource utilization efficiency. When the ER was below a certain value, it could significantly increase environmental pollution and reduce resource utilization efficiency (Song et al., 2019; Zhao et al., 2021). Similar to previous studies on exploring the relationship between ER and innovation, we find the intensity of environmental regulation is above a threshold value, the innovation compensation income can be more than the regulation cost and the Porter hypothesis is valid.
Comparing with Jin et al. (2019), we get to the same conclusion that ER is not good to the improvement of WRUE. We also have the same explanation for this. One is that the intensity of ER is weak at the initial stage of economy, which leads to a slightly negative effect on the promotion of WRUE. When China enters the rapid development stage, the economic growth is still extensive. Although the intensity of ER has increased, the production cost has increased and enterprises have no sufficient fund in investing R&D, resulting in the crowding-out effect and suppressing effect of ER. During the sub-sample analysis, we find that ER negatively and significantly affects WRUE in the eastern and western region, but positively and insignificantly affects WRUE. Our findings are different from those reported by Jin et al. (2019), they found that the promotion of efficiency in the eastern, central, and western regions was not significant.
Water resource endowment is negatively related to WRUE for the whole country, which is consistent with the previous study (Song et al., 2018). The plausible explanation is that we have weak awareness of water resource protection and cannot promote enterprises to make water-saving technology innovation, leading to the waste of water resources and low utilization efficiency of water resources. During the sub-sample analysis, we find that water resource endowment is negatively related to WRUE for the three regions, but the influencing coefficient is not significant in the western region. According to Song et al. (2018), water resource endowment was negatively related to WRUE in the eastern and western region, but positively related to WRUE in the central region. The reason for this was the differences of industry structure in three regions and weak water resource protection awareness in the whole country.
The degree of openness (open) has a positive and significant impact on WRUE, which is similar to Deng et al. (2016). Deng et al. (2016) adopted three indicators of trade as influencing factors to investigate provincial water use efficiency, because they thought that industrial and agricultural production consumed a large amount of water, leading to water trade. And water trade was closely related to water use efficiency. They used import dependence, export dependence and foreign dependence respectively to make empirical analysis, and found that all these indicators positively affected WRUE. Since we focus on the impact of ER on WRUE, the study is not enough in-depth and specific about the relationship between trade indictors and WRUE.
6 Conclusion
In this paper, super efficiency DEA model and Tobit model are used to study the impact of ER on WRUE. According to the result of empirical analysis, we draw the following conclusions.
First, WRUE in China is different in different regions. The score of WRUE in the eastern region is the highest, followed by the western region, and the central region is the lowest. The top five of efficiency scores are Tianjin, Beijing, Shanghai, Guangxi and Zhejiang. The last five of efficiency scores are Gansu, Xinjiang, Guizhou, Yunnan and Shanxi.
Second, ER has a negative impact on WRUE. The plausible explanation is that enterprises choose to pay the cost of ER rather than carry out technological innovation, because the compensation income of technological innovation is less than the cost of ER when ER intensity is low. On the other hand, command-and-control ER makes the government face difficult choices in environmental protection and economic benefits. When economic benefits prevail, it will cause a waste of resources. It is not conducive to the improvement of WRUE.
Third, the sub-sample regression results show that ER in the eastern and western regions is not conducive to the improvement of WRUE, and the impact in the eastern region is greater than that in the western region. ER has no significant impact on WRUE in central China. The results show that ER intensity in these areas is relatively low, which cannot enable enterprises to carry out technological innovation to exceed the cost threshold and then improve WRUE.
Forth, the results of mechanism test show that ER positively affects FDI and affects WRUE through FDI. ER is not conducive to the enterprise’s R&D investment. For every 1% increase in the interaction between ER and R&D investment, WRUE will decrease by 0.019%. R&D investment is disadvantageous for the improvement of WRUE. ER has a negative impact on industrial structure, and further negatively affects WRUE through industrial structure.
Given the conclusions, following policy implications are proposed.
First, we should improve the intensity of ER and make it produce incentive effects to the improvement of WRUE. Through this, we can change the original production mode, promote the transformation and upgrading of industrial structure, encourage R&D investment, and finally improve production technology. Command-and-control ER can get obvious implementation effects in a short time. Since it has mandatory and inflexible characteristics and will increase the burden of enterprises over time, the implementation effect is decreased in a long time. Thus, the government should strengthen the publicity and education of environmental knowledge, gradually enhance public awareness of environmental protection, and enhance the enthusiasm of environmental protection organizations. In addition, the government should establish a mechanism system for public participation in environmental supervision, dredge public supervision channels, and improve the intensity of environmental protection.
Second, local governments need to comprehensively consider local conditions and implement differentiated ER due to the heterogeneous effect of ER on WRUE. Command-and-control regulation, market-based regulation and voluntary regulation have their own advantages and disadvantages. Different regions have different responses to various ERs. Local governments should implement ER based on local conditions, gradually abandon extensive economic growth at the expense of the environment, and transit to intensive economic growth relying on technological innovation and industrial structure upgrading, so as to achieve a win-win situation of high WRUE and environmental protection.
Finally, enterprises should increase R&D investment, bring green technology into production process, and promote the rapid upgrading of technology, so as to change the production mode and exceed the cost effect threshold of ER. In the process of opening up to the world, local governments should improve the quality of foreign investment and actively introduce water resource-saving and environment-friendly foreign investment. At the same time, they should strengthen the awareness of water saving in the process of production activities, especially in areas rich in water resources. Local governments should analyze the influencing factors of WRUE such as water resource endowment, level of economic development, level of urbanization and so on. They should strive to create an external environment conducive to the improvement of resources efficiency and promote the improvement of WRUE.
Data availability statement
The datasets presented in this study can be found in online repositories. The names of the repository/repositories and accession number(s) can be found below: http://www.stats.gov.cn/tjsj/ndsj/.
Author contributions
WQ: Methodology, Data curation. WS: Investigation, Reviewing and Editing.
Conflict of interest
The authors declare that the research was conducted in the absence of any commercial or financial relationships that could be construed as a potential conflict of interest.
Publisher’s note
All claims expressed in this article are solely those of the authors and do not necessarily represent those of their affiliated organizations, or those of the publisher, the editors and the reviewers. Any product that may be evaluated in this article, or claim that may be made by its manufacturer, is not guaranteed or endorsed by the publisher.
References
Albrizio, S., Kozluk, T., and Zipperer, V. (2017). Environmental policies and productivity growth: Evidence across industries and firms. J. Environ. Econ. Manag. 81 (1), 209–226. doi:10.1016/j.jeem.2016.06.002
Andersen, P., and Petersen, N. C. (1993). A procedure for ranking efficient units in data envelopment analysis. Manag. Sci. 39 (10), 1261–1264. doi:10.1287/mnsc.39.10.1261
Bernauer, T., and Caduff, L. (2004). Interest group politics and industrial competition as drivers of environmental and consumer regulation. J. Public Policy 24 (1), 99–126. doi:10.1017/s0143814x04000054
Bertolino, L. T., Caine, R. S., and Gray, J. E. (2019). Impact of stomatal density and morphology on water-use efficiency in a changing world. Front. Plant Sci. 10, 225. doi:10.3389/fpls.2019.00225
Blankenagel, S., Yang, Z., Avramova, V., Schön, C. C., and Grill, E. (2018). Generating plants with improved water use efficiency. Agronomy 8 (9), 194. doi:10.3390/agronomy8090194
Cai, X., Lu, Y., Wu, M., and Yu, L. (2016). Does environmental regulation drive away inbound foreign direct investment? Evidence from a quasi-natural experiment in China. J. Dev. Econ. 123, 73–85. doi:10.1016/j.jdeveco.2016.08.003
Cai, X., Rosegrant, M. W., and Ringler, C. (2003). Physical and economic efficiency of water use in the river basin: Implications for efficient water management. Water Resour. Res. 39 (1), 1013. doi:10.1029/2001WR000748
Cao, X., Ren, J., Wu, M., Guo, X., Wang, Z., and Wang, W. (2018). Effective use rate of generalized water resources assessment and to improve agricultural water use efficiency evaluation index system. Ecol. Indic. 86 (3), 58–66. doi:10.1016/j.ecolind.2017.12.016
Cheng, C. L., Peng, J. J., Ho, M. C., Liao, W. J., and Chern, S. J. (2016). Evaluation of water efficiency in green building in Taiwan. Water 8 (6), 236. doi:10.3390/w8060236
China’s National Bureau of Statistics (2015-2020). China science and technology statistical yearbook 2005-2020. Available at:http://data.stats.gov.cn.
China’s National Bureau of Statistics (2015-2020). China statistical Yearbook 2005-2020. Available at:http://data.stats.gov.cn.
China’s National Bureau of Statistics (2015-2020). China statistical Yearbook on environment 2005-2020. Available at:http://data.stats.gov.cn.
China’s state information center (2015-2020). China economic Network statistical Database.Available at:https://db.cei.cn/jsps/Home.
Chung, S. (2014). Environmental regulation and foreign direct investment: Evidence from South Korea. J. Dev. Econ. 108, 222–236. doi:10.1016/j.jdeveco.2014.01.003
Dadabaev, T. (2016). Water resource management in central asia: A Japanese attempt to promote water resource efficiency. J. Comp. Asian Dev. 15 (1), 64–90. doi:10.1080/15339114.2015.1115745
Dean, T. J., Brown, R. L., and Stango, V. (2000). Environmental regulation as a barrier to the formation of small manufacturing establishments: A longitudinal examination. J. Environ. Econ. Manag. 40 (1), 56–75. doi:10.1006/jeem.1999.1105
Deng, G., Li, L., and Song, Y. (2016). Provincial water use efficiency measurement and factor analysis in China: Based on SBM-DEA model. Ecol. Indic. 69, 12–18. doi:10.1016/j.ecolind.2016.03.052
Deng, X. P., Shan, L., Zhang, H., and Turner, N. C. (2006). Improving agricultural water use efficiency in arid and semiarid areas of China. Agric. water Manag. 80 (1-3), 23–40. doi:10.1016/j.agwat.2005.07.021
Evans, R. G., and Sadler, E. J. (2008). Methods and technologies to improve efficiency of water use. Water Resour. Res. 44 (7), 767–768. doi:10.1029/2007wr006200
Fang, Q. X., Ma, L., Green, T. R., Yu, Q., Wang, T. D., and Ahuja, L. R. (2010). Water resources and water use efficiency in the North China Plain: Current status and agronomic management options. Agric. Water Manag. 97 (8), 1102–1116. doi:10.1016/j.agwat.2010.01.008
Farooq, M., Hussain, M., Ul-Allah, S., and Siddique, K. H. (2019). Physiological and agronomic approaches for improving water-use efficiency in crop plants. Agric. Water Manag. 219, 95–108. doi:10.1016/j.agwat.2019.04.010
Gray, W. B., and Shadbegian, R. J. (2003). Plant vintage, technology, and environmental regulation. J. Environ. Econ. Manag. 46 (3), 384–402. doi:10.1016/S0095-0696(03)00031-7
Greenstone, M., List, J. A., and Syverson, C. (2012). The effects of environmental regulation on the competitiveness of US manufacturing. Natl. Bureau Econ. Res. 9, w18392. doi:10.2139/ssrn.2145006
Han, Z. Q., Liu, T., Wang, T., Liu, H. F., Li, B. L., Ouyang, Y. N., et al. (2020). Quantification of water resource utilization efficiency as the main driver of plant diversity in the water-limited ecosystems. Ecol. Model. 429, 108974. doi:10.1016/j.ecolmodel.2020.108974
Hanna, R. (2010). US environmental regulation and FDI: Evidence from a panel of US-based multinational firms. Am. Econ. J. Appl. Econ. 2 (3), 158–189. doi:10.1257/app.2.3.158
Hao, Y., Deng, Y., Lu, Z. N., and Chen, H. (2018). Is environmental regulation effective in China? Evidence from city-level panel data. J. Clean. Prod. 188 (1), 966–976. doi:10.1016/j.jclepro.2018.04.003
Hashmi, R., and Alam, K. (2019). Dynamic relationship among environmental regulation, innovation, CO2 emissions, population, and economic growth in oecd countries: A panel investigation. J. Clean. Prod. 231 (10), 1100–1109. doi:10.1016/j.jclepro.2019.05.325
Huang, M., Piao, S., Zeng, Z., Peng, S., Ciais, P., Cheng, L., et al. (2016). Seasonal responses of terrestrial ecosystem water-use efficiency to climate change. Glob. Chang. Biol. 22 (6), 2165–2177. doi:10.1111/gcb.13180
Jaffe, A. B., and Palmer, K. (1997). Environmental regulation and innovation: A panel data study. Rev. Econ. statistics 79 (4), 610–619. doi:10.1162/003465397557196
Jin, W., Zhang, H. Q., Liu, S. S., and Zhang, H. B. (2019). Technological innovation, environmental regulation, and green total factor efficiency of industrial water resources. J. Clean. Prod. 211 (20), 61–69. doi:10.1016/j.jclepro.2018.11.172
Kaneko, S., Tanaka, K., Toyota, T., and Managi, S. (2004). Water efficiency of agricultural production in China: Regional comparison from 1999 to 2002. Int. J. Agric. Resour. 3 (3-4), 231–251. doi:10.1504/IJARGE.2004.006038
Karplus, V. J., Zhang, J., and Zhao, J. (2021). Navigating and evaluating the labyrinth of environmental regulation in China. Rev. Environ. Econ. Policy 15 (2), 300–322. doi:10.1086/715582
Lawson, T., and Blatt, M. R. (2014). Stomatal size, speed, and responsiveness impact on photosynthesis and water use efficiency. Plant Physiol. 164 (4), 1556–1570. doi:10.1104/pp.114.237107
Leakey, A. D., Ferguson, J. N., Pignon, C. P., Wu, A., Jin, Z., Hammer, G. L., et al. (2019). Water use efficiency as a constraint and target for improving the resilience and productivity of C3 and C4 crops. Annu. Rev. Plant Biol. 70 (1), 781–808. doi:10.1146/annurev-arplant-042817-040305
Liu, Y., Hao, Y., and Gao, Y. (2017). The environmental consequences of domestic and foreign investment: Evidence from China. Energy Policy 108 (6), 271–280. doi:10.1016/j.enpol.2017.05.055
López-Gamero, M. D., Molina-Azorín, J. F., and Claver-Cortés, E. (2010). The potential of environmental regulation to change managerial perception, environmental management, competitiveness and financial performance. J. Clean. Prod. 18 (10-11), 963–974. doi:10.1016/j.jclepro.2010.02.015
Lu, W. C. (2019). Industrial water-use technical efficiency and potential reduction of CO2 emissions: Evidence from industry-level data. Carbon Manag. 10 (6), 513–522. doi:10.1080/17583004.2019.1661733
Mbava, N., Mutema, M., Zengeni, R., Shimelis, H., and Chaplot, V. (2020). Factors affecting crop water use efficiency: A worldwide meta-analysis. Agric. Water Manag. 228 (20), 105878. doi:10.1016/j.agwat.2019.105878
Mulatu, A., Gerlagh, R., Rigby, D., and Wossink, A. (2010). Environmental regulation and industry location in Europe. Environ. Resour. Econ. (Dordr). 45 (4), 459–479. doi:10.1007/s10640-009-9323-3
Nadeem, A. M., Ali, T., Khan, M., and Guo, Z. (2020). Relationship between inward FDI and environmental degradation for Pakistan: An exploration of pollution haven hypothesis through ARDL approach. Environ. Sci. Pollut. Res. 27 (1), 15407–15425. doi:10.1007/s11356-020-08083-x
Naughton, H. T. (2014). To shut down or to shift: Multinationals and environmental regulation. Ecol. Econ. 102 (6), 113–117. doi:10.1016/j.ecolecon.2014.03.013
Ngai, L. R., and Pissarides, A. (2007). Structural change in a multisector model of growth. Am. Econ. Rev. 97 (1), 429–443. doi:10.1257/aer.97.1.429
Pargal, S., and Wheeler, D. (1996). Informal regulation of industrial pollution in developing countries: Evidence from Indonesia. J. political Econ. 104 (6), 1314–1327. doi:10.1086/262061
Pashigian, B. P. (1984). The effect of environmental regulation on optimal plant size and factor shares. J. Law Econ. 27 (1), 1–28. doi:10.1086/467056
Pei, Y., Zhu, Y. M., and Wang, N. (2021). How do corruption and energy efficiency affect the carbon emission performance of China's industrial sectors? Environ. Sci. Pollut. Res. Int. 28, 31403–31420. doi:10.1007/s11356-021-13032-3
Peters, W., Velde, I. R. V. D., Schaik, E. V., Miller, J. B., Ciais, P., Duarte, H. F., et al. (2018). Increased water-use efficiency and reduced CO2 uptake by plants during droughts at a continental scale. Nat. Geosci. 11 (10), 744–748. doi:10.1038/s41561-018-0212-7
Porter, M. E., and Linde, C. V. D. (1995). Toward a new conception of the environment-competitiveness relationship. J. Econ. Perspect. 9 (4), 97–118. doi:10.1257/jep.9.4.97
Selvakumar, S., Chandrasekar, N., and Kumar, G. (2017). Hydrogeochemical characteristics and groundwater contamination in the rapid urban development areas of Coimbatore, India. Water Resour. Industry 17, 26–33. doi:10.1016/j.wri.2017.02.002
Shi, X., and Xu, Z. (2018). Environmental regulation and firm exports: Evidence from the eleventh Five-Year Plan in China. J. Environ. Econ. Manag. 89, 187–200. doi:10.1016/j.jeem.2018.03.003
Singh, A., and Gundimeda, H. (2021). Impact of bad outputs and environmental regulation on efficiency of indian leather firms: A directional distance function approach. J. Environ. Plan. Manag. 64 (8), 1331–1351. doi:10.1080/09640568.2020.1822307
Singh, K. (2007). Rational pricing of water as an instrument of improving water use efficiency in the agricultural sector: A case study in Gujarat, India. Int. J. Water Resour. Dev. 23 (4), 679–690. doi:10.1080/07900620701488604
Song, M., Wang, R., and Zeng, X. (2018). Water resources utilization efficiency and influence factors under environmental restrictions. J. Clean. Prod. 184 (5), 611–621. doi:10.1016/j.jclepro.2018.02.259
Song, Y., Yang, T., and Zhang, M. (2019). Research on the impact of environmental regulation on enterprise technology innovation—An empirical analysis based on Chinese provincial panel data. Environ. Sci. Pollut. Res. 26, 21835–21848. doi:10.1007/s11356-019-05532-0
Vogel, D. (2000). Environmental regulation and economic integration. J. Int. Econ. Law 3 (2), 265–279. doi:10.1093/jiel/3.2.265
Wallace, J. S. (2000). Increasing agricultural water use efficiency to meet future food production. Agric. Ecosyst. Environ. 82 (1-3), 105–119. doi:10.1016/S0167-8809(00)00220-6
Wang, S. H., Chen, S. S., and Zhang, H. Y. (2021). Effect of income and energy efficiency on natural capital demand. Environ. Sci. Pollut. Res. 28, 45402–45413. doi:10.1007/s11356-021-13971-x
Wang, S. H., Lei, L., and Xing, L. (2021). Urban circular economy performance evaluation: A novel fully fuzzy data envelopment analysis with large datasets. J. Clean. Prod. 324, 129214. doi:10.1016/j.jclepro.2021.129214
Wang, S. H., Sun, X. L., and Song, M. L. (2021). Environmental regulation, resource misallocation, and ecological efficiency. Emerg. Mark. Finance Trade 57 (3), 410–429. doi:10.1080/1540496X.2018.1529560
Wang, S. H., and Sun, X. L. (2018). The global system-ranking efficiency model and calculating examples with consideration of the nonhomogeneity of decision-making units. Expert Syst. 37 (9), e12272. doi:10.1111/exsy.12272
Wang, W., Yu, Z., Zhang, W., Shao, Q., Zhang, Y., Luo, Y., et al. (2014). Responses of rice yield, irrigation water requirement and water use efficiency to climate change in China: Historical simulation and future projections. Agric. water Manag. 146, 249–261. doi:10.1016/j.agwat.2014.08.019
Wang, Y., and Shen, N. (2016). Environmental regulation and environmental productivity: The case of China. Renew. Sustain. Energy Rev. 62 (9), 758–766. doi:10.1016/j.rser.2016.05.048
Wang, Y., Zhang, F., Zheng, M., and Chang, C. P. (2021). Innovation's spillover effect in China: Incorporating the role of environmental regulation. Environ. Model. Assess. (Dordr). 26, 695–708. doi:10.1007/s10666-021-09763-9
Xu, K., Bin, L., and Xu, X. (2019). Assessment of water resources sustainability in mainland China in terms of water intensity and efficiency. Environ. Manag. 63 (3), 309–321. doi:10.1007/s00267-018-1098-2
Yang, Y., and Liu, Y. (2014). Spatio-temporal analysis of urbanization and land and water resources efficiency of oasis cities in Tarim River Basin. J. Geogr. Sci. 24 (3), 509–525. doi:10.1007/s11442-014-1103-5
Yao, X., Feng, W., Zhang, X., Wang, W., Zhang, C., and You, S. (2018). Measurement and decomposition of industrial green total factor water efficiency in china. Journal of Cleaner Production 198, 1144–1156. doi:10.1016/j.jclepro.2018.07.138
Yuan, B., and Xiang, Q. (2018). Environmental regulation, industrial innovation and green development of Chinese manufacturing: Based on an extended CDM model. J. Clean. Prod. 176 (1), 895–908. doi:10.1016/j.jclepro.2017.12.034
Zhang, S., Qin, G., Wang, L., Cheng, B., and Tian, Y. (2021). Evolutionary game research between the government environmental regulation intensities and the pollution emissions of papermaking enterprises. Discrete Dyn. Nat. Soc. 3, 1–13. doi:10.1155/2021/7337290
Zhang, Y., Zhang, H., Fu, Y., Wang, L., and Wang, T. (2021). Effects of industrial agglomeration and environmental regulation on urban ecological efficiency: Evidence from 269 cities in China. Environ. Sci. Pollut. Res. 28 (46), 66389–66408. doi:10.1007/s11356-021-15467-0
Zhao, Y., Liang, C., and Zhang, X. (2021). Positive or negative externalities? Exploring the spatial spillover and industrial agglomeration threshold effects of environmental regulation on haze pollution in China. Environ. Dev. Sustain. 23 (3), 11335–11356. doi:10.1007/s10668-020-01114-0
Keywords: environmental regulation, water resources utilization efficiency, FDI, technological innovation, industrial structure
Citation: Wang Q and Wang S (2022) The impact of environmental regulation on water resources utilization efficiency. Front. Environ. Sci. 10:1022929. doi: 10.3389/fenvs.2022.1022929
Received: 19 August 2022; Accepted: 14 September 2022;
Published: 29 September 2022.
Edited by:
Fengtai Zhang, Chongqing University of Technology, ChinaReviewed by:
Shuhong Wang, Shandong University of Finance and Economics, ChinaShikun Sun, Northwest A&F University, China
Copyright © 2022 Wang and Wang. This is an open-access article distributed under the terms of the Creative Commons Attribution License (CC BY). The use, distribution or reproduction in other forums is permitted, provided the original author(s) and the copyright owner(s) are credited and that the original publication in this journal is cited, in accordance with accepted academic practice. No use, distribution or reproduction is permitted which does not comply with these terms.
*Correspondence: Shengyuan Wang, UDIwMDcwMDdAbmp4emMuZWR1LmNu