- 1Department of Chemistry and Biochemistry, University of Mississippi University, University, MS, United States
- 2Particle Vision Ltd., Fribourg, Switzerland
Tire wear particles (TWPs) are a major category of microplastic pollution produced by friction between tires and road surfaces. This non-exhaust particulate matter (PM) is transported through the air and with runoff leading to environmental pollution and health concerns. Here, we collected airborne PM along paved roads with different traffic volumes and speeds using Sigma-2 passive samplers. Particles entering the samplers deposit onto substrates for analysis, or, as we modified it, directly into small (60 ml) separatory funnels, which is particularly useful with high particle loads, where a density separation aids in isolating the microplastics. We quantified putative TWPs (∼10–80 µm) deposited on the substrates (primarily adhesive tape on glass slides) and in the funnels using stereomicroscopy. Putative TWP deposition rates (particles/cm2/day ± SD) at 5 m from the road were highest near a busy highway (324 ± 129), followed by a boulevard with moderate traffic (184 ± 93), and a slow traffic avenue (29 ± 7). We observed that deposition rates increased within proximity to the highway: 99 ± 54, 180 ± 88, and 340 ± 145 at 30, 15, and 5 m, respectively. We show that TWP abundances (i.e., deposition and mass concentration) increase with vehicle braking (driving behavior). We observed no differences (p > 0.05) between the separatory funnel and adhesive tape collection methods. In addition, we were able to obtain FTIR spectra of TWPs (>10 µm) using µ-ATR-FTIR. Both deserve further scrutiny as novel sampling and analytical approaches. In a separate sampling campaign, we differentiated 1438 particles (∼1–80 µm) deposited on boron substrates into TWP, metal, mineral, and biogenic/organic classes with single particle SEM/EDX analysis based on morpho-textural-chemical classification and machine learning. The results revealed similar concentration trends with traffic (high > moderate > low), with the distribution of particle sources alike for the highway and the moderate road: TWPs (∼38–39%) > biogenic (∼34–35%) > minerals (∼23–26%), and metallic particles (∼2–3%). The low traffic road yielded a much different distribution: biogenic (65%) > minerals (27%) > TWPs (7%) > metallic particles (1%). Overall, this work provides much-needed empirical data on airborne TWPs along different types of roads.
1 Introduction
Microplastics (MPs) are a diverse suite of contaminants consisting primarily of synthetic polymers that range in size from 1 μm to 5 mm and occur in a variety of shapes including fibers, fragments, films, foams, and beads (Frias and Nash 2019). Tire wear particles (TWPs), also referred to as tire/road wear particles (TRWPs), are another major category of MPs because they contain synthetic (and natural) polymers, as well as fillers, vulcanization agents, and various additives (Baensch-Baltruschat et al., 2020). TWPs are released into the environment in amounts that can rival all other MPs combined (Sundt et al., 2014; Wagner et al., 2018). Moreover, the leaching of heavy metals (e.g., Zn, Cr, Pb), persistent organic pollutants (e.g., PAHs, DPG), and other additives from TWPs are reported to have an impact on the environment (Zahn et al., 2019; Seiwert et al., 2020). 6PPD-quinone leached from tire rubber was recently found to be toxic or lethal to coho salmon and other fishes (Tian et al., 2021; Brinkmann et al., 2022).
TWPs are generated by friction between tires and roads resulting in particles that are a combination of fragments of tire tread encrusted with pavement and road related particles (Panko et al., 2018; Baensch-Baltruschat et al., 2020; Rausch et al., 2022). TWPs are typically described as dark/black, elongated, cylindrical-shaped particles, ranging in size from ∼1 µm to >100 µm (Kreider et al., 2009; Sommer et al., 2018). Because of the aforementioned incorporation of environmental particles (e.g., pavement, road dust), the chemical composition of TWPs varies from that of pure tire tread and tire wear debris (Kreider et al., 2009). A recent review on their generation, properties, emissions, human health risk, ecotoxicity, and fate in the environment, revealed that 1) contribution of TWPs to PM10 accounts for up to ∼11% by mass, 2) annual emissions of TWPs for numerous countries show per-capita-masses ranging from 0.2 to 5.5 kg/(cap*a), 3) ecotoxicological studies show effects of TWPs on aquatic organisms, but the test concentrations and materials do not reflect environmental conditions, and 4) further research is needed with regard to emission factors, development of analytical methods for environmental matrices, and long-period monitoring (Baensch-Baltruschat et al., 2020).
TWPs can become airborne dust due to their small size, momentum upon breaking free from the tire tread, and wind generated by passing vehicles or environmental conditions, before depositing onto the roadside or nearby surfaces, where they can be washed into waterways and transported into rivers and oceans or be resuspended into the air (Baensch-Baltruschat et al., 2020). Measuring airborne TWPs near their source (roadways) is important to better understand their role as a major non-exhaust vehicle emission source, not only because the percent contribution of non-exhaust vehicle emissions to traffic-related PM levels will continue to increase as exhaust emissions decrease, but because an accurate picture of TWP pollution is essential for making appropriate risk management decisions (Panko et al., 2018). The highest reported concentration of PM10 TWPs in air was 3.4 μg/m3 in Granada, Spain (Amato et al., 2013). However, the few studies that measured airborne TWPs report a wide range of quantitative results, which is not surprising given not only the differences in site characteristics (e.g., traffic volumes and speeds), but also differences in sampling and analytical methods used and the size fractions measured (Rausch et al., 2022).
Inhalation of fine and coarse particles has numerous deleterious health effects (e.g., Brunekreef and Forsberg 2005; Gordon et al., 2012; Gerking et al., 2014), and super-coarse particles can affect ecosystems (Gordon et al., 2012; Mirowsky et al., 2013). Thus, it is important to quantify and characterize airborne particulates which contribute to air and water pollution. To that end, airborne particulate matter is collected using either active or passive sampling. Active sampling generally involves drawing air through a filter at a known rate to trap particles larger than the filter pore size and smaller than the chosen impactor. In contrast, passive sampling requires no power as the particles are captured naturally over time, typically by deposition onto a sticky surface. This lower-cost approach allows for a much larger number of samplers and thus a greater area coverage and spatial resolution, albeit at a coarser temporal resolution (typically requiring days to weeks depending on particle loads and methodology). Further, passive samplers can be deployed for extended periods without the need to revisit the site until the adhesive substrates are collected for analysis. However, a disadvantage is that collection efficiency and deposition velocity are determined by the environmental conditions not under operator control (Waza et al., 2019).
The Sigma-2 passive sampler, a vertical flux sampler, takes these factors in consideration and has been validated for collection of coarse particles (2.5–10 µm) (VDI 2119, 2011; Gueguen et al., 2012). The sampler has been primarily used in Europe for air quality measurements, including trace elements, isotope measurements, TWPs, and PM source apportionment (e.g., Gueguen et al., 2012; Tian et al., 2017; Sommer et al., 2018; Rausch et al., 2022). For airborne PM differentiation, including TWPs, single particle scanning electron microscopy (SEM) with energy dispersive X-ray spectroscopy (EDX) has proven to be a powerful technique (Sommer et al., 2018; Kovochich et al., 2021a; Rausch et al., 2022). The approach provides morphological information including particle size distribution, shape, and textural parameters, which are crucial for the understanding of particle formation, aging, transport, and deposition (Rausch et al., 2022). Studies using the Sigma-2 sampler combined with single particle SEM/EDX have shown differences in TWP abundance depending on proximity to roadways. For example, in Switzerland the mass fraction of TWPs in PM10 at an urban site (near a busy road) was six times higher (10.5%; 2.24 μg/m3) than an urban background site (1.8%; 0.28 μg/m3) (Rausch et al., 2022). However, these studies have mostly focused on the fine fraction and have been conducted in large urban environments in major European cities.
The aim of this study was to use the Sigma-2 passive sampler combined with stereomicroscopy and single particle SEM/EDX to, for the first time, quantify and characterize airborne TWPs along roadways with different traffic volumes and speeds in a small-town environment in the United States, investigating not only the coarse mode fraction (PM10–2.5) but also the coarser fraction (>10 µm). To that end, we deployed the samplers at three sites adjacent to roadways, including a high-speed high-volume interstate highway (Highway 6), a moderate-speed moderate-volume road (Gertrude Ford Boulevard), and a low-speed, low-volume road (University Avenue near Coulter Hall). Thus, this work represents a side-by-side comparison of the occurrence, characteristics, and spread of airborne TWPs along roadways with different characteristics.
2 Materials and methods
2.1 Collection of airborne PM using the Sigma-2 passive sampler
To collect airborne TWPs we used the Sigma-2 passive sampler from Particle Vision Ltd. (Fribourg, Switzerland). The design and features of the Sigma-2 have been described elsewhere (VDI 2119, 2011; Dietze et al., 2010; Tian et al., 2017). Briefly, the sampler collects airborne particles (∼1–∼80 µm geometric diameter range) by means of sedimentation, with particles depositing on various substrates, depending on the subsequent characterization technique. The substrates typically have a fine adhesive layer to fix the particles in place, enabling microscopic imaging and chemical analysis. Substrates chosen for this study are described in Section 2.3. The Sigma-2 design ensures a wind-sheltered, low-turbulence air volume inside the sampler, and protection of the particles from direct radiation, wind, and precipitation (Dietze et al., 2010; Tian et al., 2017). The sampler comprises a sedimentation tube fitted with a protective cap. The bottom of the tube rests on a sampling plate that can swivel, allowing for sample replacement, while the top of the tube is covered by a fitted protective cap. Generally, samples were collected continuously between ∼24 and 72 h, although we used 5 days for single particle SEM/EDX analysis to increase particle load.
2.2 Study area and traffic data collection
We deployed Sigma-2 samplers at four locations on or near the University of Mississippi (UM) campus located in Oxford, Mississippi, United States, a college town with a population of ∼27,000 (Figure 1). Three sites were adjacent to roadways, including a high-speed high-volume interstate highway (Highway 6), a moderate-speed moderate-volume road (Gertrude Ford Boulevard), and a low-speed, low-volume road (University Avenue near Coulter Hall). Traffic characteristics of these roadways are given in Table 1. The samplers along the roads were deployed ∼1.5 m above the ground using a stainless-steel rod. In addition, a Sigma-2 sampler was also deployed about 20 m above the ground on a platform itself raised several meters above the roof of Anderson Hall located in the center of the UM campus. The location is high enough to receive air masses unimpeded by trees and vegetation, and thus may serve as a form of regional atmospheric background collected within the city of Oxford. However, because we observed by stereomicroscopy so few putative TWPs that were >10 µm (<1 particle/day/cm2) we discontinued measurements at this site. Nevertheless, we have included these few data points in the supplemental information (Supplementary Figure S1).
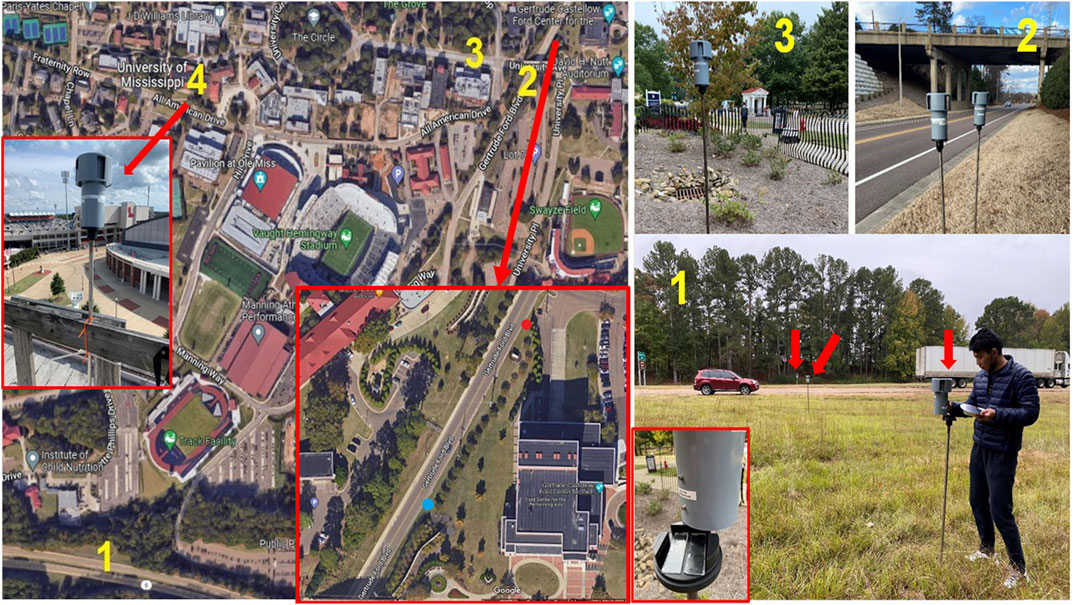
FIGURE 1. Map of the University of Mississippi (left) showing locations of the study sites (numbers). Photos showing the deployed samplers at sampling sites 1-3 are shown to the right and in the inset of the map (site 4). Site 1 = Highway 6 (red arrows point to samplers at varying distances from highway); 2 = Gertrude Ford Blvd. (moderate speed and volume); 3 = University Avenue near Coulter Hall (low speed and volume); and 4 = top of Anderson Hall. Also shown is an open sampler displaying glass slides covered with sticky tape (lower right inset). The inset for sampling site 2 shows blue and red dots representing sampling locations where vehicles are at a steady speed (∼65 km/h) and beginning to slow (∼55 km/h), respectively.

TABLE 1. Traffic volume and speed at study sites near the University of Mississippi. Values measured at Gertrude Ford Blvd. and estimated at other sites (see text).
Traffic data is summarized in Table 1. Data at Gertrude Ford Blvd., our “moderate-speed moderate-volume” site, was collected using traffic engineering radar from Jamar Tech. Inc. (Hatfield, PA, United States). The system provides vehicle data for volume and speed with >98% accuracy, according to the manufacturer. Traffic volume is given by time of day and traffic speed by percent of vehicles (Supplementary Figures S2, S3). Traffic data for highway 6, our “high-speed high-volume” site, came from estimates by the Mississippi Department of Transportation. Traffic data for University Avenue, our “low-speed low-volume” site was estimated based on visual observations and Mississippi Department of Transportation data.
2.3 Study design and collection of airborne particles on substrates for analyses
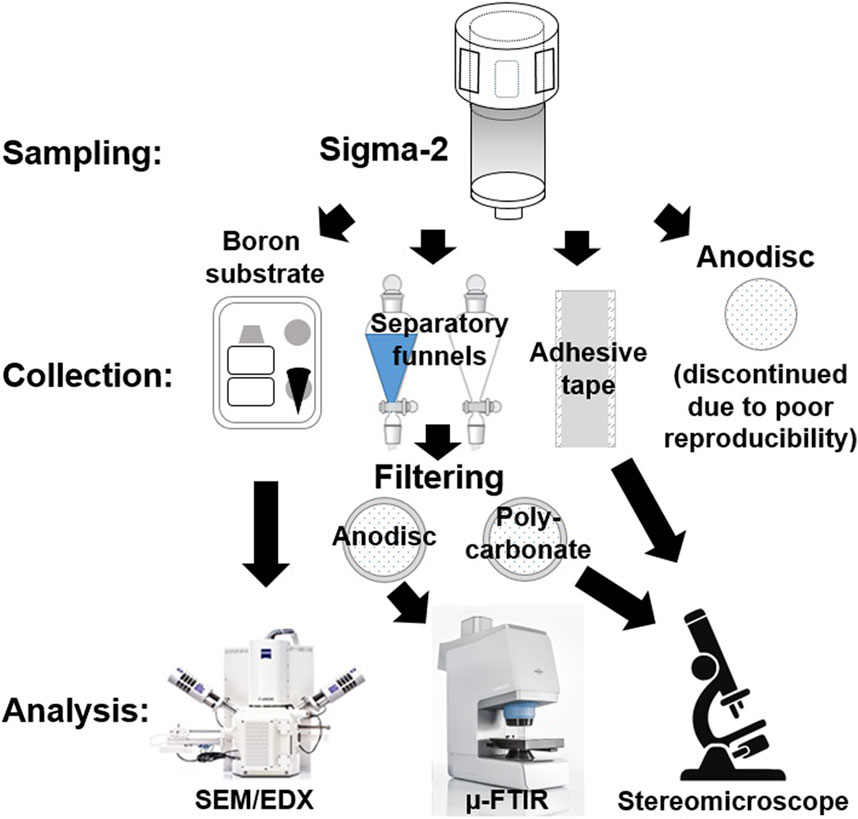
Overview diagram and photos of the sampling scheme are given in Figures 2, 3, with information on the sampling campaigns and methods provided in Supplementary Table S1. Briefly, we collected airborne particulate matter during multiple sampling campaigns to assess their sources, to compare sampling substrates and methods, and to quantify TWPs based on proximity to a highway and on traffic conditions (e.g., speed, volume). For source differentiation, three boron substrates, one each from Highway 6, Gertrude Ford Boulevard, and University Avenue, were deployed simultaneously in Sigma-2 passive samplers over the course of 5 days in March 2022 at 5 m from the roads. To study the influence of traffic speed, volume, driving characteristics, and proximity to the road on the deposition rate of TWPs we used stereomicroscopy data from adhesive tape (glass slides) as it was the most abundant data stream. Typically slides would be exchanged from the sampler on a 24-h basis. In some cases (when appropriate) samples were used for more than one purpose. For example, samples collected at 5 m from the highway in the distance (proximity to road) study were also used in comparison of traffic sites since they were all deployed simultaneously. Using the Sigma-2 passive sampler, we collected particles on glass slides covered with adhesive tape for stereomicroscopy, on polished chunks of boron crystal for single particle SEM/EDX, on aluminum oxide filters for micro-spectroscopy (µ-FTIR), and directly into a 60 ml glass separatory funnels to facilitate density separation (Figure 2).
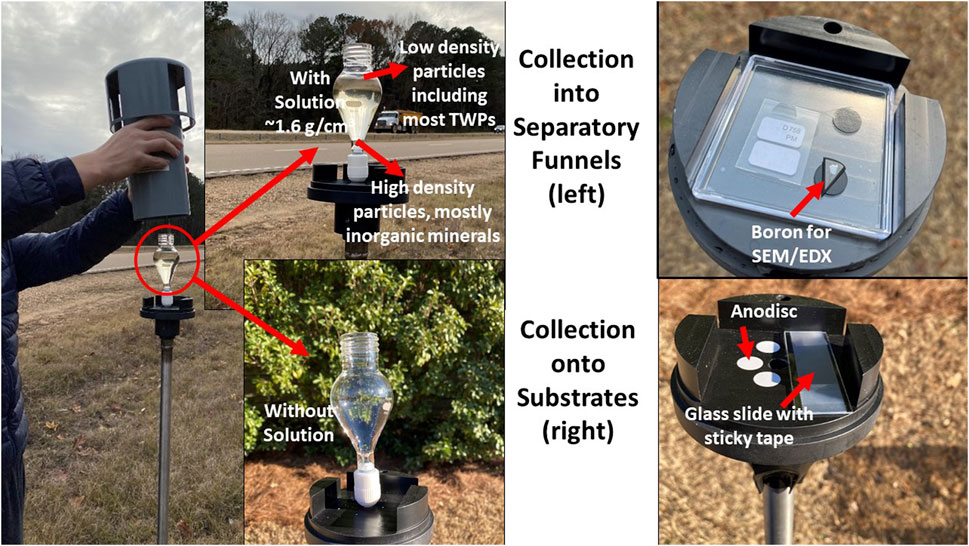
FIGURE 3. Sample collection schemes using the Sigma-2 sampler. Particles deposit into 60 ml glass separatory funnels with or without solution for density separation (left) or onto substrates for imaging and chemical analysis (right).
Next we focus on the choice of these substrates. The analytical procedure for stereomicroscopy, single particle SEM/EDX, and µ-FTIR analyses are each described in separate sections below. For the glass slides, we used stereomicroscopy to evaluate particles on primarily two substrates, clear Scotch® tape folded over on itself and placed on a glass slide to create an inexpensive sticky surface for the particles to adhere to, and polycarbonate filters for particles initially collected in the separatory funnels and transferred to the filters as described in Section 2.4. The filters were polycarbonate track-etched filters (25 mm in diameter, 10 µm pore size) from Sterlitech Corp., Kent, WA, United States. Aluminum oxide (Anodisc) filters (Millipore Sigma, St. Louis, MO, United States) were also used but were problematic for sampling and thus discontinued (discussed in Section 3.2).
For single particle SEM/EDX analyses, a highly polished boron surface is used. Boron has a number of advantages which have been described elsewhere (Rausch et al., 2022). Briefly, boron allows carbon and other low-Z elements to be analyzed quantitatively by EDX spectroscopy, which is critical because it is diagnostic for the identification of TWPs, and because it creates material contrast improving particle recognition and image quality (Choël et al., 2005; Rausch et al., 2022).
2.4 Adaption and use of a separatory funnel with the Sigma-2
We also used 60 ml Squibb glass separatory funnels with a PTFE valve and threaded screw cap to capture a subset of particles entering the Sigma-2 passive sampler (Figure 2). The top opening of the separatory funnel has a diameter of 2.5 cm providing an area of 4.91 cm2 for particles to fall into. Density separations are advantageous when there is a high particle load which can result in overlapping particles that complicate both particle counting and particle characterization. A density separation can isolate the TWPs (and other microplastics) from denser mineral- or pure road-based particles, which may waft up on high-speed roads with passing vehicles, prior to analyses. Conducting the separation in the field (in situ) can minimize sample preparation and laboratory contamination. Further, unlike sticky substrates, which are not amenable to giving up their captured particles, collecting particles in a separatory funnel allows their subsequent transfer to various filters for imaging and chemical analysis.
To add the separatory funnel to the Sigma-2 we drilled a hole in the center of Sigma-2 base plate to just barely accommodate the separatory funnel stem. Inserting the stem into the hole using a twisting action allows the funnel to stay securely upright. In the field, we initially added ∼45 ml of ZnCl2 (1.6 g/cm3) but later replaced it with metatungstate solution at the same density because of its lower toxicity. Despite 100% of recovery rate of crumb rubber, ZnCl2 (1.6 g/cm3) solution may not be sufficient to separate all TWPs. After sample collection, we allowed the lower 2/3 of the solution along any settled particles to run into a waste container before closing the valve and capping the top for transport to the laboratory. At the laboratory the remaining portion was filtered through a polycarbonate filter (described earlier) using a glass filter apparatus. The filters were washed with ∼100 ml of filtered deionized water and allowed to dry in a laminar flow hood in a clean room. Later we determined that the particle load generally did not necessitate density separation, so we used the separatory funnels without solution and simply washed the particles out into a glass filter apparatus for transfer onto the polycarbonate filters for stereomicroscopy.
Finally, a comparison was made between the different sampling approaches, including between the funnel (both with and without solution) and the classical adhesive substrate sampling (Section 3). This latter comparison was necessary because the Sigma-2 was designed and validated for sedimentation of particles to the base plate (∼18 cm below the inlet) but the top of the separatory funnel was only ∼5 cm below the inlet. The influencing factors on TWP abundances were also studied, including driving speed, traffic volume, driving behavior and sampling distance (Supplementary Table S1).
2.5 Stereomicroscopy, image processing, and selection criteria for putative TWPs
Samples and blanks consisting of transparent adhesive tapes, polycarbonate filters, and aluminum oxide filters were visually inspected using a Stemi 508 stereomicroscope equipped with an Axiocam 105 color digital camera (Carl Zeiss, Jena, Germany). Representative images of each sample were taken at ×95 magnification (Figure 4) and were processed by ImageJ (Rasband, 1997). The criteria to distinguish putative TWPs from other particles were based on their dark/black color, cylindrical/elongated fragment shape, and rough surface texture, as well as a lack of any obvious cellular or biological structures (e.g., spines or striations) (Leads and Weinstein, 2019). Bright or colored particles are mostly of geogenic, biogenic, or non-TWP anthropogenic origin. An example showing the selection of putative TWPs from a stereomicroscopy image using Image-J is given in (Supplementary Figure S4). We used a light threshold setting of ∼200 to remove faint objects, and only counted objects >10 µm in size meeting the aforementioned criteria. Image-J also facilitated classification of the putative TWPs by size.
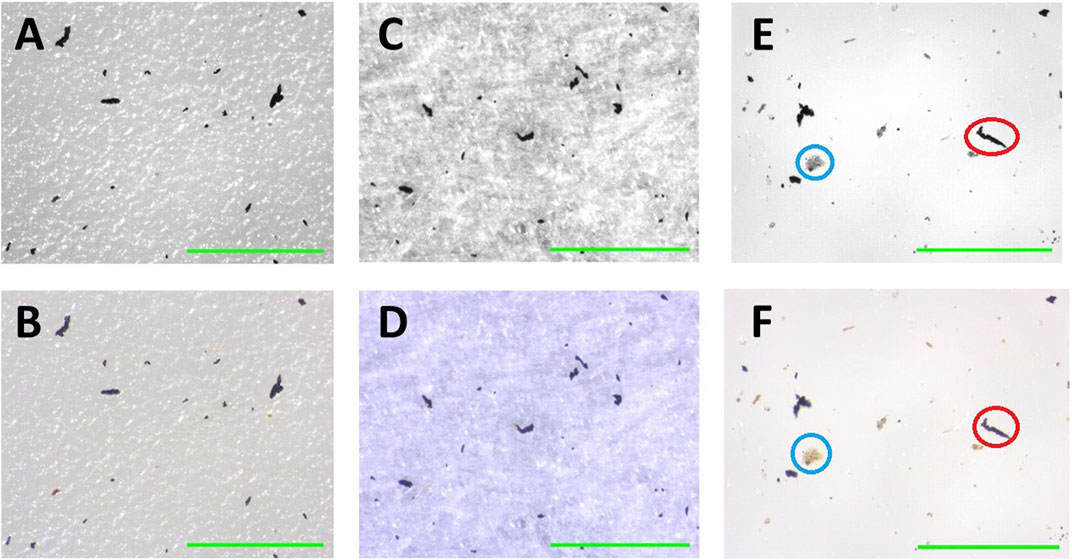
FIGURE 4. Microphotographs (×95 magnification) of airborne particulate matter collected near Highway 6 (A,B) with adhesive tape, Gertrude Ford Blvd. (C,D) with a separatory funnel, and University Avenue (E,F) also with separatory funnel. Upper images are in black and white, lower in RGB. A putative TWP is circled in red and a non-TWP circled in blue; see text for criteria for selection of putative TWPs. Each green scale bar represents 500 µm in length.
We note that although visual observations are not sufficient to discern small TWPs from other black particles, such as brake wear, soot and carbon black (Kovochich et al., 2021b), the latter are typically much smaller in size, often sub-micron, in vehicle exhaust (China et al., 2014; Xue et al., 2015), and our focus is primarily on particles >10 µm for light microscopy. Further, we morpho-chemically identified TWPs on a subset of samples by single particle SEM/EDX (Section 2.6). Single particle SEM/EDX and light microscopy complement each other for particle characterization, with the former well suited for analysis of fine and coarse PM, and the latter for super-coarse PM. Light microscopy does not provide elemental analyses, but is less expensive and thus may be more feasible for studies with large numbers of sampling sites.
2.6 Automated SEM/EDX single particle analyses
One boron substrate was deployed at each of the three traffic sites as described above. The samples were submitted to Particle Vision Ltd. for single particle SEM/EDX analysis. This analytical technique, which has increasingly been used to recognize and characterize TWPs in airborne samples, has been described extensively elsewhere (Rausch et al., 2022). Briefly, discrimination of TWPs involves combining the chemical fingerprints with morphological and textural parameters as discriminators into a machine learning (ML) based particle classifier developed at Particle Vision. Other morpho-chemical categories included metallic particles, minerals, and biogenic/organic particles. Samples collected on the highly polished boron substrate were analyzed by a Zeiss Gemini 300 Field Emission Gun (FEG)-SEM equipped with an Oxford X-MAX EDX detector with an 80 mm2 window, a high efficiency 4 quadrant BSE detector and the particle analysis software AZtecFeature at Particle Vision (Fribourg, Switzerland). All measurements were performed with the optimized settings published by Rausch et al. (2022). Areas analyzed on the samples varied slightly depending on particle load. For Highway 6, 7.11 mm2 was analyzed yielding 729 total particles; for Gertrude Ford Boulevard, 4.90 mm2 was assessed giving 442 total particles, and for University Avenue, 6.12 mm2 was investigated giving 267 total particles. The obtained data sets were treated with the ML based algorithm. Whereas there is no maximum size in the SEM/EDX particle analysis, the statistics are weaker for particles >40 µm since a small number of particles in that size range is measured due to the relative abundance of smaller particles in comparison to larger. Representative SEM images are given in Figure 5. Note, we did not apply the technique to all sampling campaigns due, in part, to costs.
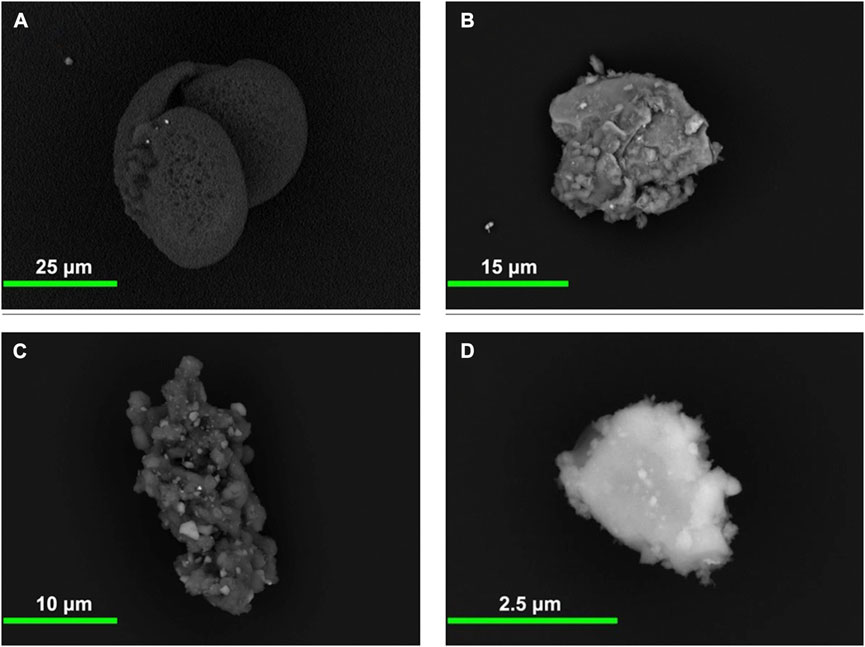
FIGURE 5. Representative SEM images of (A) biogenic/organic particle (pollen), (B) mineral, (C) tire wear particle, and (D) metallic particle collected adjacent to Highway 6.
The mass concentration (µg/m3) for each particle morpho-chemical category was calculated following the formulas summarized in the norm VDI 2119:2013. A 2D equivalent circular diameter (ECD) calculated from a particle area given by automated SEM/EDX single particle analyses and a specific density assigned to each particle category (TWP: 1.8 g/cm3, metallic particle: 5.1 g/cm3, mineral: 2.7 g/cm3, and biogenic/organic particle: 1.0 g/cm3) were used to calculate the mass of each identified particle (Rausch et al., 2022).
2.7 FTIR microscopy of putative TWPs
Following the visual inspection of particles on the polycarbonate filters, selected samples were chemically characterized by µ-ATR-FTIR using a Bruker LUMOS II microscope with a liquid nitrogen cooled MCT detector. Prior to analysis, the polycarbonate filters were sonicated for 5 min in 30 ml of deionized water to dislodge the particles and the resulting solution was filtered through a 25 mm aluminum oxide (Anodisc) filter. The filters were then dried at 40°C in an oven for 24 h before being analyzed using single spot analysis with a resolution of 4 cm−1 and 12 scans. The LUMOS system uses a retractable ATR crystal that is controlled by high-precision piezo-electrical motors integrated into the lens. This allows precise positioning of the ATR crystal on particles that the user selects. Here, we used a germanium ATR crystal to collect spectra on particles resembling TWPs. Since particles may stick to the crystal, it was cleaned with a Kimwipe between analyses. The data were processed using the instrument’s OPUS v8.5 software. Herein we show preliminary data that demonstrates the method is capable of generating relatively high-quality FTIR spectra for TWPs with characteristics that can aid in their identification.
2.8 Contamination mitigation and blanks
Unlike other microplastics, laboratory contamination with TWPs is not a great concern. Nevertheless, we have taken precautions to minimize contamination, including wearing cotton laboratory coats dyed bright orange and nitrile gloves during sample preparation and analyses. Glassware was thoroughly rinsed and/or heated at 450°C for 4 h, plastic materials were avoided to the extent possible, and samples were kept covered or sealed with aluminum foil or glass unless being actively processed. Clean separatory funnels were rinsed with DI water and then, the water was filtered through an anodisc filter for stereomicroscopic inspection and µ-FTIR identification. Clean tapes were checked by stereomicroscopy. Sample preparation procedures were conducted in a clean room to reduce airborne contamination. We conducted several laboratory air blanks analyzing filters set out next to the samples as they were processed. We also analyzed field blanks of filters and of the adhesive tape and never observed a TWP among them.
3 Results and discussion
3.1 Characterization and sources of PM∼1–80 by single particle SEM/EDX
Using single particle SEM/EDX we evaluated particles >1 µm ECD (equivalent circular diameter) in size, which largely eliminates vehicle soot since it is typically much smaller (Kurniawan and Schmidt-Ott, 2006). For samples collected 5 m from the road, we observed the lowest particle deposition rate (i.e., airborne abundance) at the low traffic site on the University Avenue (864 particles/cm2/day), with TWPs accounting for only ∼7% of the total particles, corresponding to 59 particles/cm2/day (Figure 6). Concentrations at Gertrude Ford Boulevard (our “moderate traffic” site) and Highway 6 (“high traffic” site) were 1789 particles/cm2/day and 2048 particles/cm2/day, respectively. TWPs accounted for ∼30% of the particles detected at both of these sites (511 particles/cm2/day and 703 particles/cm2/day, respectively).
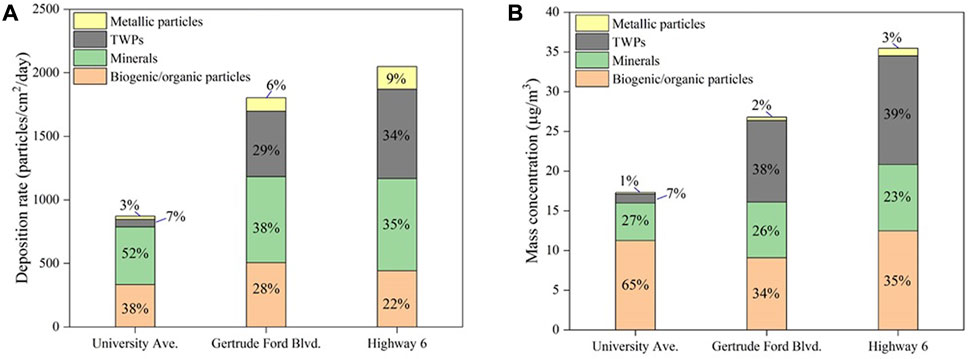
FIGURE 6. The particle deposition rate (A) and mass concentration (B) along with the relative proportions (%) of all morpho-chemical classes for the “low,” “moderate,” and “high” traffic sites (University Ave., Gertrude Ford Blvd., and Highway 6, respectively). The size fraction considered here is 1–60 µm geometric diameter, as no particles >60 µm were found on the analyzed areas.
In terms of mass, particle concentrations at University Avenue, Gertrude Ford Boulevard and Highway 6 were 17.3, 26.8, and 35.5 μg/m3, respectively, with TWP concentrations of 1.2, 10.3 and 13.7 μg/m3 (Figure 6). This compares favorably to 34.3 μg/m3 for total particles in the 1–80 µm size range adjacent to a busy road in Bern and 11.6 μg/m3 at an urban background station in Zurich, Switzerland (Rausch et al., 2022). The mass concentration of TWPs at the urban curbside site in Bern (13.5 μg/m3) and the proportion of TWPs (39.2%) were also comparable with our study, despite Bern’s much larger size and population. Also based on single particle SEM/EDX measurements, Sommer et al. (2018) reported tire and road wear particles comprising 64.1% of the 508 analyzed particles collected from motorways and a highway in Germany. However, it is important to note that the Sommer et al. (2018) study focused only on the super coarse fraction (PM80-10). When looking the same size fraction, TWPs comprised 47.8% of the particles in the studied site in Bern. Overall, the moderate and high traffic sites had similar mass concentration patterns: TWPs > biogenic/organic > minerals > metallic particles.
For our study, size-resolved PM source differentiation is shown in Figure 7. TWPs were most abundant between ∼5 and 20 µm for both the moderate and high speed/volume roads by both deposition rate and mass. There were too few TWPs observed at the low-speed site to observe this trend, and no TWPs observed above 60 µm across sites. The mass concentrations of TWPs within the PM20-5 fraction, which contained the majority of the TWPs, were determined to 0.9, 8.4, and 11.9 μg/m3 at the low, moderate, and high traffic sites, respectively, accounting for 77–87% of total identified TWPs. Rausch et al. (2022) also observed the highest TWPs concentrations for the ∼5 and 20 µm size fraction, along with a decreasing concentration with increasing particle size.

FIGURE 7. Particle mass concentration with size distribution and source differentiation for airborne particulate matter collected using the Sigma-2 sampler along low traffic University Ave. (A), moderate traffic Gertrude Ford Blvd. (B), and high traffic Highway 6 (C).
As for the other particle source categories, metallic particles were generally <10 µm in size, and accounted for <5% of the particles by mass. Metallic particles, which mostly originate from the abrasion of brake pads, brake liners, rails and rail-car wheels, are typically 1–5 µm in size (Tian et al., 2017; Rausch et al., 2022). Minerals and especially biogenic/organic particles spread more evenly across size categories, with biogenic/organic particles extending to slightly larger sizes. This is because biogenic/organic particles in the studied samples largely consist of pollen grains (Figure 5), which tend to be > 10 µm. Most of the particles along the low speed/volume road were biogenic/organic particles (∼38% and 65%, by deposition rate and mass, respectively).
Whereas we also used single particle SEM/EDX to examine the super coarse fraction, it is important to note that given the relatively small area analyzed on the substrate (due to high magnification) and the limited number of super coarse particles present, results for this size fraction (e.g., the percent of particles from a given source category) should be viewed with caution. Therefore, the concentration of particles >60 µm might be underestimated. This could be compensated in future studies by increasing the size of the analyzed area and/or using lower magnification if smaller particles (i.e., <10 µm) are not of interest in the performed study.
3.2 Comparison of TWP sampling methods using the Sigma-2 passive sampler
As discussed in Section 2.3, we used different substrates in the Sigma-2 sampler to collect particles for different types of analyses, including a novel approach using separatory funnels (Figure 3). There are several potential advantages to capturing the particles into a vessel (e.g., separatory funnel) for subsequent density separation and/or transfer to various filters for optical or chemical imaging, including minimizing sample preparation and laboratory contamination. However, as noted in Section 2.4, the Sigma-2 was not designed for a separatory funnel so it was necessary to do a side-by-side comparison with traditional adhesive tape. We also included an aluminum oxide filter in this comparison. Here, we compare the abundance of putative TWPs collected by these different sampling approaches as determined by stereomicroscopy.
Unlike the adhesive tape and separatory funnel, whose data generally tracked each other, the aluminum oxide filter data were more variable and inconsistent with the other methods (Figure 8). The lack of adhesive on the aluminum oxide filters along with difficulty handling the thin and fragile filters in the field likely make them prone to error. Thus, we eliminated the aluminum oxide filter as a field sampling collection substrate. However, aluminum oxide filters can still be used for chemical analysis by FTIR microscopy if the particles are transferred to it after collection in the field, using, for example, a separatory funnel.
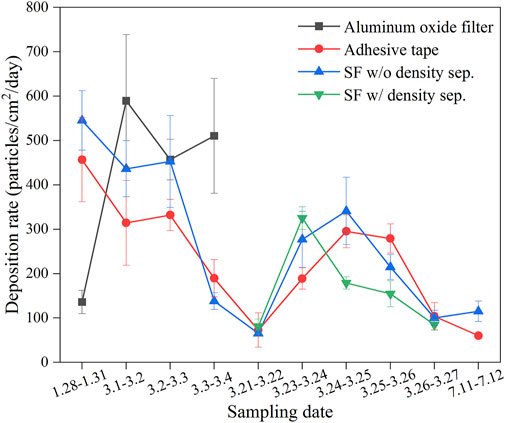
FIGURE 8. Comparison of different methods for collection of airborne TWPs using the Sigma-2 sampler. Reported values are for putative TWPs as determined by optical microscopy (Mean ± 1SD).
To compare sample collection using separatory funnels, both with and without a solution for density separation, with the conventional sampling approach using adhesive tape on a glass slide, we did a side-by-side comparison at ∼5 m away from the road from March 21 to March 27. As discussed in Section 2.4, we conducted the density separation in the field and brought the solution containing the putative TWPs back to the laboratory, or in the case of the empty separatory funnel just brought it back to the laboratory. We then transferred the particles onto polycarbonate filters for enumeration by stereomicroscopy following our TWP selection criteria (Section 2.5) and compared the results to putative TWPs collected on the adhesive tape on the glass slide. We found similar trends in concentration between days for these three methods, with no statistical difference (ANOVA test: p > 0.05) in the abundance of TWPs collected (Figure 8). In our case, density separation did not significantly affect the concentration of TWPs, except for 1 day (24 March 2022 to 25 March 2022). This is somewhat surprising given that it has been reported that tire abrasion with road can increase the density of the TWPs beyond 1.6 g/cm3 (Kayhanian et al., 2012) which is the density of solution we used. However, others have estimated a density of 1.26 g/cm3 for TWPs from a motorway as a heterogeneous mixture of tire tread and road wear (Sommer et al., 2018), and as previously noted, a number of factors can affect particle density, including the type of traffic (e.g., volume, speed, ratio of trucks to cars), road conditions, and meteorological conditions (Panko et al., 2018; Rausch et al., 2022).
Nevertheless, there may be circumstances where a density separation is in order, especially when examining microplastics besides TWPs. The separatory funnel approach allows the particles to be readily transferred onto a filter with a smaller surface area to image and count. Moreover, different filters can be used depending on the type of characterization method. For example, a polyester or polyamide filter can be used for fluorescence detection after staining with Nile red dye as those two polymers don’t interact with the dye, or the aluminum oxide filter can be used for FTIR imaging microscopy. Nevertheless, when quantitative analysis is the primarily goal and chemical analysis is not required, sampling with adhesive tapes is the easiest approach. Thus, the quantitative data discussed below was mostly obtained from adhesive tape measurements, except for the single particle SEM/EDX analyses which used boron substrates.
3.3 Influence of traffic speed, volume, driving characteristics, and distance to road on the abundance of TWPs
Concentrations of airborne TWPs were typically positively correlated with driving speed. The highest average TWP deposition rate (particles/cm2/day at 5 m from the road) measured by optical microscopy was observed at Highway 6 (324 ± 129), where vehicles average ∼105 km/h, followed by Gertrude Ford Blvd. (184 ± 93), where vehicle speeds averaged 65 km/h, and University Avenue (29 ± 7 particles/cm2/day), where vehicles average ∼25 km/h. These abundances correspond well with the results obtained by the single particle SEM/EDX analyses (Figure 9). While shearing forces and volatilization are considered to be the mechanism of TWP generation (Mathissen et al., 2011), it has been speculated that tire wear may also be affected by vehicle weight, although there is little direct data to support this. In a simulated study, TWP emissions were quantitatively affected by the load applied on the tire surface (Kim and Lee, 2018). Thus, the higher TWP deposition rate near Highway 6 could be partly attributed to the greater frequency of heavy commercial vehicles travelling on the highway compared to the other two sampling sites, which are dominated by passenger cars and light duty vehicle traffic. However, more measurements are needed to confirm this, as well as to, possibly, observe any differences in TWP grain size distributions between sites.
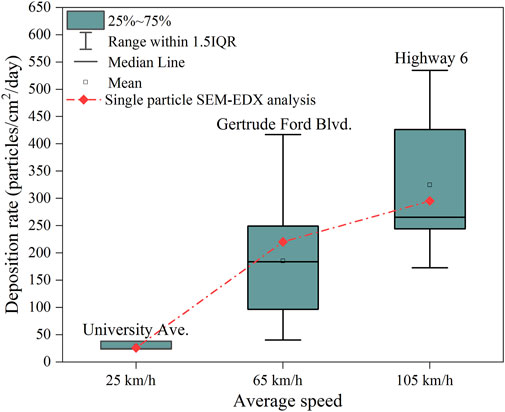
FIGURE 9. Abundance (deposition rate) of TWPs as a function of vehicle speed as determined by optical microscopy (box plots) and single particle SEM/EDX analysis (red diamonds).
Comparing results for different traffic volumes (from ∼6000 to ∼18,000 vehicles) on the same road (Gertrude Ford Boulevard) at the same location, we observed a general rise in TWP concentrations with rise in traffic volume from 88 ± 33 to 392 ± 98 particles/cm2/day (Figure 10). This identical trend was also found among our three sampling sites, with the highest TWP deposition rate at Highway 6 (“high traffic”), followed by Gertrude Ford Blvd. (“moderate traffic”) and University Ave. (“low traffic”). Youn et al. (2021) reported that TWP concentration in industrial area road dust was 2.5 times higher than in residential area, which may be associated with the high traffic volume.
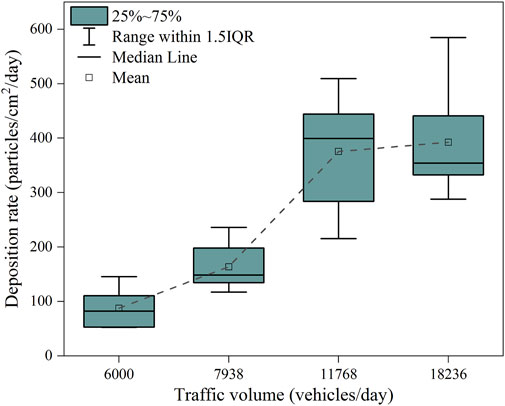
FIGURE 10. Deposition rate of putative TWPs along Gertrude Ford Boulevard collected at the same location (similar speeds) but with different traffic volumes. Reported values were determined by optical microscopy. Conditions were sunny with little wind.
Previous studies have observed that driving behavior can also influence TWP emission, with braking and accelerating generating more TWPs compared to driving at a steady speed (Luhana et al., 2004; Vogelsang et al., 2019). Higher concentrations of TWPs were recorded at the Blackwall Tunnel Approach in London where significant braking activity occurs before the tunnel portal, which created more tire wear abrasion than during constant speed driving (Panko et al., 2019). In our study, we found significantly higher putative TWP concentrations (p < 0.05) along Gertrude Ford Blvd. where cars begin to slow with an approaching cross walk and entrance to campus, compared to a nearby stretch of the same road where traffic is at a steady and even slightly higher speed (Figure 11).
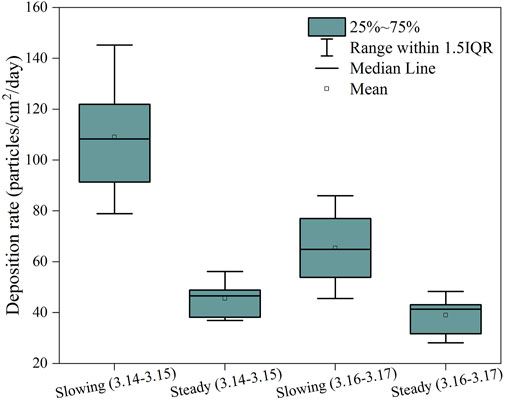
FIGURE 11. Deposition rate of putative TWPs along Gertrude Ford Boulevard at two different locations with similar speeds but different driving behavior (slowing vs. steady). Reported values were determined by optical microscopy.
During one sampling campaign, we measured the spread of TWPs moving away from Highway 6. There was a substantial decrease in putative TWPs moving away from the highway (Figure 12). TWP deposition rate at 5 m away from Highway 6 was 340 ± 145 particles/cm2/day, and decreased 47% (180 ± 88 particles/cm2/day) and 71% (99 ± 54 particles/cm2/day) when sampling distances increased to 15 m and 30 m, respectively. Significant decreasing pattern was only found to be significant (ANOVA, p = 0.014) between 5 m and 30 m. Rødland et al. (2022) found that the concentration of TWPs in meltwater was highest at 0 m distance from the road and decreased towards 3 m distance, but the decrease was not significant. TWP concentration in the tunnels and soils next to the road were detected to be the highest (Wagner et al., 2018). Tire wear particles encrusted with road dust have higher densities (1.5–1.88 g/cm3) than freshly emitted particles into air (Klöckner et al., 2019) which consequently makes deposition closer to the road more likely. Thus, we recommend using a solution with density of 1.9 g/cm3 or higher.
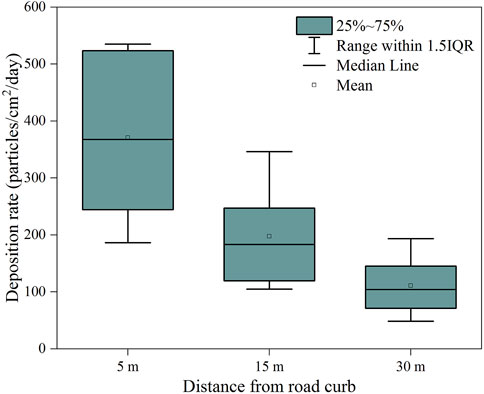
FIGURE 12. Deposition rate of putative TWPs with distance from Highway 6 in Oxford, Mississippi. Reported values were determined by optical microscopy.
3.4 Preliminary results for FTIR microscopy of putative TWPs
The aluminum oxide (Anodisc) filter is widely used for identifying microplastics using µ-FTIR chemical imaging (Song et al., 2021). This is because the filter is transparent down to ∼1200 cm−1 and does not absorb strongly until below ∼1000 cm−1. However, TWPs are difficult to analyze by transmission and reflection spectroscopy given their black color. Here, we show that µ-ATR-FTIR analysis of TWPs is promising as a new tool to characterize TWPs greater than ∼10 µm in size. µ-ATR-FTIR spectra from TWPs collected from both the Highway 6 and Gertrude Ford Boulevard is shown in Figure 13. These spectra are similar to the FTIR spectra for reference tread and TWPs generated from a road simulator reported by Kovochich et al., 2021a. They contain a prominent broad C=C bending peak at ∼1050 cm−1, which may include the broad C-S-C functional group at ∼1080 cm−1, and minor peaks at ∼1460 cm−1 (C-H bending) and ∼1600 cm−1 (CH2 and CH3 stretches). Kovochich et al. (2021b) used a density separation and a chemical mapping protocol to identify and characterize individual TWPs in complex road dust samples, using FTIR spectra as part of the weight of evidence approach to classifying particle types. The authors show differences in FTIR spectra for TWPs and other colored or transparent particles corresponding to minerals (e.g., quartz, calcium carbonate). When we searched our instrument database using the putative TWPs, isobutylene isoprene rubber was routinely the top hit. Using µ-ATR-FTIR analysis, we examined multiple particles resembling TWPs from each sampling site. The spectra matched that of TWPs 100% of the time at Highway 6 (50 of 50 particles), 94% of the time at Gertrude Ford Boulevard (47 of 50 particles), and 80% of the putative TWPs at University Avenue (16 of 20 particles). We also measured 100 particles that did not resemble TWPs and none of them matched the spectral characteristics of TWPs. We are currently optimizing the imaging method and taking additional measurements for TWPs collected with the Sigma-2 sampler, which will be the subject of a future report.
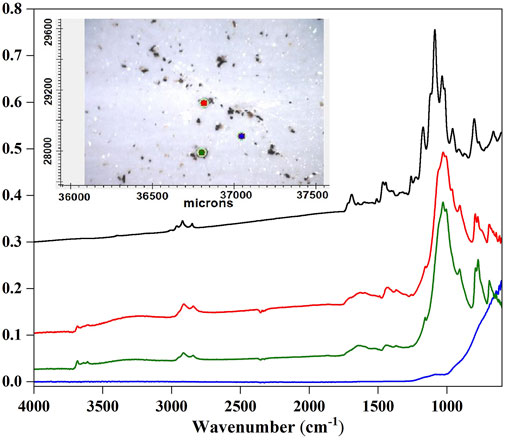
FIGURE 13. Portion of an aluminum oxide filter containing airborne PM collected near Highway 6 using the Sigma-2 sampler (inset). Spectra for the red and green dots (putative TWPs) along with the filter blank (dark blue) are below with the X-axis in wavenumbers (cm−1) and y-axis in absorbance. Black line represents the reference spectrum of isobutylene isoprene rubber, a common synthetic elastomer.
4 Conclusion
This study evaluated TWPs collected along a busy highway, moderate speed- and volume-boulevard, and low speed- and volume-avenue using the Sigma-2 passive sampler. By combining stereomicroscopy to quantify putative TWPs and single particle SEM/EDX, we evaluated factors affecting the abundance of airborne TWPs, including proximity to the roads, vehicle speed, traffic volume, and driving behavior (braking vs. steady speed). We also compared different particle collection schemes, including different substrates and a separatory funnel. In general, we found that closer proximity to a roadway led to a higher TWP concentration. Higher vehicle speeds and traffic volumes also increased the number of TWPs present at those locations. Additionally, areas where drivers were prone to breaking had a significantly higher concentration of TWPs, demonstrating that driver behavior plays a role in TWP generation. In terms of sampling procedures, separatory funnels were validated for use with the Sigma-2 samplers. No significant differences in TWP concentrations were seen between the separatory funnels without density separation solution and the traditional adhesive tape. This novel sampling method is ideal for subsequent analysis that need a particle transfer in the lab like FTIR due to its ease of use in the field, lower risk of contamination, and lack of adhesive residue on captured particles. We also explored placing filters and substrates directly in the Sigma-2 samplers. While the boron substrate for SEM analysis worked well, the aluminum oxide filters used for FTIR microscopy were too fragile and unsuitable for field use. In addition, we determined the relative proportion of sources of PM80-1 at three locations along roads in a small University town, finding TWPs > biogenic/organic > minerals > metallic particles (by mass concentration) for the highway and moderate traffic boulevard, but biogenic/organic > minerals > TWPs > metallic particles for the low traffic site. A subset of putative TWPs were confirmed to have similar FTIR as those reported for reference tread and TWPs generated from simulator conditions.
Overall, we investigated multiple sampling methods in addition to exploring the various factors affecting TWP concentrations. Our novel method of combining separatory funnels with the Sigma-2 passive samplers makes sample collection and transportation much easier. In addition, our results show that numerous factors such as traffic speed, volume, proximity to the road, and even driving behavior can affect TWP concentration. As such, it is crucial to consider all these factors when comparing data across different sites and research studies.
Data availability statement
The raw data supporting the conclusions of this article will be made available by the authors, without undue reservation.
Ethics statement
Written informed consent was obtained from the individual(s) for the publication of any potentially identifiable images or data included in this article.
Author contributions
JC conceptualized, supervised, and administered the project; ZG led the sampling and measurement campaign with help from CC, KF, and KW; ZG, CC, KF, and KW analyzed the samples by microscopy and spectroscopy. DJ-V and JR. performed the SEM/EDX single particle analysis and particle classification/interpretation using the machine-learning algorithm. Each author helped analyze and interpret the data. ZG and JVC authored early drafts of the paper. All authors have read and agreed to the published version of the manuscript.
Funding
This work was supported by the U.S. Geological Survey (USGS) under grant G16AP00065 and the National Science Foundation under grant MRI-2116597. The views and conclusions contained in this document are those of the authors and should not be interpreted as representing the opinions or policies of the USGS. Mention of trade names or commercial products does not constitute their endorsement by the USGS. The stereomicroscope is part of the GlyCORE Imaging Core supported by an Institutional Development Award (IDeA) from the National Institutes of Health under award P20GM103460.
Acknowledgments
We thank Russ Heard at the City of Oxford for deploying the traffic data collector.
Conflict of interest
Authors JR and DJ-V are employed by Particle Vision Ltd.
The remaining authors declare that the research was conducted in the absence of any commercial or financial relationships that could be construed as a potential conflict of interest.
Reviewer JAGU has declared a commercial affiliation with the entity HORIBA Scientific, filial Sweden at the time of review.
Publisher’s note
All claims expressed in this article are solely those of the authors and do not necessarily represent those of their affiliated organizations, or those of the publisher, the editors and the reviewers. Any product that may be evaluated in this article, or claim that may be made by its manufacturer, is not guaranteed or endorsed by the publisher.
Supplementary material
The Supplementary Material for this article can be found online at: https://www.frontiersin.org/articles/10.3389/fenvs.2022.1022697/full#supplementary-material
References
Amato, F., Alastuey, A., de la Rosa, J., Castanedo, Y. G., de la Campa, A. M., Pandolfi, M., et al. (2013). Trends of road dust emissions contributions on ambient PM levels at rural, urban and industrial sites in Southern Spain. Atmos. Chem. Phys. 14, 3533–3544. doi:10.5194/acpd-13-31933-2013
Baensch-Baltruschat, B., Kocher, B., Stock, F., and Reifferscheid, G. (2020). Tyre and road wear particles (TRQP)- A review of generation, properties, emissions, human health risk, ecotoxicity, and fate in the environment. Sci. Tot. Environ. 733, 137823. doi:10.1016/j.scitotenv.2020.137823
Brinkmann, M., Montgomery, D., Selinger, S., Miller, J. G. P., Stock, E., Alcaraz, A. J., et al. (2022). Acute toxicity of the tire rubber-derived chemical 6PPD-quinone to four fishes of commercial, cultural, and ecological importance. Environ. Sci. Technol. Lett. 9 (4), 333–338. doi:10.1021/acs.estlett.2c00050
Brunekreef, B., and Forsberg, B. (2005). Epidemiological evidence of effects of coarse airborne particles on health. Eur. Respir. J. 26, 309–318. doi:10.1183/09031936.05.00001805
China, S., Salvadori, N., and Mazzoleni, C. (2014). Effect of traffic and driving characteristics on morphology of atmospheric soot particles at freeway on-ramps. Environ. Sci. Technol. 48 (6), 3128–3135. doi:10.1021/es405178n
Choël, M., Deboudt, K., Osán, J., Flament, P., and Van Grieken, R. (2005). Quantitative determination of low-Z elements in single atmospheric particles on boron substrates by automated scanning electron microscopy- energy-dispersive x-ray spectrometry. Anal. Chem. 77, 5686–5692. doi:10.1021/ac050739x
Dietze, V., Kaminski, U., Gieré, R., Goldenberg, E., Stille, P., Grobéty, B., et al. (2010). “Passive sampler technique Sigma-2 with automated microscopic real colour image processing for particle measurements in the size range from 2.5-80 μm,” in Goldschmidt Conference, Knoxville.
Frias, J., and Nash, R. (2019). Microplastics: Finding a consensus on the definition. Mar. Pollut. Bull. 138, 145–147. doi:10.1016/j.marpolbul.2018.11.022
Gerking, S., Dickie, M., and Veronesi, M. (2014). Valuation of human health: An integrated model of willingness to pay for mortality and morbidity risk reductions. J. Environ. Econ. Manage. 68, 20–45. doi:10.1016/j.jeem.2013.11.010
Gordon, T., Chen, L. C., Ito, K., and Lippmann, M. (2012). EPA final report: Comparative toxicity of coarse particles. USA: U.S. Environmental Protection Agency.
Guéguen, F., Stille, P., Dietze, V., and Gieré, R. (2012). Chemical and isotopic properties and origin of coarse airborne particles collected by passive samplers in industrial, urban, and rural environments. Atmos. Environ. X. 62, 631–645. doi:10.1016/j.atmosenv.2012.08.044
Kayhanian, M., McKenzie, E. R., Leatherbarrow, J. E., and Young, T. M. (2012). Characteristics of road sediment fractionated particles captured from paved surfaces, surface run-off and detention basins. Sci. Total Environ. 439, 172–186. doi:10.1016/j.scitotenv.2012.08.077
Kim, G., and Lee, S. (2018). Characteristics of tire wear particles generated by a tire simulator under various driving conditions. Environ. Sci. Technol. 52, 12153–12161. doi:10.1021/acs.est.8b03459
Klöckner, P., Reemtsma, T., Eisentraut, P., Braun, U., Ruhl, A. S., and Wagner, S. (2019). Tire and road wear particles in road environment–Quantification and assessment of particle dynamics by Zn determination after density separation. Chemosphere 222, 714–721. doi:10.1016/j.chemosphere.2019.01.176
Kovochich, M., Liong, M., Parker, J., Oh, S. C., Lee, J., Xi, L., et al. (2021b). Chemical mapping of tire and road wear particles for single particle analysis. Sci. Total Environ. 757, 144085. doi:10.1016/j.scitotenv.2020.144085
Kovochich, M., Parker, J. A., Oh, S. C., Lee, J. P., Wagner, S., Reemtsma, T., et al. (2021a). Characterization of individual tire and road wear particles in environmental road dust, tunnel dust, and sediment. Environ. Sci. Technol. Lett. 8, 1057–1064. doi:10.1021/acs.estlett.1c00811
Kreider, M., Panko, J., McAtee, B., Sweet, L., and Finley, B. (2009). Physical and chemical characterization of tire-related particles: Comparison of particles generated using different methodologies. Sci. Total Environ. 408, 652–659. doi:10.1016/j.scitotenv.2009.10.016
Kurniawan, A., and Schmidt-Ott, A. (2006). Monitoring the soot emissions of passing cars. Environ. Sci. Technol. 40, 1911–1915. doi:10.1021/es051140h
Leads, R., and Weinstein, J. (2019). Occurrence of tire wear particles and other microplastics within the tributaries of the Charleston Harbor Estuary, South Carolina, USA. Mar. Pollut. Bull. 145, 569–582. doi:10.1016/j.marpolbul.2019.06.061
Luhana, L., Sokhi, R., Warner, L., Mao, H., Boulter, P., McCrae, I., et al. (2004). Measurement of non-exhaust particulate matter. Deliverable 8 of the European Commission DG TrEn 5th Framework PARTICULATES (Characterization of Exhaust Particulate Emissions from Road Vehicles) project.
Mathissen, M., Scheer, V., Vogt, R., and Benter, T. (2011). Investigation on the potential generation of ultrafine particles from the tire–road interface. Atmos. Environ. X. 45, 6172–6179. doi:10.1016/j.atmosenv.2011.08.032
Mirowsky, J., Hickey, C., Horton, L., Blaustein, M., Galdanes, K., Peltier, R. E., et al. (2013). The effect of particle size, location and season on the toxicity of urban and rural particulate matter. Inhal. Toxicol. 25, 747–757. doi:10.3109/08958378.2013.846443
Panko, J., Kreider, M., and Unice, K. (2018). Review of tire wear emissions: A review of tire emission measurement studies: Identification of gaps and future needs. Non-Exhaust Emiss. 2018, 147–160. doi:10.1016/B978-0-12-811770-5.00007-8
Panko, J. M., Hitchcock, K. M., Fuller, G. W., and Green, D. (2019). Evaluation of tire wear contribution to PM2.5 in urban environments. Atmosphere 10, 99. doi:10.3390/atmos10020099
Rasband, W. S. (1997). ImageJ. Bethesda, Maryland, USA: U. S. National Institutes of Health. AvaliableAt: https://imagej.nih.gov/ij/.
Rausch, J., Jaramillo-Vogel, D., Perseguers, S., Schnidrig, N., Grobety, B., and Yajan, P. (2022). Automated identification and quantification of tire wear particles (TWP) in airborne dust: SEM/EDX single particle analysis coupled to a machine learning classifier. Sci. Total Environ. 803, 149832. doi:10.1016/j.scitotenv.2021.149832
Rødland, E. S., Lind, O. C., Reid, M. J., Heier, L. S., Okoffo, E. D., Rauert, C., et al. (2022). Occurrence of tire and road wear particles in urban and peri-urban snowbanks, and their potential environmental implications. Sci. Total Environ. 824, 153785. doi:10.1016/j.scitotenv.2022.153785
Seiwert, B., Klöckner, P., Wagner, S., and Reemtsma, T. (2020). Source-related smart suspect screening in the aqueous environment: Search for tire-derived persistent and mobile trace organic contaminants in surface waters. Anal. Bioanal. Chem. 412, 4909–4919. doi:10.1007/s00216-020-02653-1
Sommer, F., Dietze, V., Baum, A., Sauer, J., Gilge, S., Maschowski, C., et al. (2018). Tire abrasion as a major source of microplastics in the environment. Aerosol Air Qual. Res. 18, 2014–2028. doi:10.4209/aaqr.2018.03.0099
Song, Y. K., Hong, S. H., Eo, S., and Shim, W. J. (2021). A comparison of spectroscopic analysis methods for microplastics: Manual, semi-automated, and automated Fourier transform infrared and Raman techniques. Mar. Pollut. Bull. 173, 113101. doi:10.1016/j.marpolbul.2021.113101
Sundt, P., Schulze, P. E., and Syversen, F. (2014). Sources of microplastics-pollution to the marine environment. Oslo: Norwegian Environment Agency.
Tian, Z., Dietze, V., Sommer, F., Baum, A., Kaminski, U., Sauer, J., et al. (2017). Coarse-particle passive-sampler measurements and single-particle analysis by transmitted light microscopy at highly frequented motorways. Aerosol Air Qual. Res. 17, 1939–1953. doi:10.4209/aaqr.2017.02.0064
Tian, Z., Zhao, H., Peter, K. T., Gonzalez, M., Wetzel, J., Wu, C., et al. (2021). A ubiquitous tire rubber–derived chemical induces acute mortality in coho salmon. Science 371, 185–189. doi:10.1126/science.abd6951
VDI 2119 (2011). Ambient Air Measurement e Passive Sampling of Coarse Dust for Characterising Single Particles and Calculating the Size-fractionated Mass Concentration. Berlin: Beuth Verlag.
Vogelsang, C., Lusher, A., Dadkhah, M. E., Sundvor, I., Umar, M., Ranneklev, S. B., et al. (2019). Microplastics in road dust–characteristics, pathways and measures. Oslo: Norwegian Environment Agency.
Wagner, S., Hüffer, T., Klöckner, P., Wehrhahn, M., Hofmann, T., and Reemtsma, T. (2018). Tire wear particles in the aquatic environment - a review on generation, analysis, occurrence, fate and effects. Water Res. 139, 83–100. doi:10.1016/j.watres.2018.03.051
Waza, A., Scheiders, K., May, J., Rodriguez, S., Epple, B., and Kandler, K. (2019). Field comparison of dry deposition samplers for collection of atmospheric mineral dust: Results from single particle characterization. Atmos. Meas. Tech. 12, 6647–6665. doi:10.5194/amt-12-6647-2019
Xue, J., Li, Y., Wang, X., Durbin, T., Johnson, K., Karavalakis, G., et al. (2015). Comparison of vehicle exhaust particle size distributions measured by SMPS and EEPS during steady-state conditions. Aerosol Sci. Technol. 10, 984–996. doi:10.1080/02786826.2015.1088146
Youn, J. S., Kim, Y. M., Siddiqui, M. Z., Watanabe, A., Han, S., Jeong, S., et al. (2021). Quantification of tire wear particles in road dust from industrial and residential areas in Seoul, Korea. Sci. Total Environ. 784, 147177. doi:10.1016/j.scitotenv.2021.147177
Keywords: tire wear particles, Sigma-2 passive sampler, single particle SEM/EDX, airborne particulate matter, road traffic, light microscopy, μ-ATR-FTIR
Citation: Gao Z, Cizdziel JV, Wontor K, Clisham C, Focia K, Rausch J and Jaramillo-Vogel D (2022) On airborne tire wear particles along roads with different traffic characteristics using passive sampling and optical microscopy, single particle SEM/EDX, and µ-ATR-FTIR analyses. Front. Environ. Sci. 10:1022697. doi: 10.3389/fenvs.2022.1022697
Received: 18 August 2022; Accepted: 13 October 2022;
Published: 25 October 2022.
Edited by:
Stephan Wagner, Hochschule Fresenius, GermanyReviewed by:
Julian Alberto Gallego Urrea, Horiba Europe, filial Sweden, SwedenCassandra Rauert, The University of Queensland, Australia
Copyright © 2022 Gao, Cizdziel, Wontor, Clisham, Focia, Rausch and Jaramillo-Vogel. This is an open-access article distributed under the terms of the Creative Commons Attribution License (CC BY). The use, distribution or reproduction in other forums is permitted, provided the original author(s) and the copyright owner(s) are credited and that the original publication in this journal is cited, in accordance with accepted academic practice. No use, distribution or reproduction is permitted which does not comply with these terms.
*Correspondence: James V. Cizdziel, Y2l6ZHppZWxAb2xlbWlzcy5lZHU=
 Zhiqiang Gao1
 James V. Cizdziel
 Kaylea Focia