 Pinyang Luo
 Bingjie Yu
 Pengfei Li
 Pengpeng Liang
- 1School of Architecture, Southwest Jiaotong University, Chengdu, China
- 2School of Civil Engineering and Architecture, Southwest University of Science and Technology, Mianyang, China
Developing evidence-based planning interventions for promoting physical activity (PA) is considered an effective way to address urban public health issues. However, previous studies exploring how the built environment affects PA over-relied on small-sample survey data, lacked human-centered measurements of the built environment, and overlooked spatially-varying relationships. To fill these gaps, we use cycling and running activity trajectories derived from the Strava crowdsourcing data to comprehensively measure PA in the central city area of Chengdu, China. Meanwhile, we introduce a set of human-scale, eye-level built environment factors such as green, sky, and road view indexes by extracting streetscape characteristics from the Baidu street-view map using the fully Convolutional Neural Network (CNN). Based on these data, we utilize the geographically weighted regression (GWR) model to scrutinize the spatially heterogeneous impact of the built environment on PA. The results are summarized as follows: First, model comparisons show that GWR models outperform global models in terms of the goodness-of-fit, and most built environment factors have spatially varying impacts on cycling and running activities. Second, the green view index restrains cycling activities in general. In contrast, it has a wide-ranging and positive impact on running activities while hampers them in the PA-unfriendly old town. Third, the sky view index stimulates cycling activities in most areas. However, it has a mixed influence on running activities. Fourth, the road view index widely promotes cycling and running activities but hinders them in some areas of the old town dominated by automobiles and under construction. Finally, according to these empirical findings, we propose several recommendations for PA-informed planning initiatives.
Introduction
Urban public health issues have become a global obstacle to sustainable human development (Haskell et al., 2007; Beaglehole et al., 2011). For instance, the rampant communicable diseases and the harsh urban environment severely hamper the physical activity (PA) of urban residents and thus lead to non-communicable diseases (NCDs), such as obesity, hypertension, and anxiety (Haskell et al., 2007; Biddle and Asare, 2011; Bauman et al., 2012; Koohsari et al., 2013). Numerous studies have shown that PA, as a crucial determinant of the physical health of the population, is widely influenced by the built environment (e.g., road density and green space area) (Sarmiento et al., 2010; Wang et al., 2019). Therefore, many scholars are starting to or have already called for public health-oriented urban planning, that is, leveraging planning interventions to address public health issues (Corburn, 2004). To this end, we must have sufficient knowledge of the relationship between PA and the built environment.
The World Health Organization defines PA as all movements, including running, cycling, sports, active recreation, and play. It is considered an effective way to alleviate urban public health issues (Haskell et al., 2007; Beaglehole et al., 2011; Koohsari et al., 2013). Because the right amount of PA can prevent and reduce NCDs and thus helps improve health and well-being, as evidenced by The World Health Organization and The American Disease Control and Prevention.
The built environment refers to the man-made environment with physical characteristics created by human activities. Existing research has extensively explored the relationship between PA and the built environment and reached mixed conclusions (Ewing and Cervero, 2001; An et al., 2019). For instance, some scholars reveal that built environment factors such as sidewalks, bike paths, land-use mix, and low residential densities promote PA and prevent childhood comorbidity, whereas transit stops and high FAR hinder PA (Salvo et al., 2014; Ma and Dill, 2015; Mertens et al., 2017; Chen et al., 2022a). However, these studies largely suffer from the small sample size, given they over-rely on self-reported questionnaires and telephone surveys (Wang et al., 2019; Zhao and Wan, 2020; Chen et al., 2022b). Besides, researchers widely adopt the traditionally built environment factors (e.g., density and diversity), which only reflect the amount and layout of facilities (Lu et al., 2018a; Zhang et al., 2022). In contrast, little attention has been paid to human-scale measurements (Lu et al., 2019). In addition, many studies explored the relationship between the built environment and PA from a global perspective, i.e., examining the “average” correlation across the space (Handy et al., 2002; Ma and Dill, 2015). But it remains uncertain whether such correlation is spatially varying and how.
To bridge these gaps, this study uses the GWR model to scrutinize the relationship between PA and the built environment and its spatial heterogeneity in Chengdu, China. To be specific, we first use the Strava crowdsourcing data (a web platform that people can upload and share their PA trajectories) to measure the cycling and running activities at a grid cell level. Second, we enrich the built environment evaluating system by introducing novel human-scale streetscape indicators, such as the green view index and sky view index (Lu et al., 2019; Koo et al., 2022). The streetscape indicators can capture and reflect the scene seen by pedestrians at eye level, which has more advantages than the traditionally built environment, such as widely spatial distribution and low data bias (Lu et al., 2018b; Du and Huang, 2022). Finally, beyond the global modeling approaches (e.g., the ordinary least square model and the binary logit model), we utilize the geographically weighted regression (GWR) model to decipher the heterogeneity and complexity of the impact of the built environment on PA across space.
The remaining of this paper is organized as follows. Literature review Section reviews the literature on the relationship between PA and the built environment. Methodology Section and Result Section show data sources and the research methods. Discussion Section presents the results of the OLS and GWR model. These results are discussed in Conclusion Section. Data availability statement Section summarizes the findings, puts forward some suggestions for policymakers and urban planners, and discusses the limitations of this study.
Literature review
The built environment has a wide and direct impact on the PA of the inhabitants. Numerous scholars have researched PA and the built environment and have demonstrated a high correlation between them (Ewing and Handy, 2009; Sarmiento et al., 2010; Ying et al., 2015; Yang et al., 2022a). The existing studies focus on North America (e.g., Kansas, Massachusetts, Cuernavaca, and Alabama), Oceania (e.g., Adelaide), and Asia (e.g., Beijing, Shanghai, Nanning, and Hongkong). The research scales mainly include city level, neighborhood level (Zhao and Wan, 2020), and street level (Lu et al., 2018a). Table 1 summarizes some of the research on the relationship between PA and the built environment.
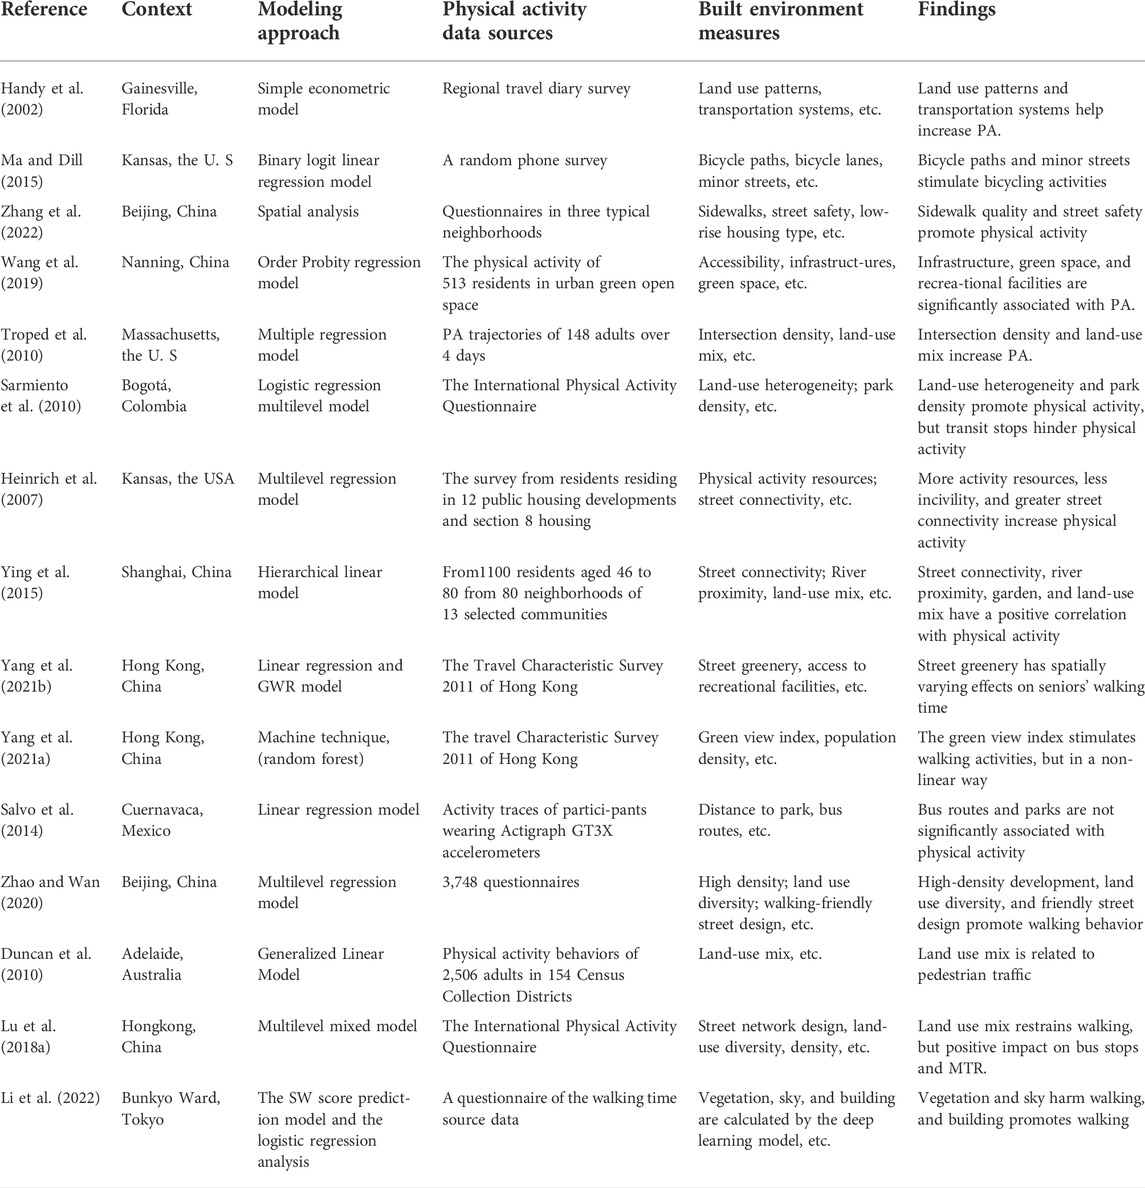
TABLE 1. Review of the research on PA and the built environment.
However, previous studies have the following gaps. Most research data on PA are generally derived from questionnaires, telephone surveys, and travel trajectories of sports participants (Forsyth et al., 2009; Sarmiento et al., 2010). But these suffer from a small sample size, and thus existing studies describe PA without using data from a larger spatial scale. Moreover, numerous studies have reached inconsistent conclusions on the impact of the built environment on PA due to the different data samples and built environment factors. Remarkably, researchers have used the traditionally built environment measurement to extract the built environment factors from various data such as Geographic Information System (GIS) data, POI, and satellite imagery data (Ding and Gebel, 2012; Yu et al., 2022a). Using data in these studies are effectively reflective of the number and spatial distribution of facilities (e.g., parks and enterprises) and neglect the impact of the human-oriented street on PA. In addition, previous studies have commonly used global analysis models, such as the simple econometric model, binary logit model, and multiple regression model, to explore the impact of the built environment on PA (Handy et al., 2002; Troped et al., 2010; Ma and Dill, 2015). These studies enriched the researches on the relationship between the built environment and PA, but ignored the factors of spatial variation.
With the development of information and communication technology, crowdsourcing data such as Strava data emerged, which provides technical support for measuring the spatial distribution of PA on large sample sizes (Yang et al., 2022b). Moreover, many researchers have found that streets play an important role in the promotion of physical activities such as running and cycling (Lu et al., 2018b; Yang et al., 2021a). One study reported that streets with rich vegetation create an ecological running environment and hence promote the PA of old people (Du and Huang, 2022). Another study reported that eye-level street greenery stimulates physical activity and thus improves the health of residents (Lu et al., 2018a). These researches use street view data which provide a large and objective record of the streetscape. Therefore, we can use semantic segmentation techniques to identify the street view data and measure the streetscape attribute factors from the human-scale view, which enriches the traditionally built environment evaluating system (Yang et al., 2021b). Furthermore, existing research on the correlation between PA and the built environment focuses on the global analysis of spatial elements, but many scholars in other research directions of urban space have used the GWR model to describe the local impact effects of spatial elements (Yang et al., 2017).
Therefore, this study makes the following innovations to fill these gaps. First, we measure the spatial distribution trajectory of PA on a large sample size with the Strava crowdsourcing data. Second, we increase the streetscape attribute factors from the human-scale view calculated by semantic segmentation techniques based on the traditionally built environment evaluating system. Third, we use the GWR model to scrutinize the spatial heterogeneity in the impact of the built environment on PA.
Methodology
Study area
Chengdu is a mega-city gathering economy, politics, culture, and ecology in western China. It is located in the middle of Sichuan Province, with 102°54′–104°53′ East and 30°05′–31°26′ North. By the end of 2021, it has a total area of 14,335 km2 and 21.19 million people. Currently, it is pursuing the Park City and building 476 parks and 150 km of greenways to ameliorate the living environment of residents and increase their motivation for outdoor activities. Moreover, the urban spatial structure of Chengdu is divided by ring roads such as the Third Ring Road. PA of central urban residents is mainly concentrated in the areas within the Third Ring Road. Therefore, this study chooses the area within the Third Ring Road as the study area to scrutinize the correlation between the built environment and PA (Figure 1).
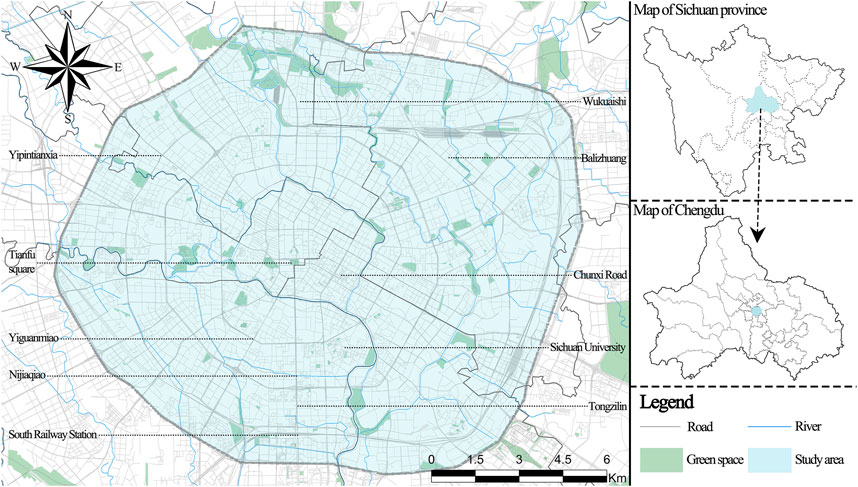
FIGURE 1. The study area.
Methods
Tobler’s first law reveals that most things are correlated in space; especially, the closer things have the high spatial autocorrelation (Tobler, 1970). Currently, models such as the OLS model and binary logit models can only study the relationship between independent variables and dependent variables from a global perspective, which overlooks the mutual spatially varying impacts of elements. Therefore, to improve the accuracy of the model and obtain more “real” results, Brunsdon et al. (1996) proposed the GWR model to explore the changes in elements in different spatial locations. GWR model is the local analysis model, which mainly analyzes the spatial heterogeneity of elements (Yang et al., 2020a; Yang et al., 2020b; Yu et al., 2022b). It gives higher weight to adjacent elements at a certain location and constructs different equations for elements at different spatial locations. In this way, variables can be better fitted, and more accurate results can be obtained (Yang et al., 2018; Liu et al., 2022). The specific formula is as follows.
where yi is the i-th variable of the dependent variable; k denotes the number of independent variables; βk (ui,vi) is the geolocation coordinates of the k-th point; and xk,i is the k-th independent variable and the Gaussian error at location i. Figure 2 shows the research framework of this paper.
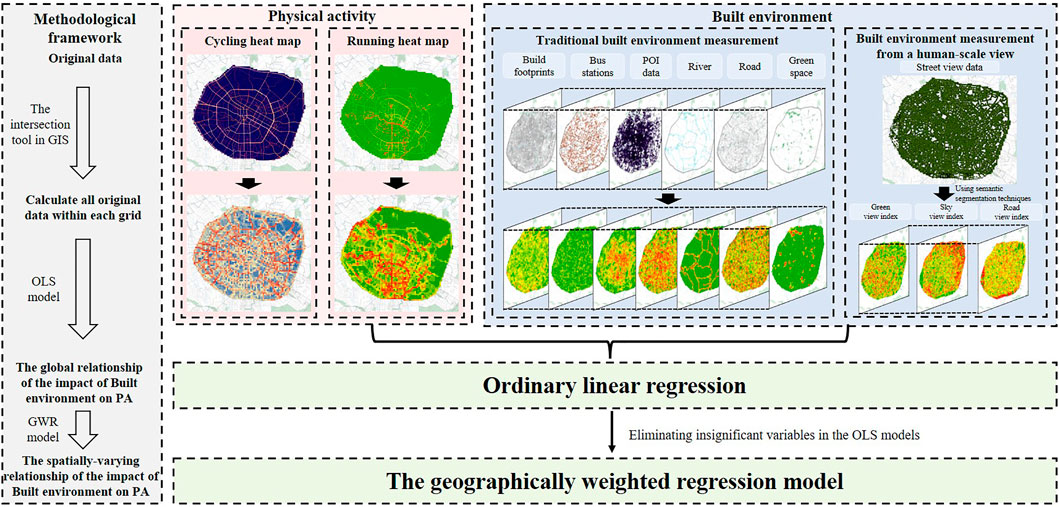
FIGURE 2. Research framework.
Strava data
Strava, as a professional sports logging software, is compatible with GPS logging devices such as sports watches and mobile phones and can record people’s activity trajectories in real-time. Moreover, it shares people’s monthly activity trajectories as a heat map on its website (https://www.strava.com/heatmap), which enables people to choose their routes when traveling for sport. The Strava data have specific advantages, such as highly accurate and large-scale data, over traditional questionnaires and telephone surveys.
We collect cycling and running activity trajectories from the heat map in Chengdu in December 2021. Moreover, the Chinese Ministry of Housing and Urban-Rural Construction released an annual report on road network density and traffic operation in major Chinese cities in 2022, which stated that the average road density in Chengdu is 8.4 km/km2 and the street spacing is 250 m. Therefore, we divide the study area into 250 m × 250 m grids using the GIS tools. Meanwhile, we use the raster to polygon tool in GIS to convert the heat map of cycling and running (raster data), into feature data, with the value of each feature representing the intensity of walking or cycling use. Then, we use the intersection tool in GIS to link the cycling and running heat map (feature data) to 250 m × 250 m grids of the study area. Finally, we calculate the average value of the cycling index and running index within each grid, for presenting residents’ activity trajectories at the street level. Figure 3 illustrates the calculation of the cycling and running index. The specific formulae used to calculate them are as follows.
Where yk is the cycling index and running index within the k-th grid, Xi is the value of the i-th heat map feature within k-th grid, n is the count of all heat map features in the k-th grid.
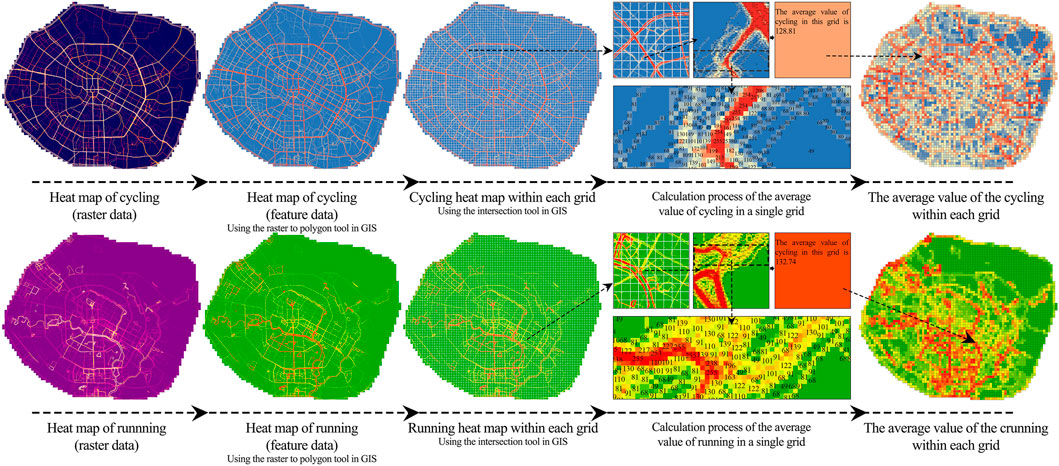
FIGURE 3. Illustration of the calculation of the cycling and running index in each grid.
Figure 4 summarizes the different spatial distributions of the running index and cycling index. The cycling index is mainly distributed along the ring road, and it is lower in the center and the northeast of the city. The running index is mainly concentrated in the city center and the south of the city, while the northeast of the city has a lower running index.
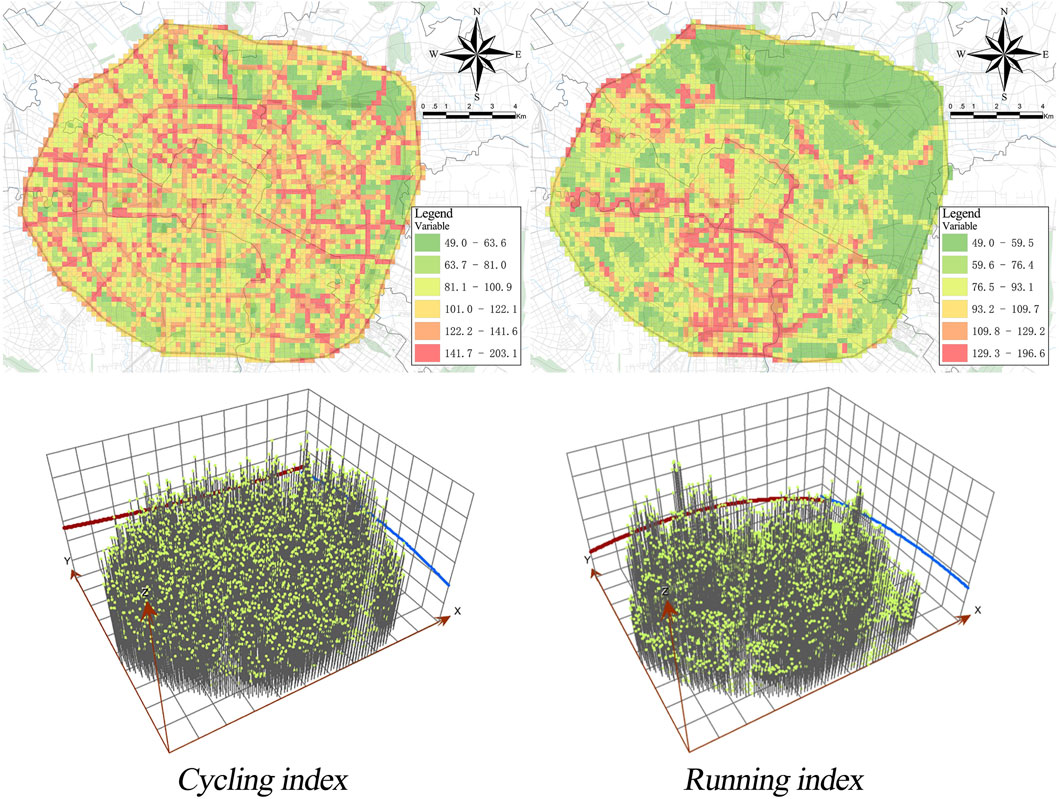
FIGURE 4. Spatial distribution of the cycling index and running index from Strava data.
Street view data
The street-view map records the 360°streetscape provided by the Baidu map (Li et al., 2022). It simulates human eye-level vision and converts the landscape environment felt by them from planar digital images to three-dimensional images, which restores the street space of human-level travel. The street view data are collected by street visits from cars equipped with GPS systems and panoramic cameras, and four images will be collected for each street view point (i.e., divide 360°street view image of a street view point into 4 images according to 0–90°, 90–180°, 180–270°,270–360°). We collect Baidu map street view data of Chengdu mostly in March 2020, which covers the whole study area. Figure 5 shows the distribution of these 11622 street view data points.
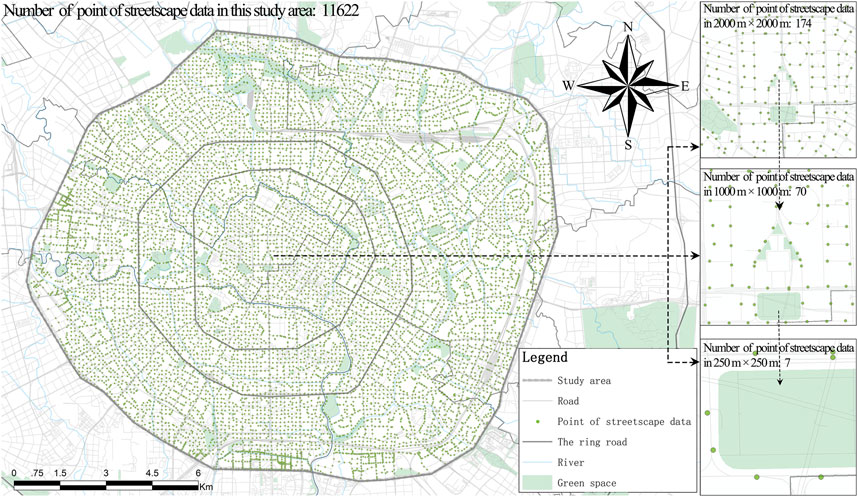
FIGURE 5. Distribution of 11622 points of street view data.
Currently, numerous studies based on street view data use semantic segmentation techniques (a deep learning technique based on the fully Convolutional Neural Network (CNN)) (Ewing and Handy, 2009; Yin and Wang, 2016; Nagata et al., 2020). After the operation of image pixels as required, it extracts specific streetscape attributes (e.g., green view index, sky view index, and road view index). In this study, these streetscape attribute variables representing streetscape attributes are mainly selected. Figure 6 reveals the calculation method of these variables based on CNN.
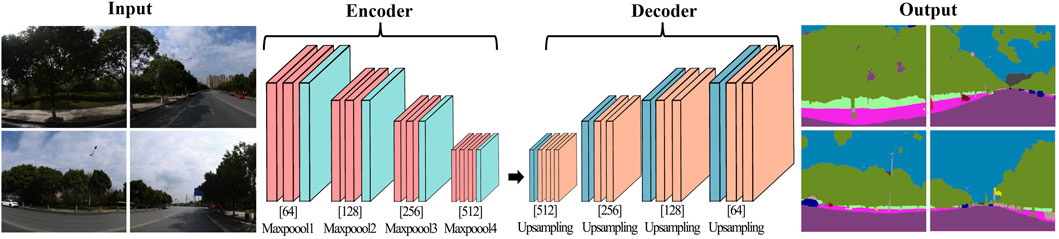
FIGURE 6. Illustration of semantic segmentation techniques-based streetscape attribute variables calculation method.
Among them, the green view index and sky view index respectively refer to the proportion of greenery pixels and sky pixels in the 360°street-view map. These proportions represent the green landscape or sky landscape felt by pedestrians during street travel, which reflects the corresponding streetscape level. Moreover, the road view index refers to the proportion of road pixels in the 360°street-view map, which represents the road space for pedestrian travel and reflects the road construction level. The specific calculation methods of the three variables above are as follows, where i is the i-th images of this streetscape point.
Variables
Table 2 describes the statistics of the independent and dependent variables. We use the cycling index and running index as the dependent variables and select 10 independent variables composed of control and explanatory variables. The control variables are underpinned by the traditionally built environment factors, and the explanatory variables consist of streetscape factors from the human-scale view.

TABLE 2. Descriptive statistics of the variables.
To scrutinize these independent variables, we use Python to crawl POI data and river data from the Baidu map and then connect them to the 250 m × 250 m grid using the spatial connection tool in GIS. Thereafter, we calculate the land-use mix, the number of companies, and the river line length in the grid. Moreover, we crawl the building outline, building height, and the spatial position of the bus station from the Gaode map, and count the number of bus stations, road density, and FAR in the grid. Finally, we utilize semantic segmentation techniques to calculate the streetscape attribute variables (green view index, sky view index, and road view index) for each street view data point. Then, we calculate the average value of the streetscape attribute variables for all street view data points in each raster, which is taken as the value of the streetscape variables corresponding to this raster.
Result
First, we analyze the pair-wise correlation of all independent variables to detect the multicollinearity of variables. Figure 7 reveals that the variables have no multicollinearity (correlation <0.7). Then, we use the OLS models to scrutinize the global relationship between the variables and the running index and cycling index. Table 3 presents the OLS model results. The results indicate that most of the variables are significantly correlated with the running index and cycling index at the 0.1% level.
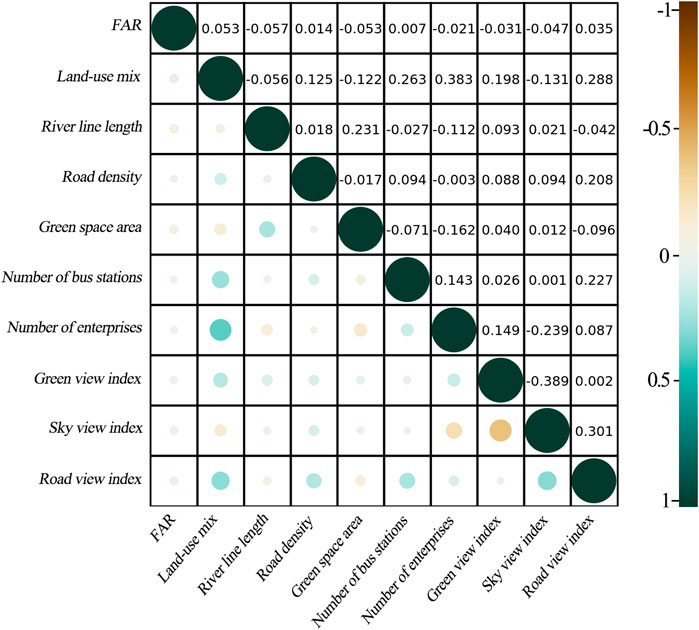
FIGURE 7. Pair-wise Correlation analysis results.
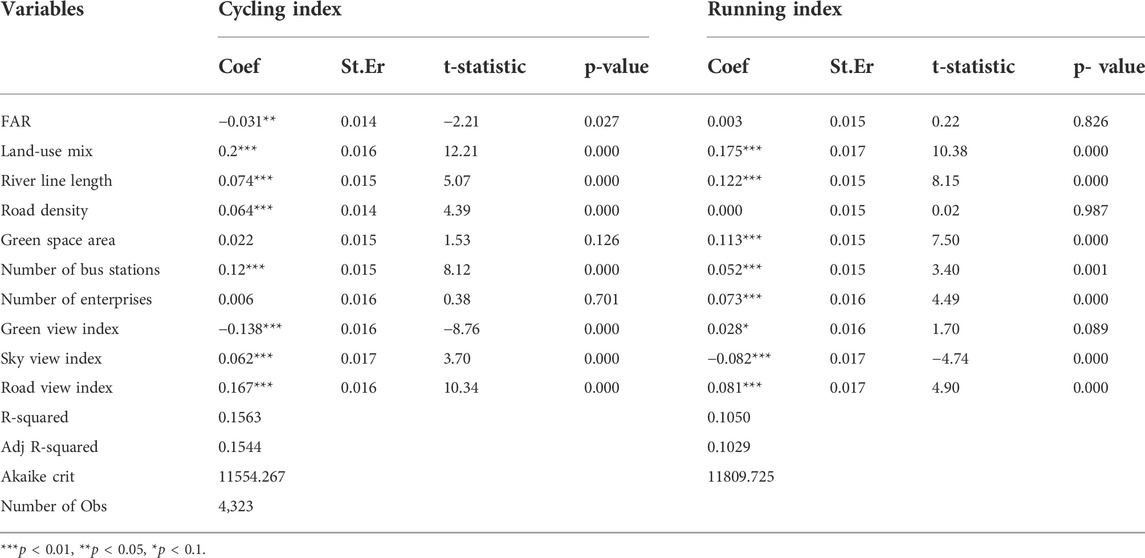
TABLE 3. OLS modeling results.
OLS modeling results
The following describes the control variables in the running OLS model and the cycling OLS model. The OLS model results of the cycling index demonstrate that FAR, land-use mix, river line length, road density, and the number of bus stations are significantly related to the cycling index (most variables’ p-value < 0.01). However, green space areas and the number of enterprises are insignificantly related to it. Remarkably, only FAR is negatively associated with the cycling index, and the other control variables are positively associated with the cycling index (Duncan et al., 2010). Moreover, the OLS model results of the running index indicate that land-use mix, river line length, green space area, number of bus stations, and number of enterprises are significantly related to the running index (p-value < 0.01). However, FAR and road density are insignificantly related to the running index. Incredibly, all of the control variables positively impact the running index.
It is most important to describe the explanatory variables. The results of both OLS models are shown that the green view index, sky view index, and road view index are significantly correlated with the cycling index and running index, and it is consistent with the results of previous research (Lu et al., 2018b; Lu et al., 2019; Du and Huang, 2022). Specifically, the green view index is significantly related to the running index at the 1% level, and the other variables are significantly related to the cycling and running index at the 0.1% level. The abovementioned results show that explanatory variables play a prominent role in the PA of cycling and running, which enhances the rationality of this study. Interestingly, the different explanatory variables have a different impact on the running index and cycling index. The green view index has a negative impact on the cycling index and a positive impact on the running index. The sky view index is positively associated with the cycling index and negatively associated with the running index. The road view index promotes the cycling index and the running index.
Thereafter, we use Moran’s index to analyze the spatial autocorrelation of the residual of the OLS models. The results indicate that the Moran’s index values of the running index and cycling index are 0.831 and 0.894, the Z-values are 234.773 and 259.446, and the p-value is less than 0.1% (Figure 8). It shows that variables have a high spatial autocorrelation, but the OLS model overlooks the spatially-varying relationships of variables. Thus, the GWR model needs to be used to scrutinize the spatial heterogeneity in the impact of the built environment on PA.
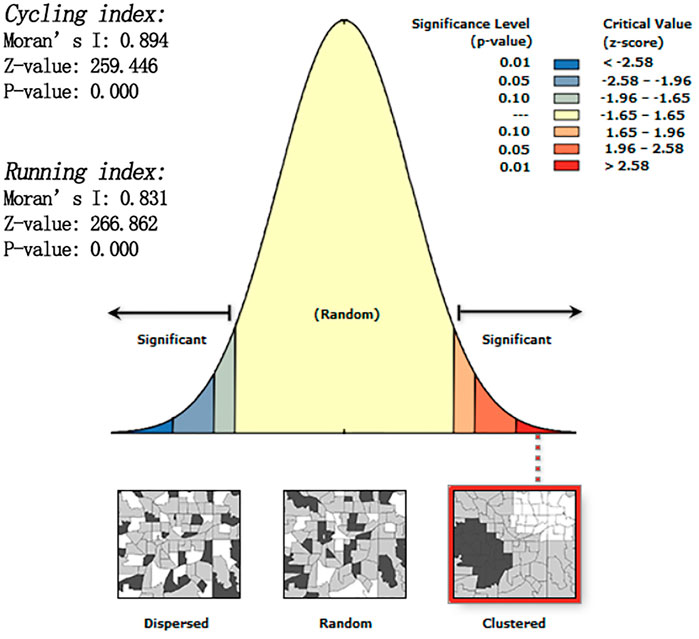
FIGURE 8. Moran’s index results.
GWR modeling results
On the basis of the abovementioned analysis, we eliminate insignificant variables in the OLS models and use the GWR software (4.0) to analyze the impact of surplus variables on the cycling and running index. Table 4 presents the GWR modeling results. The results of the comparison between the OLS models and the GWR models show that the Adj R-squared of the GWR model is higher than the OLS models and the AIC index of the GWR models is lower than the OLS models. In a word, the GWR models outperform the OLS models in terms of the goodness-of-fit, and this result agrees with our expectations.
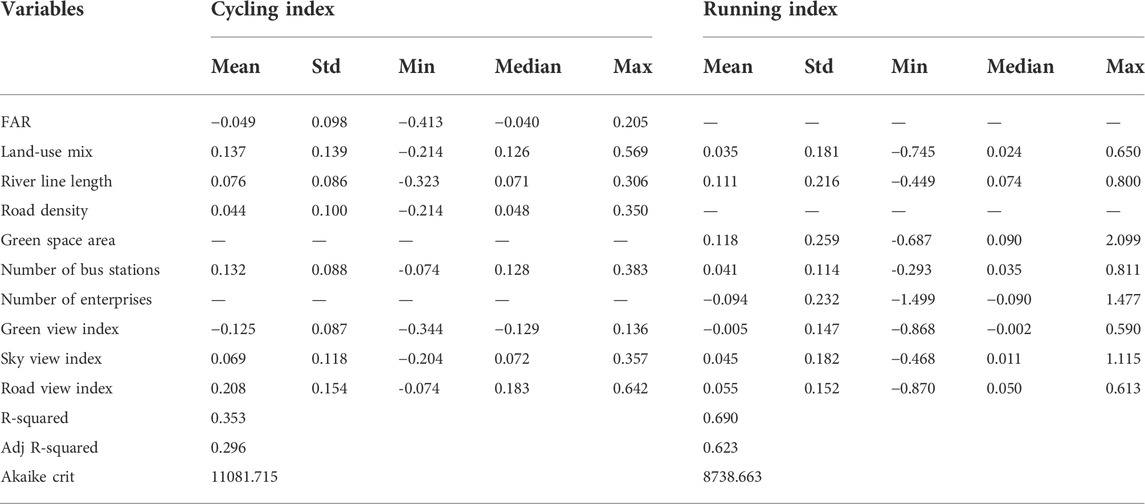
TABLE 4. GWR modeling results.
The evidence-based result of both GWR modeling indicates that the built environment has spatial heterogeneity in the impact of the built environment on PA. In other words, all variables have a different effect (i.e., positive or negative) on the cycling and running index at different spatial locations.
Figure 9 shows the spatial distribution of the coefficient of FAR, road density, green space area, and the number of enterprises in the GWR models using GIS tools. First, a negative correlation is found between FAR and the cycling index, which is mainly distributed in the urban center. Notably, in some areas near the Third Ring Road, the FAR is a positive impact on the cycling index. In addition, road density promotes the cycling index in the west, northeast, and southeast of the city, but it harms the cycling index in the east-central region of the city. Then, the green space area stimulates the running index in the central, eastern, and southwestern parts of the city. However, it inhibits the running index in a few parts of the city, such as the south of the city. Moreover, the number of enterprises restrains the running index in most areas of the third Ring Road and has a positive effect in only a few areas.
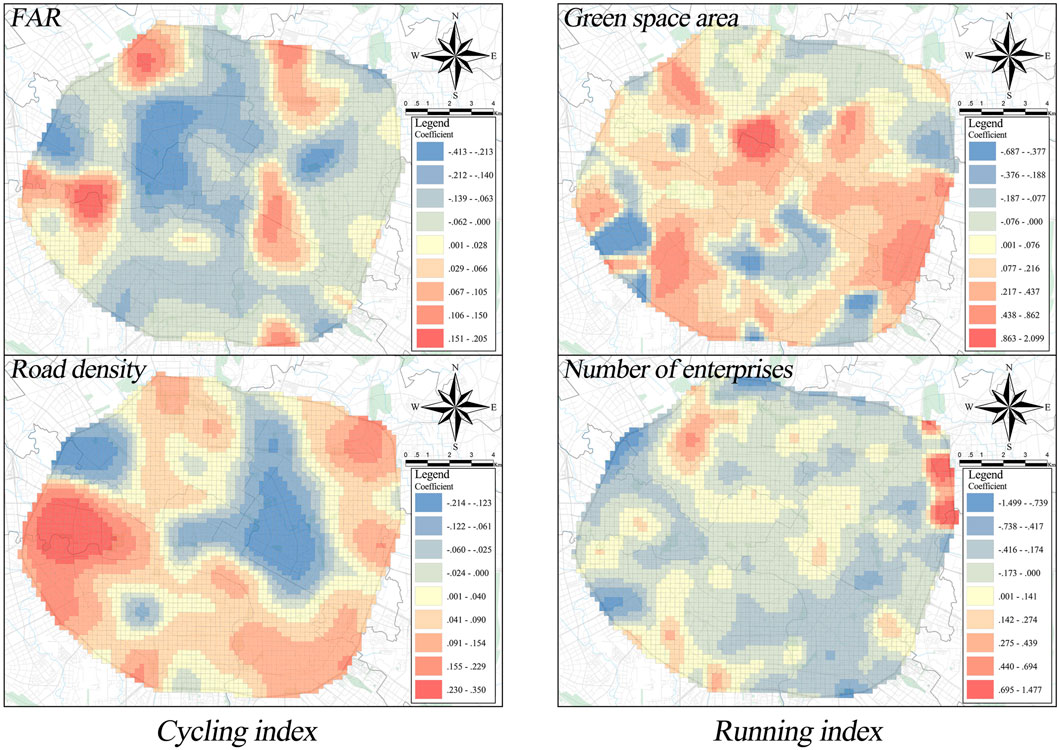
FIGURE 9. The spatial distribution of the coefficient of FAR, road density, green space. Area, and the number of enterprises in the GWR models.
Figure 10 shows the spatial distribution of the coefficient of river line length, number of bus stations, and land-use mix in the GWR models using GIS tools. River line length is positively correlated with the running index in the central and eastern parts of the city, but it is negatively correlated with the running index in the northwest, south, and eastern edge of the city. Most areas of the river line length are positively correlated with the cycling index, but the river line length in some regions harms the cycling index. Moreover, most bus stations have a positive impact on the cycling index, and only a few areas in the northwest, southwest, and northeast of the city have a negative effect. However, it promotes the running index, especially in urban centers such as Tianfu square, and harms it in the northwest and northeast of the city. Furthermore, land-use mix stimulates the running index in the urban center (Duncan et al., 2010), especially Chunxi Road and other urban consumption centers. It inhibits the running index in the areas under reconstruction in the south and the old town in the northwest of the city. By contrast, land-use mix stimulates the cycling index in most regions and restrains it only in central and southern cities.
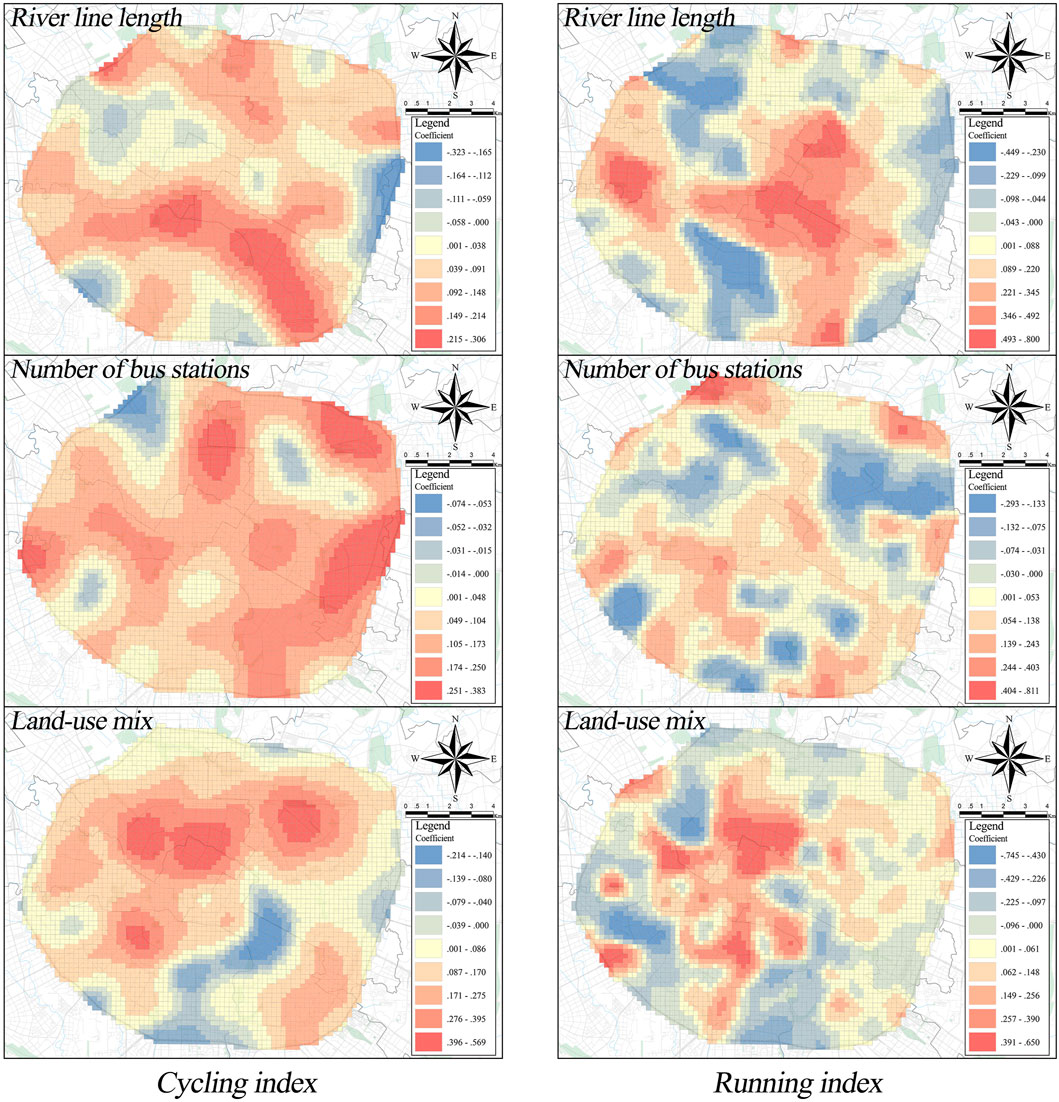
FIGURE 10. The spatial distribution of the coefficient of river line length, the number of bus stations, and land-use mix in the GWR models.
Figure 11 shows the spatial distribution of the coefficient of green view index, sky view index, and road view index in the GWR models using GIS tools. First, the green view index harms the cycling index in most regions. It promotes the cycling index in only a few areas, such as the urban center and some point areas in the eastern part of the city. Remarkably, it facilitates running index in the central, southern, and southeastern parts of the city, while it restrains running index in the northwestern and south-central parts of the city. Second, the sky view index is positively correlated with the cycling index in the central, western, and southern areas of the city. It is negatively correlated with the cycling index in the north and northeast of the city. Meanwhile, it stimulates the running index in the western and central areas of the city and harms the running index in most areas in the eastern part of the city. Third, the road view index has a positive impact on the cycling index except for a few areas. It is also positively correlated with the running index in the eastern and southwestern parts of the city.
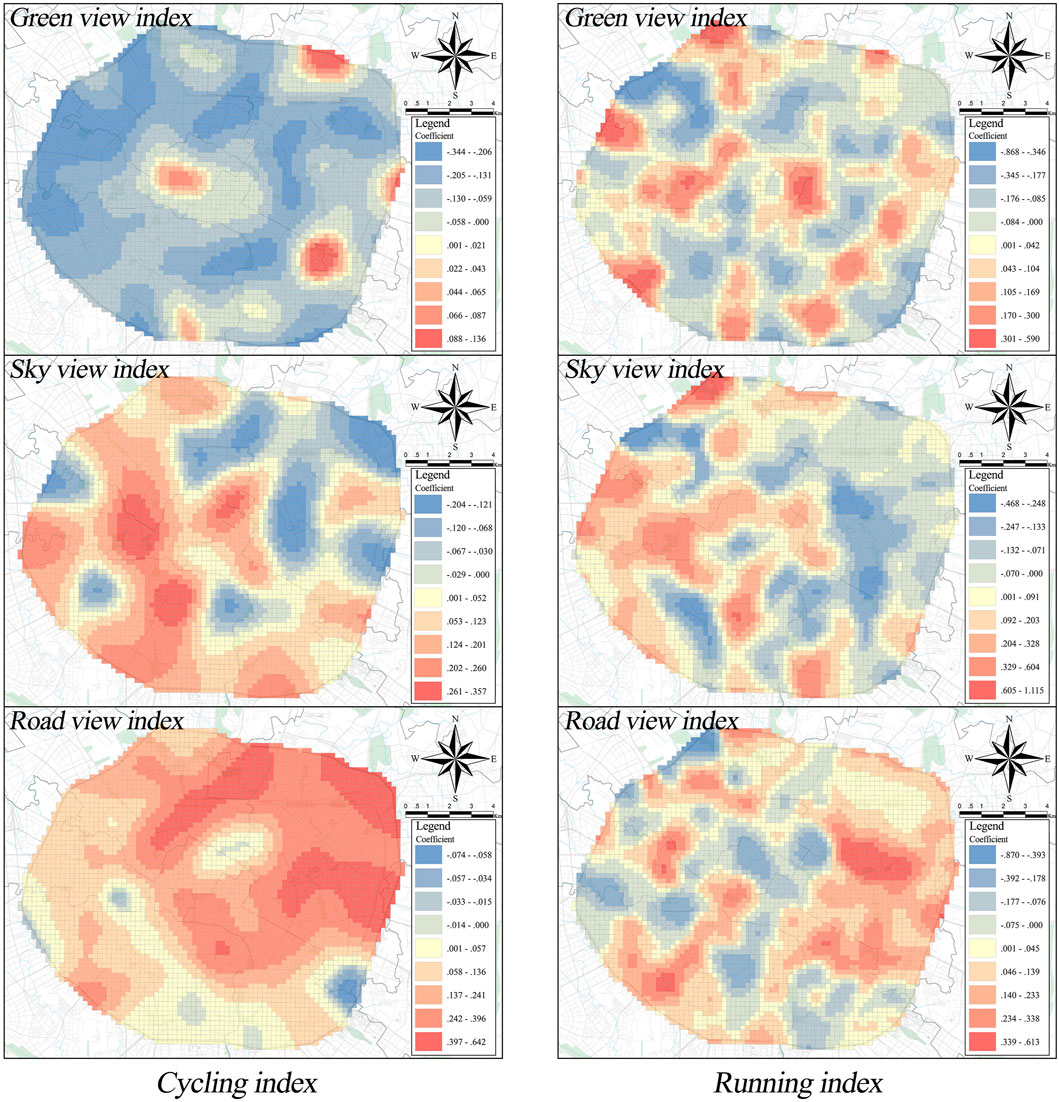
FIGURE 11. The spatial distribution of the coefficient of green view index, sky view index, and road view index in the GWR models.
These results indicate that different built environment variables have spatially varying influences on the cycling and running index, especially the green view index, sky view index, and road view index. Therefore, compared with the global analysis results of the OLS model, the GWR model can more accurately identify the positive or negative effects of the built environment on PA in different spatial locations. Thus, it will provide support for policymakers and urban planners to put forward more accurate recommendations. This aspect is the practical significance of this study.
Discussion
Control variables in the cycling index GWR model
First, in terms of FAR, it inhibits the PA of cycling in most areas, such as Fuqing and Nijiaqiao. This contradicts the results of previous studies. Compared to the living habits of residents in Europe and the United States, people have different feelings in Chengdu about high-density development. The reason is that residents in Chengdu have a laid-back attitude to life, but a high FAR produces a relatively crowded environment, which leads to a decrease in cycling activities.
Second, the land-use mix greatly promotes the generation of cycling activities in the northern and central areas of the city. This finding may be ascribed to the diverse characteristics of these areas, such as commercial, public service, residential and other facilities. This conclusion is supported by New Urbanism, i.e., the land-use mix stimulates the physical activities of residents (Newman and Kenworthy, 1996). However, in areas such as Tongzilin and Sichuan University, there are obstacles to the PA of cycling, due to the closed space and inability to communicate with the outside world.
Third, existing studies have shown that road density has a positive correlation with cycling activities. However, our finding diverges from this conclusion. While road density facilitates cycling activities in most areas, it has a dampening effect in some areas. The evidence-based result indicates that there are serious problems of mixed traffic between motor vehicles and non-motor vehicles and low road quality in some old towns of Chengdu (e.g., Xinhong community and Jianshe Road). These issues may lead to traffic accidents and thus reduce the enthusiasm for cycling activities.
Fourth, the river line length in some areas hinders cycling activities, such as Yipintianxia and Taipingyuan. We think this situation is due to the absence of suitable cycling paths built along the river, while the bicycle paths in Chengdu are mainly distributed along the greenway.
Fifth, bus stations in most regions have a positive impact on the PA of cycling, such as Wannianchang and Qingyanggong, which contradicts the conclusion of Zhao (2013) and Salvo et al. (2014). This difference may be related to the widespread use of shared bikes in China. About 1.85 million rides are taken on shared bikes a day in Chengdu, according to the Regulations on Operation and Service of The City’s Internet Bike Rental Industry. During work, weekends, or holidays, residents usually ride shared bikes to reach their travel destinations after taking the bus.
Control variables in the running index GWR model
First, many studies have revealed from a global perspective that land use mixing either only promotes or inhibits running activities (Handy et al., 2002; Troped et al., 2010; Lu et al., 2018a). However, unlike the above studies, we found that those have mixed, that is, positive and negative, both impacts at different spatial locations. Although the areas with a high land-use mix have diversified facilities, the facilities and surrounding environment may be polarized due to the government’s different governance policy, old-fashioned design, and loopholes in maintenance policies. These factors have mixed impacts on running activities.
Second, river line length can significantly promote the PA of running in most areas, which is consistent with (Ying et al., 2015). However, compared with other cities that have a relatively complete blue and green infrastructure, the Park City implemented by Chengdu is still under construction. As a result, the effect may be hindered in some areas with a poor running environment along the river, such as Yiguanmiao, Huazhaobi, and Shizishan.
Third, most green space areas stimulate running activities. However, some areas with rich green space resources harm running activities, such as closed universities and large public activity places (i.e., Sichuan University and Sichuan Gymnasium), which block the connection between green space and surrounding residents. This partially differs from the findings of many researchers who found that green space area facilitates running activities (Wang et al., 2019). This is because most of them use global analysis models to explore and lack local analysis. In contrast, the GWR model can more accurately identify the relationship between the effects of spatially varying. It makes this study more reasonable.
Fourth, compared to the conclusion of Sarmiento et al. (2010), there is a negative correlation between bus stations and running activities. This study found a mixed effect between the two, which may be related to the living habits of Chinese residents. They often use running as a way to connect with buses, and it improves the enthusiasm for running activities.
Fifth, contrary to the results of some studies that enterprises promote running activities (Yang et al., 2022b), in most areas, such as Shuhan Road and Balizhuang, enterprises harm running activities. It may be attributed to the job-housing imbalances among Chengdu residents. The long commutes caused by this imbalance cause difficulty for residents to reach the office directly on foot. As a result, they generally choose some other means of transportation.
Explanatory variables in the cycling index GWR model
First, the green view index generally restrains the PA of cycling. But previous studies have shown that the green view index plays an important role in increasing residents’ cycling activities (Lu et al., 2019). We believe that this difference is related to the characteristics of each study area. Compared to some other studies, a large number of old towns exist in the Third Ring Road of Chengdu. It has a high green view index but blocks the view and sunlight, thus leading to an unsuitable cycling environment. In addition, the green view index also stimulates cycling activities in some areas (e. g., Kuanzhaixiangzi Alleys and Chengdu Bus terminal). Through the field survey of positive correlation areas, we find that the level of street greenery in these areas is too low, which may mean that basic green plants also are required to create a comfortable cycling environment. In other words, if the standard of basic street greenery is met, then a further increase in the green view index will hinder cycling activities.
Second, the sky view index in most areas has a positive correlation with the PA of cycling. This finding resonates with conclusions in color psychology that blue is thought to be associated with comfort and security, giving people a sense of safety (Wexner, 1954; Ballast, 2002). The sky view index has to do with the need for broad vision and sun exposure for cycling, which can make cyclists feel free, comfortable, and secure. However, we also find that some areas are obstructing cycling activities, especially in the north and northeast of the city (e.g., North Railway Station and Jianshe Road). Through specific investigation and analysis, we discover that these areas belong to the area to be demolished. There are problems such as empty streets, dilapidated facades, and a poor overall environment, thus hindering cycling activities.
Third, the road view index stimulates the PA of cycling in most areas. This may be because the calculation using the semantic segmentation techniques can only contain all the paths (including bicycle paths) in the area in the road view index, which leads to a significant positive correlation between the road view index and cycling activities. However, a few areas restrain cycling activities with unequal distribution of road rights. In other words, the unreasonable allocation of road rights and low sharing squeeze the cycling space (Lubitow and Miller, 2013; Colville-Andersen, 2018). These areas are mainly located near Daguan Station and East Chengdu Railway Station. A field survey of the streets in this area reveals that large-scale construction is taking place in it, and the road is not demarcated for bicycle paths. This makes it impossible for people to cycle safely and also suffer from noise and construction waste in this process.
On the whole, the GWR model results of the cycling index reveal the spatial mismatch problem in the Third Ring Road of Chengdu. This is highly correlated with the rapid development of new urban areas leading to neglect in the management of old towns. Chengdu has been expanding outward at a high rate of speed for the past 10 years but has overlooked the renewal and maintenance of the old towns. We discover the areas where the green view index, sky view index, and road view index restrain cycling activities are mainly concentrated in the north and northeast. These are mostly PA-unfriendly areas to be demolished or old urban areas, such as North Railway Station and Chengdu Bus Terminal.
Explanatory variables in the running index GWR model
First, the results indicate that the green view index is positively correlated with the PA of running in some areas (e.g., Dufu Thatched Cottage, Wukuaishi), and this conclusion resonates with the findings of Koo et al. (2022) and Du and Huang (2022). The reason is that the tree shade can give people a sense of security and thus stimulate the resident’ travel. However, although green is generally regarded as an important indicator for arousing activities (Kaya and Epps, 2004; Bell et al., 2008; Nagata et al., 2020), a different result is found in this study, in which the green view index inhibited running activities in other areas. A field survey of the negatively related areas (e.g., Chadianzi, Shuangqiao community, and Simaqiao community) reveals that these areas are PA-unfriendly old town areas. These areas have more greenery, but it lacks overall maintenance (e.g., trees grow indiscriminately without not being pruned). This situation results in the formation of street spaces in the area that is not suitable for running activities.
Second, the sky view index inhibits running activities in most areas, such as Wannianchang and Dongjiao Memory, and this result resonates with numerous studies (Ewing and Handy, 2009; Yin and Wang, 2016; Nagata et al., 2020). The reason may be that a higher sky view index results in stronger solar exposure and those open areas can be unsuitable for PA. On the contrary, in some areas, the sky view index promotes running activities, and we believe that it is seasonally and weather-related. Specifically, the Strava data were collected during the winter of 2021 in Chengdu. It had only 5 sunny days in December 2021 compared with the relatively long winter sunshine hours in major cities such as Beijing, New York, and Washington. Therefore, areas with a basic sky view index in Chengdu during lack of sunshine bring comfortable sun exposure on sunny days in winter, which stimulates running activities among residents.
Third, on the whole, the road view index is a positive impact on the running index in most areas. In our opinion, the road view index represents the construction level of the street, and streets with a higher construction level will be equipped with more suitable walking paths. In addition, a field survey of negatively related areas (e.g., Wenshu Monastery and Huaxiba) reveals that these areas with a high road view index are designed by the car-oriented. But they ignore that urban design should pay more attention to people-oriented design and the equity of walking rights (Jacobs, 1961; Bevan et al., 2007). In general, the space allocation for walking, cycling, and driving in these areas is not reasonable, and the design method of street space is not well used to enhance the rights and interests of pedestrians. This situation, as well as the lack of management of roadside facilities in the old town, inhibits running activities.
Overall, the running index of the GWR model result reveals a similar spatial mismatch problem as the results of the cycling index of it. We discover that most of the areas where the green view index, sky view index, and road view index restrain running activities are old towns or areas under construction, such as Shuangqiao Community, Shengxian Lake, Qianfang Road, and Lijiatuo.
Conclusion
Planning intervention is considered an effective way to solve urban public health issues. Optimizing the built environment through planning intervention can tremendously promote PA. Therefore, it is necessary to scrutinize the relationship between the built environment and PA to inform the public health-oriented urban planning process. However, previous studies over-rely on data derived from questionnaires and surveys, which suffer from small sample sizes. And researchers focus predominantly on the traditionally built environment factors and seldomly measure them from the human-scale view. Meanwhile, existing studies neglect the spatial heterogeneity in the impact of the built environment on PA. To address these gaps, we use the novel PA crowdsourced data, i.e., the Strava, to decipher the spatially-varying relationships between the built environment and PA. Specifically, we examine how human-scale streetscape attributes affect PA across different areas after controlling for traditionally built environment variables. The empirical findings are conducive to providing guidance for optimizing the urban built environment, promoting PA of residents, and thus addressing the urban public health issues.
The core findings of this study are as follows. First, most built environment factors have spatial heterogeneity, and the GWR model can help better explain the spatial heterogeneity in the impacts of the built environment on PA. In other words, control variables (e.g., land-use mix, river line length, and road density) and explanatory variables (e.g., green view index, sky view index, and road view index) have wide and mixed impacts on PA across different areas.
More importantly, this study focuses on the impacts of human-scale streetscape factors (explanatory variables) and draws the following findings. 1) In general, the green view index restrains cycling activities. But in the area with a low green view index, appropriately increasing the green view index will promote cycling activities. By contrast, it stimulates running activities. However, there are exceptions in some areas of the old town, of which the street space has low-level streetscape greenery and lacks renewal and maintenance. 2) The sky view index is positively correlated with cycling activities. A high sky view index represents a broad vision for cycling, which improves safety. In addition, the sky view index has mixed impacts on running activities. 3) The road view index stimulates cycling and running activities, given a high road view index means a higher level of road construction. However, it restrains PA in the old towns dominated by cars and slated for demolition. According to the above, we identify the spatial mismatch issue in the study area. The sky view index and road view index in the north and northeast of the city, in which the demolished old towns locate, hinder cycling activities. Meanwhile, most of the areas with negative impacts of human-scale streetscape factors on running activities belong to old towns or areas under urban construction (e.g., Shuangqiao Community, Shengxian Lake, Qianfeng Road, and Lijiatuo).
Therefore, according to the above findings, this study puts forward policy suggestions and planning intervention measures as follows.
First, while building a Healthy City and Park City, the government should vigorously develop blue and green infrastructure and rationally allocate urban green space and water landscape. At the same time, the greenways (e.g., cycling paths and walking paths) of the riverside area and the green space system should be ameliorated to promote the PA of residents and improve their physical health.
Secondly, for the old town with a high land-use mix but unfriendly to PA (e.g., Chadianzi and Tongzilin), the planning agencies should promote the update of the active travel facilities and the fine-scale design to shape the active travel-friendly community.
Third, street space is the major place for the PA of residents. Planning agencies should put forward active intervention measures for the built environment based on the actual situation of community streets. Above all, for the old town with high demand for running activities, the level of street greening should be promoted, and more walkable green plants should be configured to improve the comfort and interest of residents. Moreover, in communities with more cycling activities, relevant administrative departments should timely repair street landscapes, provide enough broad vision for cyclists, and promote the safety of cycling activities.
Fourthly, in terms of road and public transport construction, planning agencies should optimize street space design, appropriately increase road density, and rationally allocate bus facilities according to the location and current characteristics of the community. In the old town with a high road view index but non-suitable for PA, the reasonable distribution and moderate sharing of the three road rights of walking, cycling, and driving, should be strengthened. For instance, the cross-section design of street space is necessary to realize the benign adaptation of street space and residents’ activities. In addition, in communities with high demand for PA, relevant planning departments should build more branch roads and walking roads to perfect the basic road network structure to improve the density and accessibility of the community road networks. This contributes to creating a continuous and complete environment for active travel.
However, this study also has some limitations. First, due to difficulties in data acquisition, built environment factors such as bike paths and sidewalks cannot be included in this study. Secondly, explanatory variables measured by semantic segmentation techniques at the human scale view can be further explored, such as aspect ratio and sidewalk index. Finally, the explanatory variables measure streetscape attributes from the objective perspective. However, just like Kang et al. (2020), a questionnaire survey can be appropriately conducted to analyze the subjective perception of people on different streetscape maps. And then, more reasonable streetscape variables can be obtained by combining subjective perception with objective perception.
Data availability statement
The raw data supporting the conclusions of this article will be made available by the authors, without undue reservation.
Author contributions
PiL: conceptualization, funding acquisition, supervision, and writing—original draft. BY: conceptualization, funding acquisition, methodology, and writing—review and editing. PeL: formal analysis and writing—review and editing. PpL: validation and writing—review and editing. All authors have read and agreed to the published version of the manuscript.
Funding
This study was supported by the Key Program of the Center on Child Protection and Development, Sichuan (No. ETBH2021-ZD001), the Sichuan Science and Technology Program (No. 2022JDR0178), and the National Natural Science Foundation of China (No. 52278080).
Conflict of interest
The authors declare that the research was conducted in the absence of any commercial or financial relationships that could be construed as a potential conflict of interest.
Publisher’s note
All claims expressed in this article are solely those of the authors and do not necessarily represent those of their affiliated organizations, or those of the publisher, the editors and the reviewers. Any product that may be evaluated in this article, or claim that may be made by its manufacturer, is not guaranteed or endorsed by the publisher.
References
An, R., Shen, J., Yang, Q., and Yang, Y. (2019). Impact of built environment on physical activity and obesity among children and adolescents in China: A narrative systematic review. J. sport health Sci. 8 (2), 153–169. doi:10.1016/j.jshs.2018.11.003
Bauman, A. E., Reis, R. S., Sallis, J. F., Wells, J. C., Loos, R. J. F., and Martin, B. W. (2012). Correlates of physical activity: Why are some people physically active and others not? Lancet 380 (9838), 258–271. doi:10.1016/s0140-6736(12)60735-1
Beaglehole, R., Bonita, R., Horton, R., Adams, C., Alleyne, G., Asaria, P., et al. (2011). Priority actions for the non-communicable disease crisis. lancet 377 (9775), 1438–1447. doi:10.1016/s0140-6736(11)60393-0
Bell, J. F., Wilson, J. S., and Liu, G. C. (2008). Neighborhood greenness and 2-year changes in body mass index of children and youth. Am. J. Prev. Med. 35 (6), 547–553. doi:10.1016/j.amepre.2008.07.006
Bevan, T. A., Sklenar, O., McKenzie, J. A., and Derry, W. E. (2007). “Sustainable urban street design and assessment,” in 3rd urban street symposium: Citeseer).
Biddle, S. J., and Asare, M. (2011). Physical activity and mental health in children and adolescents: A review of reviews. Br. J. Sports Med. 45 (11), 886–895. doi:10.1136/bjsports-2011-090185
Brunsdon, C., Fotheringham, A. S., and Charlton, M. E. (1996). Geographically weighted regression: A method for exploring spatial nonstationarity. Geogr. Anal. 28 (4), 281–298. doi:10.1111/j.1538-4632.1996.tb00936.x
Chen, S., Bao, Z., and Lou, V. (2022a). Assessing the impact of the built environment on healthy aging: A gender-oriented Hong Kong study. Environ. Impact Assess. Rev. 95, 106812. doi:10.1016/j.eiar.2022.106812
Chen, S., Wang, T., Bao, Z., and Lou, V. (2022b). A path analysis of the effect of neighborhood built environment on public health of older adults: A Hong Kong study. Front. Public Health 10, 861836. doi:10.3389/fpubh.2022.861836
Colville-Andersen, M. (2018). Copenhagenize: The definitive guide to global bicycle urbanism. Island Press.
Corburn, J. (2004). Confronting the challenges in reconnecting urban planning and public health. Am. J. Public Health 94 (4), 541–546. doi:10.2105/ajph.94.4.541
Ding, D., and Gebel, K. (2012). Built environment, physical activity, and obesity: What have we learned from reviewing the literature? Health Place 18 (1), 100–105. doi:10.1016/j.healthplace.2011.08.021
Du, Y., and Huang, W. (2022). Evaluation of street space quality using streetscape data: Perspective from recreational physical activity of the elderly. ISPRS Int. J. Geoinf. 11 (4), 241. doi:10.3390/ijgi11040241
Duncan, M. J., Winkler, E., Sugiyama, T., Cerin, E., Dutoit, L., Leslie, E., et al. (2010). Relationships of land use mix with walking for transport: Do land uses and geographical scale matter? J. Urban Health 87 (5), 782–795. doi:10.1007/s11524-010-9488-7
Ewing, R., and Cervero, R. (2001). Travel and the built environment: A synthesis. Transp. Res. Rec. 1780 (1), 87–114. doi:10.3141/1780-10
Ewing, R., and Handy, S. (2009). Measuring the unmeasurable: Urban design qualities related to walkability. J. Urban Des. 14 (1), 65–84. doi:10.1080/13574800802451155
Forsyth, A., Michael Oakes, J., Lee, B., and Schmitz, K. H. (2009). The built environment, walking, and physical activity: Is the environment more important to some people than others? Transp. Res. Part D Transp. Environ. 14 (1), 42–49. doi:10.1016/j.trd.2008.10.003
Handy, S. L., Boarnet, M. G., Ewing, R., and Killingsworth, R. E. (2002). How the built environment affects physical activity: Views from urban planning. Am. J. Prev. Med. 23 (2), 64–73. doi:10.1016/s0749-3797(02)00475-0
Haskell, W. L., Lee, I.-M., Pate, R. R., Powell, K. E., Blair, S. N., Franklin, B. A., et al. (2007). Physical activity and public health: Updated recommendation for adults from the American college of sports medicine and the American heart association. Circulation 116 (9), 1081–1093. doi:10.1161/CIRCULATIONAHA.107.185649
Heinrich, K. M., Lee, R. E., Suminski, R. R., Regan, G. R., Reese-Smith, J. Y., Howard, H. H., et al. (2007). Associations between the built environment and physical activity in public housing residents. Int. J. Behav. Nutr. Phys. Act. 4 (1), 56–59. doi:10.1186/1479-5868-4-56
Kang, Y., Zhang, F., Gao, S., Lin, H., and Liu, Y. (2020). A review of urban physical environment sensing using street view imagery in public health studies. Ann. GIS 26 (3), 261–275. doi:10.1080/19475683.2020.1791954
Kaya, N., and Epps, H. H. (2004). Relationship between color and emotion: A study of college students. Coll. student J. 38 (3), 396
Koo, B. W., Guhathakurta, S., and Botchwey, N. (2022). How are neighborhood and street-level walkability factors associated with walking behaviors? A big data approach using street view images. Environ. Behav. 54 (1), 211–241. doi:10.1177/00139165211014609
Koohsari, M. J., Badland, H., and Giles-Corti, B. (2013). Re) Designing the built environment to support physical activity: Bringing public health back into urban design and planning. Cities 35, 294–298. doi:10.1016/j.cities.2013.07.001
Li, S., Ma, S., Tong, D., Jia, Z., Li, P., and Long, Y. (2022). Associations between the quality of street space and the attributes of the built environment using large volumes of street view pictures. Environ. Plan. B Urban Anal. City Sci. 49 (4), 1197–1211. doi:10.1177/23998083211056341
Liu, Q., Zhao, P., Xiao, Y., Zhou, X., and Yang, J. (2022). Walking accessibility to the bus stop: Does it affect residential rents? The case of jinan, China. Land 11 (6), 860. doi:10.3390/land11060860
Lu, Y., Chen, L., Yang, Y., and Gou, Z. (2018a). The association of built environment and physical activity in older adults: Using a citywide public housing scheme to reduce residential self-selection bias. Int. J. Environ. Res. Public Health 15 (9), 1973. doi:10.3390/ijerph15091973
Lu, Y., Sarkar, C., and Xiao, Y. (2018b). The effect of street-level greenery on walking behavior: Evidence from Hong Kong. Soc. Sci. Med. 208, 41–49. doi:10.1016/j.socscimed.2018.05.022
Lu, Y., Yang, Y., Sun, G., and Gou, Z. (2019). Associations between overhead-view and eye-level urban greenness and cycling behaviors. Cities 88, 10–18. doi:10.1016/j.cities.2019.01.003
Lubitow, A., and Miller, T. R. (2013). Contesting sustainability: Bikes, race, and politics in Portlandia. Environ. Justice 6 (4), 121–126. doi:10.1089/env.2013.0018
Ma, L., and Dill, J. (2015). Associations between the objective and perceived built environment and bicycling for transportation. J. Transp. Health 2 (2), 248–255. doi:10.1016/j.jth.2015.03.002
Mertens, L., Compernolle, S., Deforche, B., Mackenbach, J. D., Lakerveld, J., Brug, J., et al. (2017). Built environmental correlates of cycling for transport across Europe. Health Place 44, 35–42. doi:10.1016/j.healthplace.2017.01.007
Nagata, S., Nakaya, T., Hanibuchi, T., Amagasa, S., Kikuchi, H., and Inoue, S. (2020). Objective scoring of streetscape walkability related to leisure walking: Statistical modeling approach with semantic segmentation of Google Street View images. Health. Place 66, 102428. doi:10.1016/j.healthplace.2020.102428
Newman, P. W., and Kenworthy, J. R. (1996). The land use—Transport connection: An overview. Land use policy 13 (1), 1–22. doi:10.1016/0264-8377(95)00027-5
Salvo, D., Reis, R. S., Stein, A. D., Rivera, J., Martorell, R., and Pratt, M. (2014). Characteristics of the built environment in relation to objectively measured physical activity among Mexican adults, 2011. Prev. Chronic Dis. 11, 140047. doi:10.5888/pcd11.140047
Sarmiento, O. L., Schmid, T. L., Parra, D. C., Díaz-del-Castillo, A., Gómez, L. F., Pratt, M., et al. (2010). Quality of life, physical activity, and built environment characteristics among colombian adults. J. Phys. Activity Health 7 (2), S181–S195. doi:10.1123/jpah.7.s2.s181
Tobler, W. R. (1970). A computer movie simulating urban growth in the Detroit region. Econ. Geogr. 46 (1), 234–240. doi:10.2307/143141
Troped, P. J., Wilson, J. S., Matthews, C. E., Cromley, E. K., and Melly, S. J. (2010). The built environment and location-based physical activity. Am. J. Prev. Med. 38 (4), 429–438. doi:10.1016/j.amepre.2009.12.032
Wang, H., Dai, X., Wu, J., Wu, X., and Nie, X. (2019). Influence of urban green open space on residents’ physical activity in China. BMC public health 19 (1), 1093–1112. doi:10.1186/s12889-019-7416-7
Wexner, L. B. (1954). The degree to which colors (hues) are associated with mood-tones. J. Appl. Psychol. 38 (6), 432–435. doi:10.1037/h0062181
Yang, H., Lu, X., Cherry, C., Liu, X., and Li, Y. (2017). Spatial variations in active mode trip volume at intersections: A local analysis utilizing geographically weighted regression. J. Transp. Geogr. 64, 184–194. doi:10.1016/j.jtrangeo.2017.09.007
Yang, J., Bao, Y., Zhang, Y., Li, X., and Ge, Q. (2018). Impact of accessibility on housing prices in Dalian city of China based on a geographically weighted regression model. Chin. Geogr. Sci. 28 (3), 505–515. doi:10.1007/s11769-018-0954-6
Yang, L., Ao, Y., Ke, J., Lu, Y., and Liang, Y. (2021a). To walk or not to walk? Examining non-linear effects of streetscape greenery on walking propensity of older adults. J. Transp. Geogr. 94, 103099. doi:10.1016/j.jtrangeo.2021.103099
Yang, L., Chau, K. W., Szeto, W. Y., Cui, X., and Wang, X. (2020a). Accessibility to transit, by transit, and property prices: Spatially varying relationships. Transp. Res. Part D Transp. Environ. 85, 102387. doi:10.1016/j.trd.2020.102387
Yang, L., Chu, X., Gou, Z., Yang, H., Lu, Y., and Huang, W. (2020b). Accessibility and proximity effects of bus rapid transit on housing prices: Heterogeneity across price quantiles and space. J. Transp. Geogr. 88, 102850. doi:10.1016/j.jtrangeo.2020.102850
Yang, L., Liu, J., Liang, Y., Lu, Y., and Yang, H. (2021b). Spatially varying effects of street greenery on walking time of older adults. ISPRS Int. J. Geoinf. 10 (9), 596. doi:10.3390/ijgi10090596
Yang, L., Tang, X., Yang, H., Meng, F., and Liu, J. (2022a). Using a system of equations to assess the determinants of the walking behavior of older adults. Trans. GIS 26 (4), 1339–1354. doi:10.1111/tgis.12916
Yang, L., Yu, B., Liang, P., Tang, X., and Li, J. (2022b). Crowdsourced data for physical activity-built environment research: Applying Strava data in Chengdu, China. Front. Public Health 10, 883177. doi:10.3389/fpubh.2022.883177
Yin, L., and Wang, Z. (2016). Measuring visual enclosure for street walkability: Using machine learning algorithms and Google Street View imagery. Appl. Geogr. 76, 147–153. doi:10.1016/j.apgeog.2016.09.024
Ying, Z., Ning, L. D., and Xin, L. (2015). Relationship between built environment, physical activity, adiposity, and health in adults aged 46-80 in Shanghai, China. J. Phys. Act. Health 12 (4), 569–578. doi:10.1123/jpah.2013-0126
Yu, H., Yang, J., Li, T., Jin, Y., and Sun, D. (2022a). Morphological and functional polycentric structure assessment of megacity: An integrated approach with spatial distribution and interaction. Sustain. Cities Soc. 80, 103800. doi:10.1016/j.scs.2022.103800
Yu, H., Yang, J., Sun, D., Li, T., and Liu, Y. (2022b). Spatial responses of ecosystem service value during the development of urban agglomerations. Land 11 (2), 165. doi:10.3390/land11020165
Zhang, Y., van Dijk, T., and Wagenaar, C. (2022). How the built environment promotes residents' physical activity: The importance of a holistic people-centered perspective. Int. J. Environ. Res. Public Health 19 (9), 5595. doi:10.3390/ijerph19095595
Zhao, P. (2013). The impact of the built environment on bicycle commuting: Evidence from beijing. Urban Stud. 51 (5), 1019–1037. doi:10.1177/0042098013494423
Keywords: physical activity, the built environment, the geographically weighted regression model, Strava, street view data, street greenery
Citation: Luo P, Yu B, Li P and Liang P (2022) Spatially varying impacts of the built environment on physical activity from a human-scale view: Using street view data. Front. Environ. Sci. 10:1021081. doi: 10.3389/fenvs.2022.1021081
Received: 17 August 2022; Accepted: 15 September 2022;
Published: 05 October 2022.
Edited by:
Jun Yang, Northeastern University, ChinaReviewed by:
Hao Zhu, Chengdu University of Technology, ChinaJingxiong Huang, Tsinghua University, China
Copyright © 2022 Luo, Yu, Li and Liang. This is an open-access article distributed under the terms of the Creative Commons Attribution License (CC BY). The use, distribution or reproduction in other forums is permitted, provided the original author(s) and the copyright owner(s) are credited and that the original publication in this journal is cited, in accordance with accepted academic practice. No use, distribution or reproduction is permitted which does not comply with these terms.
*Correspondence: Bingjie Yu, MjcwNDMzMDUxQHFxLmNvbQ==