 Lu Wang1†
 Jie Cui
 Wenfeng Gong
- 1Key Laboratory of Genetics and Germplasm Innovation of Tropical Special Forest Trees and Ornamental Plants, School of Forestry, Hainan University, Haikou, China
- 2Development Research Center of People’s Government of Sanya City, Sanya, China
Global primates are endangered, and thus it is important to know the determinants of primate population dynamics. It is widely reported that food plant diversity and nutrients are key determinants of many primate population dynamics. However, it remains unknown whether this can be applied to explain the population dynamics of Hainan gibbon (Nomascus hainanus), the world’s rarest primate. Recently, two individuals moved out from one family group (group C) and went across more than 9 km to form a new family group (group E), thus providing a perfect chance to quantify whether food plant diversity and nutrients can determine Hainan gibbon’s formation of the new family group. Here, we used a plot survey to compare the differences in food plant diversity (species richness and abundance) and nine leaf nutrient traits (leaf water content, total soluble sugar, vitamin C, calorific value, crude fat, crude protein, crude fiber, Zn, and Fe) between group C and group E. We found that plant diversity in group E was indeed higher (1.35–1.41 times) than that in group C. Moreover, in both groups C and E, food plant diversity within the home range was also higher (1.4–1.6 times) than that out of the home range. However, both cases could not be witnessed for all leaf nutrient traits. Results of principal component analysis revealed that food plant species between groups C and E were all significantly separated by food plant diversity but not leaf nutrient traits. Food plant species within and out of the home range of both groups C and E could also be significantly separated by food plant diversity, but not for all leaf nutrient traits. In conclusion, food plant diversity was one key determinant of the formation of a new family group of Hainan gibbons. Choosing high food plant diversity was also one key motivation for Hainan gibbons to select their home range.
Introduction
Globally, approximately 60% of primate species are at threat of extinction (Estrada et al., 2017). Among them, the critically endangered Hainan gibbon (Nomascus hainanus), the world’s rarest primate, should have a high priority of conservation (Zou et al., 2022). That is because it is restricted to a single population of c.35 individuals within a single protected area, Bawangling National Nature Reserve (BNNR) in Hainan, China (Fellowes et al., 2008; Turvey et al., 2015; Chan and Lo, 2020). Thus, it is essential to perform an effective protection strategy to prevent the early extinction of the Hainan gibbon (Liu et al., 2020). However, without knowing the key determinants of Hainan gibbon population dynamics, it is impossible to make an effective conservation strategy (Turvey et al., 2015; Zhang et al., 2020).
A number of factors (i.e., climate, predation, and stress or disease) can affect Hainan gibbon population dynamics (Turvey et al., 2015), but the effect of food has typically been considered of paramount importance (Hanya and Chapman, 2013; Bach et al., 2017) That is because food is a fundamentally important resource of animals, and the adequacy of food directly affects animal behavior, growth, reproduction, population structure, and population dynamics (Zhao et al., 2013). Quantifying food diversity and nutrients is also a prerequisite for exploring the interaction mechanism between animals and habitats (Clink et al., 2017; Deng and Zhou, 2018). Primates will select a home range with high food tree diversity and high calorie likely as an adaptation for fluctuating food environments (Hladik and Simmen, 1996; Jang et al., 2021). Importantly, this “high-calorie bias” in primates’ spatial memory seems to yield consequences for individual eating behavior in food-abundant settings (Arce et al., 2010; de Vries et al., 2022). It has been found that food abundance and distribution can directly determine primate ranging patterns and home range area (Milton and May 1976; Kim et al., 2011; Simmen et al., 2014; Ning et al., 2019). Thus knowledge of habitat and feeding ecology is essential for developing an effective conservation management plan for threatened primates (Fan et al., 2021).
In 2019, two individuals moved out from one family group (group C) and went across more than 9 km to form a new family group (group E) (Zou et al., 2022). As a result, quantifying the differences in food plant diversity and nutrients between group C and group E can provide a perfect chance to reveal 1) whether choosing high food plant diversity or/and nutrients was one key motivation for group C and E to select their home range and 2) whether the formation of a new family gibbon group (group E) is determined by food diversity or/and nutrients. We hypothesized that food plant diversity and nutrients determined both gibbon home range selection and formation of the new family group.
To test this hypothesis, we evaluated differences in food plant diversity and nutrients within and out of home range in groups C and E and between groups C and E by examining the following: 1) food plant diversity (richness and abundance) in 20 plots of 400 m2 each and 2) nine leaf nutrient traits (leaf water content, total soluble sugar, vitamin C, calorific value, crude fat, crude protein, crude fiber, Zn, and Fe) for all food plant species. Fruit is the favorite for Hainan gibbon, but in the dry season, Hainan gibbons use leaves as fallback food, and when they fed on a higher percentage of leaves, they decreased traveling time (Deng and Zhou, 2018). Based on the phenology of food plant species, it is impossible to provide fruits for all food plant species in 1 or 2 months (Du et al., 2020), which will make measuring fruit nutrients to perform fruit nutrient comparison impossible. Thus, we choose to measure leaf nutrient traits.
The selection of these nine leaf nutrient traits is based on their strong associations with primate population dynamics (growth, abundance, home range, and so on). For example, some gibbons (white-handed gibbons) primarily meet their water requirement by consuming immature leaves as they rarely drink from open water sources (Jildmalm et al., 2008). Maintaining the required calorie value is key for the survival of primates (Grether et al., 1992). Sugar makes food attractive because of its sweet taste and rich sensation (Huang et al., 2021). Since mature leaves have higher crude fiber content but lower crude protein than young leaves (Yeager, 1989), gibbons usually prefer to eat young leaves but not mature leaves. However, some primates, such as the Colobine monkey, prefer leaves with high crude fiber (Borah et al., 2021). Fat serves as an energy reserve of the animal body, and primates usually store surplus energy as fat in preparation for the impending period of food scarcity (Felton et al., 2009). Vitamin C is essential for growth, development, and tissue repair of animals through collagen synthesis (Lee et al., 2022), and primates will suffer from vitamin deficiency or multivitamin deficiency syndrome when they eat leaves with low vitamin C. Zinc determines daily functioning of the animal body, proper growth and regeneration of tissues, structure of some proteins, absorption of vitamins (vitamin A), and functioning of the immune system (Golub et al., 1995; Salachna et al., 2021). Iron is vital for transport of oxygen in the hemoglobin of red blood cells and in the myoglobin of muscles (Chen et al., 2022). Specifically, we aim to use this dataset to quantify 1) whether food plant diversity and nutrient traits within the home range are higher than those out of the home range in both groups C and E and 2) whether group E has higher food plant diversity and nutrient traits than group C.
Method and materials
Study sites
The study was conducted in the location of groups C and E at the northeastern margin of BNNR (109°14′ 47.35″E, 19°5′ 45.17″N; Figure 1). This area is covered by tropical evergreen rainforest, and the terrain is relatively rough and mountainous, with a vertical elevation difference of about 500 m. This area is located on the northern edge of the tropics and has a tropical marine monsoon climate with a mean annual rainfall of 1759 mm (Du et al., 2020). There is a distinct wet season from May to October when about 80% of the total rainfall occurs. Its annual temperature is between 22.5 and 26.0°C.
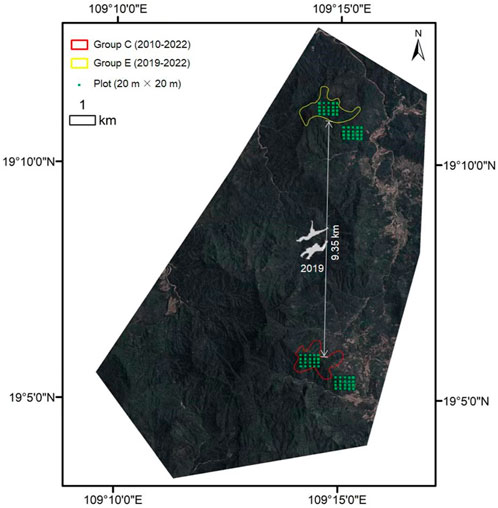
FIGURE 1. Location of our study area, the home range of group C and group E, and spatial location of all 20 m × 20 m plots.
Field sampling
In July 2018 (maximum growing season), within and out of the home range of groups C and E, 20 plots, each of 20 m × 20 m, that are 20 m apart from one another, were arranged along five parallel transects (Figure 1). Then, we recorded and measured all freestanding trees with a diameter of ≥1 cm at breast height (DBH) within each plot and identified them to species. Species were identified as potential food plants based on Zou et al. (2022). We also sampled 20 fully expanded and healthy leaves from five individuals for each food plant species in both groups C and E to measure leaf nutrients [leaf water content (%) and total soluble sugar (mg g−1), vitamin C (mg 100 g−1), calorific value (KJ g−1), crude fat (%), crude protein (%), crude fiber (%), Zn (μg g−1), and Fe (μg g−1)]. To minimize intraspecific variation in trait measurements, we selected only individuals with DBH near the species mean value. Importantly, the nine traits for the same species were measured separately if they occurred in both groups C and E. All leaf samples were marked and stored in a sealed bag and immediately transported to the Laboratory of Biodiversity and Ecosystem Functions, School of Forestry, Hainan University. In the laboratory, all samples were weighed fresh, dried to constant weight in an oven at 75°C, and weighed again to determine leaf water content (Fernández et al., 2014). Then, all dried samples were ground to homogenates using a processor grinder for measuring the remaining eight nutrient traits.
Following Arya et al. (2001), total soluble sugar and Vitamin C were measured by using a spectrophotometer. The calorific value was measured by using the oxygen bomb of the automatic calorimeter (ZDHW-5000 type) (Darling, 1976; Gao et al., 2022). Crude fat was measured by using the Soxhlet extraction technique and a fat extractor (JC-ZF-04) (Felton et al., 2009). We first measured the N in all dry leaf samples using a semi-automatic Kjeldahl apparatus (NKB-3100) and then multiplied the N by 6.25 to estimate the crude protein content (Ganzhorn et al., 2017). The crude fiber was quantified by using the fiber analyzer CXC-06 (Honeck et al., 2020). Zn and Fe were measured by using a WA 2081 Atomic Absorption Spectrophotometer (Misra et al., 2020).
Statistic methods
We first calculated food plant diversity (species richness and abundance). Then, for each of the nine leaf nutrient traits (leaf water content, total soluble sugar, vitamin C, calorific value, crude fat, crude protein, crude fiber, Zn, and Fe), we calculated the community-weighted mean (CWM) as follows:
where pij and tij are the relative abundance and the mean trait value of food plant species i in plot j, respectively. We then utilized non-parametric analysis (Wilcoxon signed-rank test) to quantify whether there were any important differences in food plant diversity (richness and abundance) and leaf nutrient traits between groups C and E and also between within and out of home range in groups C and E. Finally, we used principal component analysis (PCA) to evaluate whether food plant diversity and leaf nutrients can best-discriminate food plant species between groups C and E and food plant species between within and out of home range in groups C and E.
Results
Food plant diversity (richness and abundance) within the home range was significantly much higher (1.35–1.41 times) than that out of the home range in both groups C and E (Figures 2A–D, p of Wilcoxon signed rank test <0.05). Food plant diversity in the home range of group E was also significantly much higher (1.4–1.6 times) than that in the home range of group C (Figures 2E,F), p of Wilcoxon signed rank test <0.05). However, there were no significant differences in CWM for all nine leaf nutrient traits within and out of the home range of groups C and E and between the home range of groups C and E (Figures 3–5, p of Wilcoxon signed rank test >0.05).
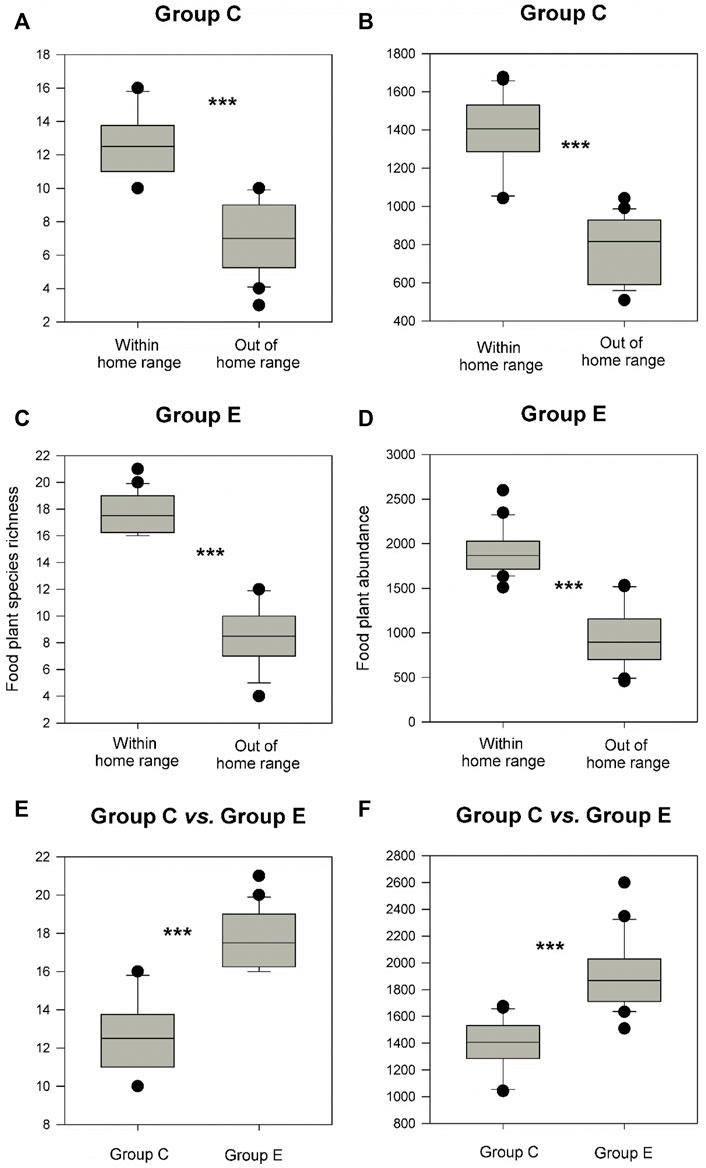
FIGURE 2. Differences in food plant diversity (richness and abundance) between within and out of the home range in groups C and E (A–D) and between the home range of groups C and E (E,F). Box plots show the median (line within the box), 25th and 75th percentiles (the boundaries of the box), and 90th and 10th percentiles (error bars). *** indicates p < 0.05 and shown are results from Wilcoxon signed rank tests.
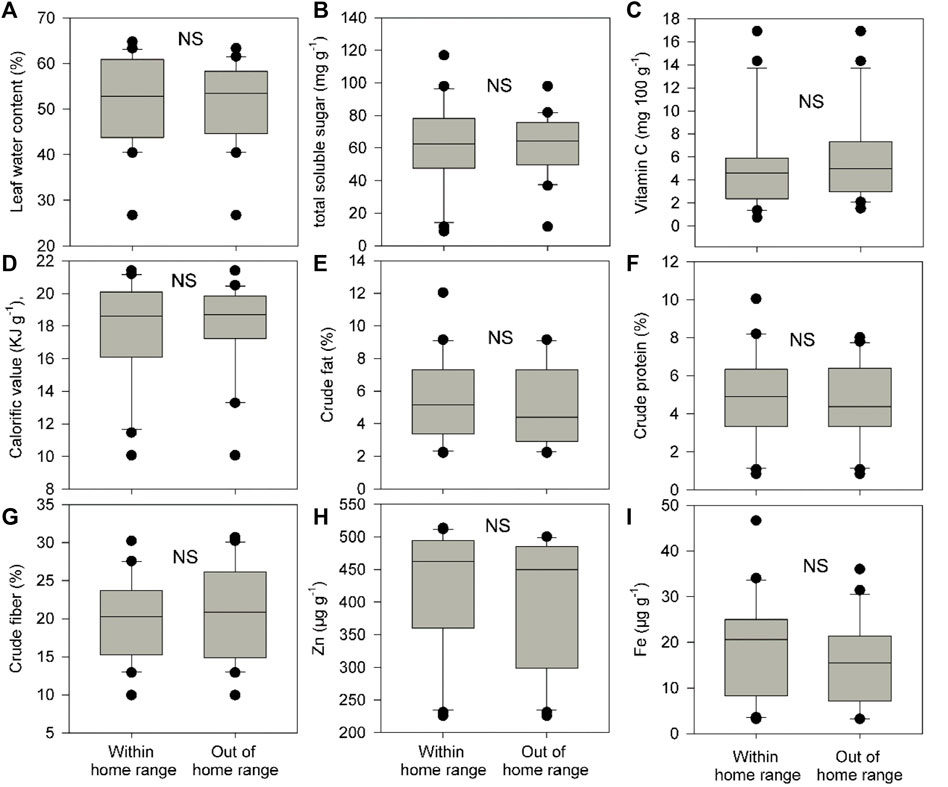
FIGURE 3. Differences in community weighted mean values (CWM) for nine food plant nutrient traits (A-I) between within and out of the home range of group C. These nine traits include leaf water content (%), total soluble sugar (mg g−1), vitamin C (mg 100 g−1), calorific value (KJ g−1), crude fat (%), crude protein (%), crude fiber (%), Zn (μg g−1), and Fe (μg g−1). Box plots show the median (line within the box), 25th and 75th percentiles (the boundaries of the box), and 90th and 10th percentiles (error bars) of CWM for food plant leaf nutrient traits. NS indicates p > 0.05 and shown are results from Wilcoxon signed rank tests.
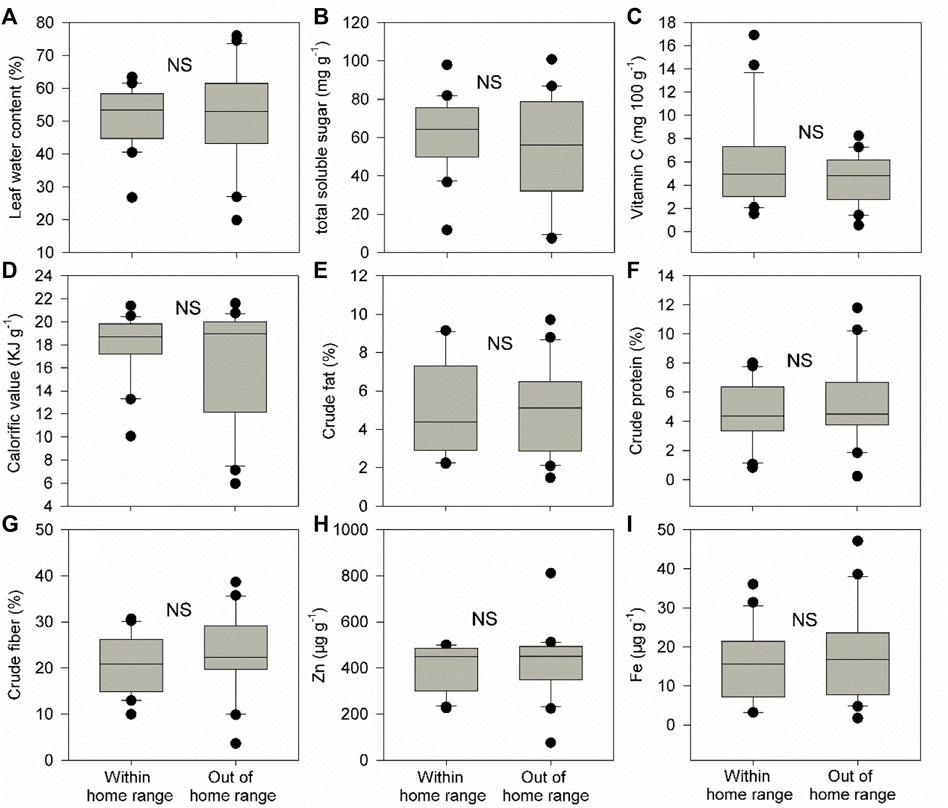
FIGURE 4. Differences in community weighted mean values (CWM) for nine food plant nutrient traits (A-I) between within and out of the home range of group E. These nine traits include leaf water content (%), total soluble sugar (mg g−1), vitamin C (mg 100 g−1), calorific value (KJ g−1), crude fat (%), crude protein (%), crude fiber (%), Zn (μg g−1), and Fe (μg g−1). Box plots show the median (line within the box), 25th and 75th percentiles (the boundaries of the box), and 90th and 10th percentiles (error bars) of CWM for food plant leaf nutrient traits. NS indicates p > 0.05 and shown are results from Wilcoxon signed rank tests.
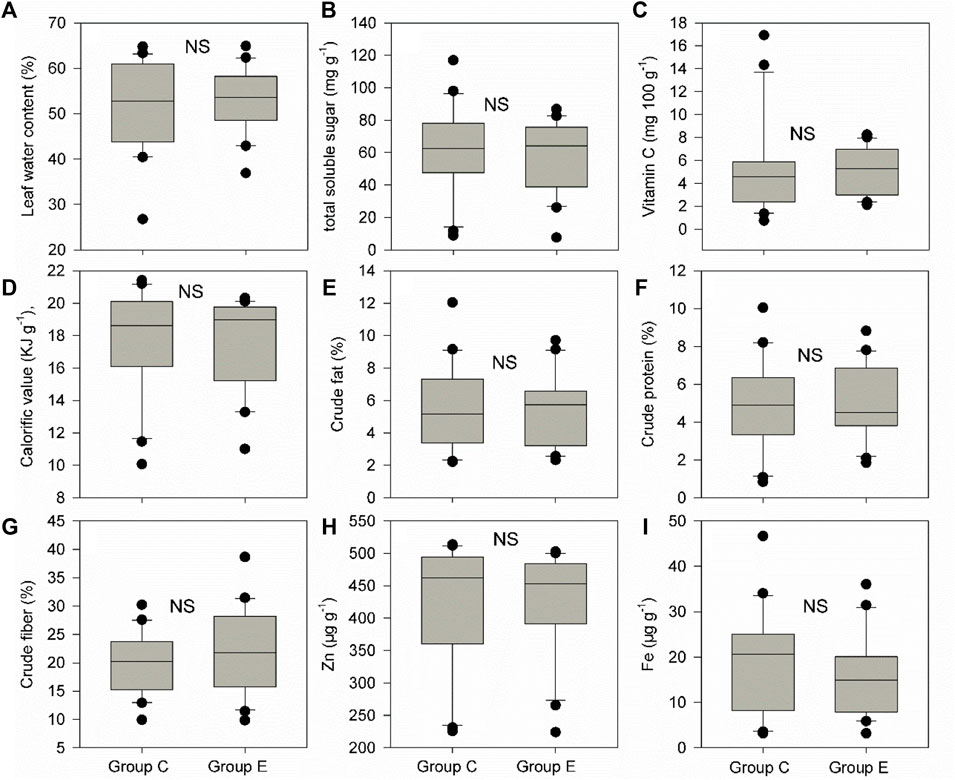
FIGURE 5. Differences in community weighted mean values (CWM) for nine food plant nutrient traits (A-I) between the home range of groups C and E. These nine traits include leaf water content (%), total soluble sugar (mg g−1), vitamin C (mg 100 g−1), calorific value (KJ g−1), crude fat (%), crude protein (%), crude fiber (%), Zn (μg g−1), and Fe (μg g−1). Box plots show the median (line within the box), 25th and 75th percentiles (the boundaries of the box), and 90th and 10th percentiles (error bars) of CWM for food plant leaf nutrient traits. NS indicates p > 0.05 and shown are results from Wilcoxon signed rank tests.
Results of PCA revealed that food plant species within and out of the home range of groups C and E and food plant species between the home range of groups C and E all could be significantly separated by food plant diversity (Figure 6). However, CWM for all nine leaf nutrients traits could not significantly separate food plant species within and out of the home range of groups C and E and food plant species between the home range of groups C and E (Figure 6).
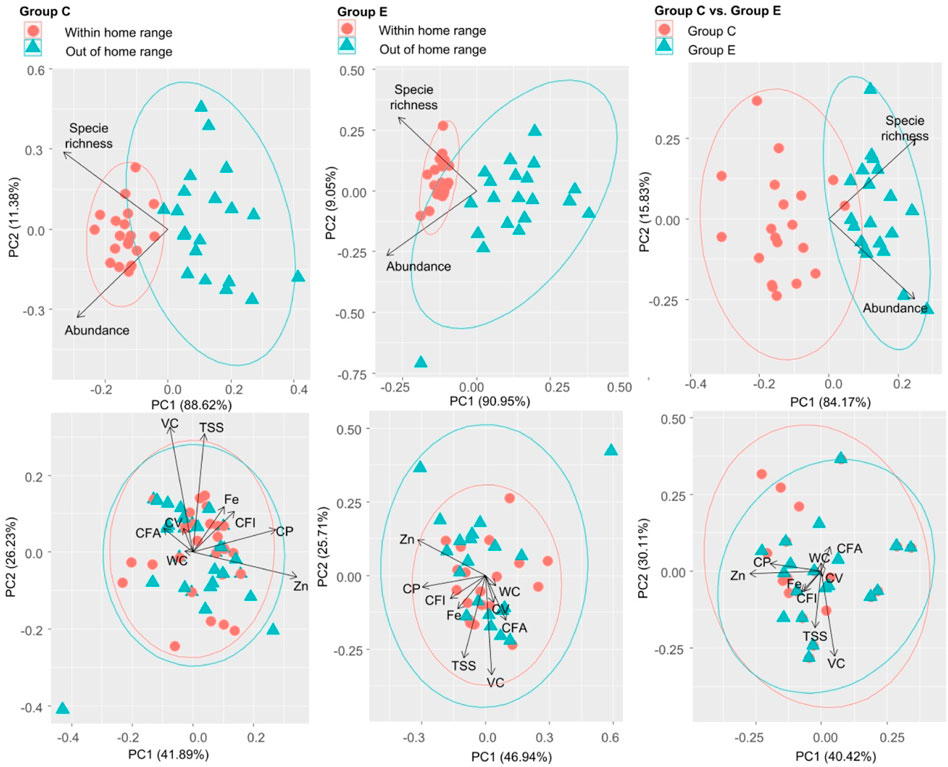
FIGURE 6. Principal component analysis of food plant diversity (richness and abundance) and CWM for nine food plant leaf nutrient traits between within and out of the home range in groups C and E and between the home range of groups C and E. These nine traits include leaf water content (WC, %), total soluble sugar (TSS, mg g−1), vitamin C (VC, mg 100 g−1), calorific value (VC, kJ g−1), crude fat (CFA, %), crude protein (CP, %), crude fiber (CFI, %), Zn (μg g−1), and Fe (μg g−1).
Discussion
In this study, we quantified whether food plant diversity and nutrients determined both gibbon home range selection and formation of a new family group as we hypothesized that choosing high food plant diversity was one key motivation for groups C and E to select their home range. Moreover, food plant diversity determined the formation of a new family group of Hainan gibbons.
A number of studies have found that food abundance and distribution can directly determine primate ranging patterns and home range area (Milton and May 1976; Kim et al., 2011; Simmen et al., 2014; Ning et al., 2019). However, until now, it remains unknown whether food plant diversity can directly determine the Hainan gibbon home range area. Primates can use spatial memory of food tree locations (Garber, 1989; Jang et al., 2021). Since group E originates from group C, if food plant diversity can indeed determine the home range area of Hainan gibbon, both groups C and E will select a home range with high food plant diversity. This can be simply revealed by the differences in food plant diversity within and out of the home range of both groups C and E. Our results clearly demonstrated that in both groups C and E, food plant diversity within the home range was indeed much higher than that out of the home range. Moreover, food plant diversity could also significantly separate food plant species within and out of the home range of groups C and E. These results indeed indicated that choosing high food plant diversity was also one key motivation for groups C and E to select their home range. Thus, our results for the first time revealed that food plant diversity could indeed determine the home range area of Hainan gibbon.
It is also unknown why two individuals move out from group C to go across 9 km to form group E in 2019 (Zou et al., 2022). Here, our results showed that food plant diversity within the home range of group E was indeed much higher than those in the home range of group C. Moreover, food plant diversity could also significantly separate food plant species between the home range of groups C and E. These results also elucidated that food plant diversity was one key determining force to drive Hainan gibbon to form a new family group (group E). It has been found that food plant diversity increased significantly from the oldest group (group A) to the youngest group (group E) (Zou et al., 2022). Thus, food plant diversity may determine the forming of new Hainan gibbon family groups.
Food plant nutrients (leaf water content, total soluble sugar, vitamin C, calorific value, crude fat, crude protein, crude fiber, Zn, and Fe) are also widely reported to affect primate population dynamics (growth, abundance, and home range) (Grether et al., 1992; Laska et al., 2000; Marshall and Leighton, 2006; Hansell et al., 2020). However, it is also unclear whether food plant nutrients can indeed influence Hainan gibbon population dynamics. If food plant nutrients can indeed determine the Hainan gibbon home range area and the forming of the new family group, plant nutrients within the home range of groups C and E should be much higher than those out of the home range of groups C and E. Similarly, plant nutrients within the home range of group E should also be much higher than those within the home range of group C. Here, our results showed that there are no significant differences in plant nutrients (leaf water content, total soluble sugar, vitamin C, calorific value, crude fat, crude protein, crude fiber, Zn, and Fe) between within and out of the home range of groups C and E and between the home range of group C and E. Furthermore, all food plant nutrients could not significantly separate food plant species within and out of the home range of groups C and E and between the home range of groups C and E. Thus, food plant nutrients can affect neither the home range area nor forming of the new family group of Hainan gibbon. One potential reason is that there is enough food plant diversity within the home range of Hainan gibbon. That is because, usually, when food is scarce, primates will select food in light of nutrients (Marshall et al., 2009).
We noted that although our results indicate that food plant diversity is one potential driver of the formation of the new family group of Hainan gibbon, other factors (i.e., natural enemies, human disturbance, and relatively rough and mountainous terrain) can also be potential determinants. Moreover, we only found the strong influences of food plant diversity on groups C and E, and the effects of food plant diversity on the remaining three family groups (groups A, B, and D) were also necessary to be quantified. As a result, the other drivers of the formation of the new group of Hainan gibbon merit future investigation to explore.
Conclusion
Overall, three important new insights about the influence of food plant diversity and nutrients on Hainan gibbon population dynamics have been revealed by our study. First, choosing high food plant diversity was also one key motivation for Hainan gibbons to select their home range. Second, food plant diversity may be one key determinant of the formation of the new family group of Hainan gibbon. Third, food plant nutrients cannot determine both the home range area and forming of the new family group of Hainan gibbon.
Data availability statement
The original contributions presented in the study are included in the article/Supplementary Material; further inquiries can be directed to the corresponding authors.
Author contributions
JC, HZ, and WG designed the research. LW, YL, JC, HZ, and WG performed the research and wrote the manuscript. LW, JC, and WG analyzed the data. All authors contributed to the article and approved the submitted version.
Funding
This research was supported by the Natural Science Foundation of Hainan province, China (422CXTD508), the Specific Research Fund of the Innovation Platform for Academicians of Hainan Province, Research project of Hainan academician innovation platform (YSPTZX202017), and the Scientific Research Project of Ecological Restoration of Baopoling Mountain in Sanya, China.
Conflict of interest
The authors declare that the research was conducted in the absence of any commercial or financial relationships that could be construed as a potential conflict of interest.
Publisher’s note
All claims expressed in this article are solely those of the authors and do not necessarily represent those of their affiliated organizations, or those of the publisher, the editors, and the reviewers. Any product that may be evaluated in this article, or claim that may be made by its manufacturer, is not guaranteed or endorsed by the publisher.
References
Arce, M., Michopoulos, V., Shepard, K. N., Ha, Q. C., and Wilson, M. E. (2010). Diet choice, cortisol reactivity, and emotional feeding in socially housed rhesus monkeys. Physiol. Behav. 101, 446–455. doi:10.1016/j.physbeh.2010.07.010
Arya, S., Mahajan, M., and Jain, P. (2001). Spectrophotometric determination of vitamin C with iron (II)-4-(2-pyridylazo) resorcinol complex. Anal. Chim. Acta X. 427, 245–251. doi:10.1016/s0003-2670(00)01092-8
Bach, T. H., Chen, J., Hoang, M. D., Beng, K. C., and Nguyen, V. T. (2017). Feeding behavior and activity budget of the southern yellow-cheeked crested gibbons (Nomascus gabriellae) in a lowland tropical forest. Am. J. Primatol. 79, e22667. doi:10.1002/ajp.22667
Borah, D. K., Solanki, G. S., and Bhattacharjee, P. C. (2021). Feeding ecology of capped langur (Trachypithecus pileatus) in sri surya pahar, a disturbed habitat in goalpara district, Assam, India. Trop. Ecol. 62, 492–498. doi:10.1007/s42965-021-00161-6
Chan, B. P. L., Lo, Y. F. P., and Mo, Y. (2020). New hope for the hainan gibbon: formation of a new group outside its known range. Oryx 54, 296. doi:10.1017/s0030605320000083
Chen, W. J., Kung, G. P., and Gnana-Prakasam, J. P. (2022). Role of iron in aging related diseases. Antioxidants (Basel). 11, 865–871. doi:10.3390/antiox11050865
Clink, D. J., Dillis, C., Feilen, K. L., Beaudrot, L., and Marshall, A. J. (2017). Dietary diversity, feeding selectivity, and responses to fruit scarcity of two sympatric Bornean primates (Hylobates albibarbis and Presbytis rubicunda rubida). PLoS ONE 12, e0173369. doi:10.1371/journal.pone.0173369
Darling, M. S. (1976). Interpretation of global differences in plant calorific values: The significance of desert and arid woodland vegetation. Oecologia 23, 127–139. doi:10.1007/BF00557851
de Vries, R., Boesveldt, S., and de Vet, E. (2022). Human spatial memory is biased towards high-calorie foods: a cross-cultural online experiment. Int. J. Behav. Nutr. Phys. Act. 19, 14. doi:10.1186/s12966-022-01252-w
Deng, H. Q., and Zhou, J. (2018). Thirteen years observation on diet composition of Hainan gibbons (Nomascushainanus). North-West. J. Zool. 14, 213–219.
Du, Y. J., Li, D. F., Yang, X. B., Peng, D. X., Tang, X. R., Liu, H., et al. (2020). Reproductive phenology and its drivers in a tropical rainforest national park in China: Implications for Hainan gibbon (Nomascus hainanus) conservation. Glob. Ecol. Conserv. 24, e01317. doi:10.1016/j.gecco.2020.e01317
Estrada, A., Garber, P. A., Rylands, A. B., Roos, C., Fernandez-Duque, E., Di Fiore, A., et al. (2017). Impending extinction crisis of the world’s primates: Why primates matter. Sci. Adv. 3, e1600946. doi:10.1126/sciadv.1600946
Fan, K. X., Xu, Y., Liu, P. C., and Zang, R. G. (2021). Recovery of logged tropical montane rainforests as potential habitats for hainan gibbon. Forests 12, 711–716. doi:10.3390/f12060711
Fellowes, J. R., Chan, B., Zhou, J., Chen, S., Yang, S., and Ng, S. C. (2008). Current status of the hainan gibbon (Nomascus hainanus): Progress of population monitoring and other priority actions. Asian. Primates. J. 1, 2–11.
Felton, A. M., Felton, A., Wood, J. T., Foley, W. J., Raubenheimer, D., Wallis, I. R., et al. (2009). Nutritional ecology of Ateles chamek in lowland Bolivia: How macronutrient balancing influences food choices. Int. J. Primatol. 30, 675–696. doi:10.1007/s10764-009-9367-9
Ganzhorn, J. U., Arrigo-Nelson, S. J., Carrai, V., Chalise, M. K., Donati, G., Droescher, I., et al. (2017). The importance of protein in leaf selection of folivorous primates. Am. J. Primatol. 79, e22550. doi:10.1002/ajp.22550
Gao, T., Zhu, Q., Zhou, Z. D., Wu, Y. B., and Xue, J. H. (2022). Effects of biochar-based fertilizers on energy characteristics and growth of black locust seedlings. Sustainability 14, 5045. doi:10.3390/su14095045
Garber, P. A. (1989). Role of spatial memory in primate foraging patterns: Saguinus mystax and Saguinus fuscicollis. Am. J. Primatol. 19, 203–216. doi:10.1002/ajp.1350190403
Golub, M. S., Keen, C. L., Gershwin, M. E., and Hendrickx, A. G. (1995). Developmental zinc deficiency and behavior. J. Nutr. 125, 2263S–2271S. doi:10.1093/jn/125.suppl_8.2263s
Grether, G. F., Palombit, R. A., and Rodman, P. S. (1992). Gibbon foraging decisions and the marginal value model. Int. J. Primatol. 13, 1–17. doi:10.1007/bf02547724
Hansell, M., Asberg, A., and Laska, M. (2020). Food preferences and nutrient composition in zoo-housed ring-tailed lemurs, Lemur catta. Physiol. Behav. 226, 113125. doi:10.1016/j.physbeh.2020.113125
Hanya, G., and Chapman, C. A. (2013). Linking feeding ecology and population abundance: a review of food resource limitation on primates. Ecol. Res. 28, 183–190. doi:10.1007/s11284-012-1012-y
Hladik, C. M., and Simmen, B. (1996). Taste perception and feeding behavior in nonhuman primates and human populations. Evol. Anthropol. 5, 58–71. doi:10.1002/(sici)1520-6505(1996)5:2<58::aid-evan5>3.0.co;2-s
Honeck, A., Ahlhorn, J., Burfeind, O., Gertz, M., Beilage, E. G., Hasler, M., et al. (2020). Influence on tail-biting in weaning pigs of crude fibre content and different crude fibre components in pigs’ rations. J. Agric. Sci. 158, 233–240. doi:10.1017/S0021859620000404
Huang, F. Y., Sutcliffe, M. P. F., and Grabenhorst, F. (2021). Preferences for nutrients and sensory food qualities identify biological sources of economic values in monkeys. Proc. Natl. Acad. Sci. U. S. A. 118, e2101954118. doi:10.1073/pnas.2101954118
Jang, H., Oktaviani, R., Kim, S., Mardiastuti, A., and Choe, J. C. (2021). Do Javan gibbons (Hylobates moloch) use fruiting synchrony as a foraging strategy? Am. J. Primatol. 83, e23319. doi:10.1002/ajp.23319
Jildmalm, R., Amundin, M., and Laska, M. (2008). Food preferences and nutrient composition in captive white-handed gibbons, Hylobates lar. Int. J. Primatol. 29, 1535–1547. doi:10.1007/s10764-008-9314-1
Kim, S., Lappan, S., and Choe, J. C. (2011). Diet and ranging behavior of the endangered javan gibbon (Hylobates moloch) in a submontane tropical rainforest. Am. J. Primatol. 73, 270–280. doi:10.1002/ajp.20893
Laska, M., Hernandez Salazar, L. T., and Rodriguez Luna, E. (2000). Food preferences and nutrient composition in captive spider monkeys, Ateles geoffroyi. Int. J. Primatol. 21, 671–683. doi:10.1023/a:1005517421510
Lee, S. W., Lee, Y. J., Baek, S. M., Kang, K. K., Kim, T. U., Yim, J. H., et al. (2022). Mega-dose vitamin C ameliorates nonalcoholic fatty liver disease in a mouse fast-food diet model. Nutrients 14, 2195–2201. doi:10.3390/nu14112195
Liu, H., Ma, H., Cheyne, S. M., and Turvey, S. T. (2020). Recovery hopes for the world’s rarest primate. Science 368, 1074. doi:10.1126/science.abc1402
Marshall, A. J., Boyko, C. M., Feilen, K. L., Boyko, R. H., and Leighton, M. (2009). Defining fallback foods and assessing their importance in primate ecology and evolution. Am. J. Phys. Anthropol. 140, 603–614. doi:10.1002/ajpa.21082
Marshall, A. J., and Leighton, M. (2006). How does food availability limit the population density of white-bearded gibbons? Cambridge: Cambride Studies in Bological and Evolutionary Authropology.
Milton, K., and May, M. L. (1976). Body weight, diet and home range area in primates. Nature 259, 459–462. doi:10.1038/259459a0
Misra, G., Joshi-Saha, A., Salaskar, D., Reddy, K. S., Dixit, G. P., Srivastava, A. K., et al. (2020). Baseline status and effect of genotype, environment and genotype × environment interactions on iron and zinc content in Indian chickpeas (Cicer arietinumL.). Euphytica 216, 137–142. doi:10.1007/s10681-020-02673-z
Ning, W. H., Guan, Z. H., Huang, B., Fan, P. F., and Jiang, X. L. (2019). Influence of food availability and climate on behavior patterns of Western black crested gibbons (Nomascus concolor) at Mt. Wuliang, Yunnan, China. Am. J. Primatol. 81, e23068. doi:10.1002/ajp.23068
Salachna, P., Mizielinska, M., Ploszaj-Witkowska, B., and Jaszczak, A. (2021). Zinc oxide nanoparticles enhanced biomass and zinc content and induced changes in biological properties of red perilla frutescens. Materials 14, 6182–6188. doi:10.3390/ma14206182
Simmen, B., Tarnaud, L., Marez, A., and Hladik, A. (2014). Leaf chemistry as a predictor of primate biomass and the mediating role of food selection: A case study in a folivorous Lemur (Propithecus verreauxi). Am. J. Primatol. 76, 563–575. doi:10.1002/ajp.22249
Turvey, S. T., Traylor-Holzer, K., Wong, M. H. G., Bryant, J. V., Zeng, X., Hong, X., et al. (2015). International conservation planning workshop for the hainan gibbon: Final report. London: Zoological Society of London.
Yeager, C. P. (1989). Feeding ecology of the proboscis monkey (Nasalis larvatus). Int. J. Primatol. 10, 497–530. doi:10.1007/bf02739363
Zhang, H., Wang, C., Turvey, S. T., Sun, Z. Y., Tan, Z. Y., Yang, Q., et al. (2020). Thermal infrared imaging from drones can detect individuals and nocturnal behavior of the world’s rarest primate. Glob. Ecol. Conserv. 23, e01101. doi:10.1016/j.gecco.2020.e01101
Zhao, H., Wang, X., Kreigenhofer, B., Qi, X., Guo, S., Wang, C., et al. (2013). Study on the nutritional ecology of wild primates. Acta Ecol. Sin. 33, 185–191. doi:10.1016/j.chnaes.2013.05.004
Keywords: food plant diversity and nutrients, Hainan gibbon, new formation of the family group, population dynamics, primate conservation, species recovery
Citation: Wang L, Li Y, Cui J, Zhang H and Gong W (2022) Food plant diversity determines home range area and formation of a new family group of the world’s rarest primate. Front. Environ. Sci. 10:1020873. doi: 10.3389/fenvs.2022.1020873
Received: 16 August 2022; Accepted: 25 August 2022;
Published: 15 September 2022.
Edited by:
Xiang Liu, Lanzhou University, ChinaCopyright © 2022 Wang, Li, Cui, Zhang and Gong. This is an open-access article distributed under the terms of the Creative Commons Attribution License (CC BY). The use, distribution or reproduction in other forums is permitted, provided the original author(s) and the copyright owner(s) are credited and that the original publication in this journal is cited, in accordance with accepted academic practice. No use, distribution or reproduction is permitted which does not comply with these terms.
*Correspondence: Jie Cui, NDQzNDY0MTk5QHFxLmNvbQ==; Hui Zhang, emhhbmdodWl0aWFueGlhQDEyNi5jb20=; Wenfeng Gong, Z3dmMTAxQDE2My5jb20=
†These authors have contributed equally to this work