 Fulan Wu1
 Pei Li
- 1School of Economics, Zhejiang University, Hangzhou, Zhejiang, China
- 2School of Economics and Management, University of Science and Technology Beijing, Beijing, China
- 3China Academy of West Region Development, Zhejiang University, Hangzhou, Zhejiang, China
Electric vehicles are expanding significantly in recent years. Policies have been critical in stimulating the growth of electric vehicle market. This paper focuses on subsidy policies for electric vehicle adoption in a horizontally differentiated goods market. Using a representative consumer model and assuming the duopoly firms compete in a Cournot fashion, we find that the optimal level of subsidies might not fall as a result of the decreasing production cost of electric vehicles. Instead, the subsidy might phase down when the government starts to bring more competition into the electric vehicle industry. This main result goes through irrespective of whether the subsidy is sales volume-based or sales revenue-based. Our numerical findings further suggest that welfare maximizing subsidy declines with an increasing competition among car manufacturers, and sales volume-based subsidy policy is more efficient than sales revenue-based one. In addition, we also find that the subsidy cut would reduce electric vehicle sales, and subsidy policy is responsive to the government’s objective function.
1 Introduction
Concerns over climate change and energy security have led many governments in the world to introduce sustainable energy policies (Chen et al., 2022). In the automobile industry, electric vehicles (EVs) provide a most promising solution to many energy and environmental issues, such as energy security, air pollution, and global warming (Xiao et al., 2020a). This makes EVs increasingly popular among policy makers and the general public, as compared to their alternative internal combustion engine vehicles (ICEVs). The EV industry has grown rapidly over the last decade. In 2019, the number of global electric car fleet is 7.2 million, an increase of 2.1 million from 2018 (International Energy Agency (IEA), 2020).
Despite their many benefits, EVs face diverse barriers (e.g., high EV prices, short driving ranges, limited charging facilities, and long charging time). The rapid growth of EVs is mainly driven by policies at different levels, in addition to technology advances. In fact, leading countries in EVs have implemented various incentive measures to help boost EV sales. These include fiscal incentives, licenses privileges, waivers of road access restrictions, lower toll or parking fees, the dual credit policy, lane access and fee exemptions (International Energy Agency (IEA), 2019; He et al., 2018; Yang et al., 2022a; Wu et al., 2022). Among those factors, subsidies are specifically identified as being essential for EVs to reach mass market (Eppstein et al., 2011; Hidrue et al., 2011).
Subsidies for EVs are used world widely. For example, in the US, the incentive for purchases of plug-in electric vehicles (PHEVs) and battery electric vehicles (BEVs), which offers $2500–$7500 tax credit, started in 2010.1 Since 2009, the Chinese central government and most local governments have launched a progressive set of policy measures for stimulating the sales of EVs, including subsidies. In 2016, each EV purchase is eligible for a central subsidy of up to yuan 55,000 and a local subsidy of up to 100% of the central subsidy value, depending on different standards (car types, driving range, battery capacity, etc.). Over the subsequent 4 years, however, both the central and local subsidies have gradually decreased and was supposed to be phased out in 2020 eventually.2
A government may have a variety of reasons for granting subsidies. Yang and Nie (2022b) argue that subsidies may help encourage clean innovation. In case of EVs, positive environmental externalities lead to a market failure which distorts their prices relative to ICEVs, resulting in fewer EVs being produced and sold (Rennings, 2000). Governments may subsidize EVs to cope with the distortion and promote their adoption (Bouckaert and De Borger, 2013; Xiao et al., 2020b). For instance, with a prolonged period of offering EV subsidies, China has been both the world’s largest producer and consumer of EVs since 2015. Hence, the cutting down and removal of EV subsidies raises a concern on the EV industry development. The questions arise as to why the government decides to cut down EV subsidies, how the subsidy cut and removal might affect EV adoption, and how the government chooses optimal subsidy policies to maximize the EV adoption with its total budget set aside.
In this paper, we will explore these issues by applying a representative consumer model, taking into account the interplay of government policies and firms’ behavior.3 The objectives of this paper are: First, to identify how the optimal level of subsidies changes with competition, the production costs and environmental damages of different technologies under different subsidy schemes and government’s objectives; Second, to theoretically investigate if consumer subsidies have an effect on encouraging EV adoption and thus complement existing literature on the relationship between financial subsidies and EV adoption; Third, to explore the effectiveness of different subsidy schemes that may help achieve the mass adoption of EVs.
We consider a market that consists of two firms. The firms produce EVs and/or ICEVs. That is, the two competing firms offer either identical or horizontally differentiated products. Both firms compete equally for all consumers and choose the optimal quantities of EVs and/or ICEVs to maximize their profits. The government maximizes social welfare by determining a subsidy rate based on sales volume or revenue. Thus, both firms’ optimal quantities and prices, and the optimal level of subsidies are analyzed. In the basic Cournot model, both firms produce identical EV products. Then, the model is extended to the case in which both firms produce horizontally differentiated products. Our analysis focuses on the differentiated (heterogeneous) product market. Lastly, we discuss how subsidy policies might change when the government’s objective switches to a stated ambition of capturing a certain percentage of market share.
We obtain the following results. The optimal level of subsidy rate would go down when the unit production cost and environmental damage of ICEVs decrease, or when the unit production cost and environmental damage of EVs increase. This implies that subsidy cuts may not be owing to the decreasing cost of EV production. A new and interesting finding is that the optimal level of subsidies falls as competition gets more intense, when competition intensity is within a certain threshold. The result sheds some light on why the government cuts down subsidies for EVs and cancels it in the end. The reasoning behind the subsidy cuts may be that the policymakers intend to make the EV industry market-oriented and not overly reliant on the government’s funds. These results are robust regardless of subsidy schemes, when the government is assumed to maximize social welfare.
We also find that consumer subsidies have a positive effect on EV sales, and thus subsidy cuts would cause EV sales to fall down. Our numerical findings are compatible with those derived from the theoretical framework. In addition, the numerical comparison suggests that sales volume-based subsidy scheme is more effective than sales revenue-based one. This is because the former could achieve the same level of output and social welfare with lower government budgets. Motivated by the empirical evidence, we also study subsidy policies under the assumption that the government manages to reach an expected sales target, and find that the subsidy rate based on sales volume and the unit production cost of EVs move in the same direction. This result is comparable to the one we obtain when government’s objective is to maximize social welfare.
The rest of the paper is organized as follows. Section 2 reviews the relevant literature. In Section 3, we present the structure of the incentive model and derive the equilibrium outcomes in a homogeneous goods market. Section 4 extends the model to allow for horizontal product differentiation, and reports a detailed analysis and a numerical comparison of the equilibrium results between two different subsidy schemes. In Section 5, we reconsider the model with a different objective function of the government. We summarize our conclusion in Section 6.
2 Literature review
This paper is centered on how the optimal level of subsidies for EVs might change with market competition and technology development over time. The impact of financial subsidies on EV adoption, and the effectiveness of different subsidy schemes will be discussed as well. There is a large body of related literature on this.
There have been a number of studies assessing the impact of financial incentives on EV sales. Chandra et al. (2010) find that provincial tax rebates increase hybrid vehicle sales substantially in Canada. Beresteanu and Li (2011) and Gallagher and Muehlegger (2011) show that both gasoline prices and federal incentives have a positive effect on hybrid vehicle sales in the United States. Jenn et al. (2013) conclude that the Energy Policy Act of 2005 contributes to the increased sales of hybrid vehicles in the United States. Liu (2014) also shows that federal tax incentives are conducive to hybrid sales in the United States. Gass et al. (2014) propose that a price support system (e.g., direct financial support, exemption from registration tax), which lowers up-front cost, is favorable for consumers’ EV purchase. Hao et al. (2014) conclude that China’s subsidy is necessary for battery electric passenger vehicles to be cost competitive against their counterpart conventional passenger vehicles. Jenn et al. (2018) and Wee et al. (2018) evaluate the effect of a number of different incentives on the adoption of EVs, and their results indicate that policy incentives increase EV adoption.
While most studies have found a positive relationship between financial subsidies and EV sales, some studies have presented conflicting results (Diamond, 2009; Zhang et al., 2013) in the existing literature. This in turn points to other socio-economic factors, in addition to financial incentives, which could be the primary drivers of EV adoption. Consequently, a huge volume of research focuses on how financial incentives and other factors might jointly affect EV adoption (Sierzchula et al., 2014; Lutsey et al., 2015; Mersky et al., 2016; Soltani-Sobh et al., 2017; Lin and Wu, 2018; Priessner et al., 2018; Ma et al., 2019; Ou et al., 2020; Huang et al., 2021).
Similar to the papers above, one of the aims in this paper is to evaluate the impact of financial subsidies on EV purchases. However, there is also a very important difference. The literature mentioned above employs an empirical approach to analyze the influence of financial incentives or the joint impact of financial incentives and other factors on EV adoption. Instead, this paper formulates a non-cooperative game between the government and the two firms, in which firms are engaged in Cournot competition.4 Therefore, a theoretical two-stage game model is applied to examine these issues. A few studies which fall into this strand include, for example, Hu et al. (2020). Hu et al. (2020) construct a network game model to explore how various subsidies affect the diffusion of EVs. Hence, their modelling approach and focus are entirely different from those of this study.
Another stream of related literature discusses the optimal level of subsidies for EVs, the resulting social welfare and environmental damage. This strand of studies involves Hirte and Tscharaktschiew (2013), Holland et al. (2016), Yang et al. (2018), Shao et al. (2017), and Zheng et al. (2018). Hirte and Tscharaktschiew (2013) employ a spatial general equilibrium approach to explore whether the use of EVs shall be subsidized and how large the subsidy rate shall be. Holland et al. (2016) analyze a theoretical model of vehicle choice and determine the welfare maximizing subsidies on EV purchases under both uniform regulation and differentiated regulation.5 This work relates to theirs in that the social welfare maximizing subsidies for EVs is also determined. The difference is that this modelling framework considers the interaction between government and firms, which prevails in the industrial organization literature on designing incentive policies.
Yang et al. (2018) consider the interplay between the government and taxi drivers, and propose a two-stage optimization framework, in which the most effective subsidy scheme is solved to maximize the adoption of battery electric vehicles (BEV) taxis. This paper also considers the setting where the government’s objective is to achieve a certain vehicle electrification, but in a rather different way. To be specific, firms’ behavior is taken into account in this analysis, with a main focus on optimizing the subsidy policies when the government’s objective function is to maximize social welfare, which is more common in the context of EVs. More related to this study, Zheng et al. (2018) describe a two-stage model in which the government offers subsidies to maximize social welfare and accordingly the monopoly manufacturer who could produce both EVs and ICEVs simultaneously makes optimal decisions for these two products. The distinction between these two is that this research looks at the duopoly firms, instead of the monopoly firm.
This paper is most closely related to Shao et al. (2017). Their study considers a vehicle market of both EVs and gasoline vehicles under two different structures: monopoly and duopoly. They develop a Stackelberg game model composed of a population of consumers, manufacturer(s) and the government. In their model, the government determines the optimal per unit subsidy or price discount rate to maximize social welfare, while the monopoly or duopoly firms choose a price to maximize profit, knowing that consumers are heterogeneous. The main purpose of their work is to analyze and compare the effects of the subsidy and price discount incentive schemes on EV adoption, environmental impacts, and social welfare in the monopoly and duopoly settings. Unlike in their paper, the primary concern of this paper is to provide an explanation of the empirical observation that governments are aiming to phase out EV subsidization given the expectation that the automobile market competition will increase over time. Thus a representative consumer model is applied with the duopoly firms competing in quantities. The most distinguished feature of the model is that it highlights a horizontally differentiated products market, which allows giving insight on how the optimal level of subsidies varies with competition. This is quite new in the EV literature.
3 The model with homogeneous goods
3.1 The basic setup
This section describes the benchmark Cournot duopoly model that is used to explore government’s subsidy policy associated with social welfare maximization objectives. Several extensions are discussed later in the analysis.
Consider a EV market with two firms indexed by
The EV industry faces a downward-sloping inverse demand function
where
Suppose that the government wishes to maximize social welfare, and the objective function is given by
where
Therefore, the game features the usual two stages:
1 (Incentives) The government chooses incentives
2 (Competition) The firms choose output
Both stages are non-cooperative and the equilibrium concept is subgame-perfect Nash equilibrium (SPE).
3.2 Analysis and results
We now analyze the benchmark Cournot duopoly model described above. The analysis of the game proceeds by solving the two stages backwards to find the SPE.
In stage 2, each firm chooses an output level,
By solving the two equations simultaneously, we obtain
The equilibrium outcome shows that price decreases, while quantity and firms’ profit increase with the government’s subsidy.10 Accordingly, the EV sales would drop as subsidies are phased down.
Given the Nash equilibrium in stage 2, the government chooses a subsidy rate (
Substitute
Solving Eq. 5 yields that, in equilibrium
To ensure the optimal subsidy rate
From the above equilibrium results, we have the following proposition.
Proposition 1:. The social welfare maximizing per unit subsidy decreases as per unit environmental damage and marginal cost of EVs increase.Proposition 1 indicates that the optimal subsidy rate
4 The model with heterogeneous goods
We now extend our model to the case where the two firms produce horizontally differentiated products, i.e. the representative consumer model. Assume firm 1 produces ICEVs, while firm 2 produces EVs. Let
Assume 1)
The game proceeds as before except now that the two firms are asymmetric and only firm 2 qualifies for subsidies. We consider sales volume-based subsidy scheme first and sale revenue-based subsidy scheme later.
4.1 Sales volume-based subsidy scheme
When only firm 2 receives per unit subsidy
The government’s objective remains unchanged, but now social welfare function is given by
Note that our previous inverse linear demand functions for the firms,
In this specification,
Again, we solve the model by backward induction. In stage 2, the two firms choose output level,
Solving the above two first-order conditions simultaneously, we get
It can be seen that firm 1’s equilibrium quantity, price and profit decrease with the increase of per unit subsidy for EVs. In contrast, firm 2’s equilibrium quantity and profit increase, but price decreases with the increase of per unit subsidy. The equilibrium outcome again suggests that government subsidy facilitates EV adoption.
In stage 1, the government chooses a per unit subsidy
The resulting optimal subsidy rate is then given as follows:
To make sure
Proposition 2:. The social welfare maximizing per unit subsidy decreases when per unit environmental damage and marginal cost of ICEVs decrease or the level of competition is increasing from zero to some threshold.Proposition 2 suggests that the optimal subsidy rate is positively related to per unit environmental damage and marginal cost of ICEVs.15 The optimal subsidy rate declines as per unit environmental damage and marginal cost of Lin and Wu (2018) ICEVs fall. In order to improve energy efficiency and mitigate environmental pollution, Chinese government has introduced plenty of policies, such as fuel consumption regulations, carbon quota policies, and credit management policies. For fuel consumption regulations, the government has put restrictions on corporation’s average fuel consumption (CAFC) of passenger vehicles since 2015. The average fuel consumption of passenger vehicle manufacturers should be reduced to 4 L/100 km by 2025. More recently, to achieve parallel management of CAFC and NEV credits, the Measures on the Joint Management of CAFC and new energy vehicles (NEV) Credits have been released (Ministry of Industry and Information, 2017). All these measures would help improve the efficiency of ICEVs, and mitigate their environmental effect, resulting in lower subsidies for EVs. An additional insight is that the optimal subsidy rate rises (falls) with the increase (decrease) of the rival’s marginal cost. The higher cost of ICEVs makes EVs socially more desirable, and thereby leads to the increased subsidy for EVs.More interestingly, our results show that the optimal subsidy rate changes with competition. To be specific, the optimal subsidy might decrease as competition gets stronger, when the level of competition is not exceeding a certain threshold. It is obvious that
4.2 Sales revenue-based subsidy scheme
Apart from deriving the incentive equilibrium with sales volume-based subsidy scheme, one of the contributions of the present analysis is to compare subsidy policies based on different measures. While some supporting policies might be on per unit basis, others might be a function of the vehicle technology, the battery size, the vehicle model, and/or the manufacturer’s suggested retail price. For example, China’ subsidy amounts for electric passenger cars are tied to the driving range. Therefore, BEVs with longer driving ranges might receive higher subsidies. In the United States, the tax credit varies by model, depending on the emissions and fuel economy since 2006. The governments of Romania, Spain, and the United Kingdom offer a price discount to each EV buyer. Taking these into account, we will consider an alternative subsidy scheme, namely sales revenue-based subsidy, in the following analysis.
Sales revenue is one of the leading measures of firm size used in the strategic delegation literature to date.16 With sales revenue-based subsidy policy, per unit subsidy of EV sales is actually proportional to its price, which is also prevalent in practice. Let
Notice that only firm 2 is subsidized. Hence firm 1’s profit function remains the same as given by Eq. 7. With incentive schemes for sales revenue, firm 2’s profit function and social welfare function are then given by
By backward induction, the equilibrium outcome in stage 2 would then be
Rearranging Eq. 18, we obtain
It is straightforward that the nominator is greater than the denominator in Eq. 19. To ensure
and
As a result of the preceding analysis, the following proposition is immediate.
Proposition 3:. The social welfare maximizing subsidy ratio based on sales revenue decreases as per unit environmental damage and marginal cost of EVs increase, or as per unit environmental damage and marginal cost of ICEVs decrease, or the market competition is increasing from zero to a certain level. However, per unit subsidy may fall with the decline of EVs’ price.The key insights from Proposition 2 are seen to be quite robust, irrelevant of changes in subsidy schemes. As before, the decrease of per unit environmental damage of ICEVs, or the increase of per unit environmental damage of EVs, would make EVs lose its comparative advantages in dealing with environmental issues. Consequently, the optimal subsidy ratio would lower down. Likewise, when marginal cost of EVs decreases or marginal cost of ICEVs increases, the development of EV might make our society better off. This may lead to a higher subsidy ratio for EVs. We also find that per unit subsidy of EVs,
4.3 A numerical comparison of different subsidy schemes
In this section, we will conduct a numerical analysis. We first illustrate how the optimal subsidy changes with competition under two different incentive schemes; next we proceed to examine if the incentive equilibrium with sales volume-based subsidy scheme is more or less efficient than sales revenue-based one. Anderson et al. (2001a), Anderson et al. (2001b) define two methods to evaluate the efficiency of various subsidy instruments. First, a subsidy instrument is more efficient than another when the former yields a higher output for a given subsidy budget. Second, a subsidy scheme is more efficient than another if it takes a lower budget to reach the same output. We adopt the second definition.
4.3.1 Data input
To derive a meaningful case, we set the parameter values (or ranges) with reference to relevant literature and data from China Association of Automobile Manufacturers. The value or range of values for each parameter is listed in Table 1. The basis for the calibration of the parameters is described in the following.
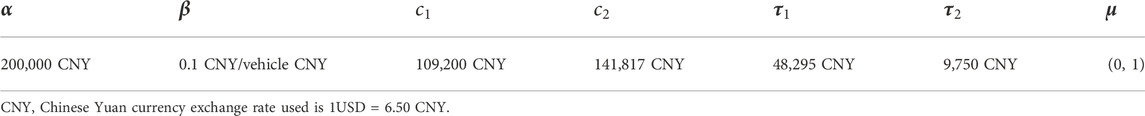
TABLE 1. Value or range of values for each parameter.
With reference to previous research, consumers maximum willingness to pay (
Cen et al. (2016) estimate that cost of traffic emissions is about $0.01 per km. Assume that the scrapped mileage is 600,000 km, then the lifetime cost of traffic emissions for a ICEV is $6000. Based on the calculations by Crane and Mao (2015), we set the one-off cost of scrapping ICEVs to be $1430. Therefore, the total environmental cost for a ICEV is $7430. Finally, we let the total environmental cost for an EV be $1500 so that our modelling assumption that
The numerical example further demonstrate that the optimal subsidy would be falling down when market competition is getting fiercer under both subsidy schemes. The answer to the second question is that efficiency is higher with sales volume-based subsidy scheme. However, this finding is consistent with that of Shao et al. (2017), which suggests that a subsidy scheme is preferable to a price discount due to its lower cost.
4.3.2 Results
Figure 1 characterizes the pattern of the optimal level of subsidies under different incentive schemes. It shows that both the subsidy rate based on sales volume and the one based on sales revenue tend to go down when the competition intensity increases from 0 to 1. This result may explain why the government offers more subsidies when the EV industry is at its introductory stage and the market is policy oriented. When the market is getting more competitive, the government may have to reduce its subsidy gradually and end up leaving EVs to the market.
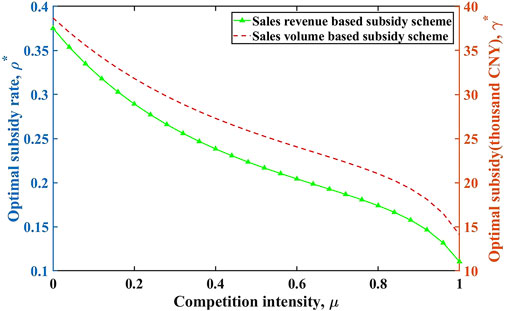
FIGURE 1. The relationship between optimal subsidy rate and competition intensity under two different subsidy schemes.
The comparisons of quantities and prices are illustrated in Figures 2–5 respectively. We find that prices and quantities of EVs and ICEVs are the same under two incentive subsidy schemes. However, the actual prices received by the firms producing EVs, which are equal to
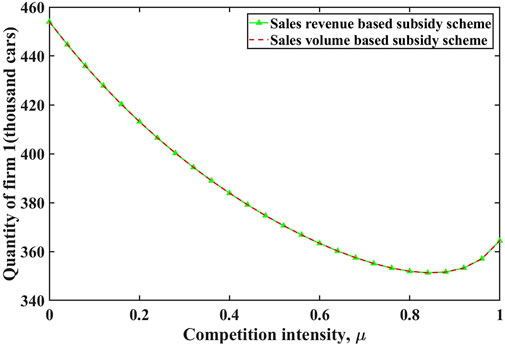
FIGURE 2. Comparison of firm 1’s quantity under two different subsidy schemes.
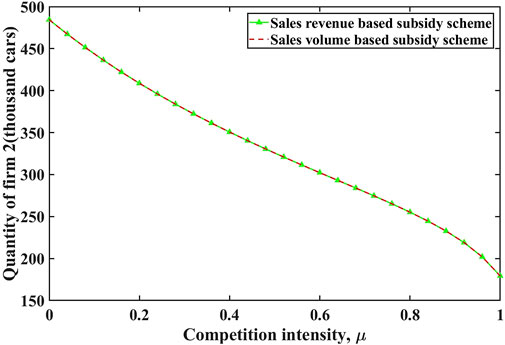
FIGURE 3. Comparison of firm 2’s quantity under two different subsidy schemes.
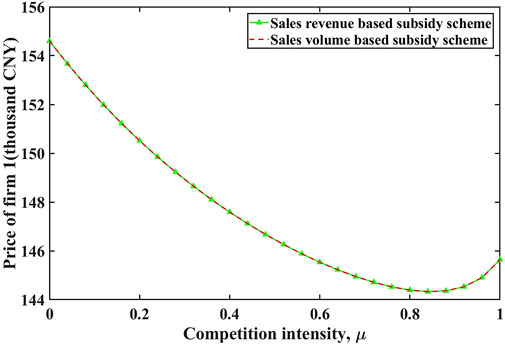
FIGURE 4. Comparison of firm 1’s price under two different subsidy schemes.
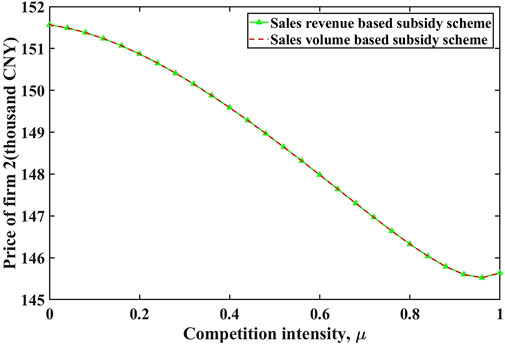
FIGURE 5. Comparison of firm 2’s price under two different subsidy schemes.
The comparisons of firms 1 and 2’s profits are illustrated in Figures 6, 7 respectively. We see that the profits of firm 1 under two incentive subsidy schemes are equal, while the profit of firm 2 is higher under sales revenue-based subsidy scheme than under sales volume-based one. This is due to the higher subsidy firm 2 attains under sales revenue-based subsidy scheme, as compared to under sales volume-based one. As a consequence, the government expenditure under sales revenue-based subsidy scheme would be larger. However, we also find that social welfare is identical under different subsidy schemes as shown in Figure 8. Based on the definition above, it follows that sales volume-based subsidy scheme is more effective than sales revenue-based one.
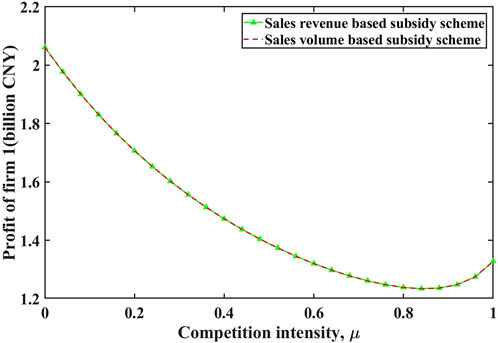
FIGURE 6. Comparison of firm 1’s profit under two different subsidy schemes.
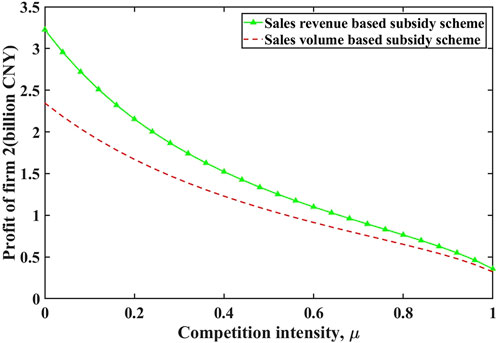
FIGURE 7. Comparison of firm 2’s profit under two different subsidy schemes.
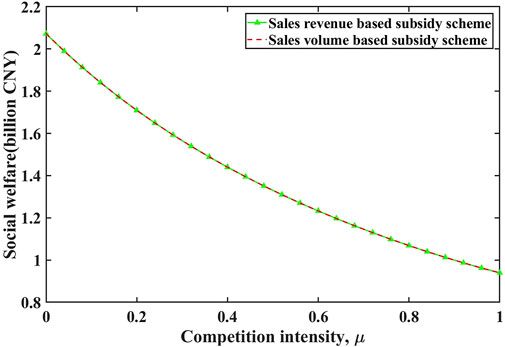
FIGURE 8. Comparison of social welfare under two different subsidy schemes.
Proposition 4:. Sales volume-based subsidy scheme is more efficient than sales revenue-based subsidy scheme.Proposition 4 reveals that sales volumes-based subsidy scheme enables the government to generate the same amount of EV sales and social welfare with a lower budget than sales revenue-based one. The reasoning behind is that social benefit from technology innovation is not reflected in the governments’ objective function. Technology progress is solely captured by prices in sales revenue-based subsidy scheme, whereas it is not in sales volume-based one. In reality, however, both subsidy schemes are popular. The government might as well choose sales revenue-based subsidy scheme if it wishes to promote both EV sales and technology progress, though sales volume-based subsidy scheme maximizes the EV adoption given the amount of budget.
5 The subsidy policy with market share incentives
In this section, we will reconsider our model with the government’s objective altered. Government may be more concerned with the market share or sales volume of EVs. For example, the Chinese government sets its new energy vehicle sales target at 500 million by 2020, and the market share will reach 20% of the whole automobile market by 2025. The Japanese government plans that EVs and hybrids will account for 50% of the overall sales of passenger cars by 2020 and 70% by 2030. In Germany, the government commits to a projected EVs sales of 100 million by 2020. In the ensuing analysis, we will examine the model in Section 4 with the assumption that the government aims to meet a certain sales volume or market share of EVs.
To simplify our analysis, we only look at the sales volume-based subsidy scheme in the heterogeneous goods market. Following the assumptions in Section 4, firm 1 sells ICEVs, while firm 2 sells EVs. Without subsidy, the Cournot equilibrium quantities, prices and profits for the two firms are
Suppose that the government aims to make EVs equally competitive. For instance, the EVs take half of the market. The government could subsidize EVs with a rate of γ, the equilibrium quantities after subsidy would then be
Proposition 5:. If the government aims to achieving a certain goal of market share, it may choose a subsidy policy positively related to the cost of EVs.The relationship between the subsidy policy and the cost of EVs in Proposition 5 is in contrast with that in Propositions 2, 3. It reflects the idea that the design of subsidy policy may depend on the government’s objectives. If the government commits to a targeted market share or sales volume, the analysis presented above shows that the government could respond to the decreasing cost of EVs by reducing its subsidies. It may also improve social welfare providing that the cost of EVs has decreased to the extent that the cost difference between the two types of vehicles is small enough. However, this result will not be able to guarantee social welfare maximization.
6 Conclusion
This paper mainly addresses how the subsidy policy would adjust as the EV market evolves and the technology develops. We build up a two-stage model, in which the government chooses its subsidy policy to maximize social welfare, and the two firms are involved in Cournot competition. We discuss both the homogeneous goods market and horizontally differentiated goods market, with a focus on the latter.
Our findings show that the optimal subsidy rate based on sales volume or sales revenue is negatively correlated to per unit environmental damage and marginal cost of EVs, but positively correlated to per unit environmental damage and marginal cost of ICEVs. This may justify higher subsidies for more environmentally friendly EVs. In the meantime, the negative relationship between the optimal subsidy and the marginal cost of EVs is due to the fact that total surplus resulting from the increased subsidy dominates its cost. In case of the subsidy policy based on sales revenue, though the optimal subsidy ratio increases along with the declining marginal cost of EVs, per unit subsidy might fall. The reason is that per unit subsidy is the product of the ratio and price of the EV. The lower marginal cost of EVs might drive down their prices and thus result in a lower per unit subsidy.
The most interesting finding is that the optimal subsidy rate based on sales volume or sales revenue may decline with the increasing competition. This is particularly true when the value of competition intensity (
Our analysis also indicates that subsidies help enhance the promotion of EVs, which implies that the subsidy cut and removal would cause the sales of electric vehicles to fall down. In addition, we compare the effectiveness of two different subsidy schemes in the numerical example, and find that sales volume-based subsidy scheme is more efficient than sales revenue-based one in the sense that it costs less to attain the same level of social welfare and production quantity. However, technology advantages are encouraged in sales revenue-based subsidy scheme, but not in sales volume-based one. This might explain why sales revenue-based subsidy scheme is prevailing.
To be complete in our analysis, we also analyze the setting in which the government’s objective turns to a certain market share or sales volume. This provides an additional insight on how the subsidy rate might change with relevant variables. We show that the subsidy rate may fall because of the falling cost of EV production, which contradicts to a conclusion we draw when the government’s objective is to maximize social welfare. Our parallel analysis suggests that policy makers may have to take their objectives into consideration when determining the subsidies for EVs. Therefore, the subsidy cuts and removal might be due to the fact that the EVs and ICEVs are close substitutes with the development of EV industry, or the production cost gap between EVs and ICEVs is narrowing.
A worth extension might be considering more than two firms, possibly n firms involved in an oligopoly or monopolistic competition, and see if our main result will go through. Another possible exploration worthy of doing is to extend our analysis to a dynamic setting where the government and firms interact repeatedly. Although the analysis might get more complicated, it is worthwhile to do this exercise as this setting is approximate to actual circumstance.
Data availability statement
The original contributions presented in the study are included in the article/Supplementary Material, further inquiries can be directed to the corresponding author.
Author contributions
FW: conceptualization, data curation, formal analysis, methodology, writing-original draft, supervision. PL: simulation programming, references input, review and editing. YL: methodology, review and editing. XD: review and editing.
Funding
This work is supported by the “Zhejiang Provincial Natural Science Foundation of China (No. LY17G030018)”, and “Teaching and Research Development Program of Faculty of Arts and Social Science, Zhejiang University”.
Conflict of interest
The authors declare that the research was conducted in the absence of any commercial or financial relationships that could be construed as a potential conflict of interest.
Publisher’s note
All claims expressed in this article are solely those of the authors and do not necessarily represent those of their affiliated organizations, or those of the publisher, the editors and the reviewers. Any product that may be evaluated in this article, or claim that may be made by its manufacturer, is not guaranteed or endorsed by the publisher.
Footnotes
1The credit begins to phase out for a manufacturer’s vehicles when at least 200,000 qualifying vehicles have been sold for use in the United States. The count is determined based on a cumulative basis for sales after 31 December 2009.
2The local subsidies were cancelled out in 2019. In 2020, however, the government decided to extend the deadline for subsidy withdrawal to the end of 2022, and smooth the declining process accordingly.
3The representative consumer model is widely used in empirical research on industrial organization.
4Cournot Competition is named after Antoine Augustin Cournot (1801–1877). In Cournot competition, firms produce a homogeneous product and each decides how much to produce independently and simultaneously.
5Their results suggest that on average in the US, the second best purchase policy is a tax, not a subsidy, and the electric vehicle subsidy should be equal to the difference in lifetime damages between an electric vehicle and a gasoline vehicle, but the subsidy for electric vehicles is not justified by environmental benefits.
6See Ritz (2008) for a reference.
7Subsidy broadly refers to policy instruments such as an up-front price support in order to increase the affordability of electric vehicles, including consumer purchase subsidy, tax credit.
8See for example Vickers (1985) for strategic incentives based on output.
9Despite being treated by regulators as “zero emission vehicles”, electric vehicles are not necessarily emission free (see, for example, National Academy of Sciences 2010).
10Note we assume that firms will receive the subsidies and thereby P is the effective price paid by consumers.
11In the socially efficient outcome,
12The results from Proposition 1 still hold if the subsidy rate is based on sales revenue.
13Gasoline vehicles emit several pollutants from their tailpipes and electric vehicles cause emissions of several pollutants from the smokestacks of electric power plants that charge them. If we account only for greenhouse gases, then electric vehicles are superior to gasoline vehicles almost everywhere (Holland et al., 2016).
14See Singh and Vives (1984) and Vives (1985) for a more general specification. We take this simplified specification in order to keep the analysis tractable while at the same time preserve the main qualitative insights.
15
16This is used by Fershtman and Judd (1987) and Sklivas (1987) for the first time, and examples of application include Lambertini and Trombetta (2002), Saracho (2002) and Ziss (2001).
References
Anderson, S. P., de Palma, A., and Kreider, B. (2001b). Tax incidence in differentiated product oligopoly. J. Public Econ. 81, 173–192. doi:10.1016/s0047-2727(00)00079-7
Anderson, S. P., de Palma, A., and Kreider, B. (2001a). The efficiency of indirect taxes under imperfect competition. J. Public Econ. 81, 231–251. doi:10.1016/s0047-2727(00)00085-2
Beresteanu, A., and Li, S. (2011). Gasoline prices, government support, and the demand for hybrid vehicles in the United States. Int. Econ. Rev. 52 (1), 161–182. doi:10.1111/j.1468-2354.2010.00623.x
Bouckaert, J., and De Borger, B. (2013). Price competition between subsidized organizations. J. Econ. 109, 117–145. doi:10.1007/s00712-012-0307-3
Cen, X., Lo, H. K., and Li, L. (2016). A framework for estimating traffic emissions: The development of Passenger Car Emission Unit. Transp. Res. Part D Transp. Environ. 44, 78–92. doi:10.1016/j.trd.2016.02.013
Chandra, A., Gulati, S., and Kandlikar, M. (2010). Green drivers or free riders? An analysis of tax rebates for hybrid vehicles. J. Environ. Econ. Manag. 60, 78–93. doi:10.1016/j.jeem.2010.04.003
Chen, Y. H., Nie, P. Y., Wang, C., Yang, Y. C., and Wang, H. (2022). Sustainable energy systems with policies in China. Sustain. Energy Syst. Policies China 1 (2), 701551005.
Crane, K., and Mao, Z. (2015). Costs of selected policies to address air pollution in China. Santa Monica, CA: RAND Corporation.
Diamond, D. (2009). The impact of government incentives for hybrid-electric vehicles: Evidence from US states. Energy Policy 37, 972–983. doi:10.1016/j.enpol.2008.09.094
Eppstein, M. J., Grover, D. K., Marshall, J. S., and Rizzo, D. M. (2011). An agent-based model to study market penetration of plug-in hybrid electric vehicles. Energy Policy 39, 3789–3802. doi:10.1016/j.enpol.2011.04.007
Fershtman, C., and Judd, K. (1987). Equilibrium incentives in oligopoly. Am. Econ. Rev. 77, 927–940.
Gallagher, K. S., and Muehlegger, E. (2011). Giving green to get green? Incentives and consumer adoption of hybrid vehicle technology. J. Environ. Econ. Manag. 61, 1–15. doi:10.1016/j.jeem.2010.05.004
Gass, V., Schmidt, J., and Schmid, E. (2014). Analysis of alternative policy instruments to promote electric vehicles in Austria. Renew. Energy 61, 96–101. doi:10.1016/j.renene.2012.08.012
Hao, H., Ou, X. M., Du, J. Y., Wang, H. W., and Ouyang, M. G. (2014). China's electric vehicle subsidy scheme: Rationale and impacts. Energy Policy 73, 722–732. doi:10.1016/j.enpol.2014.05.022
He, H., Jin, L., Cui, H., and Zhou, H. (2018). Assessment of electric car promotion policies in Chinese cities. Washington: The International Council on Clean Transportation. White paper.
Hidrue, M. K., Parsons, G. R., Kempton, W., and Gardner, M. P. (2011). Willingness to pay for electric vehicles and their attributes. Resour. Energy Econ. 33, 686–705. doi:10.1016/j.reseneeco.2011.02.002
Hirte, G., and Tscharaktschiew, S. (2013). The optimal subsidy on electric vehicles in German metropolitan areas: A spatial general equilibrium analysis. Energy Econ. 40, 515–528. doi:10.1016/j.eneco.2013.08.001
Holland, S. P., Mansur, E. T., Muller, N. Z., and Yates, A. J. (2016). Are there environmental benefits from driving electric vehicles? The importance of local factors. Am. Econ. Rev. 106, 3700–3729. doi:10.1257/aer.20150897
Hu, Y., Wang, Z. Y., and Li, X. R. (2020). Impact of policies on electric vehicle diffusion: An evolutionary game of small world network analysis. J. Clean. Prod. 265, 121703. doi:10.1016/j.jclepro.2020.121703
Huang, X., Lin, Y., Zhou, F., Lim, M. K., and Chen, S. (2021). Agent-based modelling for market acceptance of electric vehicles: Evidence from China. Sustain. Prod. Consum. 28, 206–217. doi:10.1016/j.spc.2021.04.007
International Energy Agency (IEA) (2019). Global EV outlook 2019. Paris: IEA. https://www.iea.org/publications/reports/globalevoutlook2019/.
International Energy Agency (IEA) (2020). Global EV outlook 2020. Paris: IEA. https://www.iea.org/reports/global-ev-outlook-2020.
Jenn, A., Azevedo, I. L., and Ferreira, P. (2013). The impact of federal incentives on the adoption of hybrid electric vehicles in the United States. Energy Econ. 40, 936–942. doi:10.1016/j.eneco.2013.07.025
Jenn, A., Springel, K., and Gopal, A. R. (2018). Effectiveness of electric vehicle incentives in the United States. Energy Policy 119, 349–356. doi:10.1016/j.enpol.2018.04.065
Lambertini, L., and Trombetta, M. (2002). Delegation and firms’ ability to collude. J. Econ. Behav. Organ. 47, 359–373. doi:10.1016/s0167-2681(01)00203-7
Li, J., Ku, Y., Liu, C., and Zhou, Y. (2020b). Dual credit policy: Promoting new energy vehicles with battery recycling in a competitive environment? J. Clean. Prod. 243, 118456. doi:10.1016/j.jclepro.2019.118456
Li, J., Ku, Y., Yu, Y., Liu, C., and Zhou, Y. (2020c). Optimizing production of new energy vehicles with across-chain cooperation under China’s dual credit policy. Energy 194, 116832. doi:10.1016/j.energy.2019.116832
Li, Y., Zhang, Q., Tang, Y., McLellan, B., Ye, H., Shimoda, H., et al. (2020a). Dynamic optimization management of the dual-credit policy for passenger vehicles. J. Clean. Prod. 249, 119384. doi:10.1016/j.jclepro.2019.119384
Lin, B., and Wu, W. (2018). Why people want to buy electric vehicle: An empirical study in first-tier cities of China. Energy Policy 112, 233–241. doi:10.1016/j.enpol.2017.10.026
Liu, Y. (2014). Household demand and willingness to pay for hybrid vehicles. Energy Econ. 44, 191–197. doi:10.1016/j.eneco.2014.03.027
Lou, G., Ma, H., Fan, T., and Chan, H. K. (2020). Impact of the dual-credit policy on improvements in fuel economy and the production of internal combustion engine vehicles. Resour. conservation Recycl. 156, 104712. doi:10.1016/j.resconrec.2020.104712
Lutsey, N., Searle, S., Chambliss, S., and Bandivadekar, A. (2015). Assessment of leading electric vehicle promotion activities in United States cities. leading-us-city-electric-vehicle-activities 223, 11288.
Ma, S.-C., Xu, J.-H., and Fan, Y. (2019). Willingness to pay and preferences for alternative incentives to EV purchase subsidies: An empirical study in China. Energy Econ. 81, 197–215. doi:10.1016/j.eneco.2019.03.012
Mersky, A. C., Sprei, F., Samaras, C., and Qian, Z. (2016). Effectiveness of incentives on electric vehicle adoption in Norway. Transp. Res. Part D Transp. Environ. 46, 56–68. doi:10.1016/j.trd.2016.03.011
National Academy of Sciences (2010). Hidden costs of energy: Unpriced consequences of energy production and use. Washington, DC: National Academies Press.
Ou, S. Q., Lin, Z. H., He, X., Przesmitzki, S., and Bouchard, J. (2020). Modeling charging infrastructure impact on the electric vehicle market in China. Transp. Res. Part D Transp. Environ. 81, 102248. doi:10.1016/j.trd.2020.102248
Priessner, A., Sposato, R., and Hampl, N. (2018). Predictors of electric vehicle adoption: An analysis of potential electric vehicle drivers in Austria. Energy Policy 122, 701–714. doi:10.1016/j.enpol.2018.07.058
Rennings, K. (2000). Redefining innovation — Eco-innovation research and the contribution from ecological economics. Ecol. Econ. 32, 319–332. doi:10.1016/s0921-8009(99)00112-3
Ritz, R. A. (2008). Strategic incentives for market share. Int. J. Industrial Organ. 26, 586–597. doi:10.1016/j.ijindorg.2007.04.006
Saracho, A. (2002). Patent licensing under strategic delegation. J. Econ. Manag. Strategy 11, 225–251. doi:10.1111/j.1430-9134.2002.00225.x
Shao, L., Yang, J., and Zhang, M. (2017). Subsidy scheme or price discount scheme? Mass adoption of electric vehicles under different market structures. Eur. J. Operational Res. 262, 1181–1195. doi:10.1016/j.ejor.2017.04.030
Sierzchula, W., Bakker, S., Maat, K., and Van Wee, B. (2014). The influence of financial incentives and other socio-economic factors on electric vehicle adoption. Energy Policy 68, 183–194. doi:10.1016/j.enpol.2014.01.043
Singh, N., and Vives, X. (1984). Price and quantity competition in a differentiated duopoly. Rand J. Econ. 15, 546–554. doi:10.2307/2555525
Sklivas, S. (1987). The strategic choice of managerial incentives. Rand J. Econ. 18, 452–458. doi:10.2307/2555609
Soltani-Sobh, A., Heaslip, K., Stevanovic, A., Bosworth, R., and Radivojevic, D. (2017). Analysis of the electric vehicles adoption over the United States. Transp. Res. Procedia 22, 203–212. doi:10.1016/j.trpro.2017.03.027
Vickers, J. (1985). Delegation and the theory of the firm. Econ. J. 95, 138–147. doi:10.2307/2232877
Vives, X. (1985). On the efficiency of Bertrand and Cournot equilibria with product differentation. J. Econ. Theory 36, 166–175. doi:10.1016/0022-0531(85)90086-9
Wee, S., Coffman, M., and La Croix, S. (2018). Do electric vehicle incentives matter? Evidence from the 50 U.S. States. Res. Policy 47, 1601–1610. doi:10.1016/j.respol.2018.05.003
Wu, F. L., Li, P., Dong, X. B., and Lu, Y. Z. (2022). Exploring the effectiveness of China's dual credit policy in a differentiated automobile market when some consumers are environmentally aware. Energy Econ. 111, 106077. doi:10.1016/j.eneco.2022.106077
Xiao, X., Chen, Z. R., and Nie, P. Y. (2020a). Analysis of two subsidies for EVs: Based on an expanded theoretical discrete-choice model. Energy 208, 118375. doi:10.1016/j.energy.2020.118375
Xiao, X., Chen, Z., Wang, C., and Nie, P. Y. (2020b). Effect of an electric vehicle promotion policy on China’s islands: A case study of hainan island. Front. Energy Res. 8, 132. doi:10.3389/fenrg.2020.00132
Yang, D. X., Yang, L., Chen, X. L., Wang, C., and Nie, P. Y. (2022a). Research on credit pricing mechanism in dual-credit policy: Is the government in charge or is the market in charge? Environ. Dev. Sustain. doi:10.1007/s10668-022-02108-w
Yang, J., Dong, J., and Hu, L. (2018). Design government incentive schemes for promoting electric taxis in China. Energy Policy 115, 1–11. doi:10.1016/j.enpol.2017.12.030
Yang, Y. C., and Nie, P. Y. (2022b). Subsidy for clean innovation considered technological spillover. Technol. Forecast. Soc. Change 184, 121941. doi:10.1016/j.techfore.2022.121941
Zhang, X., Wang, K., Hao, Y., Fan, J.-L., and Wei, Y.-M. (2013). The impact of government policy on preference for NEVs: The evidence from China. Energy Policy 61, 382–393. doi:10.1016/j.enpol.2013.06.114
Zheng, X., Lin, H., Liu, Z., Li, D., Llopis-Albert, C., and Zeng, S. (2018). Manufacturing decisions and government subsidies for electric vehicles in China: A maximal social welfare perspective. Sustainability 10 (3), 672–700. doi:10.3390/su10030672
Ziss, S. (2001). Horizontal mergers and delegation. Int. J. Industrial Organ. 19, 471–492. doi:10.1016/s0167-7187(99)00049-1
Nomenclature
Keywords: electric vehicle diffusion, subsidy policies, product differentiation, social welfare, market share
Citation: Wu F, Li P, Lu Y and Dong X (2022) Should electric vehicle subsidies phase down? An insight from the analysis of the increasingly competitive automobile market. Front. Environ. Sci. 10:1019948. doi: 10.3389/fenvs.2022.1019948
Received: 15 August 2022; Accepted: 17 October 2022;
Published: 24 November 2022.
Edited by:
Kenneth E. Okedu, National University of Science and Technology (Muscat), OmanReviewed by:
Pu-Yan Nie, Guangdong University of Finance and Economics, ChinaLeo Raju, SSN College of Engineering, India
Copyright © 2022 Wu, Li, Lu and Dong. This is an open-access article distributed under the terms of the Creative Commons Attribution License (CC BY). The use, distribution or reproduction in other forums is permitted, provided the original author(s) and the copyright owner(s) are credited and that the original publication in this journal is cited, in accordance with accepted academic practice. No use, distribution or reproduction is permitted which does not comply with these terms.
*Correspondence: Yuanzhu Lu, eXVhbnpodWx1QHVzdGIuZWR1LmNu