 Lin Pan
 Jing Yu
 Lu Lin
94% of researchers rate our articles as excellent or good
Learn more about the work of our research integrity team to safeguard the quality of each article we publish.
Find out more
ORIGINAL RESEARCH article
Front. Environ. Sci., 15 September 2022
Sec. Environmental Economics and Management
Volume 10 - 2022 | https://doi.org/10.3389/fenvs.2022.1018372
This article is part of the Research TopicGlobal Excellence: Environmental Issues and Global Value Chain in AsiaView all 24 articles
Carbon emissions based on land use change have attracted extensive attention from scholars, but the current land use carbon emission accounting model is still relatively rough. Despite the continuous promotion of China’s ecological civilization strategy, whether green economic development promotes carbon emission reduction remains to be studied. This study uses the Exploratory Spatial-temporal Data Analysis (ESTDA) framework system to revise the land-use carbon emission accounting model; it integrates the NDVI adjustment index and systematically analyzes the spatial and temporal patterns and evolutionary path characteristics of carbon emissions from 2000 to 2020 for 130 prefecture-level cities in the eastern coastal region of China, a high carbon emission region. The spatial econometric model is further used to explore the impact of green economy development on carbon emissions. The results show that the spatial distribution of carbon sources and sinks in the eastern coastal cities demonstrates a year-on-year increase during the study period. The spatial distribution of carbon sources is higher in the north than in the south, and the economically developed regions are more elevated than less developed economic areas. Net carbon emissions show prominent spatial clustering characteristics. The south has a more stable internal spatial structure than the north, and the inland has a more stable internal spatial structure than the coast. Green economic development can significantly reduce carbon emission intensity and has a significant spatial spillover effect. The findings imply that policy-makers need to consider the spatial and temporal distribution and spatial correlation of carbon emissions among cities; they can achieve carbon emission reduction by formulating a more reasonable green economy development approach and implementing regional linkages.
As a responsible country facing the grim reality of global warming caused by greenhouse gas emissions, China has pledged to strive toward “carbon peaking” by 2030 and “carbon neutrality” by 2060, that is, to attain the “dual carbon goals” (Wang and Yi, 2022). As the core area of China’s comprehensive development strategy, eastern coastal cities are pioneering; they are exemplary in economic development, urban management level, and residents’ living standards. However, coastal cities do not belong to an apparent geographic unit, though they act as a bridge connecting land and sea. Through close geographic linkages, they have gradually formed a new urban (belt) system that spans provincial regions and connects with cities worldwide (Chen et al., 2020). Therefore, carbon peaking and carbon neutrality in coastal areas can promote the sustainable development of coastal regions, significantly support the green and low-carbon transformation of the national economy, and enhance competitiveness at an international level. The coastal areas referred to in this paper include all prefecture-level cities in Liaoning, Hebei, Shandong, Jiangsu, Zhejiang, Fujian, Guangdong, Guangxi, and Hainan Provinces (except Sansha), as well as three municipalities directly under the central government of Beijing, Tianjin, and Shanghai (Figure 1). In 2020, with 13.6% of the land area, the study region gathered 56.4% of the national GDP, 46.5% of the resident population, 68.2% of the R&D expenditure, 62.2% of local fiscal revenue, 71.2% of the full-time equivalent of R&D personnel, 75.0% of domestic patents granted, and 83.1% of total imports and exports, with energy consumption accounting for 49.31% (Fu and Liu, 2021). The share of carbon emissions in the coastal region accounted for 45%–50% of the country from 2005 to 2019 (Fu et al., 2022). Although the share of carbon emissions in coastal areas started to decline in 2017, its large base share is still a great challenge for China to achieve the goal of “carbon neutrality” and “carbon peaking.” Given the significant differences in energy structure and socioeconomic development in coastal regions, how to scientifically and reasonably measure the differences in the spatial and temporal evolution of carbon emissions between different areas is vital for formulating carbon emission reduction policies that address the unique characteristics of each region.
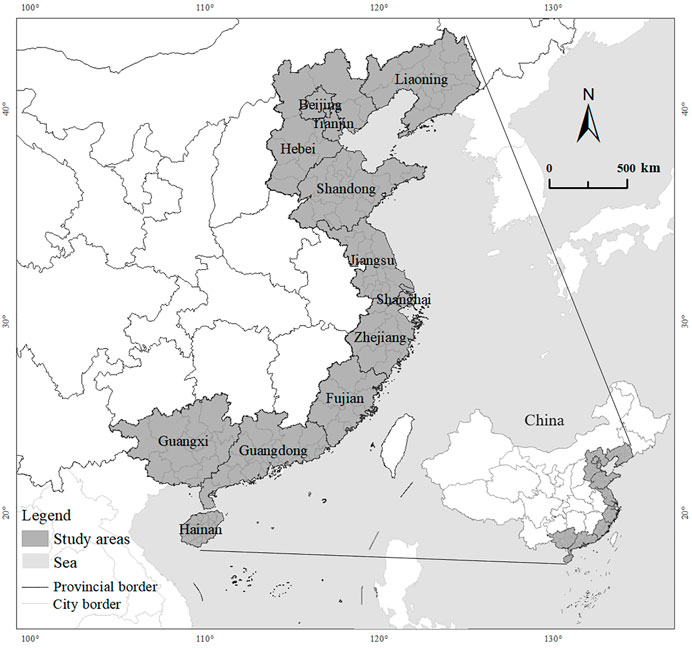
FIGURE 1. The location of study areas.
Land-use change is an essential factor driving changes in carbon sources and sinks. Studies show that land-use change contributes significantly to the dramatic increase in atmospheric CO2 concentrations and is second only to fossil fuel combustion (Zhang Z. et al., 2022). Scholars have studied the impact of land-use change on the increase in atmospheric CO2, concentrating on provincial (Xu et al., 2016; He et al., 2018), state (Houghton et al., 1999; Zhang et al., 2018), national (Piao et al., 2016; MacLean et al., 2021), regional (Achard et al., 2004; Houghton and Hackler, 2006; Zhao et al., 2013; Hinge et al., 2018), and global (Tian et al., 2021) spatial scales to account for land-use carbon emissions. Research perspectives are dominated by a single ecosystem or land-use type (Houghton and Hackler, 1999; Baumann et al., 2017). Some of the more widely used methods include the Invest model (Arcidiacono et al., 2015; Adelisardou et al., 2022), the Bookkeeping (BK) model (Houghton and Hackler, 1999; Houghton, 2003; Andersen et al., 2016), the Denitrification-Decomposition model (Li et al., 1992; Jiang et al., 2017) and the IPCC’s recommended method (Paustian et al., 2006). Although similar studies were begun later in China, they have gradually grown and achieved many results. However, most studies on land-use carbon sequestration assume that the carbon sequestration intensity of productive land is homogeneous among different areas (Zhu et al., 2021), which is obviously inconsistent with the actual situation. Therefore, this paper innovatively introduces the normalized difference vegetation index (NDVI) adjustment index to optimize the spatial distribution of carbon sequestration intensity based on the degree of vegetation cover. At the same time, most studies use land-use data from statistical yearbooks, and statistical errors and differences in statistical caliber cause large data errors.
The factors influencing carbon emissions are complex and diverse. The current academics mainly focus on economic growth, industrial structure changes, technological progress, energy efficiency improvement, urbanization, transportation, openness to the world, and capital investment (He et al., 2015; Zhang et al., 2017; Meng et al., 2018; Wang et al., 2019; Yang et al., 2019; Wang S. H. et al., 2020). Besides, there are still some studies focusing on factors of trade-related embodied carbon including female labor share, production structure, trade structure and so on (Wang S. et al., 2020; Wang et al., 2021). Studies on the impact of green economy development on carbon emissions are concentrated within certain sectors or industries. Romano and Yang (2021) propose that the Chinese ministry of transport define the whole coastline as a Domestic Emission Controlled Area (DEAC), where the sulphur limit is set to 0.5%. This strict limit requires ships to use a low sulphur biofuel or use conventional fuel oil with a emission cleaning system. That can help for reducing carbon emission. Yin et al. (2021) indicate that multimodal freight transport features low pollution and high efficiency. It can minimize transportation time and carbon emission by optimal allocation of transportation resources. Peng et al. (2019) study that shore-side electricity technology can replace the auxiliary diesel engines with electricity power supplied from shore so that the air quality and carbon emissions will be improved and reduced. The Central Economic Work Conference in December 2020 proposed “continuing to fight the battle against pollution and achieve synergistic effects in reducing pollution and carbon emissions.” The 14th Five-Year Plan of the National Economic and Social Development of the People’s Republic of China and the Outline of Vision 2035 also emphasized the importance of synergy in “reducing pollution and carbon.” Pollution reduction means reducing pollution emissions, conserving resource consumption, and enhancing environmental governance while maintaining sustained economic growth with a goal of achieving green economic development. Carbon reduction means achieving a continuous decrease in total carbon emissions while maintaining sustained economic growth, requiring a constant decline in carbon emission intensity. Therefore, determining the degree of response of carbon emission intensity to the level of green economic development can provide a reference for the government to formulate and improve the “pollution reduction and carbon reduction” synergy decision.
The previous research results have laid a good foundation. The possible contributions of this study are threefold. First, the latest sink carbon value accounting is based chiefly on the “China Terrestrial Ecosystem Service Value Equivalent Factor Table” and ignores the potential influence of vegetation level on the carbon sink process. NDVI can reflect the vegetation status in the region and characterize the carbon sink level of the same land-use type in different study units, enabling the classical land use carbon emission accounting model to be fine-tuned. Second, although researches have used geography to analyze the spatial differentiation of carbon emissions, most studies focus on the spatial distribution differences of carbon emissions; there are fewer studies on the spatial correlation characteristics and dynamic transfer law of carbon emissions. Third, few studies have considered the influence mechanism and spatial spillover effect of green economic development on carbon emissions. This paper analyzes the spatial mechanism of urban units’ “pollution reduction” level on the “carbon reduction” level from three perspectives: environmental efficiency, resource efficiency, and governance capacity.
The remainder of the paper is organized as follows. The second section presents the methodology and data sources used in this study. Subsequently, the third section gives and analyzes the results and finally, the fourth section presents the conclusion and policy implications.
Land is the second largest source of emissions after energy activities. Unlike other sources of carbon emissions, land is both a carbon source and a carbon sink. Carbon sources mainly include arable land and construction land. Forestland, grassland, water, and unused land are expressed as carbon sinks, which perform carbon sequestration and absorption in the overall carbon cycle. In this paper, carbon emissions are accounted for in both direct and indirect ways, with the former indicating the net carbon emissions from different land types and the latter referring to carbon emissions from human activities, mainly energy consumption (Zhu et al., 2021). The model based on the IPCC inventory is the most widely used method for estimation. The difference in vegetation cover on vegetated land types can result in the same kind of land providing significantly different carbon sink services (Gutman and Ignatov, 1998). Therefore, this study uses the NDVI to reflect the intraregional state and revise the study unit’s carbon sink services. The IPCC inventory estimation model accounts for the construction site’s carbon emissions from energy consumption (Houghton, 2007). The specific equation is set as follows:
Here,
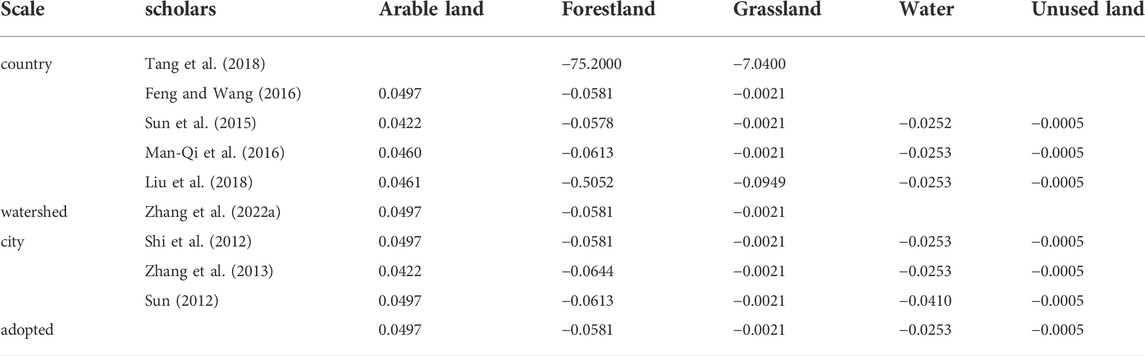
TABLE 1. Carbon emissions and sequestration coefficients of different site types.
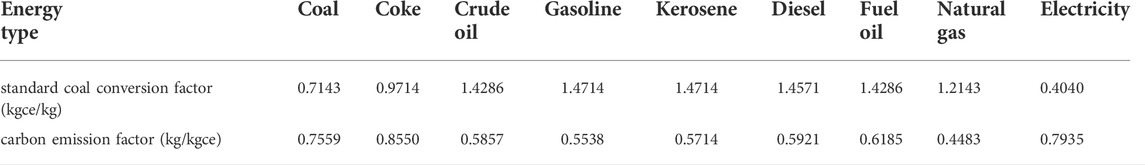
TABLE 2. Standard coal conversion factor of energy.
Analysis of the characteristics and differences in carbon emission spatial patterns focuses on cross-sectional characterization. Exploratory spatial-temporal data analysis (ESTDA) incorporates the temporal dimension into the traditional static exploratory spatial data analysis (ESDA) framework, including the global spatial autocorrelation index (Global Moran’s I), local spatial autocorrelation index (LISA), LISA time path, LISA spatial-temporal leap, spatial Markov chain and other techniques and methods. This analysis can realize the continuous expression of local space dependence from “static scene” to “interactive scene” (Rey and Janikas, 2006). LISA time paths characterize the pairwise movement of urban net carbon emissions and their spatially lagged values in the Moran scatter plot to explain the spatial and temporal interaction dynamics of net carbon emissions at the local scale. The specific equation is set as follows:
Here, T represents the time interval.
LISA spatial-temporal leap represents the transfer of local spatial association types of cities on the LISA scatter diagram in the time direction. There are four types of shifts: Type Ⅰ indicates that both the city itself and the neighboring cities have not shifted; Type Ⅱ demonstrates that only the neighboring cities have shifted and the city itself remains unchanged; Type Ⅲ is the opposite of Type Ⅱ; Type Ⅳ indicates that both the city itself and the neighboring cities have shifted. The spatial stability of Moran’s I can be calculated according to the following equation:
Here,
In accordance with existing studies (Meng et al., 2019; Weng et al., 2020), this paper selects three criteria-level indicators, environmental efficiency (ED), resource efficiency (RC) and governance capacity (EP), to represent the overall level of green economic development, which includes eight specific indicator-level indicators. We use the entropy value method to assign objective weights. It should be noted that this study takes electricity consumption per unit of GDP as a positive indicator and considers that electric energy can replace primary energy (coal, oil, natural gas) in end consumption. The weights are shown in Table 3.
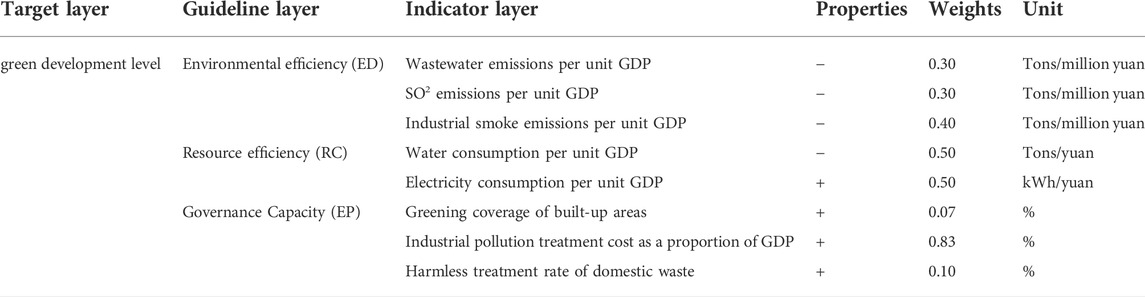
TABLE 3. Economic green development level evaluation index system.
This paper uses a spatial econometric model to explore the utility of the level of green economic development on carbon emissions. The ratio of net carbon emissions obtained from the previous calculation to GDP is chosen as a proxy variable for carbon intensity. The smaller its value is, the more it indicates that the city is at a low-carbon economy level (Sun and Huang, 2022). The general spatial econometric model form is shown below:
Here, Y represents the explained variable. X represents the matrix of mⅹn order explanatory variables, where m is the number of study units and n is the number of explanatory variables. W1Y defines the spatial lag term of the explained variable. ρ is the spatial lag term coefficient. β is the explanatory variable coefficient. θ denotes the spatial lag effect of the explanatory variable, and λ is the degree of spatial dependence of the error term. W1, W2, and W3 are spatial weight matrices. If λ = 0, it is the SDM; if λ = 0 and θ = 0, it is the SLM; and if ρ = 0 and θ = 0, it is the SEM.
Land-use data for 2000, 2005, 2010, 2015 and 2020 for coastal cities in eastern China were obtained from the Resource and Environment Science and Data Center of the Chinese Academy of Sciences (https://www.resdc.cn), with an overall interpretation accuracy of more than 94% (Fang et al., 2022). Referencing the standard of the Chinese Academy of Sciences’ “Classification of Current Land Use” (GB/T21010-2017), this paper reclassified the original data into six categories: arable land, forestland, grassland, construction land, water and unused land by Arcgis 10.2, tailored by coastal city administrative boundary.
Energy consumption and city socioeconomic data were obtained from the China Energy Statistical Yearbook, China Urban Statistical Yearbook and provincial and municipal statistical yearbooks from 2001 to 2020, respectively. The normalized difference vegetation index (NDVI) for 2000–2020 was extracted from SPOT/VEGETATION and MODIS remote sensing images. The data were obtained from the Data Center for Resource and Environmental Sciences, Chinese Academy of Sciences.
The carbon emission level (carbon source) of the social system and the carbon absorption carrying capacity of the natural ecosystem (carbon sink) have regional differences. If the carbon emission intensity exceeds the maximum level of the local natural ecosystem carrying capacity, a carbon deficit (net carbon emission >0) occurs, indicating that the natural-economic system is in an uncoupled and coordinated development state.
According to the results, the total carbon sources in the study area maintains a steady growth trend from 2000 to 2020, from
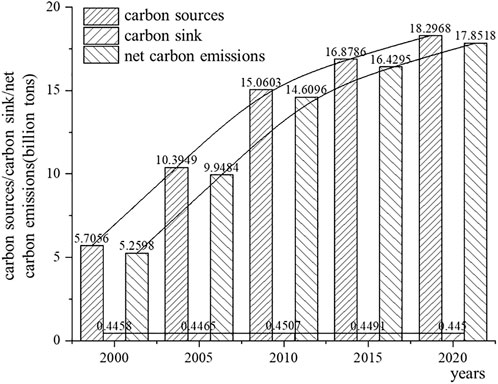
FIGURE 2. Carbon sources/carbon sink/net carbon emissions of coastal regions.
The results of the net carbon emission calculation by province are shown in Figure 3. The high-value areas are mainly concentrated in Jiangsu Province, Shandong Province, Hebei Province, Liaoning Province and other traditional heavy industry and agricultural development provinces, as well as in the economic province of Guangdong. The carbon deficit in Shandong Province has remained the highest in the coastal region for 20 years, but the overall growth rate has gradually slowed to 15%, 7%, 2%, and 1% in the four periods. The adjustment of Shandong’s coal-based energy structure has contributed to the slowdown of net carbon emissions (Deng and Dong, 2016). During the study period, both Guangdong Province and Jiangsu Province were carbon deficit “fermenting” growth regions, with average annual growth rates as high as 12% and 7%, respectively. The carbon deficit gap gradually widened, however, showing serious differences and imbalances.
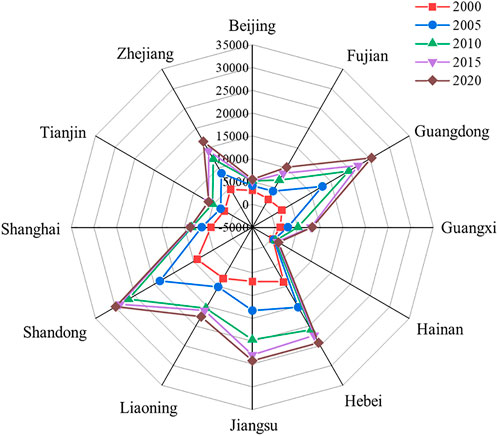
FIGURE 3. Evolution of the carbon deficit in eastern coastal provinces and cities from 2000 to 2020 (million tons).
Under different scales of administrative units, the spatial distribution characteristics of net carbon emissions change with the zoning scale. Cities at the prefecture level and above are responsible for the jurisdiction of the central and provincial administrative units upward and many administrative units such as counties, districts and townships downward. They are the center of regional economic development and ecological protection, as well as the backbone of China’s administrative system. Therefore, further analysis and research on the carbon emissions of urban units in coastal areas can realize the development pattern and trend at a multilevel zoning scale. According to the calculation results, carbon sources and sinks in 2000 can be classified into five levels, from low to high, according to the natural interruption point method. The remaining years are classified with reference to 2000 (Figures 4, 5). To facilitate comparison, the net carbon emissions are classified according to the carbon source classification, and the level of less than 0 (carbon surplus) is added, so the net carbon emissions are classified into six classes (Figure 6). ArcGIS is used to present the results.
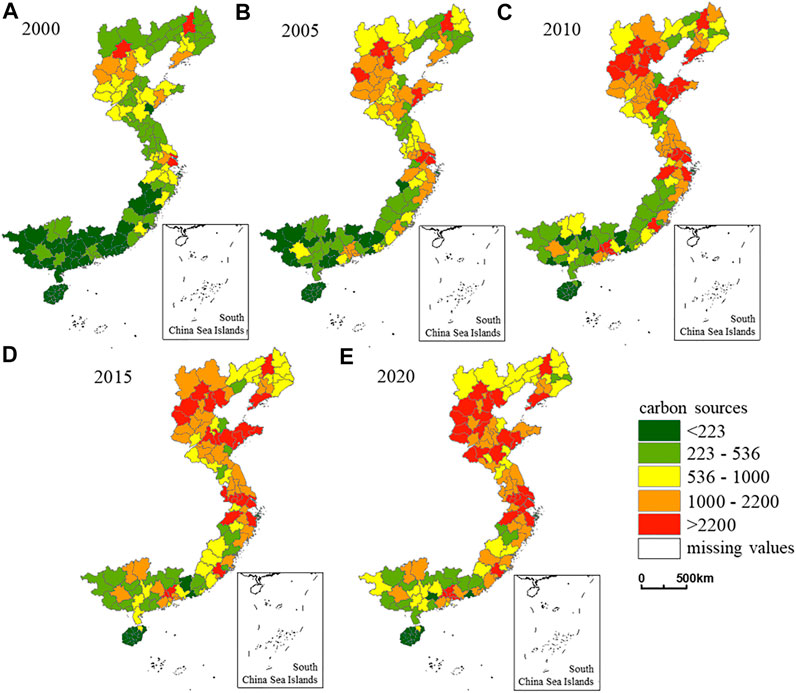
FIGURE 4. Spatial and temporal distribution of carbon sources from 2000 to 2020 (million tons).
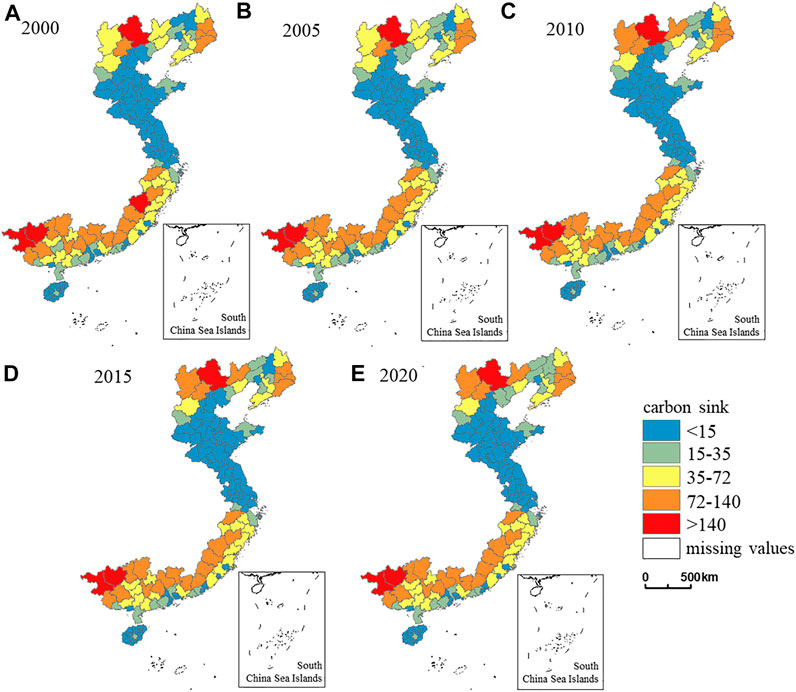
FIGURE 5. Spatial and temporal distribution of carbon sinks from 2000 to 2020 (million tons).
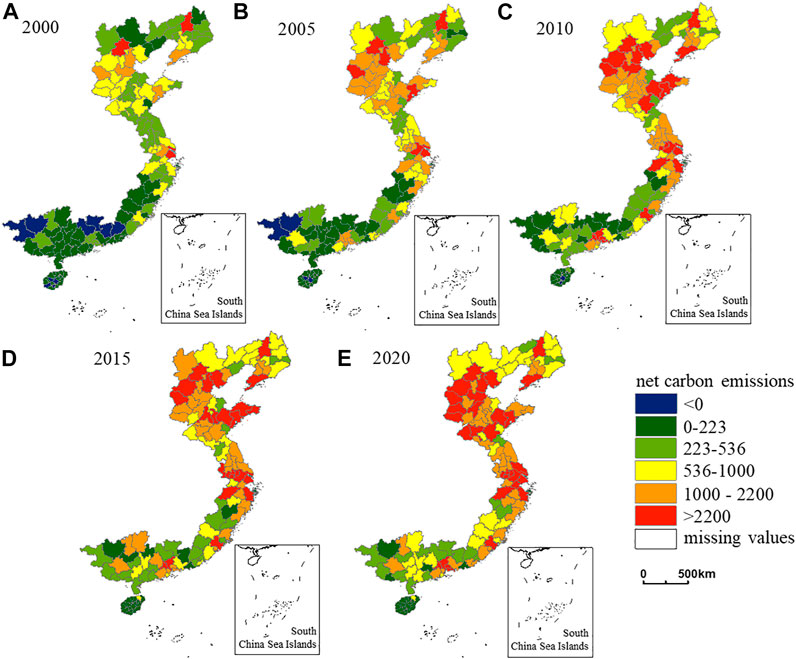
FIGURE 6. Spatial and temporal distribution of net carbon emissions from 2000 to 2020.
In general, the carbon sources of each city differ significantly, showing obvious high-high and low-low clustering patterns (Figure 4). Carbon emissions are high in the northeast and low in the southwest, with particularly high carbon emissions in the Bohai Sea city cluster and the Yangtze River Delta city cluster. In 2000, among the 130 cities in the eastern coastal region, the average value of the carbon source is
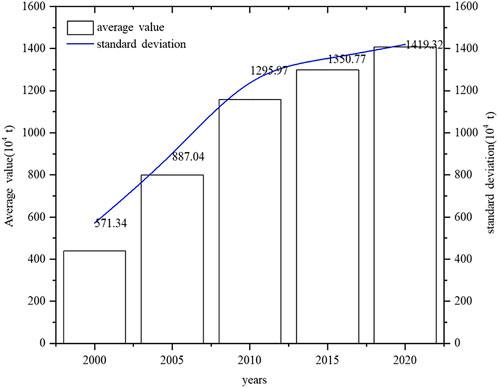
FIGURE 7. Mean and standard deviation of carbon sources from 2000 to 2020.
The spatial distribution pattern of carbon sinks is generally opposite to that of carbon sources. A spatial pattern is formed in which high carbon sink areas are centered in the northeast, southeast and southwest and spread in all directions. The southern areas of Hebei Province, Shandong Province and Jiangsu Province have low forest coverage, and the land types are mainly arable and construction land; hence, the carbon sink services are relatively low. Compared with 2000, in 2020, 55 out of 130 cities achieve a net increase in total carbon sinks, but the rise in carbon sinks is slight. Only Zhangjiakou, Tangshan, Chaoyang, Fuxin, Shenyang and Guigang achieve a jump in rank.
Zero is used as the division benchmark for the carbon deficit and carbon surplus (Figure 6). In 2000, among 130 urban units in the eastern coastal region, 10 cities have a carbon surplus, including Shaoguan, Meizhou, Qingyuan, Heyuan, Baise, Hechi, Baoting Li and Miao Autonomous County, Qiongzhong Li and Miao Autonomous County, Baisha Li Autonomous County, and Ledong Li Autonomous County; these cities are concentrated in Guangdong, Guangxi and Hainan Provinces. Industrial energy-consuming cities such as Shenyang, Nantong and Shijiazhuang and capital-intensive and technology-intensive cities such as Beijing, Shanghai and Tianjin are at the top among the cities with carbon deficits. In contrast, the carbon deficit range gradually spreads from north to south, and the high-value areas of the carbon deficit are mainly concentrated between 31°N and 39°N.
The spatial and temporal evolution of net carbon emissions from 2000 to 2020 is analyzed by calculating the overall regional coefficient of variation and the global Moran’s I index (Table 4). As shown in Table 4, the coefficient of variation shows a “U-shaped” trend of decreasing and then increasing, dropping to the lowest value (1.03) in 2015 and then rebounding. This means that the net carbon emission differences among areas generally show an initial decrease and then an increase. The global Moran’s I index is calculated using ArcGIS 10.2. All of the indices are significant at the 1% level, with z-statistics greater than 2.58. The average value of the global Moran’s I index for multiple years is 0.27, indicating a significant spatial correlation among different urban units. Moran’s I values show an overall increasing trend over time, which means that spatial clustering became increasingly evident.
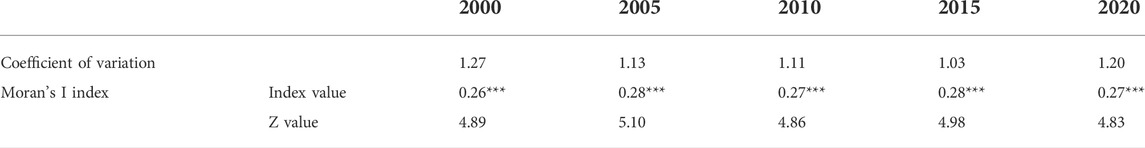
TABLE 4. Net carbon emissions global Moran’s I.
More than 40% of cities have relative movement lengths of time paths greater than or equal to the mean value (mean value of 1), indicating that the overall spatial pattern of net carbon emissions has strong stability. From Figure 8A, it can be seen that, in general, the relative length of LISA time paths gradually decreases from north to south and from sea to land, indicating that the north has a more dynamic local spatial structure than the south and the coast than the inland. The areas with high relative lengths are concentrated in Beijing-Tianjin-Hebei, Shandong Peninsula, Yangtze River Delta city circle and Pearl River Delta city circle. Among the 130 urban units, 10 cities with relative lengths over 2.06 include Shenyang, Weihai, Yantai, Jining, Heze, Foshan, Shenzhen, Guangzhou, Zhongshan, and Dongguan. Thirty-eight cities in Hainan, Guangdong, Guangxi, Zhejiang, Fujian, and Jiangsu have relative lengths below 0.45. Cities with relatively stable spatial structures tend to have stable industrial structures and economic development patterns, so they should increase the use of clean energy and enhance the carbon absorption capacity of ecosystems through ecological remediation, restoration and protection. Regions with strong spatial structure dynamics should eliminate backward production capacity, promote industrial transformation and upgrading, and promote the construction and operation of the low-carbon circular economy.
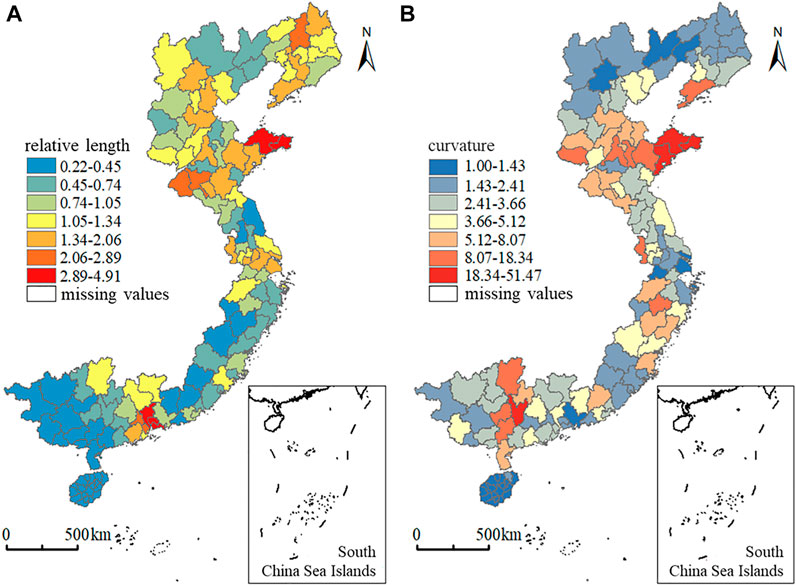
FIGURE 8. Relative length (A) and curvature (B) of net carbon emission time paths.
In terms of curvature (Figure 8B), the curvature of the time path for all 130 urban units between 2000 and 2020 is greater than one, indicating a strong spatial dependence of net urban carbon emissions. As shown in Figure 8B, Tianjin, Hebei, the Yangtze River Delta, and the Pearl River Delta show lower curvatures of net carbon emissions. These cities and neighboring cities simultaneously have higher net carbon emissions growth processes. The fluctuations of spatial dependence influence and hold each other, resulting in a smaller curvature. Areas with high values of curvature mainly appear in the Liaodong Peninsula (Dalian), Shandong Peninsula (Zibo, Weihai, Jinan, Yantai, Weifang, Qingdao) and eastern Guangxi (Guigang, Guilin, Wuzhou, Yulin) and are concentrated in the junction zone between high and low net carbon emission areas. The spatial dependence variation process is more dynamic and subject to neighboring cities’ spatial spillover or polarization.
The results of the spatial-temporal leap are shown in Tables 5, 6. The spatial correlation pattern of net carbon emissions of urban units in coastal areas is more stable. The probability of occurrence of the four spatial-temporal leap types is Type I (0.860) > Type II (0.073) > Type III (0.057) > Type IV (0.010), indicating that the probability of no spatial association pattern shift in 20 years is 86.0%. The spatial-temporal leap shows a path-locking solid characteristic. The highest probability in Type I is LL→LL (0.426). In Type II, the most stable spatial association transfer probability is HH→LH (0.031), which indicates that the spatial association of net carbon emissions changes from “double high” to “depression”. Some cities with high net carbon emissions achieve a continuous reduction through the spatial transfer of high carbon emission industries. The cities with the lowest probability of spatial association leap are HL→LL (0.008) and LL→HL (0.008). It is difficult for cities to shift their own carbon emission level under their neighbors’ firm low carbon emission control. In Type III, the highest probability is HL→HH (0.017), reflecting the significant spatial spillover effect of high carbon emission cities. The neighbors with low carbon emissions are influenced by a high carbon emission pull. In type IV, the highest spatial leap probability is LL→HH (0.006), and the lowest is HL→LH (0.000) and HH→LL (0.000).
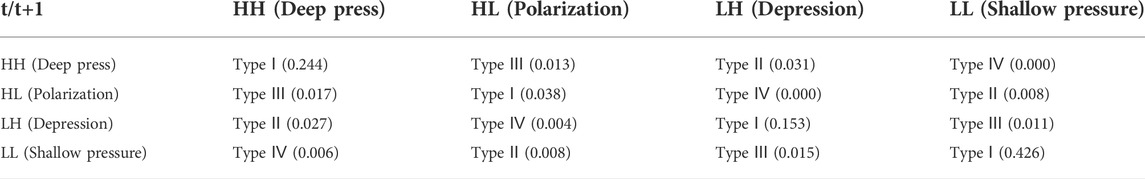
TABLE 5. Spatial and temporal leap matrix of net carbon emissions.
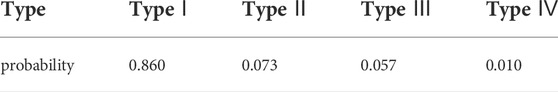
TABLE 6. Types of spatial and temporal leaps in net carbon emissions.
The analysis of the spatial characteristics of carbon emissions shows that carbon emissions present prominent geospatial clustering characteristics. Therefore, this paper selects the 0–1 adjacency weight matrix (W1) for empirical testing and analysis and the Euclidean inverse distance spatial weight matrix (W2) for robustness testing.
Because of the unavailability of data for some cities in Hainan, only panel data containing 114 urban units are introduced into the SDM in this paper. Stata 16.0 is used to calculate the univariate global Moran index of carbon emission intensity (CI) of coastal cities from 2000 to 2020 and its bivariate global Moran index with economic green development level (EG), environmental efficiency (ED), resource efficiency (RC) and governance capacity (EP) (Table 7). It can be seen that the Moran indices of the variables all passed the significance test. This indicates that the choice of a spatial econometric model for the empirical study is reasonable.
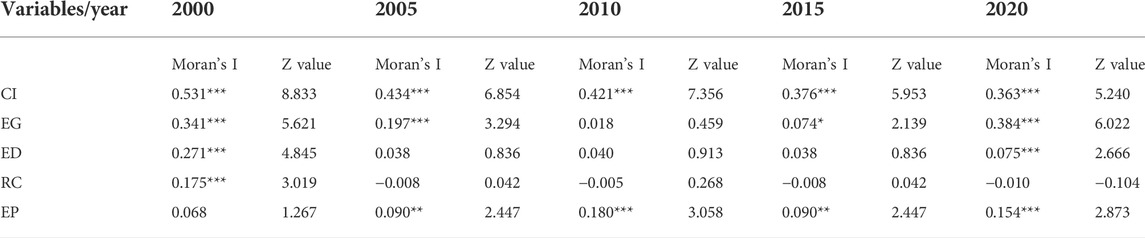
TABLE 7. Moran index calculation results.
Given that this paper uses only five time series of the panel data, a number much smaller than the 130 cross-sectional cells and typical of short panel data, there is no need to conduct unit root tests and cointegration tests (Chen, 2010).
The results of the spatial autocorrelation test determine that a spatial econometric model should be used; however, the specific type of spatial econometric model that should be constructed still needs further testing. First, the Lagrange multiplier test (LM) is used to determine that the spatial Durbin model (SDM) should be selected. Second, the Hausman test is used to determine that a fixed-effects model should be constructed. Third, the LR likelihood ratio test is used to determine that the SDM model could not degenerate into an SAR model or SEM, which again verifies the reliability. Finally, the LR test determines that the SDM model with individual fixed effects should be selected. The specific test results are shown in Table 8.
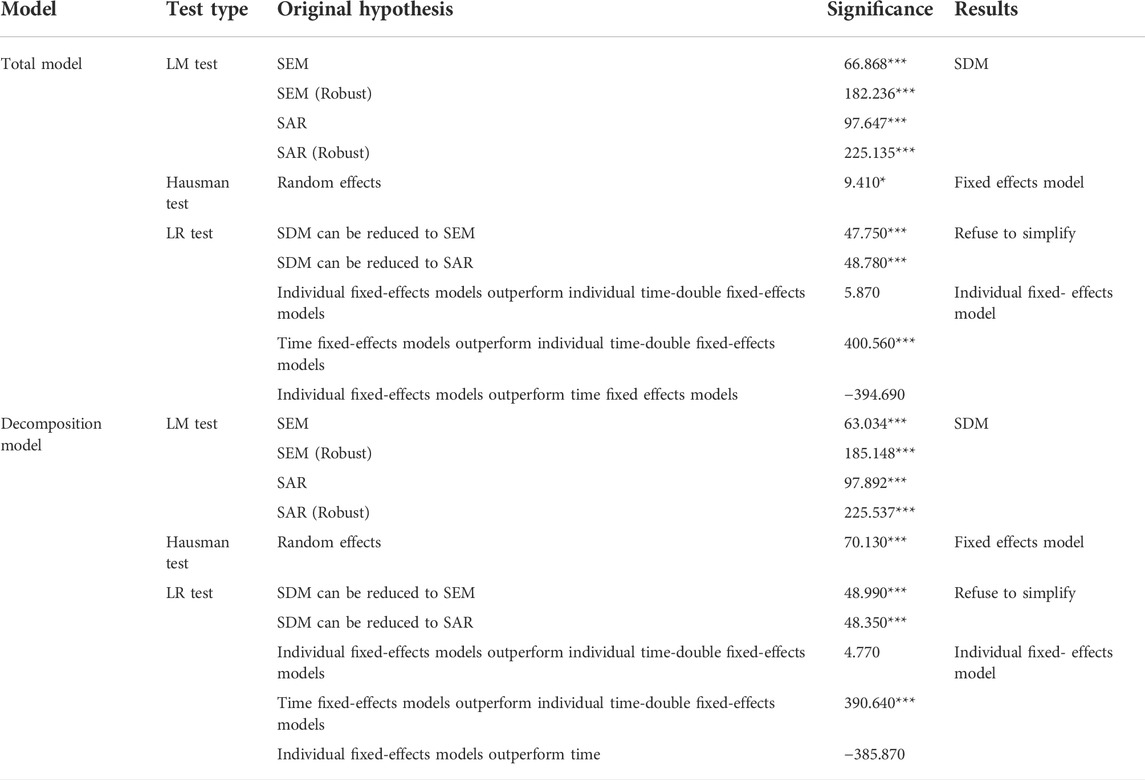
TABLE 8. Related test results.
Through correlation tests, this paper determines that the individual fixed-effect SDM model can be used to study the spatial influence effect of the impact of green economic development on carbon emissions in the eastern coastal region. The following SDM models are constructed.
Here, i, t, and CI represent city, year and carbon emission intensity, respectively. EG, ED, RC, and EP represent the economic green development level, environmental efficiency, resource efficiency and governance capacity, respectively. Col represents the control variable. αi andβi are parameters to be estimated. μi is the individual city fixed effect. εit is the random error term. Wij is the spatial weight matrix. Based on the existing studies combined with available data, Gross Domestic Product (GDP, million yuan), GDP per capita (RGDP, yuan/person), total population at the end of the year (10,000 people), the proportion of primary, secondary and tertiary industries in GDP (%), energy consumption (million tons of standard coal), and population urbanization rate (%) are selected as control variables (Meng et al., 2018; Yang et al., 2019). Money-based indicators are deflated at constant 2000 prices. Equations 1, 2 are estimated using the great likelihood estimation method. The regression results are shown in Table 9.
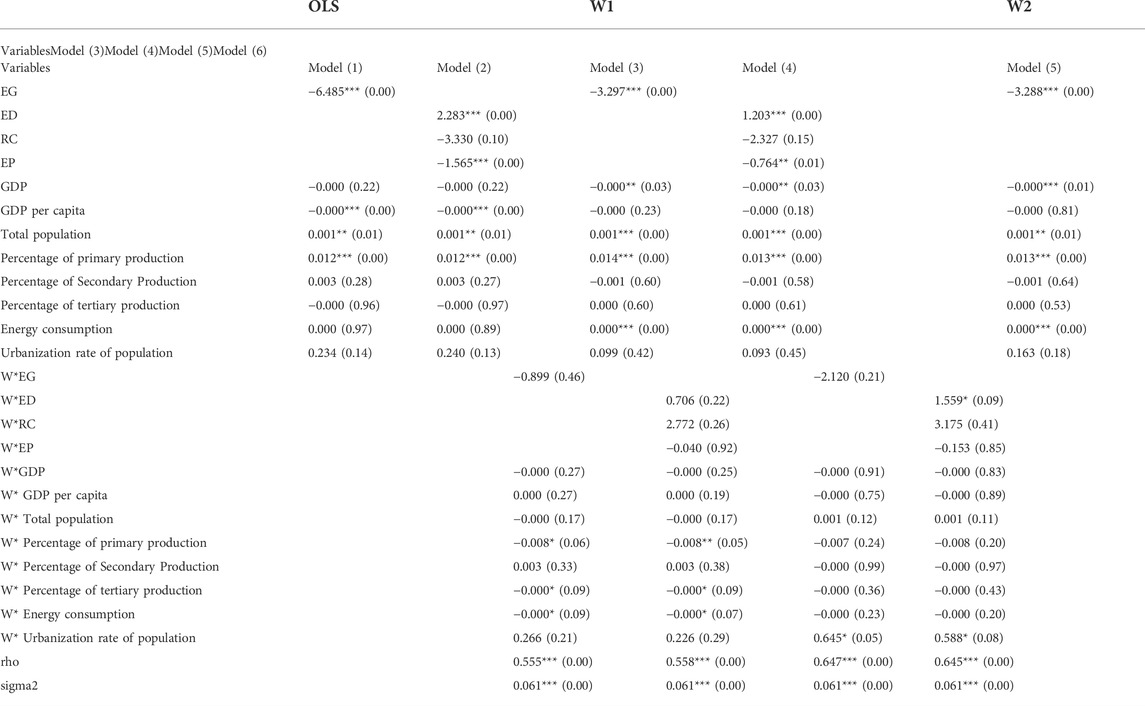
TABLE 9. Regression results of OLS and spatial Durbin model.
The OLS regression incorporates both time and individual two-way fixed effects. As seen from Table 9, the results are basically consistent for both the 0–1 adjacency weight matrix and the inverse distance weight matrix, indicating that the results are more robust. The results of the two spatial Durbin models are also consistent with OLS. The signs and statistical significance of the main variables remain unchanged. Only the magnitudes of parameter estimates are somewhat different. The spatial panel weakens the influence of the element of one’s own green economic development on carbon emission intensity. It subsumes part of the influence into the spatial lag variables indicating the spillover effect of neighboring cities. Meanwhile, the spatial lag term of the total green economic development indicator and the decomposition indicator are basically insignificant. This may be due to the inclusion of the spatial lag term in the SDM model, which ignores the feedback between adjacent regions and the bias of the point estimate. Therefore, the effect of the explanatory variable on the explained variable cannot be simply characterized by the above regression coefficient (Li and Song, 2022). This kind of effect needs to be decomposed into direct and indirect effects. The results of the effect decomposition are shown in Table 10. Under the individual fixed-effect SDM model, the direct effect of EG on carbon emission intensity is significant. The sign does not change, which is consistent with the previous conclusion. This indicates that green economic development generally benefits for the reduction in carbon emission intensity. In addition, its indirect effect is significantly negative at the 5% level, which indicates that green economic development can have a diffusion effect on neighboring areas and thus promote their carbon emission reduction.
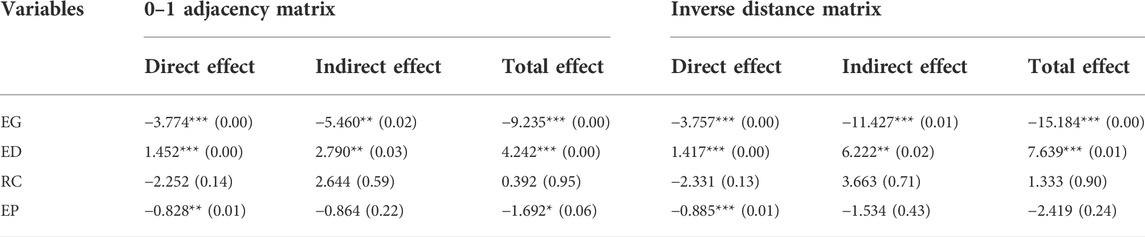
TABLE 10. Decomposition of the spatial spillover effect of ecological protection elements.
To explore the specific path of the spatial spillover effect of the green economic development level, this paper further introduces the three component indicators of the economic green development level, environmental efficiency, resource efficiency and governance capacity into the spatial SDM model. As seen from Table 10, only the indirect effect of environmental efficiency is significantly positive, indicating that the environmental pollution intensity of the region is not only positively related to the carbon emission intensity of the region but also closely related to the carbon emission intensity of the neighboring regions. On the other hand, the governance capacity index is only positively correlated with carbon emissions in the region. It does not significantly affect the intensity of carbon emissions in the neighboring regions.
Theoretically, industrial carbon emissions and sulfur dioxide, soot, nitrogen oxides and other pollutants have the same origin, and the intensity of environmental pollutant emissions is positively correlated with carbon emissions intensity. Meanwhile, the high level of green economic development can reflect lower pollution emissions, higher resource utilization efficiency and higher environmental governance capacity. They can reflect an increased ability to reduce carbon emissions. The ability comes primarily from technology innovation including production and environmental technology, industrial structure upgrading, optimal allocation of production elements, clean energy usage and increase of vegetation area (Peng et al., 2019; Romano and Yang, 2021; Yin et al., 2021). In terms of indirect effects, the production and pollution control technology innovation of the city can drive technology improvement of neighboring cities through technology-related effect and spillover effect. The technology-related effect refers to if one enterprise carries out technological innovation, those enterprises in related industries are requires to adopt technological innovation activities. The technology spillover effect refers to that the technology innovation of enterprises has a great inspiration and promotion effect on other enterprises in related industries. Besides, the government in neighboring cities will take strict market regulation instruments to enhance environmental quality based on political considerations, promoting optimal allocation of elements, industrial structure upgrading and clean usage. Obviously, the governance capacity (EP) indicators have only a relatively significant negative direct effect. The indirect effect does not pass the significance test, indicating no spatial spillover effect of governance capacity. This result indicates that once pollution and CO2 are released into the natural environment, the effect of governance is limited extremely.
By using the panel data of 130 urban units in the eastern coastal region from 2000 to 2020 and introducing the NDVI adjustment index to modify the land-use carbon emission accounting model, this study measures the carbon source, carbon sink and net carbon emission levels. Then, we adopt the exploratory spatial-temporal data analysis (ESTDA) to analyze the spatial pattern of carbon emissions in the coastal region from the spatial-temporal interaction perspective. Finally, the spatial econometric model is introduced to analyze the effect of green economic development on carbon emission intensity in 114 urban units. The following conclusions are drawn: 1) from 2000 to 2020, both the carbon source and net carbon emissions in the eastern coastal region show yearly growth trends, with average annual growth rates of 6.0% and 6.3%, respectively. The annual average value of the carbon sink is generally maintained at approximately 45 million tons, with relatively small changes. Carbon sources and net carbon emissions show that the north has larger emissions than the south, and economically developed regions have larger emissions than economically less developed regions. The distribution pattern of carbon sinks is roughly opposite to their trend. The carbon deficit gradually spreads from north to south, and the carbon surplus decreases from 10 in 2000 to 0 in 2020. The carbon balance of regional ecosystems is severely out of balance. 2) The coefficient of variation of net carbon emissions and Moran’s I index show an increasing trend. The net carbon emissions of each urban unit have a very significant spatial autocorrelation characteristic, and the spatial agglomeration characteristic becomes increasingly apparent. The curvature of the LISA time paths is higher in the south and lower in the north. The temporal path curvature in the study area is greater than one, indicating a strong spatial dependence of net carbon emissions. 3) Both the direct and indirect effects of the economic green development level on carbon emission intensity are significantly negative, indicating that the economic green development level effectively plays a role in reducing carbon emission intensity. This effect can cross interregional boundaries to achieve regional joint emission reduction. Further analysis of the effect of the economic green development level decomposition index on carbon emission intensity shows that only environmental efficiency has a significant spatial association with carbon emission intensity.
Seeking optimal paths for carbon emission reduction at different spatial and temporal scales is a crucial issue for achieving China’s green and low-carbon transition’s near-, medium-, and long-term goals. Since spatial differences at small scales are more sensitive to macroeconomic fluctuations, the national task of achieving China’s carbon emission reduction targets must be decomposed into regions (Zhang et al., 2021). Especially for coastal regions with large energy consumption levels and total carbon emissions, it is crucial to identify critical areas in achieving carbon emission reduction targets and then adopt targeted policies. Based on the above analysis, the main policy implications of this paper are as follows.
First, the urban carbon deficit in coastal areas is expanding. Ecosystem carbon sink services are far from being able to offset the carbon emissions brought about by economic production. Therefore, to maintain high-quality socioeconomic development, the focus of emission reduction should be on optimizing the energy consumption structure, upgrading energy utilization efficiency, and actively developing green renewable energy. Industrial restructuring should be accelerated for regions with a more volatile spatial structure of net carbon emissions. However, for regions with a more stable spatial structure, optimization of carbon emission reduction technology is key. Second, this paper finds an obvious positive spatial correlation regarding net carbon emissions in coastal areas. This correlation should be taken into account in future carbon emission reduction policy formulation. The governance and monitoring of carbon emission intensity in key regions should be strengthened. A joint working group on carbon emission reduction can be established for urban clusters with high carbon emission intensity, such as Beijing-Tianjin-Hebei, Yangtze River Delta and Pearl River Delta, to coordinate regional carbon emission reduction targets and implementation plans. Third, in the eastern coastal region of China, we should focus more on carbon reduction in the production process rather than adopting carbon sink means after carbon emissions are generated. The government should increase support for research institutes, universities and key laboratories in renewable energy and adopt some pollution control instruments to promote industrial structure upgrading and optimal allocation of production elements. The focus should be on breaking through crucial technical bottlenecks such as energy conservation, low-carbon, energy storage and intelligence.
Publicly available datasets were analyzed in this study. This data can be found here: https://www.resdc.cn/.
LP designed this study and performed the empirical analysis of the data. JY contributed significantly to manuscript preparation and revised the manuscript critically for important intellectual content. LL put forward valuable ideas and revised the manuscript critically.
This study was supported by the National Natural Science Foundation of China (71904203).
The authors declare that the research was conducted in the absence of any commercial or financial relationships that could be construed as a potential conflict of interest.
All claims expressed in this article are solely those of the authors and do not necessarily represent those of their affiliated organizations, or those of the publisher, the editors and the reviewers. Any product that may be evaluated in this article, or claim that may be made by its manufacturer, is not guaranteed or endorsed by the publisher.
Achard, F., Eva, H. D., Mayaux, P., Stibig, H. J., and Belward, A. (2004). Improved estimates of net carbon emissions from land cover change in the tropics for the 1990s. Glob. Biogeochem. Cycles 18 (2), 142–150. doi:10.1029/2003gb002142
Adelisardou, F., Zhao, W., Chow, R., Mederly, P., Minkina, T., and Schou, J. S. (2022). Spatiotemporal change detection of carbon storage and sequestration in an arid ecosystem by integrating Google Earth Engine and InVEST (the Jiroft plain, Iran). Int. J. Environ. Sci. Technol. (Tehran). 19 (7), 5929–5944. doi:10.1007/s13762-021-03676-6
Andersen, L. E., Doyle, A. S., del Granado, S., Ledezma, J. C., Medinaceli, A., Valdivia, M., et al. (2016). Net carbon emissions from deforestation in Bolivia during 1990-2000 and 2000-2010: Results from a carbon bookkeeping model. Plos One 11 (3), e0151241. doi:10.1371/journal.pone.0151241
Arcidiacono, A., Ronchi, S., and Salata, S. (2015). “Ecosystem services assessment using InVEST as a tool to support decision making process: Critical issues and opportunities,” in 15th International Conference on Computational Science and Its Applications (ICCSA), Reykjavik, Iceland, June 1–3, 2015 (ICCSA), 35–49.
Baumann, M., Gasparri, I., Piquer-Rodrguez, M., Pizarro, G. G., Griffiths, P., Hostert, P., et al. (2017). Carbon emissions from agricultural expansion and intensification in the Chaco. Glob. Chang. Biol. 23 (5), 1902–1916. doi:10.1111/gcb.13521
Chen, Q. (2010). Advanced econometrics and stata applications. Beijing, China: Higher Education Press.
Chen, Z., Chen, H., Wang, L., and Guo, W. (2020). Factors of enterprise carbon performance: An empirical study of public shipping company in coastal regions of China. J. Coast. Res. 107 (1), 268265–268272. doi:10.2112/jcr-si107-066.1
Deng, C., and Dong, J. F. (2016). Coal consumption reduction in Shandong province: A dynamic vector autoregression model. Sustainability 8 (9), 871. doi:10.3390/su8090871
Fang, Z., Ding, T. H., Chen, J. Y., Xue, S., Zhou, Q., Wang, Y. D., et al. (2022). Impacts of land use/land cover changes on ecosystem services in ecologically fragile regions. Sci. Total Environ. 831, 154967. doi:10.1016/j.scitotenv.2022.154967
Feng, J., and Wang, T. (2016). Analysis of influencing factors and evolution of land use carbon emission in China. Soft Sci. 30 (5), 87–90. doi:10.13956/j.ss.1001-8409.2016.05.19
Fu, L., Chen, Y., Xia, Q., and Miao, J. (2022). Impact of economic policy uncertainty on carbon emissions: Evidence at China’s city level. Front. Energy Res. 10, 866217. doi:10.3389/fenrg.2022.866217
Fu, L., and Liu, A. (2021). Data: China statistical yearbook. China Power Project. Beijing, China: China Statistics Press.
Gutman, G., and Ignatov, A. (1998). The derivation of the green vegetation fraction from NOAA/AVHRR data for use in numerical weather prediction models. Int. J. Remote Sens. 19 (8), 1533–1543. doi:10.1080/014311698215333
He, C., Liu, L., Duan, Z., Li, G., and Wang, S. (2015). Analysis of influence factors and reduction measures of chinas carbon emissions under the environment of ecological civilization. Environ. Eng. 33 (11), 147–151.
He, Q. S., Zeng, C., Xie, P., Liu, Y. L., and Zhang, M. K. (2018). An assessment of forest biomass carbon storage and ecological compensation based on surface area: A case study of hubei province, China. Ecol. Indic. 90, 392–400. doi:10.1016/j.ecolind.2018.03.030
Hinge, G., Surampalli, R. Y., and Goyal, M. K. (2018). Regional carbon fluxes from land-use conversion and land-use management in northeast India. J. Hazard. Toxic. Radioact. Waste 22 (4), 404. doi:10.1061/(asce)hz.2153-5515.0000404
Houghton, R. A. (2007). Balancing the global carbon budget. Annu. Rev. Earth Planet. Sci. 35, 313–347. doi:10.1146/annurev.earth.35.031306.140057
Houghton, R. A., and Hackler, J. L. (1999). Emissions of carbon from forestry and land-use change in tropical Asia. Glob. Change Biol. 5 (4), 481–492. doi:10.1046/j.1365-2486.1999.00244.x
Houghton, R. A., and Hackler, J. L. (2006). Emissions of carbon from land use change in sub-Saharan Africa. J. Geophys. Res. 111 (G2), 76. doi:10.1029/2005jg000076
Houghton, R. A., Hackler, J. L., and Lawrence, K. T. (1999). The US carbon budget: Contributions from land-use change. Science 285 (5427), 574–578. doi:10.1126/science.285.5427.574
Houghton, R. A. (2003). Revised estimates of the annual net flux of carbon to the atmosphere from changes in land use and land management 1850-2000. Tellus B 55 (2), 378–390. doi:10.1034/j.1600-0889.2003.01450.x
Jiang, Z. D., Yin, S., Zhang, X. X., Li, C. S., Shen, G. R., Zhou, P., et al. (2017). Research and development of a DNDC online model for farmland carbon sequestration and GHG emissions mitigation in China. Int. J. Environ. Res. Public Health 14 (12), 1493. doi:10.3390/ijerph14121493
Li, C. S., Frolking, S., and Frolking, T. A. (1992). A model of nitrous-oxide evolution from soil driven by rainfall events .1. Model structure and sensitivity. J. Geophys. Res. 97 (D9), 9759–9776. doi:10.1029/92jd00509
Li, Y. M., and Song, J. W. (2022). A comparative study of carbon tax and fuel tax based on panel spatial econometric model. Environ. Sci. Pollut. Res. 29 (11), 15931–15945. doi:10.1007/s11356-021-16650-z
Liu, Z., Tan, H., Wang, F., and You, X. (2018). Analysis of the impact factors on carbon emission in Fujian province. IOP Conf. Ser. Earth Environ. Sci. 170, 032025. doi:10.1088/1755-1315/170/3/032025
MacLean, M. G., Duveneck, M. J., Plisinski, J., Morreale, L. L., Laflower, D., and Thompson, J. R. (2021). Forest carbon trajectories: Consequences of alternative land-use scenarios in New England. Glob. Environ. Change 69, 102310. doi:10.1016/j.gloenvcha.2021.102310
Man-Qi, L. U., Xin-Wang, X. U., and Wang, Q. (2016). Effects of land use patterns on carbon emissions and spatial-temporal difference in Anhui province. Energy Environmental Protection 35 (5), 30–37.
Meng, B., Zhou, L. Y., Qu, L., and Abedin, M. Z. (2019). Measurement of urban green economy development - an empirical analysis from 31 provinces in China. Ekoloji 28 (107), 2069–2082.
Meng, Z. S., Wang, H., and Wang, B. N. (2018). Empirical analysis of carbon emission accounting and influencing factors of energy consumption in China. Int. J. Environ. Res. Public Health 15 (11), 2467. doi:10.3390/ijerph15112467
Paustian, K., Ravindranath, N. H., and Amstel, A. V. (2006). 2006 IPCC guidelines for national greenhouse gas inventories. International Panel on Climate Change.
Peng, Y., Li, X., Wang, W., Wei, Z., Bing, X., and Song, X. (2019). A method for determining the allocation strategy of on-shore power supply from a green container terminal perspective. Ocean Coast. Manag. 167, 158–175. doi:10.1016/j.ocecoaman.2018.10.007
Piao, D., Lee, W.-K., Zhu, Y., 김문일 , , and Song, C. (2016). Assessment of forest degradation and carbon storage for REDD+ project in north Korea. Korean J. Environ. Biol. 34 (1), 1–7. doi:10.11626/kjeb.2016.34.1.001
Rey, S. J., and Janikas, M. V. (2006). Stars: Space–Time analysis of regional systems. Geogr. Anal. 38 (1), 67–86. doi:10.1111/j.0016-7363.2005.00675.x
Romano, A., and Yang, Z. (2021). Decarbonisation of shipping: A state of the art survey for 2000–2020. Ocean Coast. Manag. 214, 105936. doi:10.1016/j.ocecoaman.2021.105936
Shi, H. X., Xing-Min, M. U., Zhang, Y. L., and Ming-Quan, L. (2012). Effects of different land use patterns on carbon emission in guangyuan city of sichuan province. Bull. Soil Water Conservation 32 (2), 101–106. doi:10.13961/j.cnki.stbctb.2012.03.020
Sun, H., Liang, H. M., Chang, X. L., Cui, Q. C., Tao, Y., Geography, , et al. (2015). Land use patterns on carbon emission and spatial association in China. Econ. Geogr. 20 (5), 39–42. doi:10.15957/j.cnki.jjdl.2015.03.023
Sun, W., and Huang, C. C. (2022). Predictions of carbon emission intensity based on factor analysis and an improved extreme learning machine from the perspective of carbon emission efficiency. J. Clean. Prod. 338, 130414. doi:10.1016/j.jclepro.2022.130414
Sun, X. B. (2012). Effects of carbon emission by land use patterns in hefei's economic circle of anhui province. J. Nat. Resour. 27 (3), 394–401.
Tang, X., Zhao, X., Bai, Y., Tang, Z., Wang, W., Zhao, Y., et al. (2018). Carbon pools in China’s terrestrial ecosystems. Proc. Natl. Acad. Sci. U. S. A. 115 (16), 4021–4026. doi:10.1073/pnas.1700291115
Tian, S., Wang, S., Bai, X., Luo, G., Li, Q., Yang, Y., et al. (2021). Global patterns and changes of carbon emissions from land use during 1992–2015. Environ. Sci. Ecotechnology 7, 100108. doi:10.1016/j.ese.2021.100108
Wang, S. H., Song, M. L., and Yu, T. (2019). Hidden carbon emissions, industrial clusters, and structure optimization in China. Comput. Econ. 54 (4), 1319–1342. doi:10.1007/s10614-016-9570-7
Wang, S. H., Tang, Y., and Song, M. L. (2020b). Export trade, embodied carbon emissions, and environmental pollution: An empirical analysis of China’s high and new tech industries. J. Environ. Manag. 276, 110–371. doi:10.1016/j.jenvman.2020.111371
Wang, S., Li, Z., and Zhang, H. (2021). Does female labor share reduce embodied carbon in trade? Environ. Sci. Pollut. Res. 28 (7), 8246–8257. doi:10.1007/s11356-020-11172-6
Wang, S., Wang, X., and Tang, Y. (2020a). Drivers of carbon emission transfer in China—an analysis of international trade from 2004 to 2011. Sci. Total Environ. 709, 135924. doi:10.1016/j.scitotenv.2019.135924
Wang, S., and Yi, X. (2022). Can the financial industry ‘anchor’ carbon emission reductions? Energy & Environ. 22 (5), 100–105. doi:10.1177/0958305X211061810
Weng, Q. Q., Qin, Q. D., and Li, L. (2020). A comprehensive evaluation paradigm for regional green development based on "Five-Circle model": A case study from BeijingTianjin-hebei. J. Clean. Prod. 277, 124076. doi:10.1016/j.jclepro.2020.124076
Xu, Q., Yang, R., Dong, Y. X., Liu, Y. X., and Qiu, L. R. (2016). The influence of rapid urbanization and land use changes on terrestrial carbon sources/sinks in Guangzhou, China. Ecol. Indic. 70, 304–316. doi:10.1016/j.ecolind.2016.05.052
Yang, G. C., Shang, P. P., He, L. C., Zhang, Y. C., Wang, Y., Zhang, F., et al. (2019). Interregional carbon compensation cost forecast and priority index calculation based on the theoretical carbon deficit: China as a case. Sci. Total Environ. 654, 786–800. doi:10.1016/j.scitotenv.2018.11.134
Yin, C., Ke, Y., Chen, J., and Liu, M. (2021). Interrelations between sea hub ports and inland hinterlands: Perspectives of multimodal freight transport organization and low carbon emissions. Ocean Coast. Manag. 214, 105919. doi:10.1016/j.ocecoaman.2021.105919
Zhang, P. Y., He, J. J., Hong, X., Zhang, W., Qin, C. Z., Pang, B., et al. (2018). Carbon sources/sinks analysis of land use changes in China based on data envelopment analysis. J. Clean. Prod. 204, 702–711. doi:10.1016/j.jclepro.2018.08.341
Zhang, S., Wang, J., and Zheng, W. (2017). Spatio-temporal difference of transportation carbon emission and its influencing factors in China. Acta Sci. Circumstantiae 37 (12), 4787–4797. doi:10.13671/j.hjkxxb.2017.0242
Zhang, T., Cai, H. S., and Zhong, G. Z. (2013). Carbon emission effect of land use in nanchang and optimizing measures. J. Jiangxi Agric. Univ. 5, 63–68. doi:10.22004/ag.econ.161947
Zhang, Y., Pan, J., Zhang, Y., and Xu, J. (2021). Spatial-temporal characteristics and decoupling effects of China’s carbon footprint based on multi-source data. J. Geogr. Sci. 31 (3), 327–349. doi:10.1007/s11442-021-1839-7
Zhang, Y., Yu, Z., and Zhang, J. (2022a). Spatiotemporal evolution characteristics and dynamic efficiency decomposition of carbon emission efficiency in the Yellow River Basin. PLOS ONE 17, e0264274. doi:10.1371/journal.pone.0264274
Zhang, Z., Lao, Y., Zhao, N., Wei, J., and Hu, B. (2022b). Decoupling relationship of landuse carbon emission reduction and economic growth in Guangdong province. Bull. Soil Water Conservation 42 (1), 250. doi:10.13961/j.cnki.stbctb.2022.01.033
Zhao, S. Q., Liu, S. G., Sohl, T., Young, C., and Werner, J. (2013). Land use and carbon dynamics in the southeastern United States from 1992 to 2050. Environ. Res. Lett. 8 (4), 044022. doi:10.1088/1748-9326/8/4/044022
Keywords: land use, carbon emissions, green economic development, exploratory spatialtemporal data analysis, spatial econometric model
Citation: Pan L, Yu J and Lin L (2022) The temporal and spatial pattern evolution of land-use carbon emissions in China coastal regions and its response to green economic development. Front. Environ. Sci. 10:1018372. doi: 10.3389/fenvs.2022.1018372
Received: 13 August 2022; Accepted: 22 August 2022;
Published: 15 September 2022.
Edited by:
Shuhong Wang, Shandong University of Finance and Economics, ChinaReviewed by:
Shaoyang Chen, Tianjin University, ChinaCopyright © 2022 Pan, Yu and Lin. This is an open-access article distributed under the terms of the Creative Commons Attribution License (CC BY). The use, distribution or reproduction in other forums is permitted, provided the original author(s) and the copyright owner(s) are credited and that the original publication in this journal is cited, in accordance with accepted academic practice. No use, distribution or reproduction is permitted which does not comply with these terms.
*Correspondence: Jing Yu, Ynk2ODAxQG91Yy5lZHUuY24=
Disclaimer: All claims expressed in this article are solely those of the authors and do not necessarily represent those of their affiliated organizations, or those of the publisher, the editors and the reviewers. Any product that may be evaluated in this article or claim that may be made by its manufacturer is not guaranteed or endorsed by the publisher.
Research integrity at Frontiers
Learn more about the work of our research integrity team to safeguard the quality of each article we publish.