 Yongzhao Sun1
 Xiaoyan Wang1,2,3*
- 1Department of Atmospheric and Oceanic Sciences and Institute of Atmospheric Sciences, Fudan University, Shanghai, China
- 2CMA-FDU Joint Laboratory of Marine Meteorology, Shanghai, China
- 3Shanghai Institute of Pollution Control and Ecological Security, Shanghai, China
With the implementation of various stringent emission reduction measures since 2013 in China, significant declines in fine particle (PM2.5) concentrations have occurred nationwide. However, China has suffered from increasing levels of ozone pollution in eastern urban areas. Many studies focus on the chemical interaction between PM2.5 and O3, but the meteorological mechanisms of the seesaw variation pattern between them are still unclear. Taking the megacity Shanghai (SH) as an example, we explored the meteorological causes of two types of PM2.5-O3 concentration variation seesaw events, i.e., high PM2.5 concentration with low O3 concentration (Type-one) events and low-PM-high-O3 (Type-two) seesaw events. The backward trajectories of the 144 Type-one events are divided into three clusters. Among the three clusters of Type-one seesaw events, the boundary layer height decreases by 20.53%–53.58%, and the wind speed decreases by 17.99%–28.29%, which is unfavorable for the diffusion of local air pollutants and contributes to the accumulation of PM2.5. Additionally, a backward air mass with a high content of PM2.5 plays an important role in the Type-one events, especially in the case of cluster one. In terms of cluster two, the increase in cloud cover, decrease in solar radiation and increase in relative humidity also promote the hygroscopic growth of aerosols and suppress the production of O3. As for cluster three, higher cloud cover and relative humidity contribute to the seesaw pattern of PM and O3. The 64 Type-two seesaw events are divided into two clusters. O3-rich air masses from the nearby east sea surface and remote northeast China increase the local O3 of SH. Moreover, in cluster one, high boundary layer depth and wet deposition contribute to the decrease in PM2.5 concentration. In cluster two, a obvious decrease in cloud cover and increase in solar radiation are also favorable for the photochemical production of ozone. The results will provide suggestions for the government to use to take measures to improve the air quality of SHs.
Introduction
In recent years, cities in eastern China have been facing severe air pollution. PM2.5 (particles with aerodynamic diameters less than 2.5 µm) and ozone concentrations often exceed air quality standards (Ministry of Ecology and Environment, 2013). Air pollution is one of the main environmental problems in urban areas, particularly in megacities, such as Shanghai (SH). Exposure to high levels of PM2.5 has adverse effects on human health and ecosystem productivity (Yue et al., 2017; Wang et al., 2019a). Thus, in September 2013, the State Council issued the Action Plan on the Prevention and Control of Air Pollution, known as the Clean Air Actions (CAA), to aggressively control anthropogenic emissions. The Yangtze River Delta region was required to reduce its PM2.5 concentrations by 20% within 5 years (Ministry of Ecology and Environment, 2013). Starting that year, PM2.5 data from a nationwide monitoring network of approximately 1000 sites became available from the China National Environmental Monitoring Center (CNEMC) of the Ministry of Ecology and Environment of China (MEE). Afterward, in a three-year action plan to fight air pollution (State Council of the People’s Republic of China, 2018), sulfur dioxide, nitrogen oxides and PM2.5 were further restricted. With joint efforts, the average annual PM2.5 concentration in China decreased by 44% in 2019 compared with 2013 (Zhong et al., 2021). However, at the same time, the surface ozone concentration in China continues to rise (Liu et al., 2018; Dang and Liao, 2019, 2012–2017), which partially offsets the health benefits brought by the decrease in PM2.5 concentration. Stage Ⅱ of the CAA plan began in 2018 (State Council of the People’s Republic of China, 2018), and new emission control measures were implemented for surface ozone.
Given the seesaw variation between PM2.5 and O3, i.e., the decrease in O3 concentrations with the increase in PM2.5 contents, many studies have been conducted to investigate the chemical mechanisms (Shao et al., 2022; Wu et al., 2022). The interaction between PM2.5 and O3 is closely related and very complicated. NOx and VOCs (volatile organic compounds) in the atmosphere are able to generate ozone under light conditions in photochemical reactions (Carrillo-Torres et al., 2017). In this process, NOx, SO2 and VOCs are also oxidized to form secondary PM2.5 (Zhu et al., 2015). At nighttime and in the immediate vicinity of large NO emissions, ozone concentrations are depressed through the process of NOx titration. The result is the net conversion of O3 to NO2 (Gillani and Pleim, 1996). In regions with high NOx emissions, O3 formation can be VOC-limited (Sillman et al., 1990; Kleinman et al., 2003). As a result of CAA, NOx decreased obviously (Silver et al., 2018, 2015–2017). Thus, due to the nonlinear relationship between O3 production and NOx (Simon et al., 2015), the concentration of O3 in VOC-limited areas in eastern China increases to some extent.Through heterogeneous chemical reactions, PM2.5 can indirectly affect O3. In winter on the North China Plain, formaldehyde is produced by the oxidation of reactive VOCs. The fast production of ozone is driven by HOx radicals from the photolysis of formaldehyde, overcoming radical titration from the decreased NOx emissions (Li et al., 2021). Research has demonstrated an ∼40% decrease in PM2.5, slowing the aerosol sink of hydroperoxyl (HO2) radicals and thus stimulating ozone production at 0.6–1 ppbv a−1 in Beijing–Tianjin–Hebei (Li et al., 2019). Using the WRF-CMAQ model, Liu and Wang also uncovered a similar and substantial effect of HO2 uptake on increases in O3 levels due to changes in PM concentrations (Liu and Wang, 2020a). Although many studies have been performed to evaluate the quantitative contributions of photolysis rates and heterogeneous chemical reactions to the production of O3, their relative importance is still unclear (He and Carmichael, 1999; Sillman, 1999).
The absorption and scattering of shortwave radiation by PM2.5 can attenuate incident solar shortwave radiation and change the radiation balance in the atmosphere (Charlson et al., 1992; Bond et al., 2013). The attenuation of short-wave radiation will reduce the photolysis rate of O3 and precursors (J [O31D] and J [NO2], etc.), which will decrease the photochemical reaction intensity, and then reduce the net chemical production of O3 (Jacobson, 1998; Li et al., 2011; Deng et al., 2012). Wang et al. (2019b) analyzed the photolysis rate data in Beijing from 2012 to 2015, and found that aerosols caused J[NO2] and J[O31D] near the ground in Beijing to decrease by 24%–30% and 27%–33%, respectively, which led to a decrease of photochemical generation rate in the local ozone in summer by approximately 25%.
Previous studies on the interaction between PM2.5 and O3 have mostly focused on chemical mechanisms. However, meteorological conditions also have great effects on the formation, transportation and deposition processes of PM2.5 and O3 and their precursors (Finlayson-Pitts and Pitts, 1986; Cox and Chu, 1996; Xu et al., 1996; Mu and Zhang, 2014; Zhang et al., 2014; Hu et al., 2015; Yin et al., 2017; Zhang, 2017; Wang et al., 2021). For example, by altering the chemical reaction rates directly and the biogenic emissions of VOCs indirectly, higher temperatures can enhance ozone formation in most instances (Guenther et al., 2006; Lu et al., 2019b). The response of PM2.5 concentrations to temperature was largely the result of competing changes in sulfate and nitrate concentrations with a smaller role played by organics (Dawson et al., 2007). Increasing relative humidity will increase the water content of fine particles, thus increasing the PM2.5 concentration (Dawson et al., 2007). Water vapor is able to react with the excited oxygen atom O(1D) and generate OH radicals, which eventually lead to a reduction in the reaction between O(1D) and O2 (Johnson et al., 1999). Thus, the increase in water vapor can lead to a decrease in surface ozone concentrations (Camalier et al., 2007; He et al., 2017).Pollutant distributions are strongly affected by the wind field (Chen et al., 2020). PM2.5 concentrations typically decrease by an order of magnitude between polluted regions and the diluting background air, whereas for ozone concentrations may actually increase or decrease, affected by upwind regions (Jacob and Winner, 2009; Gu et al., 2020b). Precipitation decreases both PM2.5 and O3 concentrations via wet removal (Shan et al., 2008). An increase in the planetary boundary layer height can decrease pollutant levels via dilution of primary pollutants into a larger volume of air (Su et al., 2018)
However, most of the existing studies focused on the meteorological condition contributions to the individual pollution of PM2.5 or O3 (He et al., 2017; Wang et al., 2018; Lu et al., 2019a; Zhai et al., 2019; Li et al., 2020; Yin et al., 2020). In terms of the synergetic seesaw pattern between PM2.5 and O3, its meteorological mechanism has been poorly understood. Individual meteorological factors will have the same or adverse effects on the concentration of PM2.5 and O3. What is the net contribution of meteorological conditions to the seesaw concentrations pattern between PM2.5 and O3. This study will take the seesaw concentration events of PM2.5 and O3 in Shanghai as a case to reveal their meteorological causes, which will benefit the prediction of future synergetic pollution of PM2.5 and O3.
Data and method
Air pollution dataset
Hourly surface observations of O3, PM2.5 and nitrogen dioxide (NO2) were all obtained from the CNEMC network (http://106.37.208.233:20035/, last access: 28 December 2020). As part of the CAA, the network started in 2013 with 496 sites in 74 major cities across the country, growing to more than 2500 sites in 366 cities by 2020. At each monitoring site, the concentration of O3 was measured using ultraviolet absorption spectrometry and differential optical absorption spectroscopy. PM2.5 mass concentrations are measured using the micro-oscillating balance method and/or the β absorption method. NO2 concentrations are measured by the molybdenum converter method, which is known to have positive interferences from NO2 oxidation products (Ministry of Ecology and Environment, 2012). Instrumental operation, maintenance, data assurance, and quality control were conducted based on the most recent revisions of China’s environmental protection standards (Ministry of Ecology and Environment, 2013). In terms of time, all the data we used are from 13 May 2014 to 7 November 2020.
Air quality data were measured at 9 sites in the Shanghai region, and each site has distinct representation for different influences from urban air pollutant emissions. Figure 1 shows the locations of the nine sites, i.e., Putuo Station, No.15 Factory Station, Hongkou Station, Xuhui Shanghai Normal University Station, Yangpu Sipiao Station, Jing’an Monitoring Station, Pudong Chuansha Station, Pudong New Area Monitoring Station and Pudong Zhangjiang Station. As the observation system is being developed and gradually improved, the duration of available data varies from station to station. The concentration unit of air quality data provided by the official website of MEE is micrograms per cubic meter (µg·m−3). Before 31 August 2018, the concentration was under the standard condition (273 K, 1013 hPa). From 1 September 2018 and on, the reference gas concentration was changed to 298 K and 1013 hPa, and the PM2.5 concentration was changed to the measured local environmental conditions. Additionally, we removed invalid values and abnormal values from the hourly CNEMC data due to instrument calibration issues.
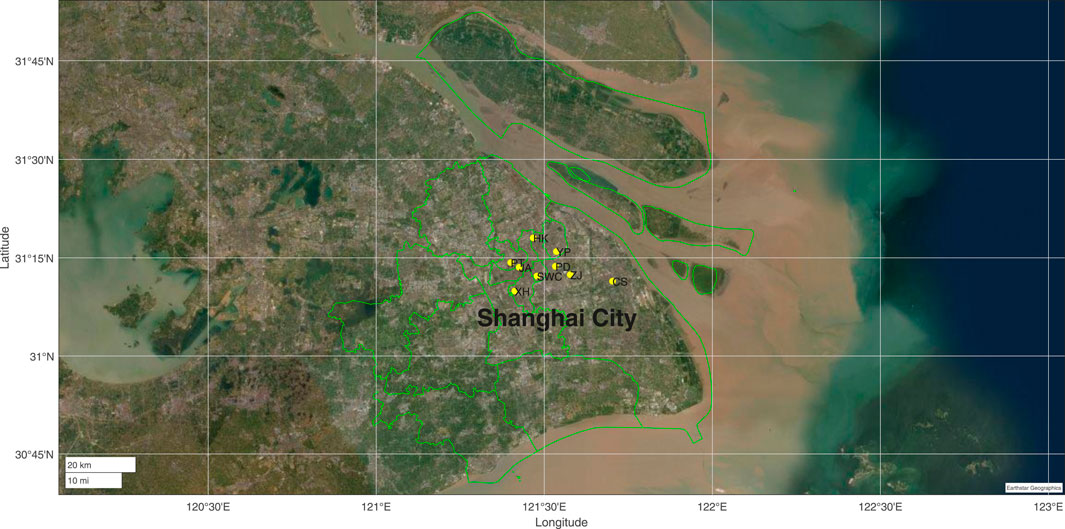
FIGURE 1. The detailed geographical distribution of 9 observational stations in the Shanghai region. The points in the figure represent the latitude and longitude of the Shanghai air quality monitoring station. Air quality monitoring station locations can be obtained from the website of Ministry of Ecology and Environment of the People’s Republic of China (http://106.37.208.233:20035). Capital letters in the figure represent abbreviations of site names.
Meteorological dataset
The hourly dataset of the fifth-generation European Centre for Medium-Range Weather Forecasts (ECMWF ERA5) atmospheric reanalysis dataset with a resolution of 0.25° was used to describe the meteorological characteristics in this research (https://cds.climate.copernicus.eu/cdsapp#!/dataset/reanalysis-era5-pressure-levels?tab=overview, https://cds.climate.copernicus.eu/cdsappԣ!/dataset/reanalysis-era5-single-levels?tab=overview, last access: 18 May 2022). The U and V components of 10 m wind, 2 m air temperature, relative humidity, boundary layer height (BLH), mean surface downward longwave radiation flux (Longwave), mean surface downward shortwave radiation flux (Shortwave), total precipitation, fraction of cloud cover, surface net solar radiation (SSR), and the vertical distribution of vertical velocity, geopotential, and ozone mass mixing ratio are involved in this study. In order to find out the statistical difference between meteorological variable values of five clusters, t-test is used to examine significance. The t-test is a popular statistical tool used to test differences between the means of two groups, or the difference between one group’s mean and a standard value. Running t-tests help us to understand whether the differences are statistically significant (Box, 1987).
Additional information on ozone in ERA5 is that the heterogeneous ozone chemistry is updated and the interaction between ozone and the atmosphere is one-way. Ozone is advected by the atmospheric flow. However, the ERA5 prognostic ozone has no feedback on the atmosphere via the radiation scheme (Hersbach et al., 2020).
Since it has a relatively high temporal and spatial resolution (1 hour averages and 0.5° × 0.625°), we also obtain surface PM2.5 concentrations in the Modern-Era Retrospective Analysis for Research and Applications, version 2 (MERRA-2). Using fields from the 2D aer_Nx collection, the concentration of particulate matter can be computed using the following formula:
PM2.5 = DUSMASS25 + OCSMASS+ BCSMASS + SSSMASS25 + SO4SMASS* (132.14/96.06)Because the species tracer in MERRA-2 is the sulfate ion, sulfate requires a multiplication factor (https://gmao.gsfc.nasa.gov/reanalysis/MERRA-2/FAQ/). In addition to the lack of nitrate aerosols in MERRA-2, the bias in MERRA-2 mainly comes from the uncertainties of the emission inventory and meteorological simulation in GOES-5(Geostationary Operational Environmental Satellite-5) models (Buchard et al., 2016; He et al., 2019).
Definition of seesaw events of PM2.5 and O3
As shown in Figure 2, the PM2.5 concentration and O3 concentration in SH have obvious seasonal and diurnal seesaw variation characteristics. Figure 2 shows the climatology of diurnal and seasonal variations in PM2.5 and O3 concentrations. It shows higher PM2.5 concentrations during the morning rush hour and lower concentrations in the afternoon; while O3 shows lower concentrations at 7–8 a.m. and higher concentrations at 2–3 p.m. In terms of seasonal variation, the PM2.5 concentration in winter is the highest, but winter is the cleanest season for O3 pollution in SH. The chemical and physical mechanisms of the diurnal and seasonal seesaw pattern between PM2.5 and O3 in Figure 2 have been revealed in previous studies from the perspective of the variation in emission and meteorological factors. In short, ozone has a strong correlation with high temperatures, so it peaks at midday and during mid-spring to early summer in SH (Gu et al., 2020a; Chang et al., 2021). The reason that ozone concentration of Shanghai in spring is higher than summer is the photochemical reaction of ozone affected by plum-rain in summer (Gao et al., 2017). Deep and persistent cloud cover impedes solar radiation to reach the surface of the Earth, affecting the photochemical generation of ozone Affected by human activities, household heating in winter and vehicle emissions in the morning and evening are able to increase PM2.5 (Xiao et al., 2015; Zhang and Cao, 2015). Outbreaks of haze generally occur during the winter as a result of temperature inversions. During an inversion warm air settles above a layer of cool air near the surface. The lid-like warm air traps pollutants near the surface. Lower PM in afternoon can be explained by the enhanced emission for heating and relatively low the boundary layer (Zhang and Cao, 2015).However, there are still some seesaw events of PM2.5 and O3 under the background of diurnal and seesaw patterns shown in Figure 2, the mechanisms of which are still unclear. This study will focus on the meteorological causes of these seesaw events.
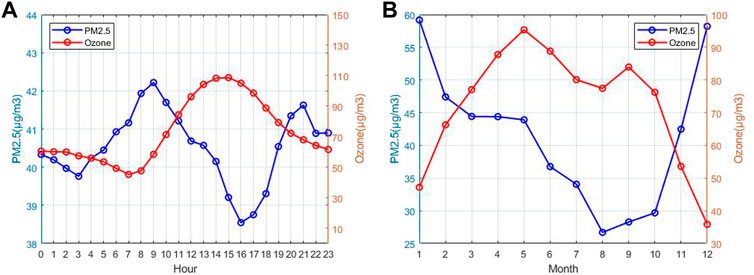
FIGURE 2. The hourly and seasonal means of PM2.5 and ozone concentrations in Shanghai, (A) diurnal changes and (B) monthly changes from 2014 to 2020.
To eliminate the influence of seasonal variation, diurnal variation and interannual variation, the original data are classified according to different years, months and hours, and the mean, first quartile and third quartile are calculated. The original data of PM2.5 and O3 are compared with the corresponding quartile. If the hourly concentration of PM2.5 is greater than the corresponding third quartile, and O3 is less than the corresponding first quartile, we call it High-PM-Low-O3 seesaw hour (Type-one for short). Similarly, if the hourly concentration of O3 is greater than the corresponding third quartile, and PM2.5 is less than the corresponding first quartile, it is defined as Low-PM-High-O3 hour (Type-two). The quartiles are not fixed, but change with the specific year, month and hour. The above three influencing factors, together with the original data of pollutant concentration, any change in four variables will affect the quartiles. That is, the relatively high/low air pollutant concentrations are used to define the seesaw cases instead of their absolute values. To ensure the spatial and temporal continuity of the two types of cases, a seesaw event was defined as at least 12 consecutive seesaw hours occurring at more than half of the available observation stations in Shanghai.
HYSPLIT model and clustering analysis
Backward trajectory analysis essentially follows a parcel of air backward in hourly time steps for a specified length of time. The Hybrid–Single Particle Lagrangian Integrated Trajectory (HYSPLIT) model (Draxler et al., 2009) developed by the National Oceanic and Atmospheric Administration (NOAA) was used in this study to identify potential source regions of PM2.5 or O3 for a specific city of SH and capture the horizontal movement of the air masses from the source region. The model uses internal terrain following sigma coordinates and meteorological element fields are interpolated linearly to the corresponding coordinates.
To show the origins of air masses arriving at SH, 48-hour backward trajectories were computed every 6 h (at 00:00, 06:00, 12:00, and 18:00 UT) for the years 2014–2020 for 100 m above ground over SH using the HYSPLIT- 4 model (Draxler et al., 2009.). Meteorological archive data used for the HYSPLIT model are from NCEP (National Centers for Environmental Prediction), at a horizontal resolution of 2.5° (latitude) × 2.5° (longitude).
TrajStat software is used to classify the backward trajectories arriving at SH to better determine the transportation of PM2.5 and O3. The trajectories were assigned to distinct clusters according to their moving speed and direction using Ward’s hierarchical method based on the Euclidean distance between all pairs of trajectories (Sirois and Bottenheim, 1995). Major transport pathways leading to elevated or dropped PM2.5 concentrations and ozone concentrations were identified by combining trajectories with the corresponding mean concentrations of the pollutant.
Results
Occurrence frequency of the seesaw events
Figure 3A shows the seasonal distribution of the two types of PM2.5 and O3 seesaw events during the 2013–2020 period. Obviously, the frequency of Type-one seesaw events is higher than Type-two in total. There were 144 cases in Type-one and 64 cases in Type-two. In terms of seasons, most of the two types of seesaw events occur in winter. Both seesaw events show the lowest frequency in summer, which is approximately 22.73% and 10% of that in winter for Type-one and Type-two, respectively.
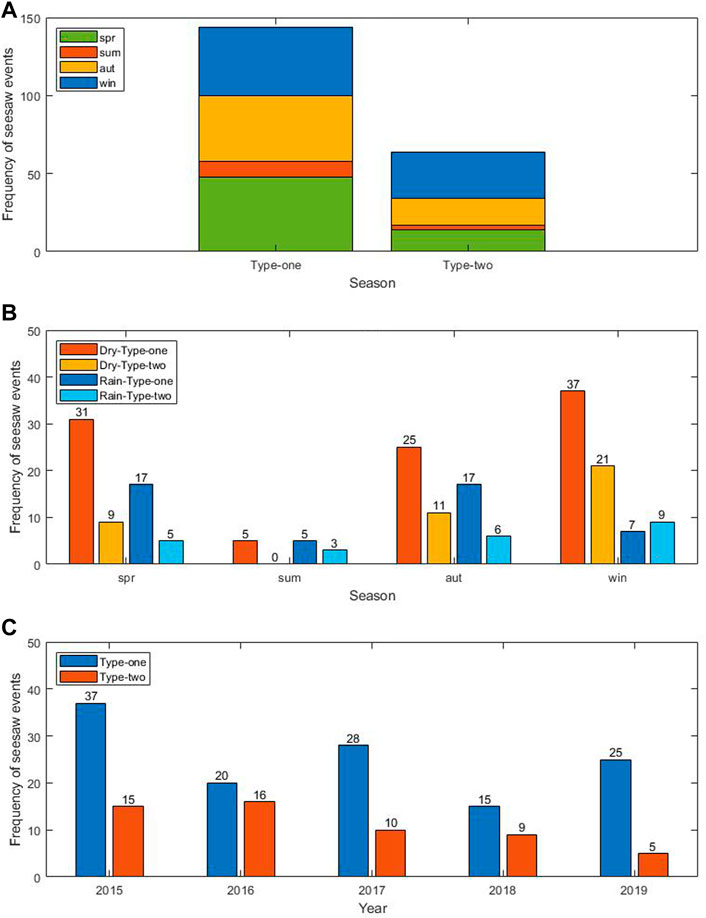
FIGURE 3. The seasonal distribution (A), precipitation distribution (B) and annual distribution (C) of seesaw events in Shanghai during 2013–2020. If the hourly precipitation of any grid exceeds 0.5 mm, it is considered that there is an obvious wet cleaning process in this study.
Considering the wet deposition, the physical mechanisms of the seesaw events are supposed to be different from those on dry days. We reclassified the seesaw events with the occurrence of precipitation in Figure 3B. In summer, more than half of the seesaw events occurred on rainy days, which is different from other seasons. The sample size is 5 for both dry and rainy Type-one events in summer, but all the Type-two events occur on rainy days. The positive correlation between PM2.5 and O3 in summer results in the lowest event frequency occurring in summer. High O3 concentrations in a strong oxidative air condition promoted the formation of secondary particles in summer. During plum-rain in summer, under most circumstances PM2.5 concentrations and O3 concentrations decrease at the same time due to precipitation (Jia et al., 2017; Zhu et al., 2019). The interannual variation in the seesaw event frequency is shown in Figure 3C.
Atmospheric circulation anomalies of the seesaw events
The roles of meteorology on pollutants are complex and varying. To further explore the meteorological causes behind the seesaw incidents, we calculated the anomalies of meteorological variables under the seesaw events in different seasons, including geopotential height (Z) and U/V components at 925 hPa, 850 hPa and 500 hPa. Figure 4 indicates the seasonal average of Z&UV anomalies at 925 hPa for Type-one seesaw events (i.e., high PM2.5 with low O3 concentrations). It shows almost the same atmospheric circulation pattern in the four seasons, with a cyclonic anomaly over North China and the Northeast China region, which brings northwest or west winds to SH. For the case of Type-two seesaw events in Figure 5 (i.e., high O3 with low PM2.5 concentrations), the circulation anomalies are also the same in spring, autumn and winter. SH is located at the edge of the west positive and east negative pressure, and the prevailing wind of SH comes from the northeast. In terms of the summertime, the sample size of Type-two is small, which leads to the vague distribution of its circulation anomaly pattern. The atmospheric circulation anomalies at 850 hPa and 500 hPa also show the same pattern for each type of seesaw event (figures not shown here). According to Figures 4, 5, there is almost no difference in the seasonal circulation anomalies, therefore, we investigate the mechanisms of seesaw events without considering their seasonal difference hereafter.
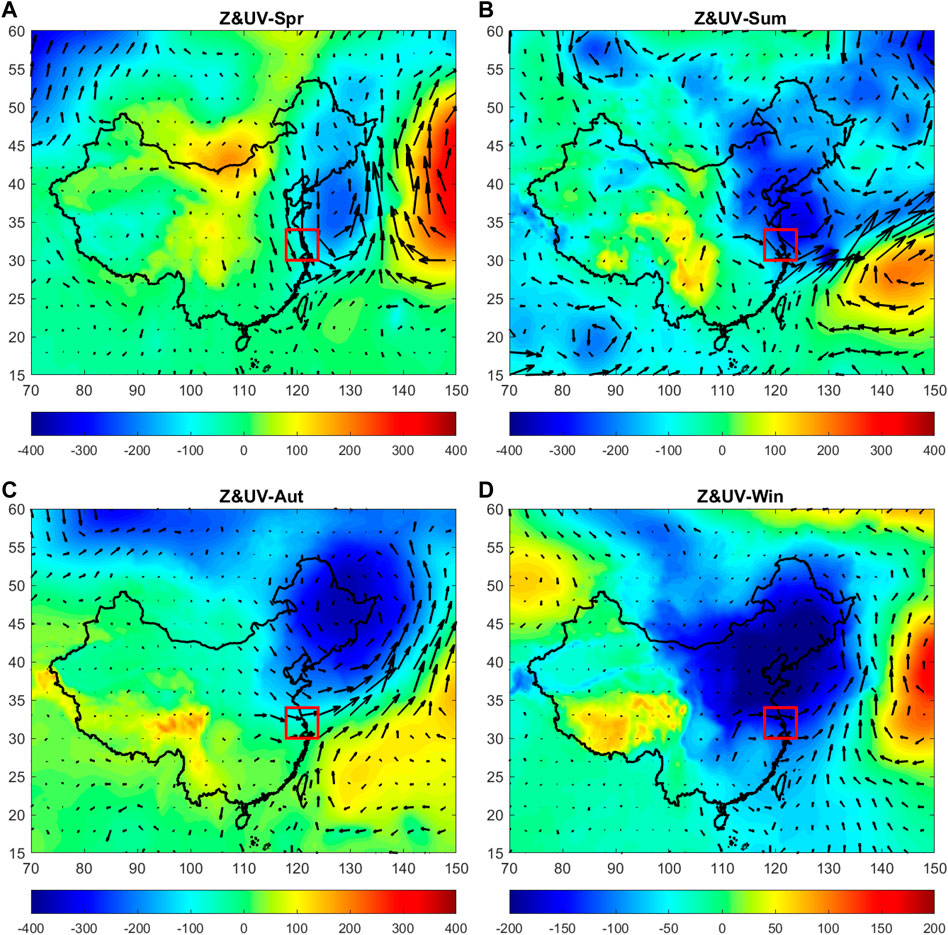
FIGURE 4. Seasonal anomaly of atmospheric circulation at 925 hPa for the Type-one seesaw events. The shading indicates the anomaly of geopotential height (unit: m2·s−2). The black arrow is the wind anomaly. The solid red box marks the location of Shanghai. And the results are shown for (A) spring, (B) summer, (C) autumn, (D) winter.
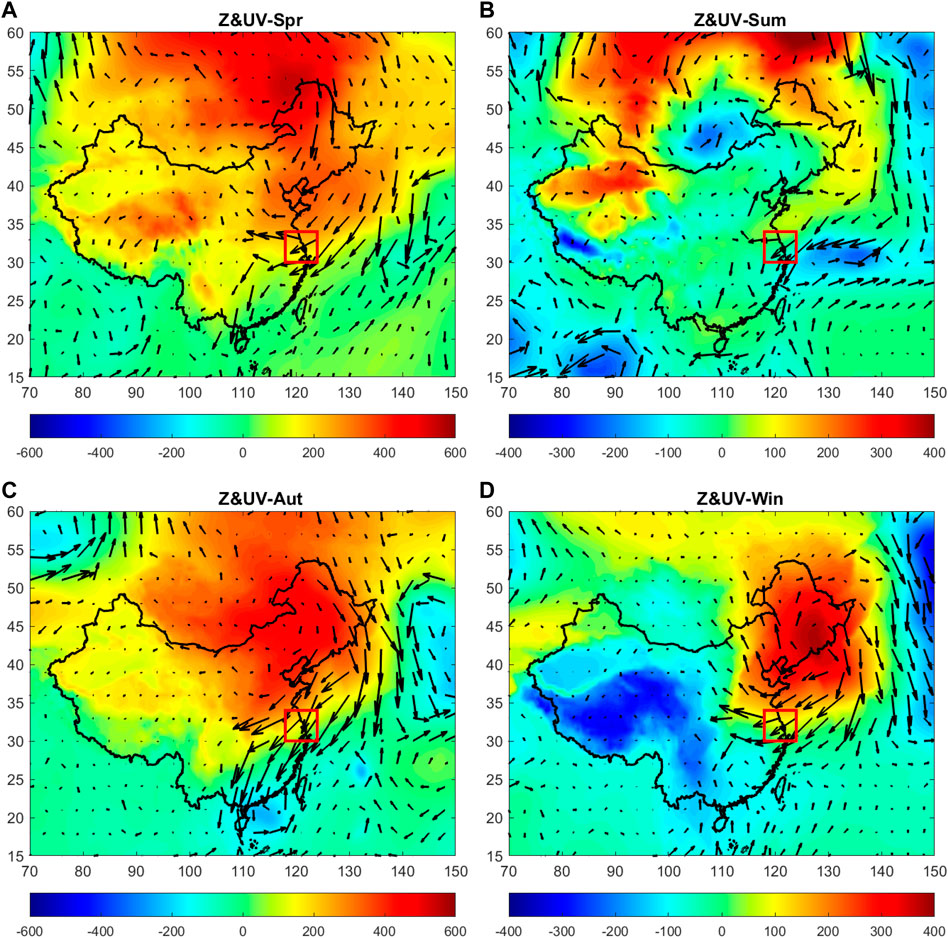
FIGURE 5. The same as in Figure 4 but for the Type-two events. The solid red box marks the location of Shanghai. And the results are shown for (A) spring, (B) summer, (C) autumn, (D) winter.
Regional transport contributes to the seesaw events
Although it shows a consistent seasonal circulation anomaly distribution for each type of seesaw events in Figures 4, 5, it indicates an average pattern of atmospheric circulation. To reveal the mechanism of the specific seesaw event, the 48 h backward trajectory of each seesaw events is calculated and clustered, which can provide the information on the origins and transport pathways of air masses. As shown in Figure 6, cluster analysis yielded a total of three air-mass clusters for the 144 Type-one seesaw events, and two air-mass clusters for the 64 Type-two events.
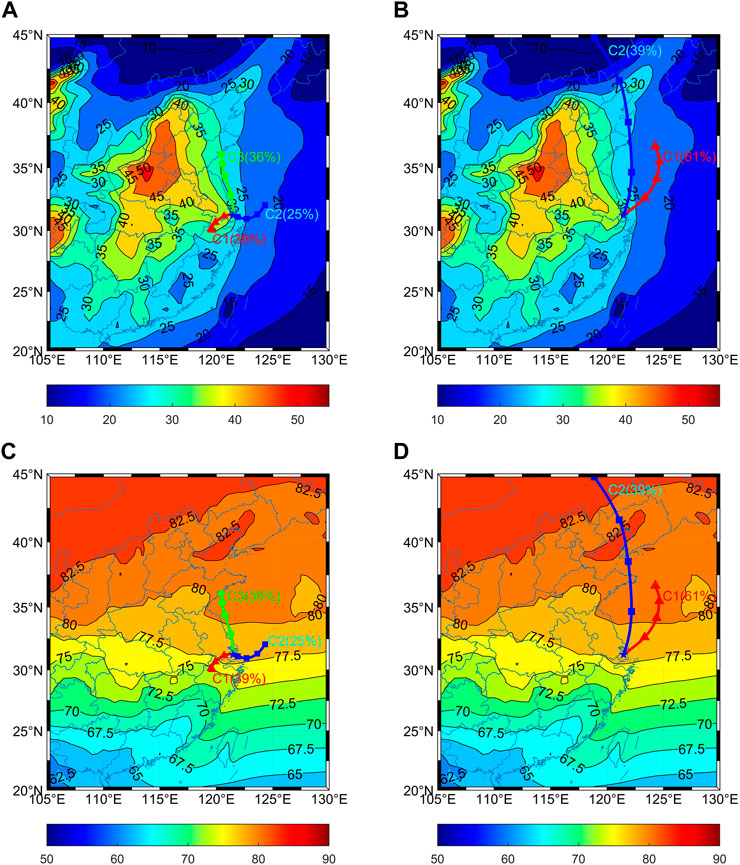
FIGURE 6. Transport pathways of air masses in 5 clusters with (A,B) PM2.5 mean concentration and (C,D) O3 mean concentration (ppb). The background PM2.5 concentration is the annual average from 2014 to 2020, sourced from MERRA-2. The background ozone concentration is the annual average from 2014 to 2020, sourced from ERA5.
For the case of Type-one events, the three kinds of air masses in SH come from the eastern ocean, north China and southwest of SH. The frequencies of these three kinds of air masses are almost the same. There are 56 samples in C1, 36 samples in C2 and 52 samples in C3. Tables 1, 2 summarize the anomalies of PM2.5, O3 and NO2 concentrations in each backward trajectory cluster. For Type-one seesaw events, the magnitudes of PM2.5 anomalies are higher in cluster-one (C1 for short) (+107%) and cluster-three (C3) (+105%) than cluster-two (+95%), which may be due to the higher PM2.5 background concentrations transported from the north and southwest upwind regions of SH (as shown in Figure 6). Moreover, the NO2 concentration increased by 83% and 52% in C1 and C3 in the Type-one events, respectively, which can also imply the regional transportation of aerosols and precursors.
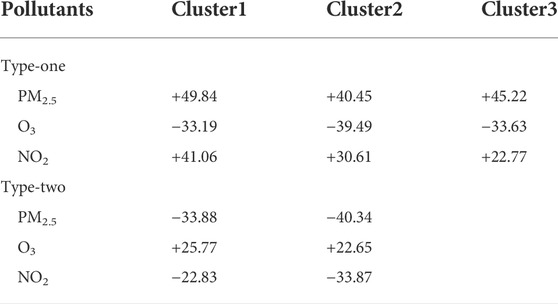
TABLE 1. Absolute anomalies and relative anomalies of PM2.5, O3 and NO2 concentrations in each backward trajectory cluster of the two seesaw events in Shanghai. Units: μg/m3. The anomalies are with respect to their average value of every hour in every month.
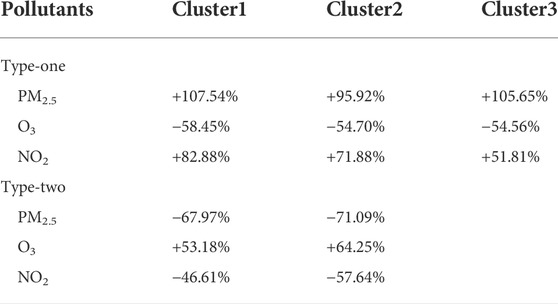
TABLE 2. Relative anomaly percent changes in PM2.5, O3 and NO2 concentrations in each backward trajectory cluster of the two seesaw events in Shanghai. Units: %. The relative anomalies are with respect to the average value of every hour in every month.
In terms of Type-two seesaw events, the air mass in SH mainly comes from the nearby east sea surface (61% of events, 39 samples) with minor influence from the remote northeast China (39% of events, 25 samples) Compared to the average pollutant concentrations, the PM2.5 concentrations of the two types of clusters decreased by 67.97% and 71.07%, respectively. Correspondingly, the ozone concentration increased by 53.18% and 64.25%, respectively. Based on the climatology of O3 and PM2.5 in Figure 6, it shows higher O3 concentrations and lower PM2.5 contents in the east sea surface. The easterly wind brings O3-rich and low PM2.5 air masses to SH, and leads to high O3 and low PM2.5 pollution for the two clusters of Type-two events. Several studies have found that ozone tends to be continuously produced in the downwind regions of major cities (Kleinman et al., 2003; Tie et al., 2009, 2013). O3 formation usually occurs under strong VOC-limited conditions in coastal megacities, which inhibits O3 chemical production. In the downwind region, O3 formation shifts to NOx-limited conditions gradually on the contrary to the sea surface, which results in pronounced O3 production (Kley, 1997). O3 precursors emitted from a coastal city are advected to the ocean by land breezes and produce O3 over the ocean, the O3-rich air mass can be advected back to the city by sea breezes.
Meteorological cause for the seesaw events
The meteorological influence on the pollutant varied by region and could be comparable to or even more significant than the impact of changes in anthropogenic emissions (Liu and Wang, 2020b). The relative anomalies of air temperature, BLH, shortwave, longwave, SSR, precipitation, 10 m wind, cloud cover and relative humidity are involved to reveal the meteorological effects on seesaw events. Figures 7, 8 show the spatial distribution of BLH and RH relative anomalies in the five clusters. Table 3 summarizes the regional mean relative anomalies of the above nine meteorological factors of SH in the five clusters. For the case of C1 in Type-one events, it shows lower than normal BLH around SH and the East Ocean, with a significant negative BLH relative anomaly of 199.41 m (-54%). The BLH indicates the vertical diffusion ability of the local atmosphere, which has been demonstrated to have a negative relationship with ambient PM2.5 concentrations (Wang and Wang, 2014; Wang and Wang, 2016). The lower PM2.5 in C1 of Type-one events can be attributed to the repression of vertical diffusion to some extent. Considering that the wind speed drops by 0.93 m/s (−28%), stable and stagnant circulation may also increase the concentration of pollutants.
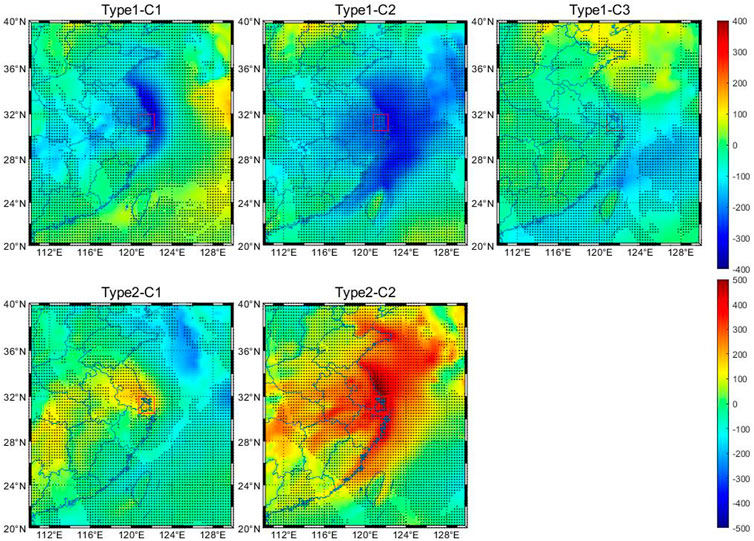
FIGURE 7. Anomalies of boundary layer height in 5 clusters. The solid blue line in the background indicates the provincial boundaries of China. Different subtitles represent different clusters. The black dots indicate that the grids are above the 99% confidence level (p < 0.01). The solid red box marks the location of Shanghai. Unit: m.
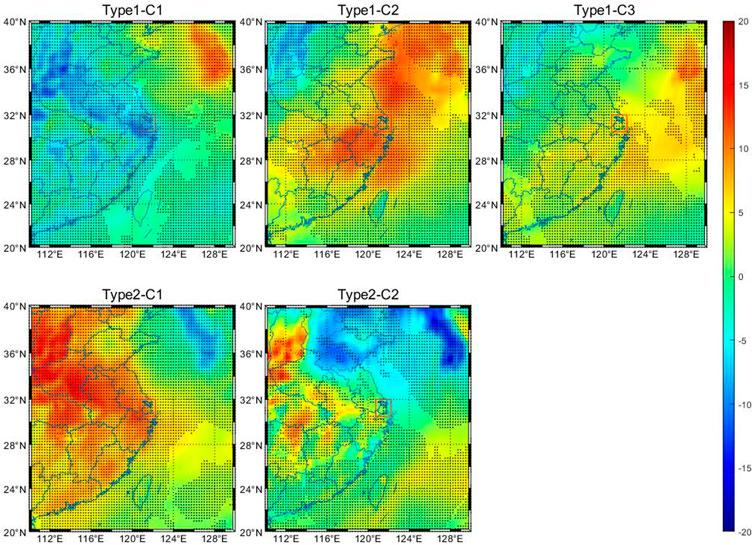
FIGURE 8. Anomalies of relative humidity in 5 clusters. The solid blue line in the background indicates the provincial boundaries of China. Different subtitles represent different clusters. The black dots indicate that the grids are above the 99% confidence level (p < 0.01). The solid red box marks the location of Shanghai. Unit: %.
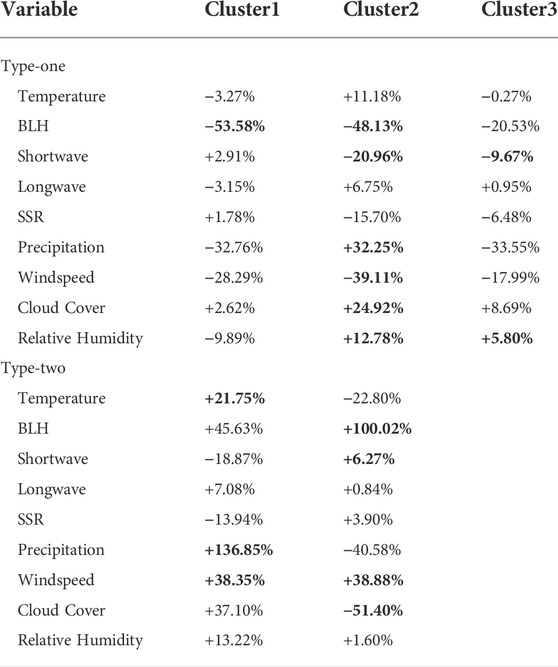
TABLE 3. Meteorological factor percent changes in 5 clusters. The bold font indicates an important influencing factor. Units: % Data source: ERA5-1000 hPa & Surface. The relative anomalies are with respect to the average value of every hour in every month. Bold fonts indicate the main factors influencing the specific seesaw cluster.
For C2 in Type-one, the height of the boundary layer decrease by 48.13% and the relative humidity increased by 12.78%, which is the most significant among the three clusters (Figure 8). Figure 9 shows the occurrence frequency of precipitation during the five clusters. Due to the positive precipitation anomaly (Table 3) and easterly backward trajectory (Figure 6), there is a positive relative humidity anomaly in C2 of Type-one events, which is beneficial for the hygroscopic growth of aerosols and leads to an increase in PM2.5 concentration (Wang et al., 2019b; Won et al., 2021). The scavenging process and physical removal mechanism of PM are determined by different precipitation intensities (Andronache, 2003; Chate et al., 2003; Wang et al., 2010). According to the definition of the American Meteorological Society, precipitation can be classified as light rain, mild rain and heavy rain (American Meteorological Society American Meteorological Society, 2022). Using this definition, Figure 9 shows the distribution of no rain, light rain and mild rain under the five clusters. The precipitation in C2 is primarily light rain, and the deposition ability is weak compared to moistening the air mass. The stable air mass also contributes to the accumulation of surface air pollutants. In addition, based on the regional mean meteorological factor anomalies in Table 3, the significant increase in cloud cover (+25%) and decrease in shortwave radiation (−21%) on the rainy days also caused the weakening of ozone photochemical production, which led to the decrease in surface ozone concentration in Shanghai.
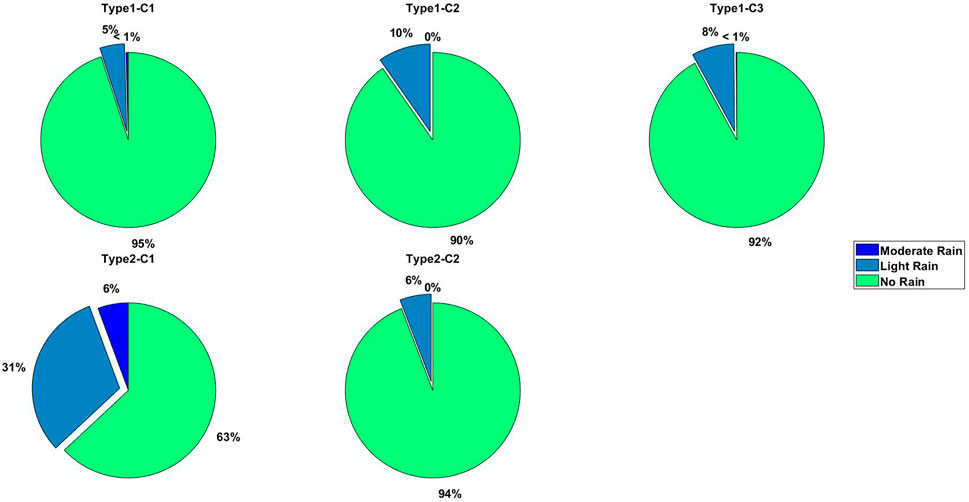
FIGURE 9. Precipitation intensities in 5 clusters of Shanghai seesaw events. No rain: the rate of fall varying between a trace and 0.5 mm per hour. Light rain: the rate of fall varying between 0.5 mm and 2.5 mm per hour. Mild rain: the rate of fall varying between 2.5 mm and 7.6 mm per hour (American Meteorological Society).
For C3 in Type-one, the magnitudes of the regional mean meteorological anomalies are not as obvious as those in C1 and C2. However, the obvious increase in relative humidity (+5.8%) and decrease in solar radiation (−9.7%) can be considered a beneficial meteorological background for the increase of PM2.5 and decrease of O3, respectively. Notably, the C3 air mass comes from the North China Plain where the concentration of fine particles is generally high (Figure 6). This may indicate that the high concentration of PM2.5 in C3 is related to transport. In brief, it is the comprehensive influence of transport, shortwave radiation and relative humidity resulting in C3 (Figure 10).
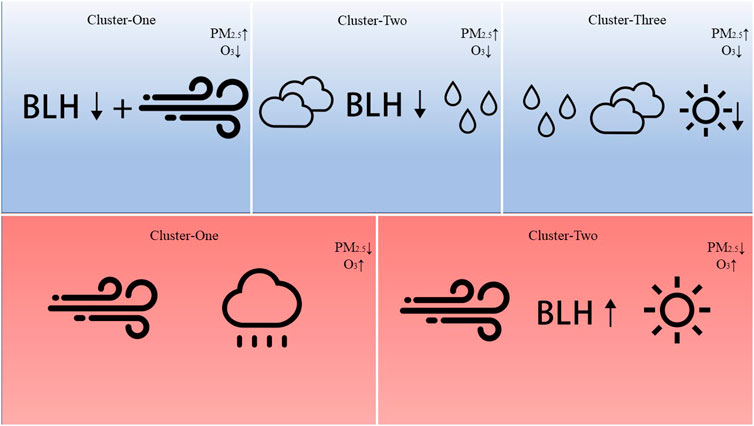
FIGURE 10. Diagram of the impacts of meteorology on both the O3 and PM2.5 concentrations in Shanghai during seesaw events.
As described in the previous section, regional transport is undoubtedly the main influencing factor of the Type-two seesaw events. The trajectory in Figure 6 also shows that the air masses originate from areas with higher ozone and lower PM concentrations. Apart from that, other meteorological factors also make sense. In C1 of Type-two, the simple size of the dry-day case is small, and only the rainy cases are involved. Apparently, it shows a obvious positive anomaly of precipitation (Table 3) and relative humidity (Figure 8). Compared with the case of C2 in Type-one, the frequency of moderate rain in C1 of Type-two is much higher. The effects of wet deposition are more pronounced than the hygroscopic growth of aerosols in a humid environment, which results in a decrease in PM2.5 (Jacob and Winner, 2009).
In C2 of Type-two events, a 51% decrease in cloud cover along with a 6.27% increase in shortwave radiation contributes to the photochemical formation of ozone. Moreover, the increase in solar radiation prompts the development of boundary layer, which results in the positive BLH anomaly by 403.28 m (+100%) and the improvement in atmospheric vertical diffusion conditions. The surface wind speed, which is regularly considered the metric of horizontal diffusion ability, increases by 39% in C2 of Type-two events. The significant improvement of vertical and horizontal diffusion conditions led to a decrease in the PM2.5 concentration (Wang et al., 2016, Wang et al., 2018; Wang and Zhang, 2020).
Conclusions and discussion
This study explored the impact of meteorological factors on the seesaw concentration pattern between PM2.5 and O3 in Shanghai from 2014 to 2020. On the basis of the variation in PM2.5 and O3 concentrations, we divided the seesaw events into two types, Type-one (High-PM-Low-O3) and Type-two (Low-PM- High-O3). The trajectories of the seesaw events were assigned to distinct clusters according to their moving speed and direction using the HYSPLIT model. The specific number of clusters is given as follows: three clusters in Type-one and two clusters in Type-two.
In Type-one seesaw events, the boundary layer height in three clusters obviously decreased, C1 (−53.58%) and C2 (−48.13%). Obviously, worse diffusion conditions lead to an increase in the PM2.5 concentration. The PM2.5 concentration in C1 upwind direction is higher than that in SH, while the ozone concentration is lower. The transport of C1 upwind also contributes. In C2, the relative humidity increased by 12.78% which contributed to the hygroscopic growth of PM2.5 and a decrease in O3 production. Less SSR (−20.96%) and higher cloud cover (+24.92%) in C2 were not conducive to the formation of ozone photochemical reactions. The same conditions were found in C3, but it was less obvious than C2, +8.69% for cloud cover and −9.67% for SSR. Thus, transportation and increased relative humidity were also factors that cannot be ignored in C3.
The cause of another seesaw event is not as complicated as that of Type-one events. Figure 6 and Tables 1, 3 show that the moist oceanic air mass with rich O3 from the northeast sea enters Shanghai and reduces the concentration of PM2.5 at the same time in two clusters of Type-two events. Transport is undoubtedly the main influencing factor in both clusters of Type-two events. Adequate precipitation also contributes to the wet removal of fine particles in C1. A doubled BLH (+100.02%) was beneficial to the diffusion of PM2.5 in C2. A 6.27% increase in SSR contributed to the photochemical production of O3 under clear sky conditions.
Except for the production of ozone from photochemical reactions occurring within the troposphere, the presence of ozone in the troposphere is understood to arise from another basic process. Tropospheric-stratospheric exchange can cause the transport of stratospheric air, rich in ozone, into the troposphere (Langford, 1999). Ni et al. suggested that stratospheric ozone intrusion acts as an additional source of the near-surface tropospheric ozone concentration, which deteriorates O3 pollution in China (Ni et al., 2019).
Therefore, we also made a vertical profile of the ozone mass mixing ratio in autumn (Figure 11). The scavenging process of precipitation can be clearly seen in this figure. Note that when the seesaw events occurred, the near-surface ozone concentration increased, but the ozone concentration in the upper levels decreased. During the precipitation, strong convective weather with obvious downward flow may have affected stratospheric-tropospheric exchange of air masses and ozone concentrations. Therefore, it is also suspected that the near-surface tropospheric ozone concentration is closely related to transport from the upper layer or stratosphere. However, there are currently no further data supporting this hypothesis. Besides autumn, the transport of ozone in the upper and lower layers is not obvious in other seasons.
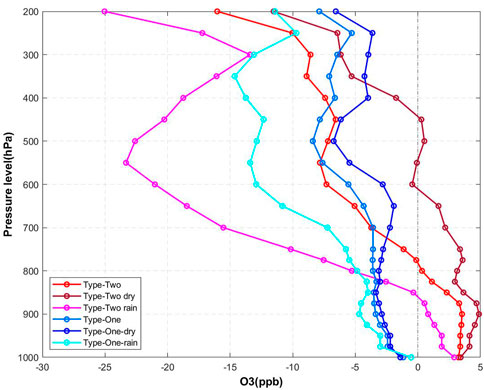
FIGURE 11. Vertical profile of the O3 mass mixing ratio in Shanghai in autumn. The horizontal axis is the anomalies. Data source: ERA5.
Data availability statement
The original contributions presented in the study are included in the article/Supplementary Material, further inquiries can be directed to the corresponding author.
Author contributions
XW and YS designed the research. YS performed the analyses and wrote the paper. Both authors contributed to the final version of the paper.
Funding
This research has been supported by the National Natural Science Foundation of China (Grant Nos. 42075058, 41790470 and 41805117) and Shanghai International Science and Technology Partnership Project (No. 21230780200).
Acknowledgments
Daily pollutant concentration observations in Shanghai were obtained from the website of the Ministry of Ecology and Environment of the People’s Republic of China (http://106.37.208.233:20035; MEEPRC, 2022). The 4-hourly ECMWF ERA5 dataset from 2014 to 2020 was downloaded from https://www.ecmwf.int/en/forecasts/datasets/reanalysis-datasets/era5 (ECMWF, 2022). Backward trajectory analysis was conducted using Hybrid–Single Particle Lagrangian Integrated Trajectory (HYSPLIT), which can be downloaded at https://www.ready.noaa.gov/HYSPLIT.php.
Conflict of interest
The authors declare that the research was conducted in the absence of any commercial or financial relationships that could be construed as a potential conflict of interest.
Publisher’s note
All claims expressed in this article are solely those of the authors and do not necessarily represent those of their affiliated organizations, or those of the publisher, the editors and the reviewers. Any product that may be evaluated in this article, or claim that may be made by its manufacturer, is not guaranteed or endorsed by the publisher.
References
American Meteorological Society American Meteorological Society (2022). Rain”.Glossary of meteorology. Available at: https://glossary.ametsoc.org/wiki/Rain (Accessed July 16, 2022).
Andronache, C. (2003). Estimated variability of below-cloud aerosol removal by rainfall for observed aerosol size distributions. Atmos. Chem. Phys. 13, 131–143. doi:10.5194/acp-3-131-2003
Bond, T. C., Doherty, S. J., Fahey, D. W., Forster, P. M., Berntsen, T., DeAngelo, B. J., et al. (2013). Bounding the role of black carbon in the climate system: A scientific assessment. J. Geophys. Res. Atmos. 118, 5380–5552. doi:10.1002/jgrd.50171
Box, J. F. (1987). Guinness, gosset, Fisher, and small samples. Stat. Sci. 2, 13437. doi:10.1214/ss/1177013437
Buchard, V., da Silva, A. M., Randles, C. A., Colarco, P., Ferrare, R., Hair, J., et al. (2016). Evaluation of the surface PM2.5 in version 1 of the NASA MERRA aerosol reanalysis over the United States. Atmos. Environ. X. 125, 100–111. doi:10.1016/j.atmosenv.2015.11.004
Camalier, L., Cox, W., and Dolwick, P. (2007). The effects of meteorology on ozone in urban areas and their use in assessing ozone trends. Atmos. Environ. X. 41, 7127–7137. doi:10.1016/j.atmosenv.2007.04.061
Carrillo-Torres, E., Hernández-Paniagua, I., and Mendoza, A. (2017). Use of combined observational- and model-derived photochemical indicators to assess the O3-NOx-VOC system sensitivity in urban areas. Atmosphere 8, 22. doi:10.3390/atmos8020022
Chang, L., He, F., Tie, X., Xu, J., and Gao, W. (2021). Meteorology driving the highest ozone level occurred during mid-spring to early summer in Shanghai, China. Sci. Total Environ. 785, 147253. doi:10.1016/j.scitotenv.2021.147253
Charlson, R. J., Schwartz, S. E., Hales, J. M., Cess, R. D., Coakley, J. A., Hansen, J. E., et al. (1992). Climate forcing by anthropogenic aerosols. Science 255, 423–430. doi:10.1126/science.255.5043.423
Chate, D. M., Rao, P. S. P., Naik, M. S., Momin, G. A., Safai, P. D., and Ali, K. (2003). Scavenging of aerosols and their chemical species by rain. Atmos. Environ. X. 37, 2477–2484. doi:10.1016/S1352-2310(03)00162-6
Chen, L., Zhu, J., Liao, H., Yang, Y., and Yue, X. (2020). Meteorological influences on PM2.5 and O3 trends and associated health burden since China’s clean air actions. Sci. Total Environ. 744, 140837. doi:10.1016/j.scitotenv.2020.140837
Cox, W. M., and Chu, S.-H. (1996). Assessment of interannual ozone variation in urban areas from a climatological perspective. Atmos. Environ. X. 30, 2615–2625. doi:10.1016/1352-2310(95)00346-0
Dang, R., and Liao, H. (2019). Radiative forcing and health impact of aerosols and ozone in China as the consequence of clean air actions over 2012–2017. Geophys. Res. Lett. 46, 12511–12519. doi:10.1029/2019GL084605
Dawson, J. P., Adams, P. J., and Pandis, S. N. (2007). Sensitivity of PM2.5 to climate in the eastern US: A modeling case study. Atmos. Chem. Phys. 15, 4295–4309. doi:10.5194/acp-7-4295-2007
Deng, X., Zhou, X., Tie, X., Wu, D., Li, F., Tan, H., et al. (2012). Attenuation of ultraviolet radiation reaching the surface due to atmospheric aerosols in Guangzhou. Chin. Sci. Bull. 57, 2759–2766. doi:10.1007/s11434-012-5172-5
Draxler, R., Stunder, B., Rolph, G., Stein, A., Taylor, A., Zinn, S., et al. (2009). HYSPLIT User’s Guide, 315. https://www.ready.noaa.gov/hysplitusersguide/S000.htm.
Finlayson-Pitts, B. J., and Pitts, J. (1986). Atmospheric chemistry. Fundamentals and experimental techniques. Available at: https://www.osti.gov/biblio/6379212 (Accessed June 20, 2022).
Gao, W., Tie, X., Xu, J., Huang, R., Mao, X., Zhou, G., et al. (2017). Long-term trend of O3 in a mega City (Shanghai), China: Characteristics, causes, and interactions with precursors. Sci. Total Environ. 9, 425–433. doi:10.1016/j.scitotenv.2017.06.099
Gillani, N. V., and Pleim, J. E. (1996). Sub-grid-scale features of anthropogenic emissions of NOx and VOC in the context of regional eulerian models. Atmos. Environ. X. 30, 2043–2059. doi:10.1016/1352-2310(95)00201-4
Gu, Y., Li, K., Xu, J., Liao, H., and Zhou, G. (2020a). Observed dependence of surface ozone on increasing temperature in Shanghai, China. Atmos. Environ. X. 221, 117108. doi:10.1016/j.atmosenv.2019.117108
Gu, Y., Yan, F., Xu, J., Qu, Y., Gao, W., He, F., et al. (2020b). A measurement and model study on ozone characteristics in marine air at a remote island station and its interaction with urban ozone air quality in Shanghai, China. Atmos. Chem. Phys. 20, 14361–14375. doi:10.5194/acp-20-14361-2020
Guenther, A., Karl, T., Harley, P., Wiedinmyer, C., Palmer, P. I., and Geron, C. (2006). Estimates of global terrestrial isoprene emissions using MEGAN (model of emissions of gases and aerosols from nature). Atmos. Chem. Phys. 30, 3181–3210. doi:10.5194/acp-6-3181-2006
He, J., Gong, S., Yu, Y., Yu, L., Wu, L., Mao, H., et al. (2017). Air pollution characteristics and their relation to meteorological conditions during 2014–2015 in major Chinese cities. Environ. Pollut. 223, 484–496. doi:10.1016/j.envpol.2017.01.050
He, L., Lin, A., Chen, X., Zhou, H., Zhou, Z., and He, P. (2019). Assessment of MERRA-2 surface PM2.5 over the Yangtze River basin: Ground-based verification, spatiotemporal distribution and meteorological dependence. Remote Sens. (Basel). 11, 460. doi:10.3390/rs11040460
He, S., and Carmichael, G. R. (1999). Sensitivity of photolysis rates and ozone production in the troposphere to aerosol properties. J. Geophys. Res. 104, 26307–26324. doi:10.1029/1999JD900789
Hersbach, H., Bell, B., Berrisford, P., Hirahara, S., Horányi, A., Muñoz‐Sabater, J., et al. (2020). The ERA5 global reanalysis. Q. J. R. Meteorol. Soc. 146, 1999–2049. doi:10.1002/qj.3803
Hu, J., Wu, L., Zheng, B., Zhang, Q., He, K., Chang, Q., et al. (2015). Source contributions and regional transport of primary particulate matter in China. Environ. Pollut. 207, 31–42. doi:10.1016/j.envpol.2015.08.037
Jacob, D. J., and Winner, D. A. (2009). Effect of climate change on air quality. Atmos. Environ. X. 43, 51–63. doi:10.1016/j.atmosenv.2008.09.051
Jacobson, M. Z. (1998). Studying the effects of aerosols on vertical photolysis rate coefficient and temperature profiles over an urban airshed. J. Geophys. Res. 103, 10593–10604. doi:10.1029/98JD00287
Jia, M., Zhao, T., Cheng, X., Gong, S., Zhang, X., Tang, L., et al. (2017). Inverse relations of PM2.5 and O3 in air compound pollution between cold and hot seasons over an urban area of east China. Atmosphere 8, 59. doi:10.3390/atmos8030059
Johnson, C. E., Collins, W. J., Stevenson, D. S., and Derwent, R. G. (1999). Relative roles of climate and emissions changes on future tropospheric oxidant concentrations. J. Geophys. Res. 104, 18631–18645. doi:10.1029/1999JD900204
Kleinman, L. I., Daum, P. H., Lee, Y.-N., Nunnermacker, L. J., Springston, S. R., Weinstein-Lloyd, J., et al. (2003). Photochemical age determinations in the phoenix metropolitan area: Photochemical age determinations in phoenix. J. Geophys. Res. 108, 2621. doi:10.1029/2002JD002621
Kley, D. (1997). Tropospheric chemistry and transport. Science 276, 1043–1044. doi:10.1126/science.276.5315.1043
Langford, A. O. (1999). Stratosphere-troposphere exchange at the subtropical jet: Contribution to the tropospheric ozone budget at midlatitudes. Geophys. Res. Lett. 26, 2449–2452. doi:10.1029/1999GL900556
Li, G., Bei, N., Tie, X., and Molina, L. T. (2011). Aerosol effects on the photochemistry in Mexico City during MCMA-2006/MILAGRO campaign. Atmos. Chem. Phys. 11, 5169–5182. doi:10.5194/acp-11-5169-2011
Li, K., Jacob, D. J., Liao, H., Qiu, Y., Shen, L., Zhai, S., et al. (2021). Ozone pollution in the North China Plain spreading into the late-winter haze season. Proc. Natl. Acad. Sci. U. S. A. 118, e2015797118. doi:10.1073/pnas.2015797118
Li, K., Jacob, D. J., Liao, H., Shen, L., Zhang, Q., and Bates, K. H. (2019). Anthropogenic drivers of 2013–2017 trends in summer surface ozone in China. Proc. Natl. Acad. Sci. U. S. A. 116, 422–427. doi:10.1073/pnas.1812168116
Li, K., Jacob, D. J., Shen, L., Lu, X., De Smedt, I., and Liao, H. (2020). Increases in surface ozone pollution in China from 2013 to 2019: Anthropogenic and meteorological influences. Atmos. Chem. Phys. 20, 11423–11433. doi:10.5194/acp-20-11423-2020
Liu, H., Liu, S., Xue, B., Lv, Z., Meng, Z., Yang, X., et al. (2018). Ground-level ozone pollution and its health impacts in China. Atmos. Environ. X. 173, 223–230. doi:10.1016/j.atmosenv.2017.11.014
Liu, Y., and Wang, T. (2020a). Worsening urban ozone pollution in China from 2013 to 2017 – Part 1: The complex and varying roles of meteorology. Atmos. Chem. Phys. 20, 6305–6321. doi:10.5194/acp-20-6305-2020
Liu, Y., and Wang, T. (2020b). Worsening urban ozone pollution in China from 2013 to 2017 – Part 2: The effects of emission changes and implications for multi-pollutant control. Atmos. Chem. Phys. 20, 6323–6337. doi:10.5194/acp-20-6323-2020
Lu, X., Zhang, L., Chen, Y., Zhou, M., Zheng, B., Li, K., et al. (2019a). Exploring 2016–2017 surface ozone pollution over China: Source contributions and meteorological influences. Atmos. Chem. Phys. 19, 8339–8361. doi:10.5194/acp-19-8339-2019
Lu, X., Zhang, L., and Shen, L. (2019b). Meteorology and climate influences on tropospheric ozone: A review of natural sources, chemistry, and transport patterns. Curr. Pollut. Rep. 5, 238–260. doi:10.1007/s40726-019-00118-3
Ministry of Ecology and Environment, (2013). Ministry of Ecology and Environment: Technical Specifications for Installation and Acceptance of Ambient air Quality Continuous Automated Monitoring System for SO2, NO2, O3 and CO. Available at: http://www.mee.gov.cn/ywgz/fgbz/bz/bzwb/jcffbz/201308/W020130802493970989627.pdf (Accessed July 16, 2022).
Ministry of Ecology and Environment, (2022). Technical Specification for Environmental Air Quality Assessment (Trial). Available at: http://www.mee.gov.cn/ywgz/fgbz/bz/bzwb/jcffbz/201309/t20130925_260809.shtml (Accessed July 16, 2022).
Ministry of Ecology and Environment, (2012). Ministry of Ecology and environment: Ambient air quality standards. Available at: https://english.mee.gov.cn/Resources/standards/Air_Environment/quality_standard1/201605/t20160511_337502.shtml (Accessed July 16, 2022).
Mu, M., and Zhang, R. (2014). Addressing the issue of fog and haze: A promising perspective from meteorological science and technology. Sci. China Earth Sci. 57, 1–2. doi:10.1007/s11430-013-4791-2
Ni, Z.-Z., Luo, K., Gao, X., Gao, Y., Fan, J.-R., Fu, J. S., et al. (2019). Exploring the stratospheric source of ozone pollution over China during the 2016 Group of Twenty summit. Atmos. Pollut. Res. 10, 1267–1275. doi:10.1016/j.apr.2019.02.010
Shan, W., Yin, Y., Zhang, J., and Ding, Y. (2008). Observational study of surface ozone at an urban site in East China. Atmos. Res. 89, 252–261. doi:10.1016/j.atmosres.2008.02.014
Shao, P., Xin, J., Zhang, X., Gong, C., Ma, Y., Wang, Y., et al. (2022). Aerosol optical properties and their impacts on the co–occurrence of surface ozone and particulate matter in Kunming City, on the Yunnan–Guizhou Plateau of China. Atmos. Res. 266, 105963. doi:10.1016/j.atmosres.2021.105963
Sillman, S., Logan, J. A., and Wofsy, S. C. (1990). The sensitivity of ozone to nitrogen oxides and hydrocarbons in regional ozone episodes. J. Geophys. Res. 95, 1837. doi:10.1029/JD095iD02p01837
Sillman, S. (1999). The relation between ozone, NOx and hydrocarbons in urban and polluted rural environments. Atmos. Environ. 25.
Silver, B., Reddington, C. L., Arnold, S. R., and Spracklen, D. V. (2018). Substantial changes in air pollution across China during 2015–2017. Environ. Res. Lett. 13, 114012. doi:10.1088/1748-9326/aae718
Simon, H., Reff, A., Wells, B., Xing, J., and Frank, N. (2015). Ozone trends across the United States over a period of decreasing NOx and VOC emissions. Environ. Sci. Technol. 49, 186–195. doi:10.1021/es504514z
Sirois, A., and Bottenheim, J. W. (1995). Use of backward trajectories to interpret the 5-year record of PAN and O 3 ambient air concentrations at Kejimkujik National Park, Nova Scotia. J. Geophys. Res. 100, 2867. doi:10.1029/94JD02951
State Council of the People’s Republic of China, (2018). State Council of the People’s republic of China: Notice of the state Council on printing and distributing the three-year action plan for winning the blue sky defense war. Available at: http://www.gov.cn/zhengce/content/2018-07/03/content_5303158.htm (Accessed July 16, 2022).
Su, T., Li, Z., and Kahn, R. (2018). Relationships between the planetary boundary layer height and surface pollutants derived from lidar observations over China: Regional pattern and influencing factors. Atmos. Chem. Phys. 18, 15921–15935. doi:10.5194/acp-18-15921-2018
Tie, X., Geng, F., Guenther, A., Cao, J., Greenberg, J., Zhang, R., et al. (2013). Megacity impacts on regional ozone formation: Observations and WRF-chem modeling for the MIRAGE-shanghai field campaign. Atmos. Chem. Phys. 13, 5655–5669. doi:10.5194/acp-13-5655-2013
Tie, X., Madronich, S., Li, G., Ying, Z., Weinheimer, A., Apel, E., et al. (2009). Simulation of Mexico City plumes during the MIRAGE-Mex field campaign using the WRF-Chem model. Atmos. Chem. Phys. 18, 4621–4638. doi:10.5194/acp-9-4621-2009
Wang, X., and Wang, K. (2016). Homogenized variability of radiosonde-derived atmospheric boundary layer height over the global land surface from 1973 to 2014. J. Climate 29 (19), 6893–6908. doi:10.1175/JCLI-D-15-0766.1
Wang, X., and Wang, K. (2014). Estimation of atmospheric mixing layer height from radiosonde data. Atmos. Measurement Tech. 7 (2). doi:10.5194/amt-7-1701-2014
Wang, W., Li, X., Shao, M., Hu, M., Zeng, L., Wu, Y., et al. (2019a). The impact of aerosols on photolysis frequencies and ozone production in Beijing during the 4-year period 2012–2015. Atmos. Chem. Phys. 19, 9413–9429. doi:10.5194/acp-19-9413-2019
Wang, X., Dickinson, R. E., Su, L., Zhou, C., and Wang, K. (2018). PM2.5 pollution in China and how it has been exacerbated by terrain and meteorological conditions. Bull. Am. Meteorol. Soc. 99, 105–119. doi:10.1175/BAMS-D-16-0301.1
Wang, X., Wang, K., and Su, L. (2016). Contribution of atmospheric diffusion conditions to the recent improvement in air quality in China. Sci. Rep. 6, 36404. doi:10.1038/srep36404
Wang, X., Zhang, L., and Moran, M. D. (2010). Uncertainty assessment of current size-resolved parameterizations for below-cloud particle scavenging by rain. Atmos. Chem. Phys. 10, 5685–5705. doi:10.5194/acp-10-5685-2010
Wang, X., and Zhang, R. (2020). How did air pollution change during the COVID-19 outbreak in China? Bull. Am. Meteorol. Soc. 101, E1645–E1652. doi:10.1175/BAMS-D-20-0102.1
Wang, X., Zhang, R., Tan, Y., and Yu, W. (2021). Dominant synoptic patterns associated with the decay process of PM2.5 pollution episodes around Beijing. Atmos. Chem. Phys. 21, 2491–2508. doi:10.5194/acp-21-2491-2021
Wang, X., Zhang, R., and Yu, W. (2019b). The effects of PM 2.5 concentrations and relative humidity on atmospheric visibility in beijing. J. Geophys. Res. Atmos. 124, 2235–2259. doi:10.1029/2018JD029269
Won, W.-S., Oh, R., Lee, W., Ku, S., Su, P.-C., and Yoon, Y.-J. (2021). Hygroscopic properties of particulate matter and effects of their interactions with weather on visibility. Sci. Rep. 11, 16401. doi:10.1038/s41598-021-95834-6
Wu, X., Xin, J., Zhang, W., Gao, W., Ma, Y., Ma, Y., et al. (2022). Variation characteristics of air combined pollution in Beijing City. Atmos. Res. 274, 106197. doi:10.1016/j.atmosres.2022.106197
Xiao, Q., Ma, Z., Li, S., and Liu, Y. (2015). The impact of winter heating on air pollution in China. PLOS ONE 10, e0117311. doi:10.1371/journal.pone.0117311
Xu, D., Yap, D., and Taylor, P. A. (1996). Meteorologically adjusted ground level ozone trends in Ontario. Atmos. Environ. X. 30, 1117–1124. doi:10.1016/1352-2310(95)00331-2
Yin, Z., Li, Y., and Cao, B. (2020). Seasonal prediction of surface O3-related meteorological conditions in summer in North China. Atmos. Res. 246, 105110. doi:10.1016/j.atmosres.2020.105110
Yin, Z., Wang, H., and Chen, H. (2017). Understanding severe winter haze events in the north China plain in 2014: Roles of climate anomalies. Atmos. Chem. Phys. 17, 1641–1651. doi:10.5194/acp-17-1641-2017
Yue, X., Unger, N., Harper, K., Xia, X., Liao, H., Zhu, T., et al. (2017). Ozone and haze pollution weakens net primary productivity in China. Atmos. Chem. Phys. 17, 6073–6089. doi:10.5194/acp-17-6073-2017
Zhai, S., Jacob, D. J., Wang, X., Shen, L., Li, K., Zhang, Y., et al. (2019). Fine particulate matter (PM2.5) trends in China, 2013–2018: Separating contributions from anthropogenic emissions and meteorology. Atmos. Chem. Phys. 19, 11031–11041. doi:10.5194/acp-19-11031-2019
Zhang, R., Li, Q., and Zhang, R. (2014). Meteorological conditions for the persistent severe fog and haze event over eastern China in January 2013. Sci. China Earth Sci. 57, 26–35. doi:10.1007/s11430-013-4774-3
Zhang, R. (2017). Warming boosts air pollution. Nat. Clim. Chang. 7, 238–239. doi:10.1038/nclimate3257
Zhang, Y.-L., and Cao, F. (2015). Fine particulate matter (PM2.5) in China at a city level. Sci. Rep. 5, 14884. doi:10.1038/srep14884
Zhong, Q., Tao, S., Ma, J., Liu, J., Shen, H., Shen, G., et al. (2021). PM2.5 reductions in Chinese cities from 2013 to 2019 remain significant despite the inflating effects of meteorological conditions. One Earth 4, 448–458. doi:10.1016/j.oneear.2021.02.003
Zhu, B., Kang, H., Zhu, T., Su, J., Hou, X., and Gao, J. (2015). Impact of Shanghai urban land surface forcing on downstream city ozone chemistry: Urban land-surface forcing on ozone. J. Geophys. Res. Atmos. 120, 4340–4351. doi:10.1002/2014JD022859
Keywords: PM2.5, O3, meteorological mechanisms, Shanghai, backward trajectory
Citation: Sun Y and Wang X (2022) Meteorological factor contributions to the seesaw concentration pattern between PM2.5 and O3 in Shanghai. Front. Environ. Sci. 10:1015723. doi: 10.3389/fenvs.2022.1015723
Received: 10 August 2022; Accepted: 30 September 2022;
Published: 13 October 2022.
Edited by:
Zhiyuan Hu, School of atmospheric sciences, Sun Yat-sen University, ChinaReviewed by:
Zhicong Yin, Nanjing University of Information Science and Technology, ChinaYongjing Ma, Institute of Atmospheric Physics (CAS), China
Bing Pu, University of Kansas, United States
Copyright © 2022 Sun and Wang. This is an open-access article distributed under the terms of the Creative Commons Attribution License (CC BY). The use, distribution or reproduction in other forums is permitted, provided the original author(s) and the copyright owner(s) are credited and that the original publication in this journal is cited, in accordance with accepted academic practice. No use, distribution or reproduction is permitted which does not comply with these terms.
*Correspondence: Xiaoyan Wang, d2FuZ3h5ZmRAZnVkYW4uZWR1LmNu