 Guoyu Wang
 Jinsheng Zhou
94% of researchers rate our articles as excellent or good
Learn more about the work of our research integrity team to safeguard the quality of each article we publish.
Find out more
ORIGINAL RESEARCH article
Front. Environ. Sci., 29 September 2022
Sec. Environmental Economics and Management
Volume 10 - 2022 | https://doi.org/10.3389/fenvs.2022.1015361
This article is part of the Research TopicToward Achieving Carbon Neutrality: The Role of Energy Resilience in Managing Climate Change ChallengesView all 18 articles
Abstract: This paper investigates how regional energy endowment affects carbon emissions and whether energy capacity aggregation plays a mediating role. In the context of the “double carbon target”, it is important to study the relationship between energy endowment and carbon emission growth to formulate reasonable and effective energy policies in the region. Based on the panel data of 30 Chinese provinces from 2008 to 2019, this paper investigates the mechanism of the role between energy endowment, energy capacity aggregation, and carbon emissions using the spatial Durbin model. The results show that: 1) Carbon dioxide emissions have significant positive spatial autocorrelation. 2) Energy endowment and energy capacity aggregation increase provincial carbon emissions. For each unit increase in energy endowment and energy capacity aggregation level, regional carbon emissions will increase by 0.0423 and 0.0564 units. Moreover, the effect of energy endowment on carbon emissions has a spatial spillover effect. 3) The intermediary effect test finds that energy capacity aggregation plays an intermediary role in the energy endowment affecting carbon emissions. Therefore, this paper verifies that energy endowments promote regional carbon emissions and that the energy capacity aggregation effect plays a mediating role. The research results provide theoretical guidance for solving the contradictory problem of energy demand growth on carbon emission limitation and promoting regional green and low-carbon development.
The increasing global warming problem has made carbon emission research a hot issue in domestic and international academia, and many academics are concerned about China’s environmental degradation (Xiaojun et al., 2018). China generates large amounts of carbon emissions during rapid industrialization and high economic development (Asumadu and Vladimir, 2019; Lu et al., 2021). China’s carbon emissions increased by 3.4% from 2018 to 9.825 billion tons in 2019 (Liu and Liu, 2021; Lu et al., 2021). It is generally believed that the higher the energy endowment of a region, the better its foundation for capital accumulation and economic take-off (Xue et al., 2020). However, with the irrational exploitation of resources and energy sources, regions with high energy endowment may not only show the “resource curse” phenomenon economically (Auty, 2007; Vahabi, 2018) but also may experience environmental degradation (Li et al., 2018; Wu L et al., 2021). Therefore, solving the problem of energy overdependence and rational and orderly energy development is the key to achieving high-quality development and a necessary way to promote green economic transformation. While considering economic growth, China insists on a green and sustainable economic development path. China is determined to reduce its carbon emissions and has solemnly set a “double carbon” target of “peak carbon” by 2030 and carbon neutrality by 2060 in front of the international community (Liu et al., 2019). Therefore, various industries are actively developing decarbonization programs. For example, Xiang et al. (2022) used the decomposing structural decomposition method to assess the progress of decarbonization of commercial building operations in 16 countries over the past 20 years.Yan et al. (2022) investigated the changes in operational carbon emissions and their drivers in provincial residential buildings. However, the energy factors for reducing carbon emissions have not been effectively explored, China’s low energy utilization rate leads to high pressure for carbon emission reduction (Zhang, 2019), and the pressure for carbon emission reduction varies among provinces due to their different energy endowments. Therefore, it is important to analyze the causes of carbon emission growth from the energy endowment sub-perspective for each province to implement carbon emission reduction policies according to local conditions.
China’s energy endowment is uneven in regional distribution and has a “high carbon” characteristic. Radium et al. (2020) argued that energy and resource exploitation involves a region’s industrial structure, employment structure, and technology level, and its importance in factor market-oriented reforms is becoming more and more significant. Liang and Song (2012) argued that regions with high energy endowments were prone to develop the industrial potential for resource utilization, shifting energy production from energy-poor or under-exploited regions to energy-rich or highly developed regions (Liu and Zhang, 2021a). Xue et al. (2020) found that after energy production capacity increases, energy-intensive industries will inevitably cluster in these regions, and energy-oriented industrial clustering will increase energy consumption. We can see that although the research on energy endowment and carbon emissions has been based on some evidence, most of the studies are fragmented and cannot reveal the mechanisms involved. Because of this, we try to explore the energy production mechanism of energy endowment affecting carbon emission.
The following are the contributions and advances made by this study. First, the spatial impact of energy endowment and energy capacity aggregation on provincial CO2 is analyzed. Second, energy endowments, energy capacity aggregation, and carbon emissions are integrated into a unified analytical framework. Thus, the findings contribute to understanding the mechanisms by which energy endowments affect carbon emissions. Third, in terms of research methodology, given the significant spatial correlation of carbon emissions, a spatial Durbin model is selected in this study to determine the spatial spillover effects among the variables.
The rest of this paper is organized as follows: The second part conducts a literature review. The third part establishes the empirical model and interprets the data sample. The fourth part discusses and analyzes the empirical results. Conclusions and recommendations are given in the fifth part.
In studies related to carbon emission influence factors, experts and scholars have analyzed the influence factors of carbon emission in different regions and industries from a regional perspective and industry segmentation perspective. Relevant studies have considered the urbanization factor (J. Li, 2020), renewable energy factor (Dogan and Seker, 2016), energy consumption factor (Alam et al., 2016), industry factor (Wang et al., 2019), financial factors (Syed et al., 2019), policy factors (Hashmi and Alam, 2019) and technological innovation factors (Gu et al., 2020) etc. Are the main factors affecting carbon emissions. Existing research has not yet evaluated the reasons for the increase in energy resources and production capacity-related CO2 emissions, which is the most important difference between this research and the previous literature, and it is also the innovation of this paper.
Economic geography theory suggests that industries will concentrate in areas with favorable factor endowments because proximity generates positive externalities or “agglomeration effects” (Head et al., 1995). It is generally believed that firms in high factor-intensity industries choose regions with abundant factor endowments, so the advantage of energy endowments attracts energy-intensive industries to energy-producing regions, which results in the aggregation of energy production capacity in a given region (Kim, 1999). Agglomeration gains also shape productive capacity, leading to two countries with the same endowment receiving very different shares of investment in particular industries (Head et al., 1995). Combining energy and agglomeration advantages further concentrates energy production capacity in a particular region. For example, Crafts and Mulatu (2006) argued that there is a coupling between the location of high coal-consuming firms in the United Kingdom and energy-rich regions. Grether et al. (2014) found that for each standard deviation increase in coal or natural gas resources, activity in energy-intensive industries increases by 20–25%. Hotz (2012) argued that in China, energy is the driver of industrial activity specialization and that most energy production is concentrated in areas with higher energy endowments. Grether et al. (2014)found that larger energy endowments are significantly associated with greater production in energy-intensive sectors and that energy endowments exacerbate the geographic concentration of energy production.
However, it has also been argued that energy endowment is not a major determinant of the aggregation of energy production capacity and that as access to transportation and the advantages of other non-energy factors strengthen, energy production may become segmented from where energy is extracted. For example, Song et al., 2018 argued that the separation of energy origin and energy production capacity in terms of spatial location is created, while the mismatch between energy production agglomerations and energy consumption areas is gradually increasing due to the resource curse. Such a conclusion contradicts the assumption of the Heckscher-Ohlin (HO) model that produce aggregates in factor-rich regions but validates that trade occurs in regions between different factor endowments.
The factor endowment theory suggests that energy-rich regions have greater energy use inertia and usage and may increase carbon emissions due to energy consumption. Energy endowment has been shown to be positively associated with regional carbon emission intensity (Jiang and Ji, 2011; Zhang and Zhang, 2015). Zafar et al. (2021) found that abundant resources and energy endowments increase carbon emissions. L. Wu et al. (2021)argued that energy endowment can make regional industries more energy dependent by shaping the regional industrial structure, increasing CO2 emissions.
According to some academics, the “resource curse” effect prevents regional economic growth while economic stagnation lowers carbon emissions. They thus suggested that there is a conflict between CO2 and energy endowment. However, this relationship is mostly found in other countries and has not been confirmed in China. For example, Wu X et al. (2021) found that abundant natural resources in MENA countries significantly improve environmental quality. Hanif et al. (2019) found that natural resources and renewable energy consumption improve environmental quality using data from 1971 to 2016 for the United States. Sun X et al. (2021) found that the main way in which energy resource endowments curb carbon emissions is through the “resource curse” effect, which curbs the growth of energy consumption and carbon emissions by reducing per capita income.
Jacob’s externality theory argues that although it can increase economic efficiency, aggregation of production may also bring negative externalities. The expansion of the scale of energy output and the increase in consumption demand lead to a spatial agglomeration of energy production capacity. Industries in regions where energy production is concentrated will develop inertia of energy dependence, which eventually results in a “high carbon” economic development path leading to a “resource curse" (Bian and Yu, 2019). For example, Wen and Liao (2019) found that industrial agglomeration can increase local carbon emissions by expanding production scale and increasing production capacity. Chen, Chen, and Jin (2018) found that industrial agglomeration decreased industrial co2 emission intensity but increased co2 emissions. Sun Z et al. (2021) used panel data from 285 cities above the prefecture level in China and found that the agglomeration of low-end production and domestic services similar to energy production harmed carbon emission efficiency. However, it has also been argued that the agglomeration of energy production generates inter-firm economic scale effects and technology spillovers that accelerate the diffusion of clean technologies and thus improve local environmental conditions (Krugman, 1998). For example, Peng et al. (2020)suggested that industrial output at a large scale under circumstances of economic agglomeration is favorable to enhanced carbon performance. Shiqiang et al. (2021) found significant regional heterogeneity in the spatial agglomeration of energy capacity on energy efficiency.
To summarize, the existing literature not only rarely incorporates spatial factors into the study of energy endowments and carbon emissions. The mechanisms by which energy endowments affect CO2 emissions have not been explored, and it is even rarer to include energy endowments, energy capacity aggregation, and carbon emissions in the same analytical framework. Given the aforementioned holes in the study, the link between energy endowments, energy capacity aggregation, and CO2 emissions is investigated using a spatial econometric model. The findings of this study not only help to solve the conflict between energy demand growth and carbon emission limitation due to economic growth but also provide a scientific theory for the rational use of energy endowment advantages by regions to adjust energy production capacity while controlling carbon emission.
1 Energy Endowment
The measurement of energy endowment has some variability in the existing literature (Qiu and Chen, 2020). As the most important type of energy, primary energy accounts for an absolute proportion of total energy production and consumption in China, and thus energy abundance can be measured in terms of primary energy. Therefore, this paper adopts the approach of most of the literature (Wu L et al., 2021)and uses the ratio of primary energy production per capita in each region to the national primary energy production per capita to measure the energy endowment of each region.
2 Carbon Emissions
In this paper, CO2 emissions are calculated using the carbon emission factor method, and the formula for calculating CO2 emissions according to the IPCC method is as follows:
where, CE is CO2 emissions, i represents eight different energy types. E represents the consumption of these different types of energy (natural gas in billions of cubic meters and other energy sources in tons). NCV, CEF, and COF are the average low-level heating value, carbon emission factor, and oxidation rate of these eight energy sources, respectively. 44 and 12 are the molecular weights of CO2 and carbon.
3 Energy Capacity Aggregation
Since energy resources are naturally occurring, their endowment does not change due to economic agglomeration. The spatial agglomeration of energy capacity is caused by energy resource development constraints and national energy capacity layout. Due to the dependability of energy resources, with the continuous development and utilization of energy resources, the energy capacity in depleted areas gradually depletes, and the proportion of energy capacity in agglomeration areas gradually increases, which leads to the phenomenon of energy resources showing agglomeration to energy agglomeration areas. In order to describe the degree of spatial agglomeration of energy production capacity, this paper constructs a measurement model of it (Shiqiang et al., 2021), drawing on the expression of locational entropy (Liu and Zhang, 2021b). The index reflects the degree of concentration of fossil energy production in each province relative to the national fossil energy production.
where,
4 Control variables
Carbon emissions will also be influenced by many factors, such as the level of economic development, technological innovation, and industrial structure. In analyzing the influencing factors, these variables need to be controlled to minimize the bias brought by other uncontrollable factors to the model.
1) Economic development (GDP): Considering the influence of the difference in economic development level between resource-based and non-resource-based regions on CO2 emissions, we use the GDP of each province as a proxy variable for economic development level.
2) Technological innovation (INO): Technological innovation is one of the reasons affecting carbon emissions, so this paper controls the level of technological innovation and chooses the number of patent applications granted per 10,000 people as technological innovation.
3) Marketization level (MK): It affects the business ecology of the region, and the adoption of marketization instruments under government domination will affect enterprise production and thus carbon emissions. In this paper, the ratio of fiscal expenditure to regional GDP is used to measure the degree of market-oriented allocation of resources (Qiu and Chen, 2020).
4) Environmental regulation (ES): Government environmental regulation can effectively improve the efficiency of resource use and thus environmental quality. In this paper, the share of environmental expenditure in regional GDP is used, referring to the practice of most scholars.
5) Openness (OP): The government’s expansion of openness to attract foreign investment may attract high technology industries while also introducing high energy-consuming enterprises, thus affecting carbon emissions. This paper uses the ratio of total imports and exports to GDP to measure the degree of openness (Pan et al., 2022).
6) Population size (PEO): According to the IPAT model, population, affluence, and technology are the three key indicators of carbon emissions, and population size plays a crucial role in carbon emissions. Therefore, in this paper, the total population of each province is used as a proxy variable for population size.
7) Advanced of industrial structure (INS): The transformation process of industrial structure from low-level to high-level form is inevitably accompanied by the development of high-energy-consuming and high-emission industries to the direction of service, which affects carbon emissions. This paper uses the ratio of tertiary industry output value to secondary industry output value to measure the advanced industrial structure (Xin-gang and Jin, 2022).
The IPAT model is a classic model for studying economic growth and energy consumption. Based on the IPAT model and considering the effects of affluence, technology level, and population, this study creates the following basic model.
where i denotes different provinces, t denotes year,
Traditional econometric models are basically “mean reversion” models. Although economic activities are often spatially interrelated, traditional econometric models assume that the objects of study are independent of each other. Therefore, to compensate for general econometric models’ shortcomings, this study uses spatial econometric models to examine the relationship between variables. The LM, LR, and Hausman test results (Table 1) indicate that this paper fits the fixed effects Durbin model.
1) The following econometric panel models are constructed to test the direct effects of energy endowments and energy capacity aggregation on CO2 emissions in China.2
2) This paper uses the following econometric panel model to test the mediating role.
Where,W denotes the spatial weight matrix;
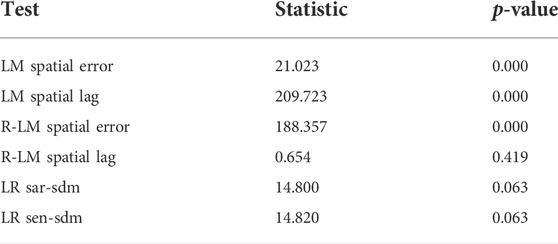
TABLE 1. Results of LM test and LR test.
According to the test for mediating effects, step 1 regresses Eq. 4 to test whether the effect of energy endowment on carbon emissions exists. If the coefficient
In defining the spatial weight matrix, the first step is to quantify the location of spatial units based on “distance”. The distances usually used in existing studies are neighborhood, geographic, economic, industrial, and technological. This paper uses geographic distance to construct the spatial weight matrix. The premise of the geographic distance weight matrix is that interaction between provinces may exist, but the interaction is more frequent among cities nearby. In this study, the economic distance matrix is used in addition to the geographical weight matrix to ensure the robustness of the empirical formula. The economic geography matrix measures the degree of proximity between provinces by the inverse of the difference in GDP between the two provinces. The premise of this matrix assumes that the smaller the economic gap between cities, the stronger the mutual influence of the regions, and the closer the distance between the two places, the more frequent the economic exchanges. The specific forms of the two matrices are as follows.
Exploratory spatial-temporal data analysis (ESTDA) is a statistical method to detect and quantify the spatial dependence of sampling changes in different calibration points based on a spatial weight matrix. The ESTDA method can effectively reveal the spatial relationship between any geographic unit and its neighboring units and the degree of association. The global spatial autocorrelation analysis is a general measure of spatial autocorrelation between regions. It is usually performed by the global Moran’s I index to determine whether spatial autocorrelation exists in each province and region and the degree of influence and direction of effect. The global Moran’s I index is calculated by the following formula:
where I is the global Moran’s I, the
The local spatial autocorrelation index can be expressed as the Local Moran’s I index:
Due to the serious lack of data for some years in Tibet and the original availability and continuity of data, the research subjects of this paper are finally selected as 30 provincial administrative units in China, and the research period is 2008–2019. The energy consumption and economy data are obtained from the China Statistical Yearbook, the China Energy Statistics Yearbook, and the statistical yearbooks of each province. The reference coefficient of energy equivalent standard coal and carbon emission coefficient are obtained from the China Energy Statistics Yearbook and the IPCC’s Guide to National Greenhouse Gas Emission Inventories, respectively. The descriptive statistics of the main variables are shown in Table 2.
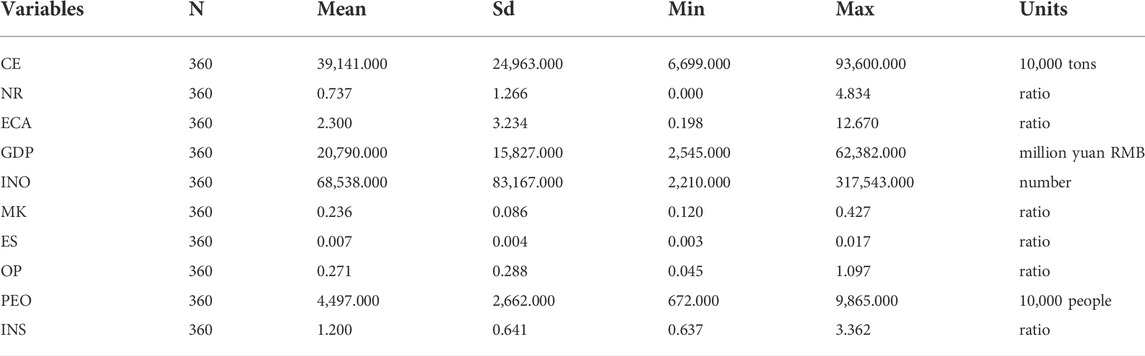
TABLE 2. Descriptive statistics for each variable.
To facilitate comparison and test the robustness of the parameter estimates of each variable, Table 3 reports the estimation results of the different regression models. Table 3 shows that the regression coefficients of energy endowment and energy capacity aggregation on carbon emissions are positive and significant at certain levels under least squares, fixed effects, and random effects, so it can be tentatively obtained that energy endowment and energy capacity aggregation have significant contributions to carbon emissions.
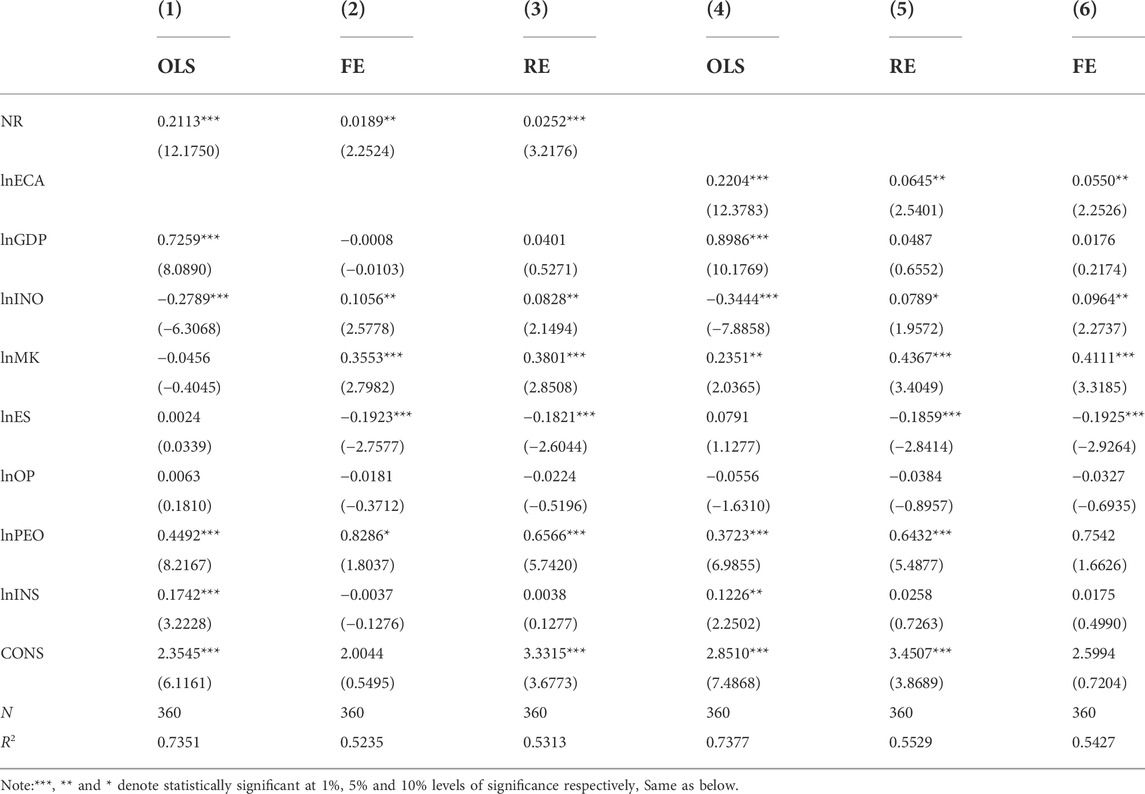
TABLE 3. Preliminary estimation results.
Since there may be a spatial dependence on carbon emissions, this part uses Moran’s I index to discuss the spatial dependence of carbon emissions in China. The results of its test are shown in Table 4. From the test results in Table 4, it can be seen that the Moran’s I index of carbon emissions is significantly positive, indicating a high-high (low-low) agglomeration of carbon emissions in China.
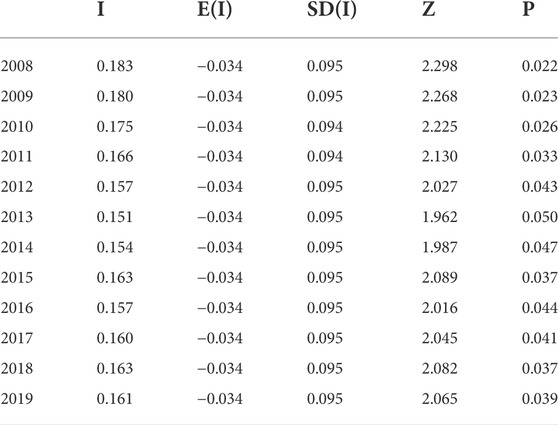
TABLE 4. Moran'I and its statistical test results.
Further, this paper analyzes the spatial heterogeneity of carbon emissions in China’s provinces based on the one-tailed test of geographic distance weights and draws Moran'I scatterplots using the values of CO2 emissions in 2008, 2012, 2016, and 2019, respectively (Figure 1). The four quadrants of the local Moran'I scatterplot correspond to the forms of spatial linkages between provinces and their neighboring regions. From the results, the quadrant and location of each province do not change significantly when the temporal order of the Moran'I scatter diagram changes, indicating that there is a relatively stable spatial autocorrelation of carbon emission levels in China. Moreover, most provinces show high-value and low-value clustering of carbon emissions, which further proves the existence of positive spatial dependence of carbon emissions among the 30 provinces in China.
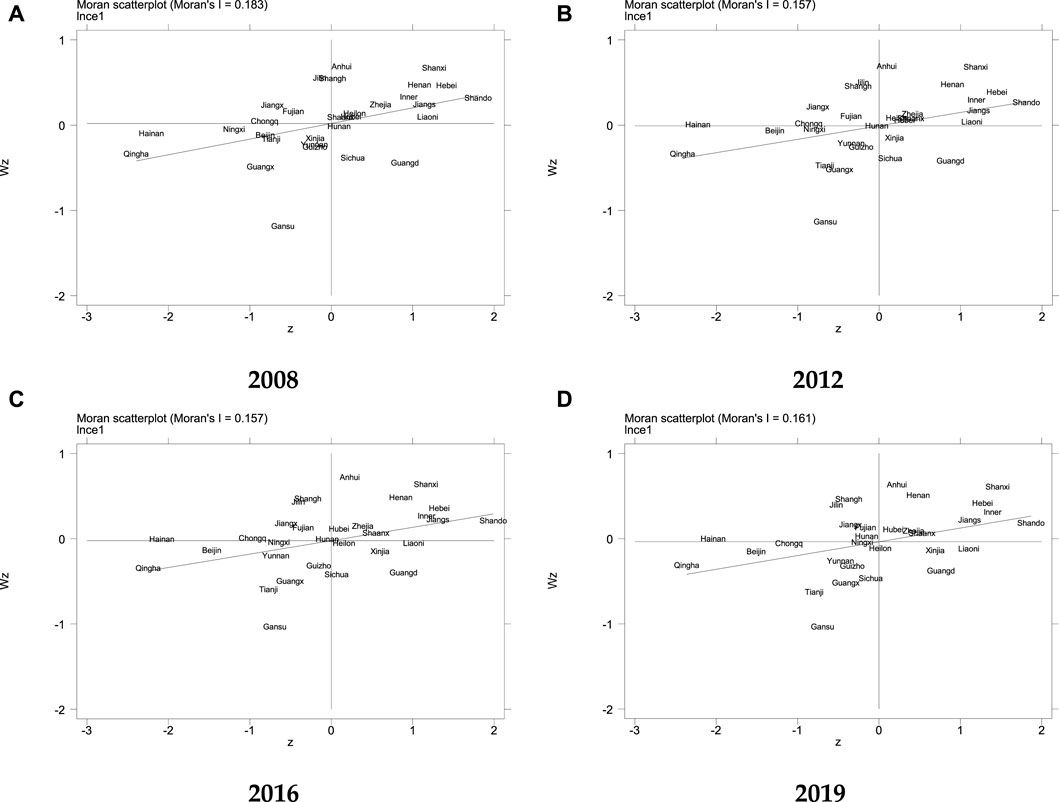
FIGURE 1. (A) Moran'I scatter plot of provincial carbon emissions in 2008; (B) Moran'I scatter plot of provincial carbon emissions in 2012; (C) Moran'I scatter plot of provincial carbon emissions in 2016; (D) Moran'I scatter plot of provincial carbon emissions in 2019.
Table 5 presents the estimation results of energy endowment and energy capacity aggregation. The results found: 1)in models 1) and 3), the regression coefficients of energy endowment are positive and pass the significance test at the 1% level, indicating that energy endowment promotes the increase of CO2 emissions; 2)In models 2) and 4), the regression coefficients of energy capacity aggregation are positive and pass the significance test at the 5% and 1% levels, respectively, demonstrating that higher levels of energy capacity aggregation encourage higher CO2 emissions.
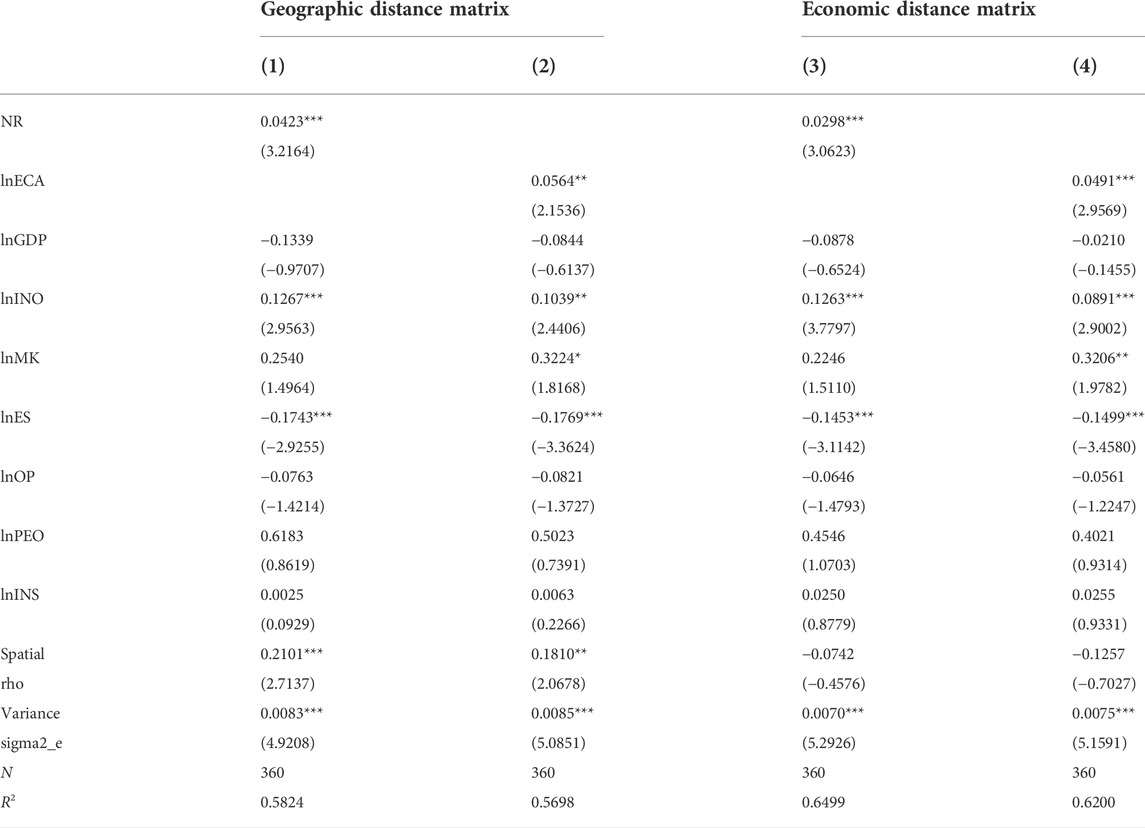
TABLE 5. Estimation results of energy endowment and energy capacity aggregation.
The above results show that both energy endowment and energy capacity aggregation significantly contribute to carbon emissions in China. This result is a good answer to the question of whether energy endowment and energy capacity aggregation can contribute to carbon emissions or not. The finding provides an important basis for complementing the energy causes of regional carbon emission growth. The verification of the relationship between energy endowment and carbon emission is consistent with the conclusion of Wu L et al. (2021), the verification of the role of energy capacity aggregation in promoting carbon emission is the unique finding of this paper. The former relationship may arise because the cost of using fossil energy is much lower in regions with larger energy reserves than in other regions, which stimulates energy consumption on the consumption side. Due to the dominance of local resource endowments, energy and resource development is often haphazard or overexploited, leading to inefficient energy use. As a result, the increase in energy supply and demand leads to a gradual increase in carbon emissions. The latter result may be that the spatial agglomeration of energy capacity makes the regions with higher energy endowment increase the development and utilization of resources. Along with the spatial agglomeration of energy capacity, energy-intensive industries are also spatially clustered in the same region, increasing carbon emissions in energy capacity agglomeration areas. Although this section verifies that energy endowment and energy capacity agglomeration promote carbon emissions, respectively, the existence of spillover effects in space has not yet been verified, so the next section of this paper is conducted to test the spillover effects.
Table 6 shows the direct and indirect effects of energy endowment and energy capacity aggregation on carbon emissions. From the test results of the decomposition of spatial effects, it can be concluded that: 1) under the direct effect, energy endowment positively affects carbon emissions, i.e., the advantage of local energy endowment will promote local carbon dioxide emissions; the regression coefficient of energy capacity aggregation on carbon emissions is also significantly positive, indicating that the local aggregation of energy capacity will promote local carbon dioxide emissions; 2)under the indirect effect, the spillover effect of energy capacity aggregation is not significant, while the coefficient of energy endowment is −0.0885 under the distance weight matrix and −0.0880 under the economic weight matrix, and both pass the significance test.
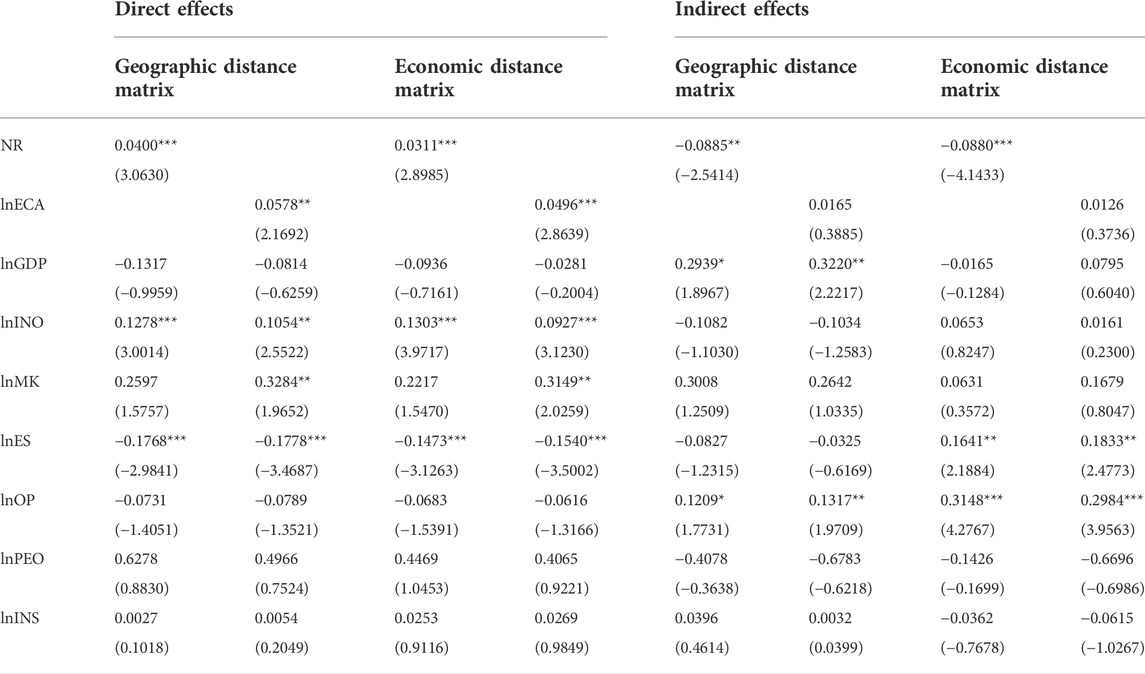
TABLE 6. Estimation results of decomposition effects.
This indicates a spillover effect of energy endowment on carbon emissions, and it is negative, i.e., stronger local energy endowment will reduce carbon emissions in the surrounding areas. This result is an important finding that energy factors affect spatial carbon emissions, providing a theoretical basis for inter-regional synergistic emission reduction and identification of emission reduction responsibilities. The spillover effect of energy endowment on carbon emissions has been affirmed in previous studies, but the results of the direction of influence are different. This may be due to the differences in energy endowments among Chinese provinces, and regional differences in the selection of study areas lead to different results. The test method of spillover effect can also use methods such as the Granger causality test method and complex network. The former is applicable to smooth data, while the latter mainly uses “relationship” as the research theme. In the framework of the spatial econometric model, the test method of solving partial differential used in this paper seems more common and reasonable. The test results based on this method provide a good answer to whether energy endowments have a spillover effect on carbon emissions. The pollution refuge effect may cause this negative spillover. If there are two geographically adjacent regions, the adjacent region tends to rely more on the resources of the region with higher energy endowment, leading to over-exploitation of energy in the region with higher energy endowment. Therefore pollution from the adjacent region is transferred to the region with a higher energy endowment.
In order to examine whether energy capacity aggregation has a mediating role in energy endowments affecting carbon emissions, this paper applies a mediating effects model to test. The estimation results with different spatial weights are presented in Table 7.
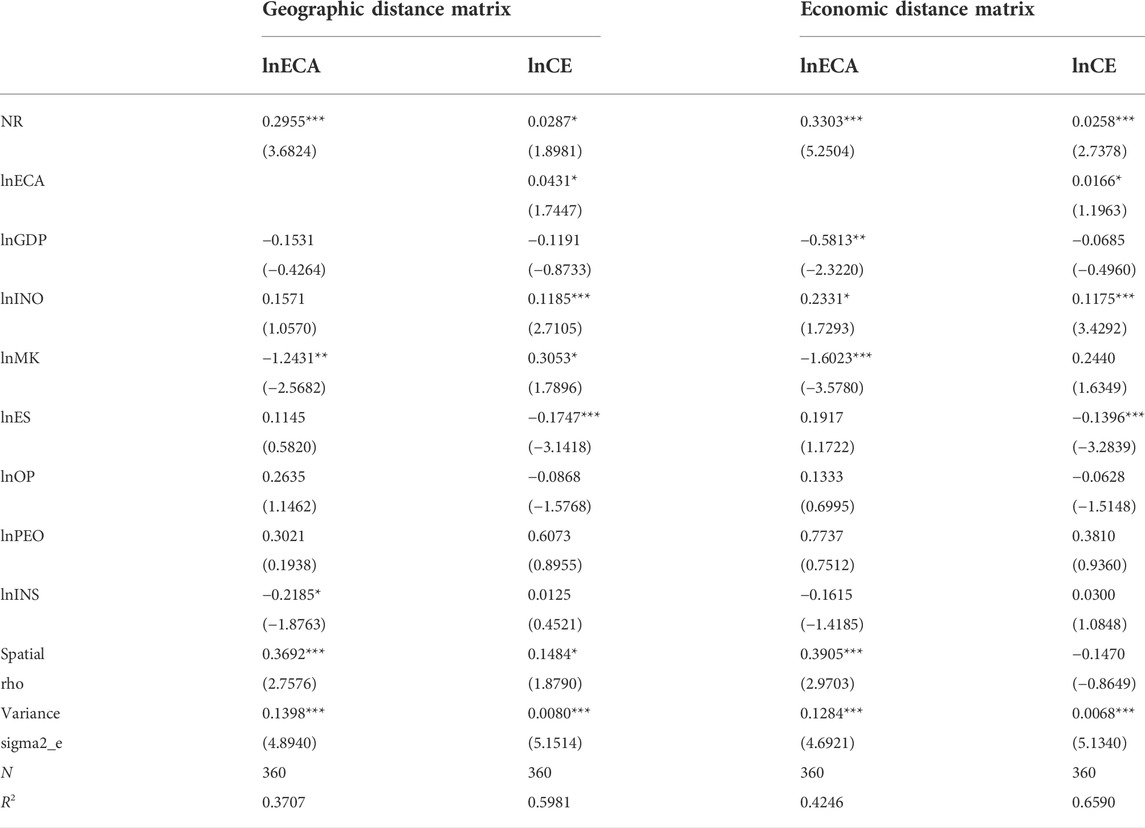
TABLE 7. Test results of intermediary effect.
In this paper, combining the results of Table 7 and the previous tests, Table 8 presents the analysis of the mediating effects. The coefficient estimate of energy endowment in Eq. 4 in the first stage is significantly positive (
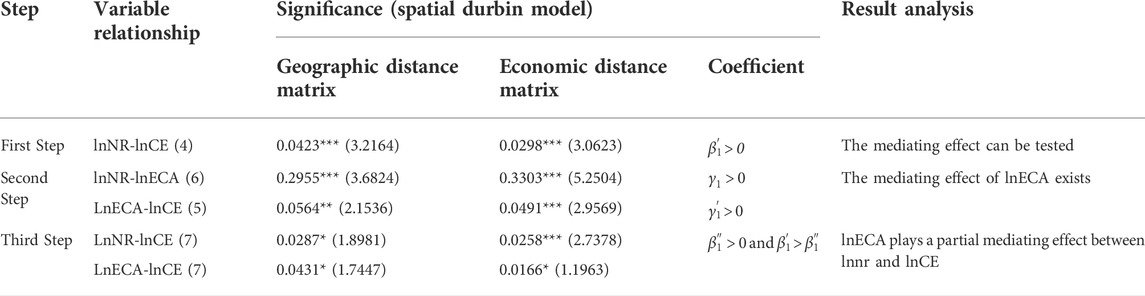
TABLE 8. Analysis of mediating effects.
The empirical results explore the transmission mechanism of the environmental impact of energy endowments: i.e., energy endowments promote the formation of energy capacity aggregation effects and thus regional carbon emissions. Some scholars have demonstrated that the resource curse partially exists in China, and this hypothesis assumes that resource surplus will lead to stagnant economic development and carbon emissions will decrease as the economic heat decreases. However, the results of this paper show that energy endowment is positively related to carbon emissions. This may be because other mediating factors outweigh the effects of economic development and carbon emission growth in the same direction. Thus, this paper innovatively explores the transmission mechanism of energy endowment on environmental impact and verifies the mediating role of energy endowment in it. This is unique among previous research findings, and this is the most important innovation of this paper. Therefore, the discovery of this mechanism may bring important insights into controlling carbon emissions in regions with large energy endowments. That is, carbon emissions in regions with larger energy endowments can be reduced by rationalizing the spatial layout of energy production capacity and avoiding excessive concentration of energy production in energy-rich regions.
The following possible reasons can justify this mediating effect:Regional energy endowment reinforces the incentive of “distributive effort”, which will stimulate more energy exploitation, thus triggering many externalities and a continuous agglomeration of regional energy use, and the resource utilization pattern will be changed accordingly. On the one hand, regions with high energy endowments will enjoy “resource benefits” in the early stage of development due to their local energy advantages, and most tend to prioritize energy industries. The excessive development of energy-dependent industries in energy-rich areas has a significant “crowding-out effect” on the development of other industrial sectors, making energy resource industries the core industries. This situation has caused the problem of irrational industrial structure, which gradually gathers energy production capacity in the local area. On the other hand, areas with poor energy endowments are less likely to become the production end of energy products because of their inferior resources. However, to ensure economic development, most regions with poor energy endowments are committed to developing manufacturing and industry, which generates a large amount of energy consumption demand. This spatial mismatch between energy demand and production and industrial division of labor deepens the demand for energy production capacity in energy-deficient regions, further intensifying energy production capacity aggregation in energy-rich regions. As energy production capacity accumulates in local areas, energy production capacity will be gradually oversupplied. The excess capacity decreases the local energy use cost, making the consumption of primary energy become the inertia behavior of energy consumption. This consumption inertia hinders the innovation and use of renewable energy sources; thus, the aggregation of energy capacity promotes carbon emissions. The spatial aggregation of energy capacity may lead to uncontrolled misuse of local energy sources. Increased energy intensity due to rough energy use further contributes to CO2 emissions.
This paper empirically examines the effects of energy endowment and energy capacity aggregation on carbon dioxide emissions. The results show: (1)carbon dioxide emissions have significant spatial autocorrelation; (2)energy endowment and energy capacity agglomeration promote the increase of provincial carbon emissions; 3) the effect of energy endowment on carbon emissions has a spatial spillover effect. In addition, the mediating effect test reveals that energy capacity aggregation plays a mediating role in the energy endowment affecting CO2.
Based on China’s current resource situation and combining theoretical and empirical analysis, this paper argues that provinces need to do the following to actively achieve “peak carbon".
1) Rational use of energy endowment advantages and strengthening inter-regional joint prevention and control of resources and environment and collaborative management. Natural resource authorities should increase the supervision and punishment of natural resource violations to promote the realization of good order in energy development and utilization to mitigate the adverse effects of energy over-exploitation on carbon emissions. Meanwhile, Carbon emission intensity has a significant positive spatial correlation and spatial spillover effect, regions with higher carbon emissions will also drive the growth of carbon emissions in neighboring regions. Therefore, it is necessary to strengthen regional joint prevention and control to achieve carbon emission reduction. Each region should jointly formulate carbon emission reduction measures and establish and improve inter-regional interest coordination mechanisms to form a carbon emission reduction community.
2) Optimizing the layout of energy production capacity and resolving the contradiction between the reverse distribution of energy production and consumption centers. Since the results of the mediating effect suggest that regions with higher energy endowments can promote carbon emissions through the aggregation of energy production capacity, an effective path to reducing carbon emissions in regions with higher energy endowments is to avoid excessive concentration of energy production capacity. The specific policy implication is that the government should avoid the phenomenon that energy-rich areas are energy-producing areas, reasonably plan the spatial layout of regional energy production capacity, and gradually guide the decentralization of energy production capacity to areas outside energy-rich areas. The government should consider separating energy production and consumption centers while alleviating the spatial mismatch between the layout of energy industries and the carrying capacity of resources and the environment. Energy production and processing depend not only on the origin side, but the government can also lay them out in areas with convenient transportation or more profitable consumption markets, such as ports. At the same time, energy-rich regions should change their development methods, replace energy with information flow and talent flow as new growth engines, and play the spatial agglomeration of other production factor flows to achieve industrial “decarbonization".
3) The government should increase energy innovation in the future and promote the continuous optimization of energy consumption structure. The government should establish the priority development strategy of clean energy, improve the planning of various innovative energy sources, and promote rapid development and standardized development of new energy in an orderly manner. The government should increase support for independent innovation and transformation of scientific and technological achievements in the new energy industry, further improve technological research and development in the new energy field, and promote replacing traditional energy with innovative energy.
The original contributions presented in the study are included in the article/supplementary material, further inquiries can be directed to the corresponding author.
GW: conceptualization, methodology, software, validation, formal analysis, data curation, writing “original draft preparation, writing” review and editing, visualization. JZ: conceptualization, validation, investigation, resources, writing” review and editing, supervision, project administration, funding acquisition.
The authors declare that the research was conducted in the absence of any commercial or financial relationships that could be construed as a potential conflict of interest.
All claims expressed in this article are solely those of the authors and do not necessarily represent those of their affiliated organizations, or those of the publisher, the editors and the reviewers. Any product that may be evaluated in this article, or claim that may be made by its manufacturer, is not guaranteed or endorsed by the publisher.
Alam, M. M., Murad, M. W., Nornanc, A. H. M., and Ozturk, I. (2016). Relationships among carbon emissions, economic growth, energy consumption and population growth: Testing Environmental Kuznets Curve hypothesis for Brazil, China, India and Indonesia. Ecol. Indic. 70, 466–479. doi:10.1016/j.ecolind.2016.06.043
Asumadu, S. S., and Vladimir, S. (2019). Effect of foreign direct investments, economic development and energy consumption on greenhouse gas emissions in developing countries. Sci. Total Environ. 646, 862–871. doi:10.1016/j.scitotenv.2018.07.365
Auty, R. M. (2007). Natural resources, capital accumulation and the resource curse. Ecol. Econ. 61 (4), 627–634. doi:10.1016/j.ecolecon.2006.09.006
Bian, N., and Yu, H. (2019). How does energy endowment and technological progress affect carbon emission intensity?—an empirical analysis based on China’s yangtze river economic zone. Ekoloji 28 (107), 3991
Chen, D., Chen, S., and Jin, H. (2018). Industrial agglomeration and CO2 emissions: Evidence from 187 Chinese prefecture-level cities over 2005–2013. J. Clean. Prod. 172, 993–1003. doi:10.1016/j.jclepro.2017.10.068
Crafts, N., and Mulatu, A. (2006). How did the location of industry respond to falling transport costs in Britain before World War I? J. Econ. Hist. 66 (3), 575–607. doi:10.1017/s002205070600026x
Dogan, E., and Seker, F. (2016). Determinants of CO2 emissions in the European Union: The role of renewable and non-renewable energy. Renew. Energy 94, 429–439. doi:10.1016/j.renene.2016.03.078
Grether, J.-M., Hotz, I., and Mathys, N. A. (2014). Industry location in Chinese provinces: Does energy abundance matter? Energy Econ. 44, 383–391. doi:10.1016/j.eneco.2014.05.005
Gu, W., Chu, Z., and Wang, C. (2020). How do different types of energy technological progress affect regional carbon intensity? A spatial panel approach. Environ. Sci. Pollut. Res. 27, 44494–44509. doi:10.1007/s11356-020-10327-9
Hanif, I., Aziz, B., and Chaudhry, I. S. (2019). Carbon emissions across the spectrum of renewable and nonrenewable energy use in developing economies of Asia. Renew. Energy 143, 586–595. doi:10.1016/j.renene.2019.05.032
Hashmi, Rubayyat, and Alam, Khorshed (2019). Dynamic relationship among environmental regulation, innovation, CO2 emissions, population, and economic growth in oecd countries: A panel investigation. J. Clean. Prod. 231, 1100–1109. doi:10.1016/j.jclepro.2019.05.325
Head, K., Ries, J., and Swenson, D. (1995). Agglomeration benefits and location choice: Evidence from Japanese manufacturing investments in the United States. J. Int. Econ. 38 (3-4), 223–247. doi:10.1016/0022-1996(94)01351-r
Hotz, I. (2012). Energy endowments, barriers to trade and industry location in Chinese provinces. Neuchâtel: University of Neuchâtel, Institute of Economic Research (IRENE). IRENE Work. Pap.
Jiang, L., and Ji, M. (2011). Energy intensity and its spatial heterogeneity in China—a perspective of resource endowment, industrial structure, technological progress and market mechanism. J Industrial Econ. Res. 4, 61. doi:10.13269/j.cnki.ier.2011.04.002
Kim, S. (1999). Regions, resources, and economic geography: Sources of US regional comparative advantage, 1880–1987. Reg. Sci. Urban Econ. 29 (1), 1–32. doi:10.1016/s0166-0462(98)00010-6
Krugman, P. (1998). Space: The final frontier. J. Econ. Perspect. 12 (2), 161–174. doi:10.1257/jep.12.2.161
Lei, S., Shuai, Z., and Shuhan, H. (2020). Opportunities and challenges of natural resources research in China in the new era. J. Nat. Resour. 35 (8), 16. doi:10.31497/zrzyxb.20200802
Li, J. (2020). Institutional arrangement, urbanization and environmental pollution. Econ. Surv. 37 (3), 8. doi:10.15931/j.cnki.1006-1096.20200420.008
Li, L., Lei, Y., Wu, S., He, C., and Yan, D. (2018). Study on the coordinated development of economy, environment and resource in coal-based areas in Shanxi Province in China: Based on the multi-objective optimization model. Resources Policy, S0301420717300958.
Liang, X., and Song, L. (2012). Research on regional industrial transfer based on potential energy theory. Modern (10), 4. doi:10.3969/j.issn.1001-0254.2012.10.034
Liu, X., and Liu, X. (2021). Can financial development curb carbon emissions? Empirical test based on spatial perspective. Sustainability 13, 11912. doi:10.3390/su132111912
Liu, X., and Zhang, X. (2021a). Industrial agglomeration, technological innovation and carbon productivity: Evidence from China. Resour. Conservation Recycl. 166, 105330. doi:10.1016/j.resconrec.2020.105330
Liu, X., and Zhang, X. (2021b). Industrial agglomeration, technological innovation and carbon productivity: Evidence from China. Resour. Conserv. Recycl. 166, 105330. doi:10.1016/j.resconrec.2020.105330
Liu, Y., Gao, Y., and Hao, Y. (2019). Gospel or disaster? An empirical study on the environmental influences of domestic investment in China. J. Clean. Prod. 218, 930–942. doi:10.1016/j.jclepro.2019.01.333
Lu, Z., Qwa, B., and Ming, Z. (2021). Environmental regulation and CO2 emissions: Based on strategic interaction of environmental governance. Ecol. Complex. 45, 100893. doi:10.1016/j.ecocom.2020.100893
Pan, X., Chu, J., Tian, M., and Li, M. (2022). Non-linear effects of outward foreign direct investment on total factor energy efficiency in China. Energy 239, 122293. doi:10.1016/j.energy.2021.122293
Peng, H., Wang, Y., Hu, Y., and Shen, H. (2020). Agglomeration production, industry association and carbon emission performance: Based on spatial analysis. Sustainability 12 (18), 7234. doi:10.3390/su12187234
Qiu, Q., and Chen, J. (2020). Natural resource endowment, institutional quality and China's regional economic growth. Resour. Policy 166, 101644. doi:10.1016/j.resourpol.2020.101644
Shiqiang, Z., Meng, L., and Yue, L. (2021). Impact of spatial agglomeration of energy capacity on regional energy efficiency. Popul. Resour. Environ. China 31 (5), 9. doi:10.12062/cpre.20201105
Song, M., Wang, J., and Zhao, J. (2018). Coal endowment, resource curse, and high coal-consuming industries location: Analysis based on large-scale data. Resour. Conservation Recycl. 129, 333–344. doi:10.1016/j.resconrec.2016.08.005
Sun, X, X., Chenggang, Y., Khan, A., Hussain, J., and Bano, S. (2021). The role of tourism, and natural resources in the energy-pollution-growth nexus: An analysis of belt and road initiative countries. J. Environ. Plan. Manag. 64 (6), 999–1020. doi:10.1080/09640568.2020.1796607
Sun, Z, Z., Liu, Y., and Wu, L. (2021). Does industrial agglomeration promote carbon efficiency? A spatial econometric analysis and fractional-order grey forecasting. J. Math. 2021, 1–18. doi:10.1155/2021/5242414
Syed, A., Haider, Z., and Muhammad, W. (2019). Dynamic linkages between globalization, financial development and carbon emissions: Evidence from Asia Pacific Economic Cooperation countries. J. Clean. Prod. 228, 533–543. doi:10.1016/j.jclepro.2019.04.210
Vahabi, M. (2018). The resource curse literature as seen through the appropriability lens: A critical survey. Public Choice 175 (3-4), 393–428. doi:10.1007/s11127-018-0533-5
Wang, K., Wu, M., Sun, Y., Shi, X., Sun, A., and Zhang, P. (2019). Resource abundance, industrial structure, and regional carbon emissions efficiency in China. Resour. Policy 60, 203–214. doi:10.1016/j.resourpol.2019.01.001
Wen, Y., and Liao, M. (2019). The impact of industrial agglomeration on carbon emissions: Empirical evidence from China. Int. J. Manag. Sustain. 8 (2), 67–78. doi:10.18488/journal.11.2019.82.67.78
Wu, L, L., Sun, L., Qi, P., Ren, X., and Sun, X. (2021). Energy endowment, industrial structure upgrading, and CO 2 emissions in China: Revisiting resource curse in the context of carbon emissions. Resour. Policy 74, 102329. doi:10.1016/j.resourpol.2021.102329
Wu, X, X., Majeed, A., Vasbieva, D. G., Yameogo, C. E. W., and Hussain, N. (2021). Natural resources abundance, economic globalization, and carbon emissions: Advancing sustainable development agenda. Sustain. Dev. 29 (5), 1037–1048. doi:10.1002/sd.2192
Xiang, X., Ma, M., Ma, X., Chen, L., Cai, W., Feng, W., et al. (2022). Historical decarbonization of global commercial building operations in the 21st century. Appl. Energy 322, 119401. doi:10.1016/j.apenergy.2022.119401
Xiaojun, , Wang, B., and Dong, G. (2018). Carbon emissions from energy consumption in China: Its measurement and driving factors. The Science of the total environment.
Xin-gang, Z., and Jin, Z. (2022). Industrial restructuring, energy consumption and economic growth: Evidence from China. J. Clean. Prod. 335, 130242. doi:10.1016/j.jclepro.2021.130242
Xue, Y., Ye, X., Zhang, W., Zhang, J., Li, Q., Wu, C., et al. (2020). Reverification of the "resource curse" hypothesis based on industrial agglomeration: Evidence from China. J. Clean. Prod. 275, 124075. doi:10.1016/j.jclepro.2020.124075
Yan, R., Xiang, X., Cai, W., and Ma, M. (2022). Decarbonizing residential buildings in the developing world: Historical cases from China. Science of The Total Environment, 157679.
Zafar, M. W., Saeed, A., Zaidi, S. A. H., and Waheed, A. (2021). The linkages among natural resources, renewable energy consumption, and environmental quality: A path toward sustainable development. Sustain. Dev. 29 (2), 353–362. doi:10.1002/sd.2151
Zhang, C., and Zhang, Z. (2015). Spatial effects of energy resources and technology advance on China’s carbon emission intensity. China Popul. Resour. Environ. 25, 37–43. doi:10.3969/j.issn.1002-2104.2015.09.006
Keywords: energy endowment, energy capacity aggregation, carbon emission, spatial durbin model, spatial spillover effect
Citation: Wang G and Zhou J (2022) Energy endowment, energy capacity aggregation and carbon emissions in china-empirical analysis based on spatial durbin model. Front. Environ. Sci. 10:1015361. doi: 10.3389/fenvs.2022.1015361
Received: 09 August 2022; Accepted: 31 August 2022;
Published: 29 September 2022.
Edited by:
Kangyin Dong, University of International Business and Economics, ChinaReviewed by:
Minda Ma, Tsinghua University, ChinaCopyright © 2022 Wang and Zhou. This is an open-access article distributed under the terms of the Creative Commons Attribution License (CC BY). The use, distribution or reproduction in other forums is permitted, provided the original author(s) and the copyright owner(s) are credited and that the original publication in this journal is cited, in accordance with accepted academic practice. No use, distribution or reproduction is permitted which does not comply with these terms.
*Correspondence: Jinsheng Zhou, amluc2hlbmd6aG91MDYxM0AxNjMuY29t
Disclaimer: All claims expressed in this article are solely those of the authors and do not necessarily represent those of their affiliated organizations, or those of the publisher, the editors and the reviewers. Any product that may be evaluated in this article or claim that may be made by its manufacturer is not guaranteed or endorsed by the publisher.
Research integrity at Frontiers
Learn more about the work of our research integrity team to safeguard the quality of each article we publish.