 Sajjad Ali
 Ashfaq Ahmad Shah
 Amogh Ghimire
 Muhammad Atiq Ur Rehman Tariq
- 1School of Management, Jiangsu University, Zhenjiang, China
- 2Research Center for Environment and Society, Hohai University, Nanjing, China
- 3School of Public Administration, Hohai University, Nanjing, China
- 4College of Engineering and Science, Victoria University, Melbourne, VIC, Australia
- 5College of Engineering, IT and Environment, Charles Darwin University, Darwin, NT, Australia
- 6Institute for Sustainable Industries and Liveable Cities, Victoria University, Melbourne, VIC, Australia
The ongoing adverse effects of climate change produced by carbon dioxide emissions have sparked global advocacy to face its adverse consequences with the utmost vigor. Pakistan’s contribution to global emissions is less than 1% while it is among the most vulnerable countries facing threat of climate change. The sources of carbon dioxide (CO2) emissions by particular nations must be understood to comprehend the procedures necessary to reduce emissions globally. This study is a contribution to empirics of the CO2 emissions, gross domestic product, crop production index, livestock production index, population, agricultural land, land under cereal crop and agriculture value-added. This study considered annual data from 1961 to 2014 for the country of Pakistan. We performed an Autoregressive distributed lag (ARDL) bound testing approach to investigate the long-run and short-run association among all research variables. To check the stationarity of the study variables, we also employed Augmented Dickey-Fuller and Phillips-Perron (P.P.) tests. The outcomes of the long-run estimates indicate that the coefficients of agricultural land and land under cereal crop have a positive and significant relationship with CO2 emissions, while the coefficients of crop production index have a negative and significant relationship with CO2 emissions, respectively. The outcomes from short-run estimates show that the coefficients of crop production index and livestock production index are both positive and statistically significant, which implies that these variables are crucial in boosting carbon emissions. The error correction model value is also negative and statistically significant, indicating the deviation of CO2 emissions to other variables from short-run to long-run equilibrium. According to the Pairwise Granger causality test, there is evidence of both unidirectional and bidirectional causation between the research variables. Based on the research outcomes, the government must carefully consider its regulations on agricultural and livestock production and embrace ecologically friendly techniques in the agriculture sector, which may minimize carbon emissions over time.
Introduction
Greenhouse gas (GHG) emissions and their impact on the external environment are causing severe concerns for businesses, industries and policymakers globally. Global warming is also being taken seriously by almost every country worldwide. Carbon dioxide (CO2) emissions are one of the main contributors to global warming; thus, it has gained more attention from academicians (Appiah et al., 2017). Nearly 30 billion tonnes of CO2 emissions are released into the atmosphere each year as a result of day-to-day human activities (Iwata and Okada 2014). The increasing threat of climate change and global warming, which is attributed to rising levels of greenhouse gases, has led to a strand of literature that examines the dynamics of various greenhouse gases (Churchill et al., 2020). Actually, our planet has continuously witnessed the changing of climate since the beginning of time, but especially in the last century, the increase in human activities has led to the shortening of the climate change period (Lott et al., 2017; Bakır et al., 2022) Researchers have investigated the impact and mechanism of agricultural GHG emissions and alternate ways to lessen its effect (Amuakwa-Mensah and Adom 2017; Alper and Onur 2016; Smith 2012). Global food security is being threatened by climate change. This concept increasingly demands human and environmental resources, which poses a severe threat to the social, economic and ecological sustainability of resource-poor developing areas such as South Asia (Bokhari et al., 2018; IPCC 2014; IPCC 2018). Previous scholars argued that the consequences of such weather and climate variability negatively affect these regions’ environmental resources (Abid et al., 2016; Woods et al., 2017; Atif et al., 2018). Whereas these contextual settings’ economic and social viabilities depend on the agricultural outputs, coordinated efforts are required to ensure agro-based economies’ resilience.
The global livestock production is increasing rapidly as the demand for livestock products for human consumption increased. The livestock sector provides more than one-third of human protein needs and is a major provider of livelihood in almost all developing countries. Twenty-six percent of global land area is used for livestock production and forest lands are continuously being lost to such activities (Sakadevan and Nguyen 2017). About 60% of global biomass harvested annually to support all human activity is consumed by livestock industry, undermining the sustainability of allocating such large resource to the industry. It is a major contributor to human nutrition (protein) and health and provides a buffer against grain shortage assuring food security to human population (Smith et al., 2013). A previous study conducted in Pakistan focused on the relationship between carbon dioxide emissions, crop production, livestock production and population growth. The results from the vector error correction model (VECM) indicated that crops production, livestock production and population growth have a negative effect in the long-run and positive influence in the short-run on carbon dioxide emissions in the study period (Rehman et al., 2021).
Mainly, there are a lot of misconceptions about how agricultural development technologies and climate change may influence crop production capacity as well as operational procedures or driving mechanisms (Zhang and Huang 2013; Tao and Zhang 2013). Agriculture, forestry and land use directly accounts for 18.4% of greenhouse gas emissions while the energy sector generates 73.2% of greenhouse gas emissions in Pakistan. According to the Intended Nationally determined Contribution (INDC), Pakistan’s total greenhouse gas emissions have increased by 123% in 21 years from 1994 to 2015. Despite being a low producer of CO2 emissions (0.2 million metric tons), Pakistan has been one of the most adversely affected countries by global warming. Unfortunately, to address this problem, Pakistan has not taken any significant actions (Smadja et al., 2015). This incurs enormous costs due to property and infrastructure damage, decreased agricultural production, and the cost of rehabilitating regions adversely affected by natural calamities due to frequent climatic disasters. Comparing with other sector like commercial building operations which indicates the most significant potential in cost-effective emission reduction, is essential to be discussed. Previous research conducted in China and the United State (U.S.) investigated the carbon neutrality pathway of the commercial building operations. The results indicated that CO2 abatement efficiency in China was 1.1–1.9 times that of the U.S., although CO2 abatement in China and the U.S. in 2001–2018 was very similar (Zhang et al., 2022a). In the same context, to further conduct deep decarbonization and carbon neutrality, strategies of building integrated power generation, building electricity decarbonization and building energy efficiency can achieve 34.3, 29.7 and 22.5% of carbon abatement in China and 31%, 45.4% and 10.2 of carbon abatement in the U.S., respectively (Zhang et al., 2022b). Another study conducted in 16 economies investigated that the carbon intensity will decreased by an average of 1.42 and 2.93% per year in the periods of 2000–2010 and 2010–2019, respectively (Xiang et al., 2022). The study evaluated the carbon emission intensity of global commercial operations continued to decline from 2000 to 2019, and trend was more significant.
Among the developing countries of South Asia, Pakistan’s economy is growing rapidly, and it is expected that Pakistan’s economic growth will continue with the same trend in the future (Aftab et al., 2021). Pakistan’s economy depends mainly on agriculture, and agriculture is the main dominant sector of the country. Still, due to the rapid growth of the industrial sector in Pakistan, agricultural land is declining. Besides this, rapid growth in population causes deforestation; Pakistan is the top-ranked country in Asian countries that faces deforestation. Pakistan is one of several countries in the world that are currently at risk from climate change. The nation is experiencing sweltering summer and freezing winter. Meteorological variables monitor resource availability and manage the necessary fundamental growth processes. Because of this, agriculture is very susceptible to climate change. Nonetheless, the phenomena and patterns underlying this fact are vague and ambiguous (Tao and Zhang 2013; Tao et al., 2014; Wilcox and Makowski 2014). In Pakistan, CO2 emission occupies the maximum share (60 percent) among all the greenhouse gases (Khan et al., 2004). CO2 emission in Pakistan was noted to be 32,067 kilotons (kt) in 1980 (World Development Indicator), while the trend increased by 8 percent to 10 percent per annum. The total emission of CO2 has increased to 158,000 kilotons (kt) since 2014. A study by (Lin and Raza 2020) narrated that over the last few decades, due to extraordinary population growth, agricultural productivity, energy demand and economic growth have solved the problem of food security. However, it exponentially increased the CO2 emissions in the country. Pakistan’s agriculture is a pathway for rural development and earning for rural areas. Directly or indirectly, about 70% of the rural population is involved in the agricultural industry, and agriculture accounts for more than 21% share of Pakistan’s GDP (Ahmed et al., 2018; Koondhar et al., 2018). With the intention of raising food production, Pakistani farmers apply fertilizer excessively. Due to over-fertilization, traditional ways of growing food and increasing food production efficiency result in decreased soil fertility, contaminated subsurface water, and higher production cost. By 2050, around 20% of the production increases will be due to the expansion of agricultural land (Bruinsma 2009). Nevertheless, studies have shown that even if the two locations’ climates are uniform, the agricultural output might still be substantially varied. This is because of the variations in agricultural technology, mechanization, and different inputs like fertilizer and seed. For instance, the average yield in E.U. is 5 tons per hectare, whereas in the developing world, it is 3 tons per hectare and in SSA, it is only 1.2 tons per hectare (FAO 2013). To improve predictions on the consequences of climate change and modern agricultural technology on crop production, it is necessary to identify unanticipated dynamic aspects contributing to crop yield improvement. It will also contribute to enhancing existing agricultural adaptation techniques in the future.
The main contributions of our study are as follows: first, this research work explores the association between carbon dioxide emissions and specific crucial macro-level parameters that have not been studied before in the context of Pakistan. Second, the study tests autoregressive distributed lag model to determine the relationship between CO2 emissions and all other chosen parameters. Third, the findings will be helpful to policymakers in establishing an environmental and agricultural-related policy that will strengthen the advanced crop production technologies and reduce carbon emissions to ensure a clean environment. This study recommended the reorganization of production techniques in agriculture in favour of more sustainable practices.
Therefore, this current study employed the ARDL model to identify the relationship between carbon emissions, gross domestic product, crop production index, livestock production index, population, agricultural land, land under cereal crop and agriculture value-added on historical data of Pakistan from 1961 to 2014. The remaining portion of the study is organized in the following way; the second part is a review of previous research on the interconnections among the selected variables. The third part illustrates the materials and methods section, including the model specification and description of the data sources. The fourth part summarizes, the findings and discussions section, which consists of descriptive analysis, unit root measurements, ARDL bound tests, long-run and short-run estimations and diagnostic tests. The fifth part is the conclusion of the study.
Literature review
Agriculture seems to be the most sensitive economic sector to such changes, and multiple researchers have sought to investigate the consequences of global warming on agricultural yields and productivity over the last 3 decades (Adams et al., 1990; Mendelsohn et al., 1994; Parry et al., 2004; Schlenker and Robert 2009; Attavanich and McCarl 2013; Miao et al., 2015). By the mid of 20th century, agricultural production has been kept at the same speed of growing population to feed the fast-growing population by increasing the applications of inputs which leads to more carbon emission from the agricultural industry (Burney et al., 2010). Likewise, prior research showed that the future food supply availability may not be sufficient to fulfill demand due to climate change’s expected negative effects on the global agricultural chain (Attavanich and McCarl 2013; Brown et al., 2017). It is forecasted that between 2080–2100, the agricultural output will be reduced by 15–30 percent (FAO 2013). Africa, Latin America and Asia may experience a further decline in crop productivity unless proper adaptation strategies are implemented. According to the estimate of previous research, it would cost about 5–10 percent of GDP to implement climate change adaptation strategies in Africa (Boko et al., 2007). Moreover, they anticipated that by 2020, agricultural production would have decreased by around 50 percent, and crop revenue might have dropped by as much as 90 percent by 2100. Therefore agriculture is known as the main contributor to pollution by the different emissions such as carbon emissions from cattle, from agricultural soil due to using fertilizer, and rice production (Tubiello et al., 2013). The increasing applications of fertilizer result in increasing nitrogen emission by the strong influence of radiations (Reay et al., 2012). Considering the increasing demand for fossil fuel in agriculture for operating agro-based modern machinery, it leads to an increase in carbon emission (Lal 2004).
As changes to the environment become more dynamic, the impact of livestock farming on the natural ecosystem is becoming more apparent. Not only is livestock a source of milk, eggs and meat, but it is also the primary source of income for a substantial part of the population and a major contributor to national gross domestic product (GDP). A previous study examined the relationship between livestock and crop production and CO2 emissions using the Autoregressive Distributed Lags (ARDL) model and variance decomposition (Sarkodie and Owusu 2017). The results of this study, set in Ghana, show that increasing crop and livestock production resulted in increased CO2 emissions. The outcomes also discovered bi-directional Granger causality between crop production and CO2 and livestock production and CO2. Another study in BRICS countries investigated the causal relationship between agricultural production and carbon emissions from 1973 to 2013 (Appiah et al., 2018). Using the dynamic ordinary least square (DOLS) and fully modified ordinary least square (FMOLS) methods, a 1% increase in economic growth, crop production, and livestock production increased carbon emissions by 17, 28, and 28%, respectively.
The nexus between agricultural production and carbon emission from agriculture is not certain clear. First, the farmers pay attention to invest in increasing productivity by increasing inputs which exerts pressure on the environment as well as the agriculture industry in the long- and short-run, those applications can increase productivity but instigate damage to the environment and soil fertility in the long run (Koondhar et al., 2021). The consensus among scholars on economic growth and its effect on the environment is that development damages the natural environment, especially during the early stages. Many studies have proved that rapid economic growth leads to a rapid increase in carbon emissions (Kasman and Selman 2015; Azam et al., 2016; Elliott et al., 2017). A comparative study between India and China was conducted on the causal relationship between energy consumption, economic growth and carbon dioxide emissions. In China, economic growth and energy consumption were found to directly cause an increase in carbon emissions, but in India, this relationship could not be established (Jayanthakumaran et al., 2012).
The empirical evidence and recent research reflect that population growth is one of the main reasons for CO2 emissions globally. The previous study conducted in OECD countries proved that; there exists a negative relationship between population growth and emissions (Özokcu and Özdemir 2017). On the other hand, few researchers proved a significantly positive relationship between growth and emissions (Bargaoui et al., 2014; Feng et al., 2015; Yeh and Liao 2017; Yu et al., 2018). The profound study has established a linkage between GDP, agricultural value-added, CO2 emissions and the occupied land under cereal crops from 1961-to 2014 in Pakistan; it showed an insignificant positive relationship among the mentioned variables in the long run. While, in the short run, it was insignificant and negative. Based on these unique findings, researchers urgedpolicymakers to make policies to minimize CO2 emissions (Ali et al., 2019b).
Study materials and methodology
Data sources and description
A recent study considered annual data for Pakistan covering 1961 to 2014. The primary difficulty was data availability; thus, we have chosen a time range due to the limited availability of variables in the study. The different variables data for this study were obtained from the World Development Indicator and the Pakistan statistical yearbook. The present study planned to use carbon dioxide emissions (CO2) data in kilotons. The gross domestic product (GDP) is measured in current U.S. dollars. The crop production index (CPI) and livestock production index (LPI) data were taken from 2004 to 2006 = 100. Population (POP) data is the country’s total population during the study period from 1961 to 2014. The agricultural land (AL) data is taken in square kilometers, while land under cereal crop (LCC) is taken in hectares. The last variable, agriculture value-added (AVA), is taken as a percentage of GDP. Table 1 summarizes the time-series data used by the model. The objective of this study is to establish the relationship between CO2 emissions, GDP, CPI, LPI, POP, AL, LCC and AVA, respectively.
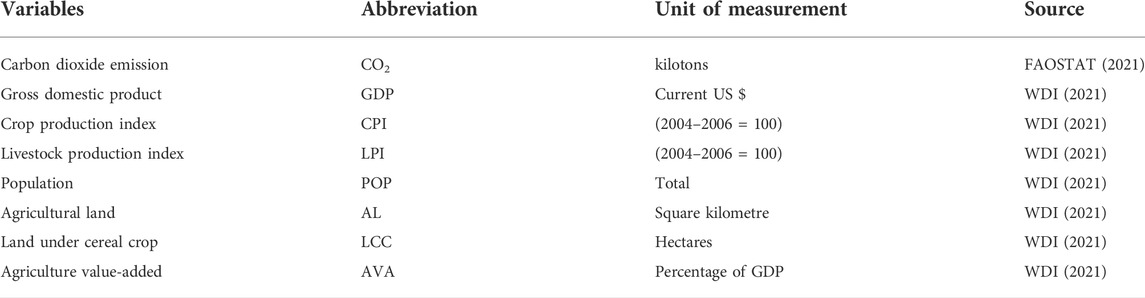
TABLE 1. Data elaboration and sources.
Model specification
This research employed Autoregressive Distributed Lag (ARDL) bound methodology introduced by (M. H. Pesaran et al., 2001) to assess the equations when the variables are stable at a level I(0) as well as at a first difference I(1) (Shahbaz et al., 2013; Asumadu-Sarkodie and Owusu 2016; Rahman et al., 2017; Danish et al., 2018). There might be a possibility of a spurious regression while using time-series data. To avoid spurious regression, a co-integration method was designed and used to identify a long-run connection among time series variables (Nkoro and Uko, 2016). According to the previous study, the concept of co-integration may be understood when two or more integrated individual series are exhibited, although some of these linear combinations simply show integration at a lower order (Engle and granger, 1987). These sorts of series are considered co-integrated. In this study, we incorporated the ARDL approach to evaluate the long-run association among the modelled variables.
There are several advantages of the model that is used in this study. 1) The ARDL model is appropriate if the sample size is small. 2) Another aspect of the ARDL model is that it is used whether the variables were stationary in their level form [I (0)] or integrated at the first order and stationary in their difference [I (1)] or a mixture of both I (0) and I (1). (c) It is feasible to simultaneously estimate long-run and short-run coefficients using the ARDL model. The short-run coefficients designate the relationship between the deviation of the dependent variable and its long-run tendency. It is essential to mention that in the ARDL approach, both the bias-corrected bootstrap technique and nonlinear functions of the conditional error correction model coefficients can be used to estimate the statistical effects of the long-run relations between study variables.
Relying on the econometric model, this study estimated the linkage between the dependent variable (carbon dioxide emissions) and the independent variables (gross domestic product, crop production index, livestock production index, population, agricultural land, land under cereal crop, agriculture value-added (Zakarya et al., 2015; Rahman et al., 2017; Saidi et al., 2017; Mbarek et al., 2018). The variables can be expressed using the following econometric notation;
All the model variables are converted to their logged form (ln). The parameters in Eq. 2;
Where the
Results and discussion
Descriptive statistics and correlations
Descriptive statistical analysis is aimed to understand the fundamental features of all the research variables. Skewness measures the degree of unevenness of the collected data, whereas kurtosis determines the uniformity of the dispersion order. According to Table 2, LnGDP, LnCPI, LnPOP and LnLCC, all have negative leftward tails, while the remaining variables have positive rightward tails, respectively. The Jarque-Bera (J-B) test is used to determine the normality of all variables. The J-B test displays highly insignificant values at a 5 percent significance level, indicating that all the variables’ residuals are normal. Consequently, kurtosis can be classified into three states, 1) Mesokurtic represents the natural dispersion where the kurtosis value is equal to 3, 2) Leptokurtic determines a peaked arc where the positive kurtosis is more than three and 3) lastly the Platykurtic postulates flatted arc where negative kurtosis value is less than 3. The outcomes illustrated in Table 2 demonstrate that only LnAL is Leptokurtic, with the kurtosis value greater than 3. The remaining research variables are Plarykurtic, with the kurtosis value smaller than 3.
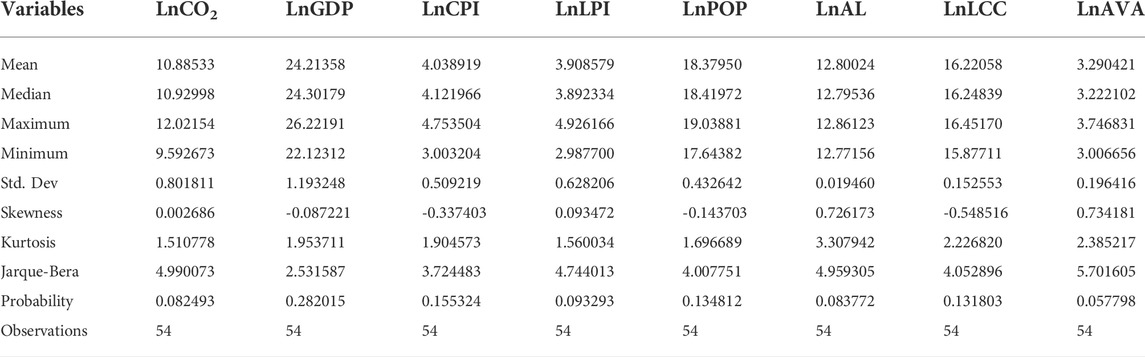
TABLE 2. Descriptive statistics analysis for all variables.
In order to establish the interrelationship between variables, Table 3 summarizes the correlation analysis conducted for all variables. The findings reveal that LnGDP, LnCPI, LnLPI, LnPOP and LnLCC impact carbon dioxide emissions, with 97.8197 percent, 97.7695 percent, 99.3391 percent, 98.8421 percent, and 95.6098 percent, respectively. It has been illustrated from the trend analysis (Figure 1) that all the research variables except agricultural land and agriculture value-added have an increasing upward trend from 1961 to 2014 in Pakistan.
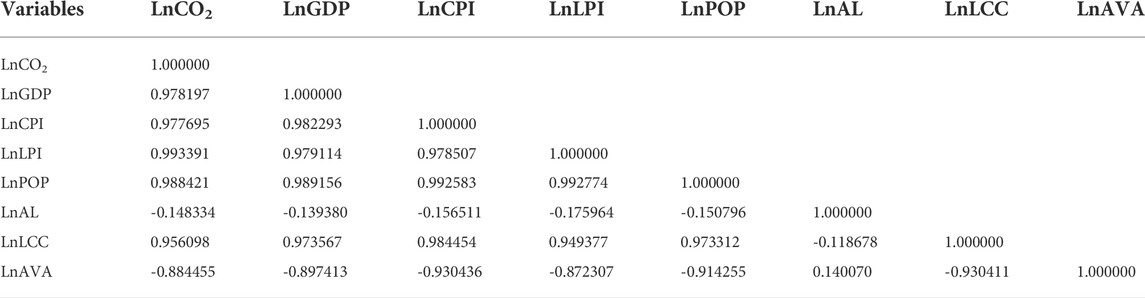
TABLE 3. Correlation statistics.
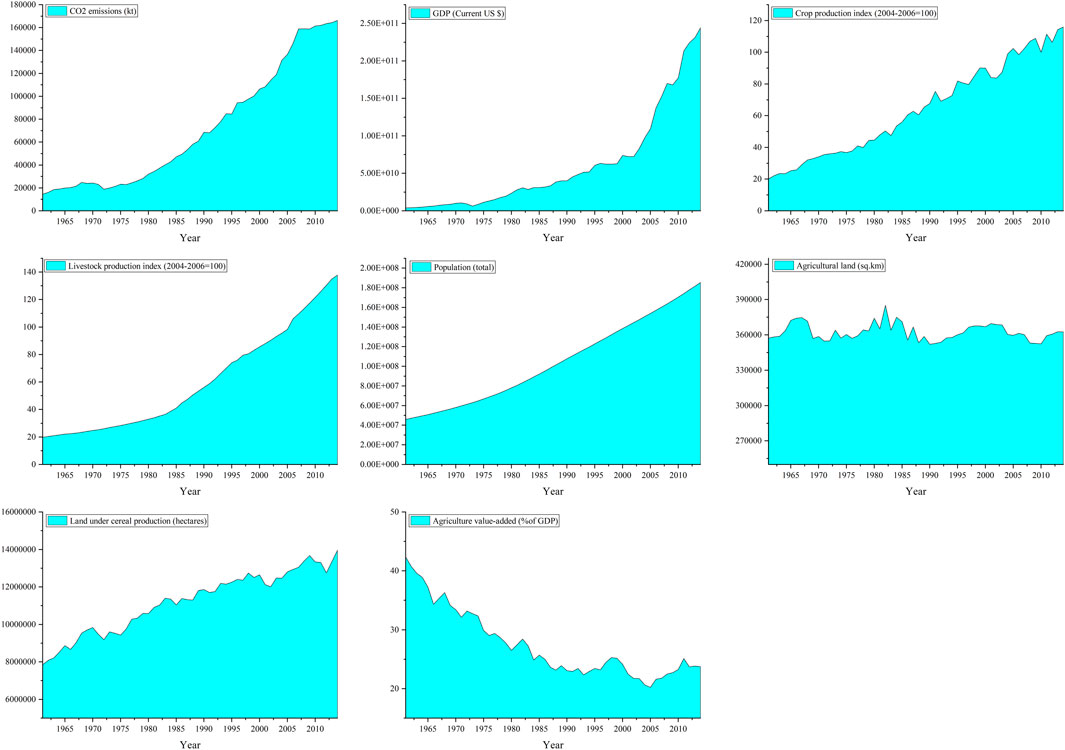
FIGURE 1. All individual graphs for dataset trends.
Unit root test results
Knowing the stationarity characteristics of study variables is crucial before estimating ARDL bounds testing. We initially performed the unit root tests to prevent spurious regression. We use the Augmented Dickey and Fuller (ADF) test that was introduced by (Dickey and Fuller 1979) and Phillips-Perron (P.P.) unit root tests (Phillips and Pierre Perron 1988). According to the ADF results, the variables LnAL and LnAVA were stationary in their level and first difference form (Table 4). At the same time, the outcome from P.P. shows that the variables LnCO2, LnGDP, LnLPI, and LnLCC were not stationary in level form but became stationary at their first differences at the 1 percent level of significance. Variables LnCPI, LnAL and LnAVA were stationary in both levels and at the first difference at a 1 percent significance level. Table 4. Results of unit root testing.
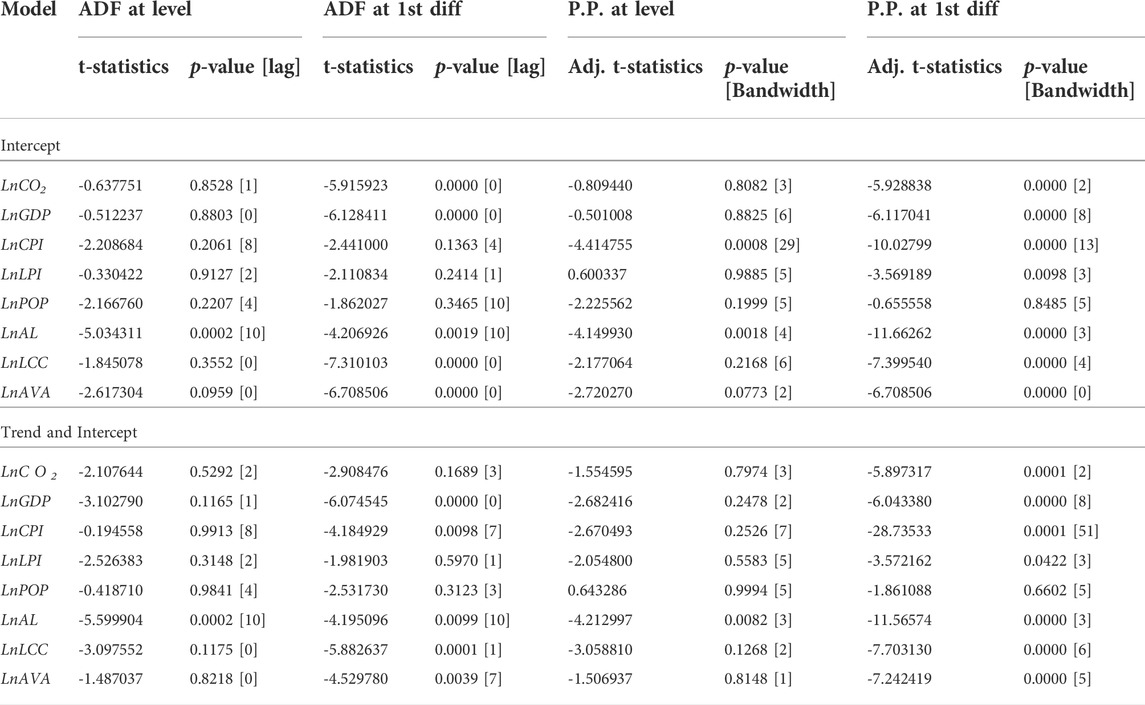
TABLE 4. Results of unit root testing.
Selection criteria for lag order
It is critical to discover the number of lags that should be utilized in the ARDL estimation. Consequently, we used unrestricted Vector Autoregression (VAR) lag selection criteria to identify the optimal number of lags for the model. Both Akaike Information Criterion (AIC) (Akaike 1974) and Schwarz Information Criterion (SIC) (Schwarz 1978) are some of the most frequently used criteria. This current study used the AIC lag selection analysis, demonstrating that lag two is our model’s best-chosen lag value (Table 5). Earlier researchers employed the AIC criteria to determine the lag length in the ADF test (Farhani and Ozturk 2015; Jebli and Ben Youssef 2017; Xu and Lin 2017; Rauf et al., 2018; Ali et al., 2019b; Naseem et al., 2020; Ali et al., 2021a; Ali et al., 2021b).

TABLE 5. Lag selection criteria.
ARDL testing method
Having performed the unit root test, the next step is to run the ARDL bounds testing technique. Generally, the ARDL bounds testing method is mainly based on the AIC and SIC because they provide relatively parsimonious specifications. The calculated findings in Table 6 demonstrate that the F-statistics calculated value is 4.237766, higher than the lower and upper bound values at a 5 percent significance level, indicating that the ARDL model should be used in this circumstance. The results indicate that the null hypothesis is denied, indicating no co-integration, while the alternative hypothesis of co-integration is acknowledged. Figure 2 illustrates the top 20 probable feasible lags for the ARDL model.
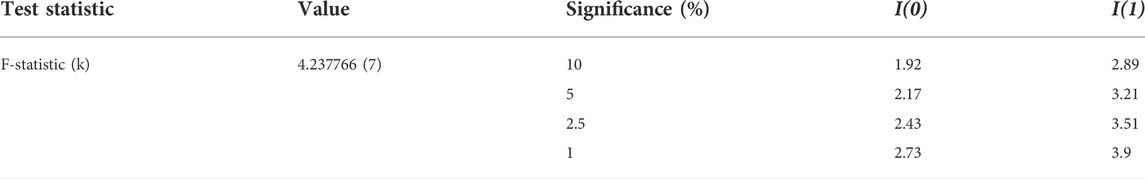
TABLE 6. ARDL bounds test co-integration (time series model).
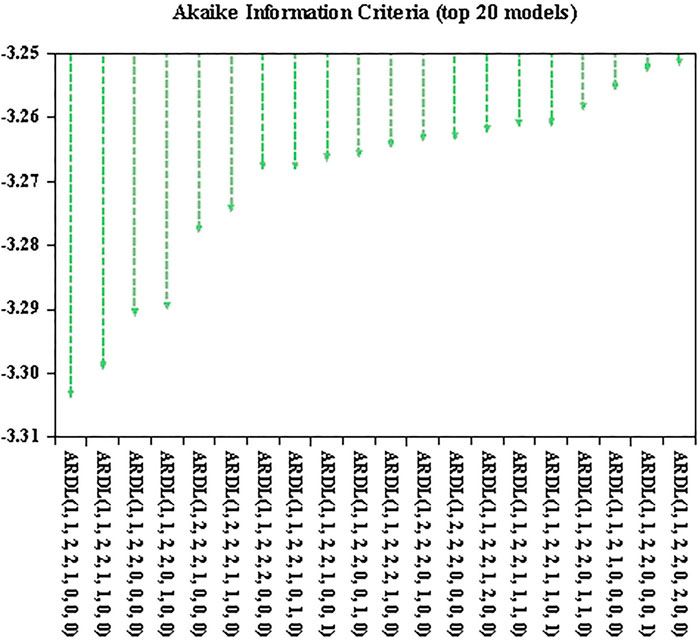
FIGURE 2. ARDL model selection criterion.
Johansen test of co-integration
Consequently, this research then sums up Johansen’s co-integration approach suggested by (Johansen and Juselius 1990) to find out the long-run connection between carbon dioxide emissions, gross domestic product, crop production index, livestock production index, population, agricultural land, land under cereal crop, and agriculture value-added. The outcomes of the trace statistic test showed that six co-integration equations are statistically significant at a 5 percent level (Table 7). Whereas the outcomes of the maximum eigenvalue test showed that five co-integration equations are statistically significant at a 5 percent level. The findings of the trace statistics and maximum eigenvalue tests discover that there has been a long-run relationship between the selected research variables.
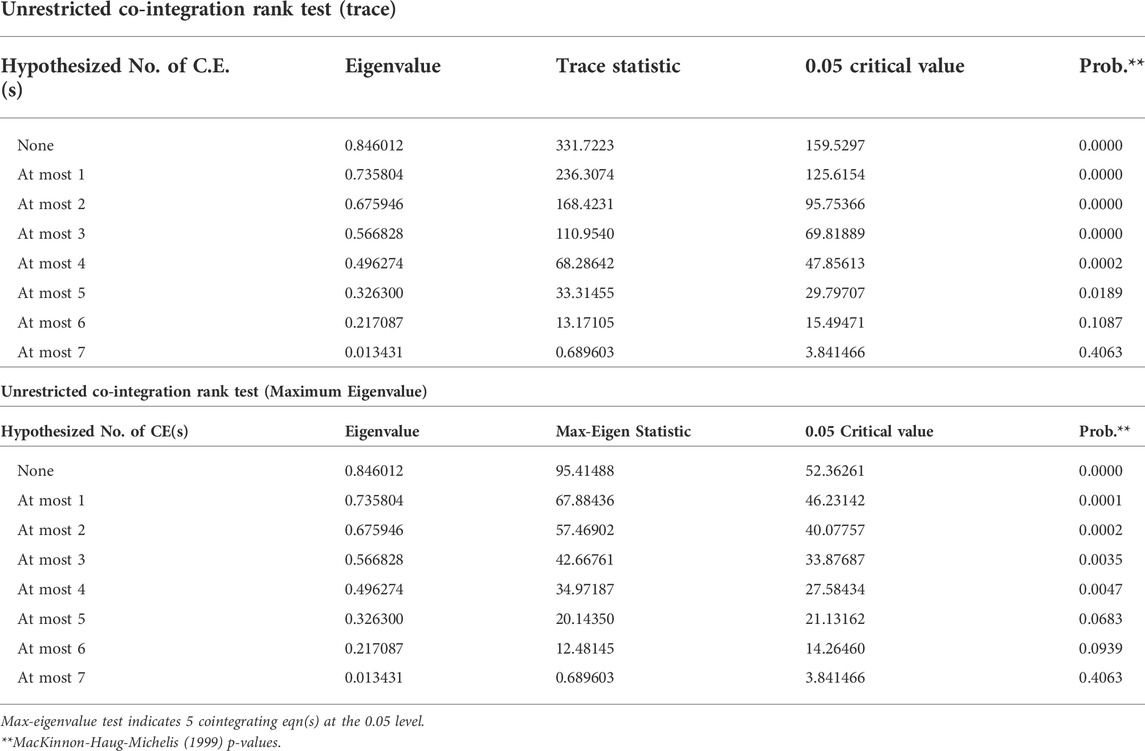
TABLE 7. Johansen co-integration test results.
Estimations of long-run and short-run
The results of the long-run coefficient were presented in Table 8, which shows that the coefficients of agricultural land and land under cereal crops were both positive and statistically significant. A 1 percent increase in agricultural land and land under cereal crops will lead to a 3.427185 percent and 4.394142 percent increase in CO2 emissions. The findings also estimated that the population coefficient was positive but not statistically significant. Moreover, the crop production index coefficient was negative and significant, which means that a 1 percent increase in crop production index will lead to a 2.725534 percent decrease in CO2 emissions. The coefficients of the remaining study variables (gross domestic product, livestock production index and agriculture value-added) were all negative and non-significant.
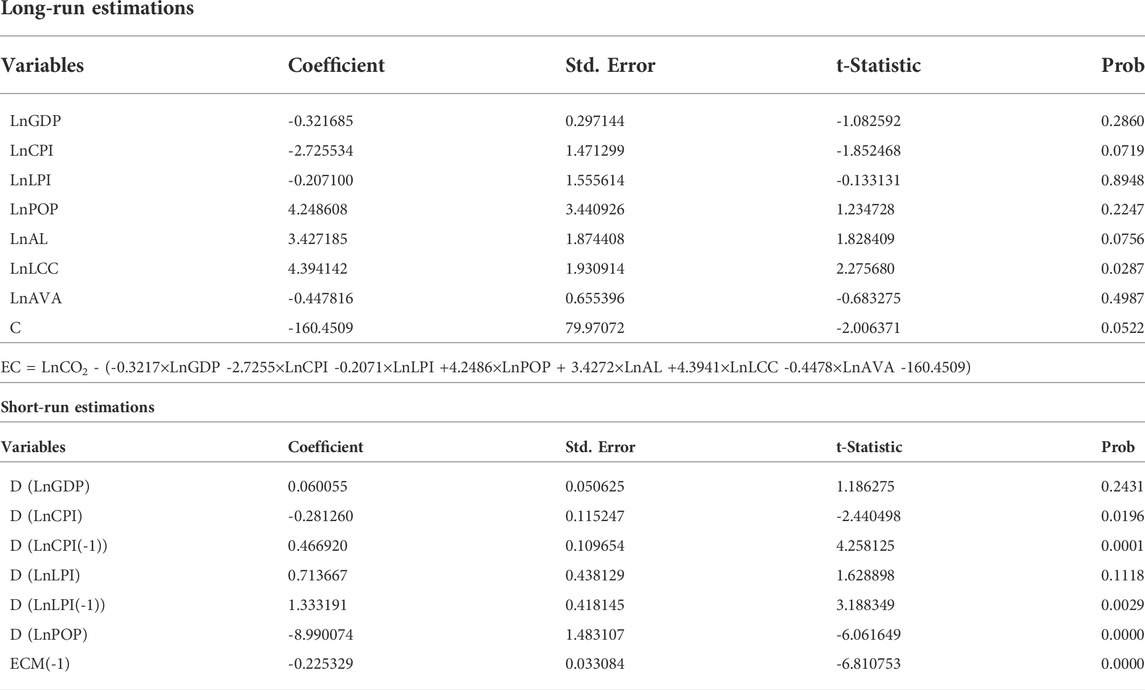
TABLE 8. ARDL long-run and short-run estimations [selected model: (1, 1, 2, 2, 1, 0, 0, 0)].
The empirical data suggest a short-run relationship between the variables based on the ARDL bounds test technique. The coefficient of crop production index and livestock production index are positive and statistically significant at a 1 percent level. This implies that the crop production index and livestock production index will play a critical role in boosting CO2 emissions in Pakistan in the short run. The results estimate that a 1 percent increase in the crop and livestock production index leads to an increase in CO2 emissions by 0.466920 percent and 1.333191 percent, respectively (Table 8). The gross domestic product has a positive and non-significant impact on CO2 emissions in short-run estimates. The findings also reveal that the coefficient of population is negatively significant, meaning that a 1 percent increase in population will lead to an 8.990074 percent decrease the carbon dioxide emissions. The outcomes of the short-run estimates provide an error correction model (ECM) that reflects the co-integration connection between the variables. The outcomes indicate that the coefficient of ECM(-1) is negatively significant at a 1 percent level, indicating that the disequilibria from the shock of previous year converge to the long-run equilibrium in the current year by around 0.225329 percent.
ARDL diagnostic tests
Depending on the recursive regression residuals, the cumulative sum (CUSUM) and cumulative sum of the square (CUSUMsq) analyses were used, as proposed by (Brown et al., 1975), in a befitting manner to implement the model reliability. According to this test, it would be suggested that the estimated coefficient of ARDL model is stable if the statistical line falls within the critical boundaries at a significance level of 5 percent. Figure 3 demonstrates that the carbon dioxide emissions statistics are inside the 5% critical lines, indicating that the model coefficients are stable and that we can confidently perform the ARDL model. Several scholars have also performed CUSUM and CUSUMsq tests to ensure the model’s reliability (Ploberger and Kramer 1992; Xiao and Phillips 2002; Lee et al., 2003; Westerlund 2005; Afzal et al., 2010; Huang et al., 2011; Seker et al., 2015; Ali et al., 2019a; Ali et al. 2019b; Ali et al. 2019c; Rehman et al., 2019; Ali et al., 2020). Furthermore, we conduct additional diagnostic tests to confirm the reliability of the ARDL model employed in this research, with favorable outcomes for the selected variables. These diagnostics tests include the Breusch-Godfrey serial correlation L.M. test and the Heteroskasticity test, displayed in Table 9. By demonstrating the inverse root of A.R. polynomial estimate, Pesaran (Pesaran and Pesaran 1997) introduced the stability vector autoregression (VAR) test. Figure 4 demonstrates that all of the green dotted-shaped patterns are contained within the blue circle, indicating that our model is stable and valid.
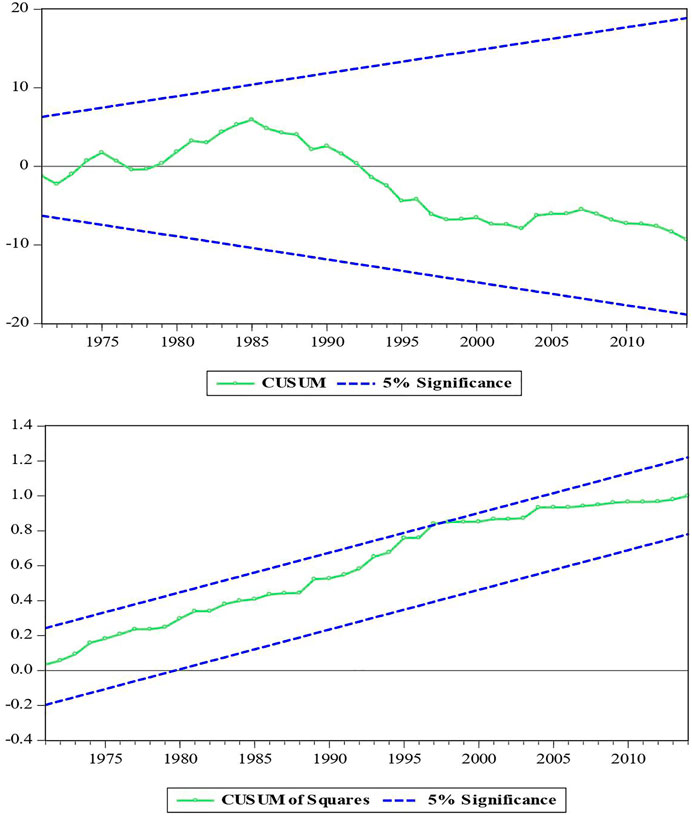
FIGURE 3. CUSUM and CUSUMsquare tests.

TABLE 9. Model diagnostic tests results.
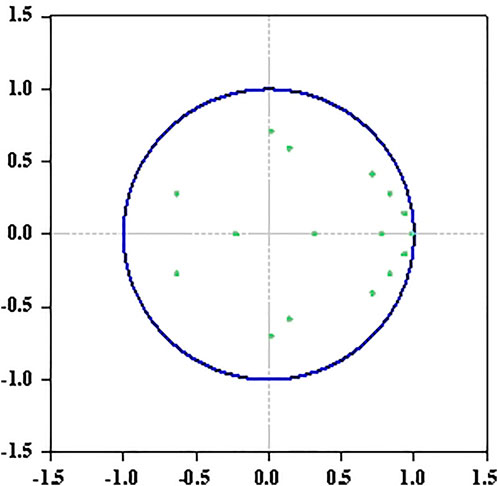
FIGURE 4. Inverse roots of AR characteristic polynomial.
Pairwise Granger causality and variance decomposition analysis
By hand investigation, to determine the robustness of the selected model, we performed a Pairwise Granger causality test (Granger and Jji 1988). Table 10 estimates the Pairwise Granger causality test, which illustrates the directional relationships between the selected variables at a given time. The findings suggest a unidirectional causality between LnCO2 to LnGDP, LnPOP to LnCO2, LnAVA to LnCO2, LnGDP to LnLPI, LnGDP to LnLCC, LnCPI to LnLPI, LnPOP to LnCPI, LnAL to LnCPI, LnCPI to LnLCC, LnAVA to LnLPI, LnPOP to LnLCC and LnAVA to LnLCC. The results show a bidirectional causality between LnLPI to LnCO2, LnPOP to LnGDP and LnPOP to LnLPI, respectively.
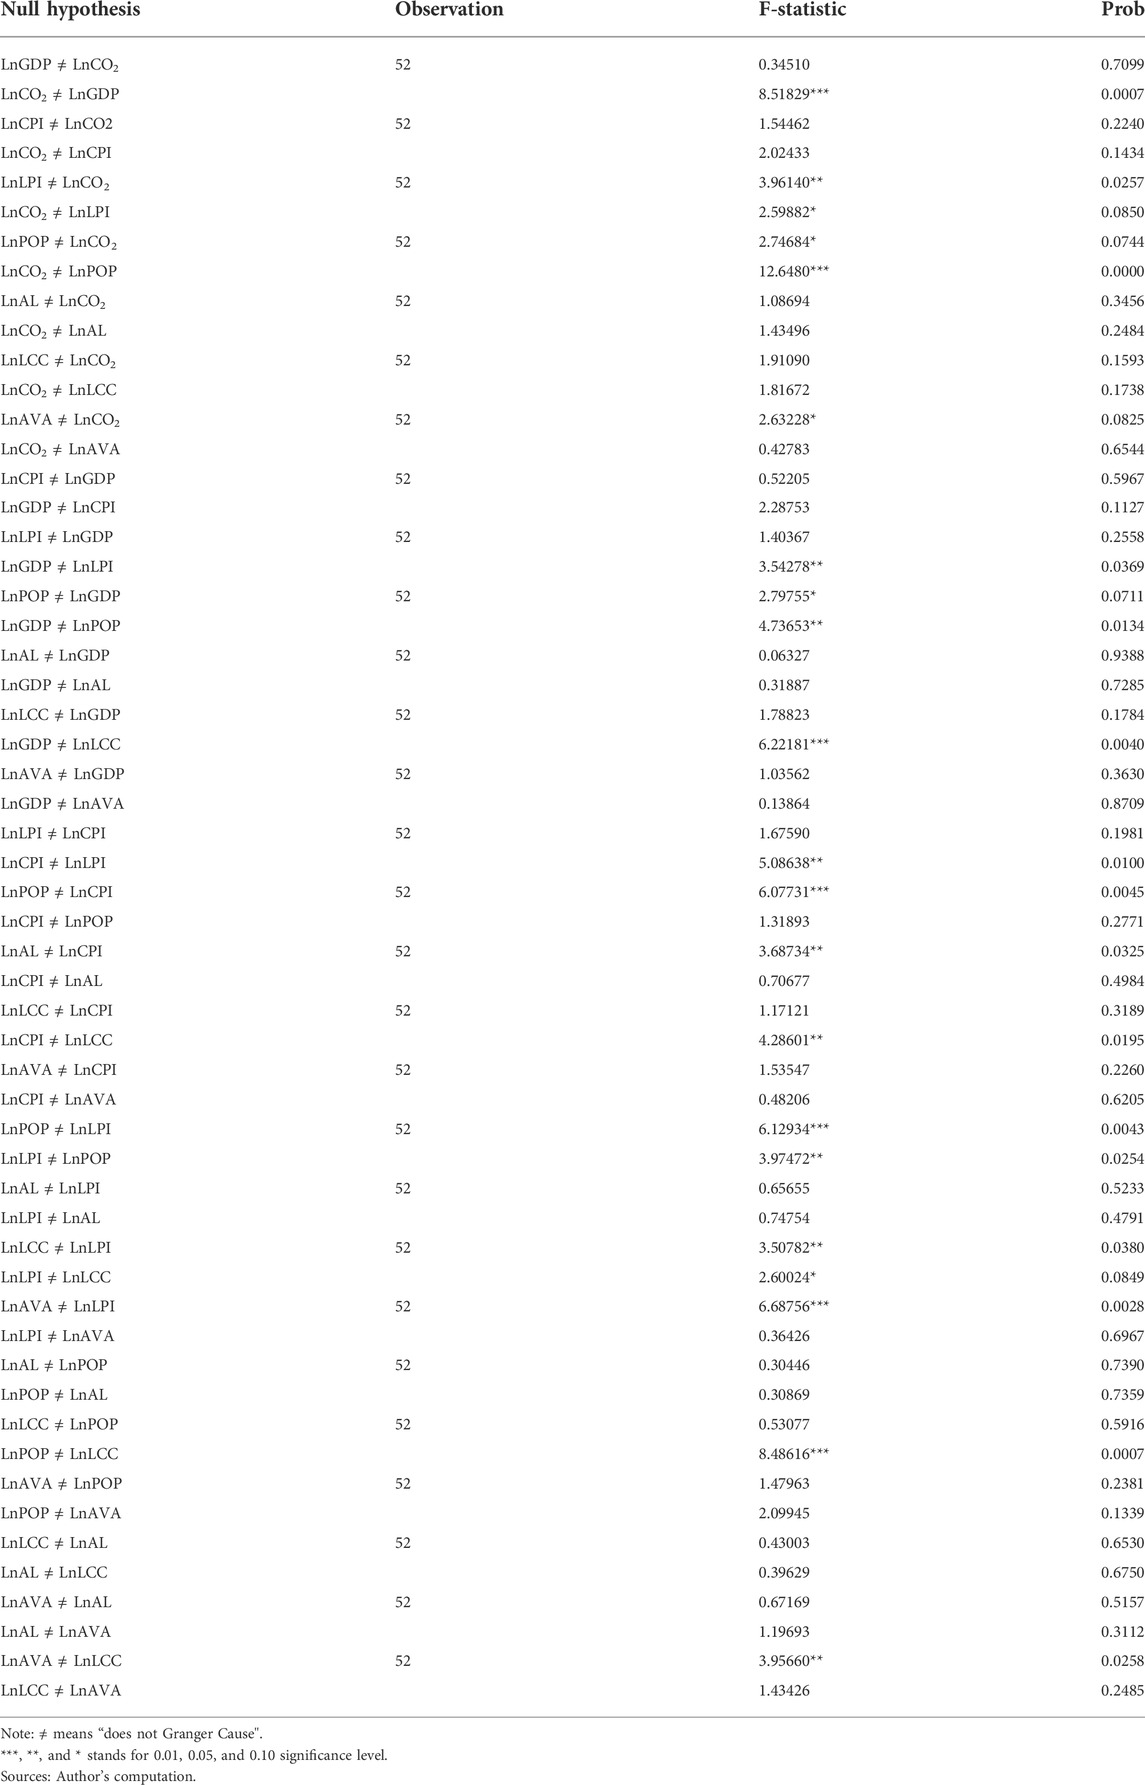
TABLE 10. Pairwise Granger causality test.
In addition, we calculated Cholesky’s technique of random innovation to determine the variance decomposition for all variables (Payne 2002). The outcomes estimated in Table 11 show that around 0.41 percent of the future variation in LnCO2 is due to disturbances in LnGDP, 5.44 percent of the future variation in LnCO2 is due to disturbances in LnCPI, 0.59 percent of the future variation in LnCO2 is due to disturbances in LnLPI, 0.13 percent of the future variation in LnCO2 is due to disturbances in LnPOP, 6.5 percent of the future variation in LnCO2 is due to disturbances in LnAL, 1.95 percent of the future variation in LnCO2 is due to disturbances in LnLCC, and 5.44 percent of the future variation in LnCO2 is due to disturbances in LnAVA, respectively. Descriptions from the outcomes indicate that almost 6.16 percent of the future variation in LnGDP is due to disturbances in LnCPI, 2.09 percent of future variation in LnGDP is due to disturbances in LnLPI, 3.14 percent of the future variation in LnGDP is due to disturbances in LnPOP, 0.29 percent of the future variation in LnGDP is due to disturbances in LnAL, 4.16 percent of the future variation in LnGDP is due to disturbances in LnLCC, and 18 percent of the future variation in LnGDP is due to disturbances in LnAVA. Furthermore, suggestions from the outcomes show that nearly 4.55 percent of the future variation in LnCPI is due to disturbances in LnLPI, 1.76 percent of the future variation in LnCPI is due to disturbances in LnPOP, 2.77 percent of the future variation in LnCPI is due to disturbances in LnAL, 6.91 percent of the future variation in LnCPI is due to disturbances in LnLCC and 23.1 percent of the future variation in LnCPI is due to disturbances in LnAVA, respectively. Finally, the evidence from variance decomposition results show that around 1.45 percent of the future variation in LnAVA is due to disturbances in LnCO2, 0.41 percent of the future variation in LnAVA is due to disturbances in LnGDP, 0.91 percent of the future variation in LnAVA is due to disturbances in LnCPI, 19.7 percent of future variation in LnAVA is due to disturbances in LnLPI, 8.07 percent of the future variation in the LnAVA is due to disturbances in LnPOP, 1 percent of the future variation in the LnAVA is due to disturbances in LnAL, and 4.11 percent of the future variation in LnAVA is due to disturbances in LnLCC, respectively.
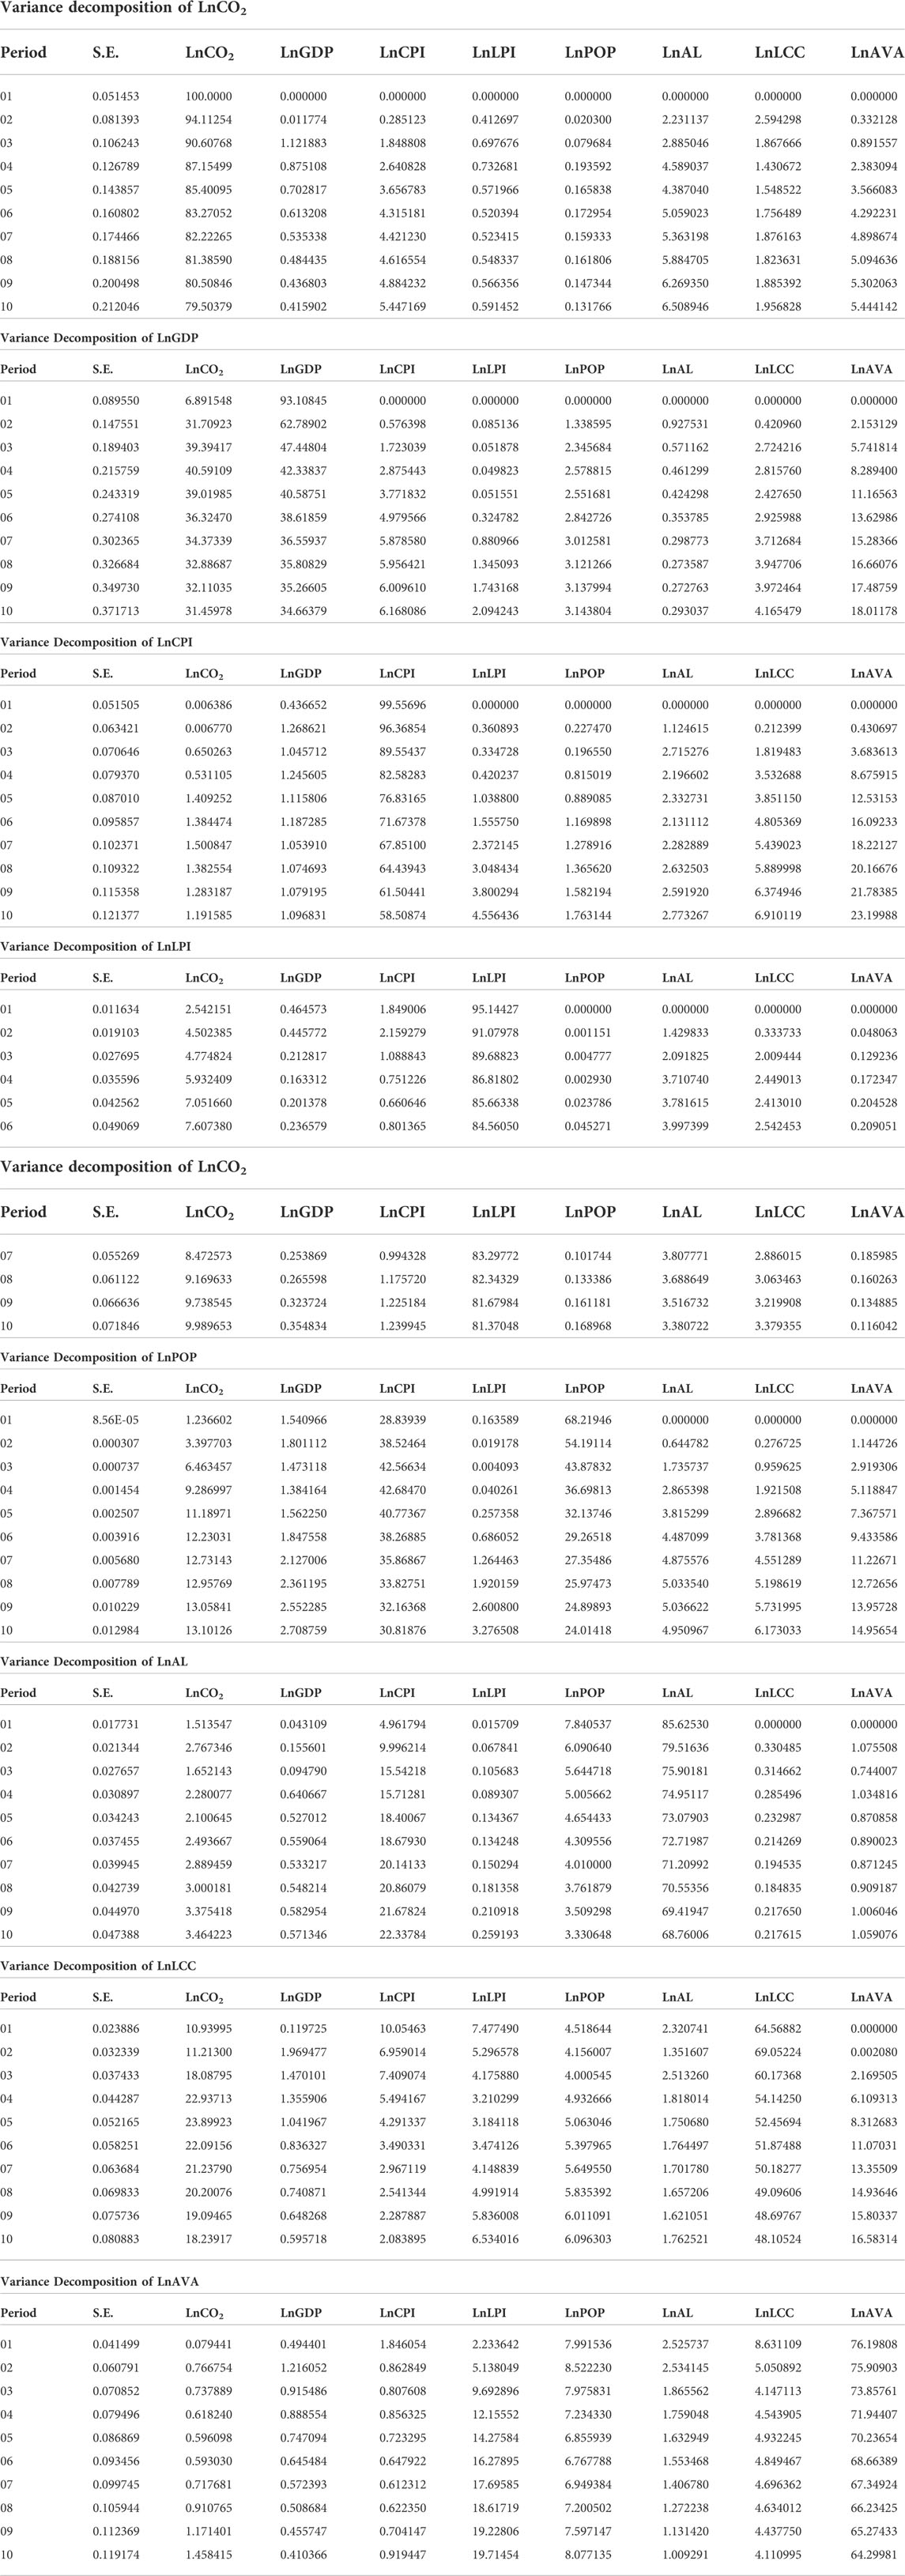
TABLE 11. Variance decomposition cholesky ordering: LnCO2 LnGDP LnCPI LnLPI LnPOP LnAL LnLCC LnAVA.
Conclusion and policy implications
The persistent threat posed by climate change resulting from carbon dioxide emissions has compelled world leaders to strive diligently to tackle it with full seriousness. In this study, we analyze the relationships among the carbon dioxide emissions, gross domestic product, crop production index, livestock production index, population, agricultural land, land under cereal crops and agriculture value-added in Pakistan between 1961 and 2014. We perform ADF and PP unit root tests on all research variables before employing an Autoregressive Distributed lag (ARDL) bound technique to determine the short-run and long-run correlations between all study variables.
The outcomes of the short and long-term approximations display that most of the study variables have a statistically positive relationship with the dependent variable (carbon dioxide emissions). The F-statistics value was 4.237766, higher than the upper bound value at a 1 percent significant level. The results of the long-run coefficient show that the coefficients of agriculture land and land under cereal crops were both positive and statistically significant. The findings also estimated that the coefficient of population was positive but not statistically significant. In addition, the coefficient of crop production index was negative and statistically significant, revealing that an increase in crop production index will lead to a decrease in carbon dioxide emissions. The outcomes from short-run estimates show that the coefficients of CPI and LPI are both positive and statistically significant, which implies that these variables are crucial in boosting carbon emissions. According to the short-run relationship estimates, the error correction model (ECM) was negative and statistically significant at a 1 percent level, indicating that around 0.225329 percent of disequilibria from the previous year’s shock converge to the long-run equilibrium in the current year. Moving to the Pairwise Granger causality analysis, the outcome reveals unidirectional and bidirectional causality between chosen variables for this research work.
We focused on Pakistan for this research because the country’s economic growth and carbon dioxide emissions are hampered by increasing population and energy shortages. According to the findings of this study, Pakistan should address the major problems facing its agricultural sector, notably those related to crop and livestock output. The outcome of this research might lead to a number of different policy changes that would guarantee long-lasting progress.
Data availability statement
The original contributions presented in the study are included in the article/Supplementary Material, further inquiries can be directed to the corresponding author.
Author contributions
Conceptualization by SA; Data curation by AG and SA; Formal analysis by SA; Methodology by SA and AS; Supervision by MT; Writing-original draft by SA; Writing-review and editing by SA.
Acknowledgments
The authors would also like to extend gratitude to reviewers for providing helpful suggestions on an earlier draft of this paper.
Conflict of interest
The authors declare that the research was conducted in the absence of any commercial or financial relationships that could be construed as a potential conflict of interest.
Publisher’s note
All claims expressed in this article are solely those of the authors and do not necessarily represent those of their affiliated organizations, or those of the publisher, the editors and the reviewers. Any product that may be evaluated in this article, or claim that may be made by its manufacturer, is not guaranteed or endorsed by the publisher.
References
Abid, M., Schneider, U. A., and Scheffran, J. (2016). Adaptation to climate change and its impacts on food productivity and crop income: Perspectives of farmers in rural Pakistan. J. Rural Stud. 47, 254–266. doi:10.1016/j.jrurstud.2016.08.005
Adams, M. R., Rosenzweig, C., Peart, M. R., Ritchie, J. T., McCarl, B. A., Glyer, J. D., et al. (1990). Global climate change and US agriculture. Nature 345, 219–224. doi:10.1038/345219a0
Aftab, S., Ahmed, A., Ali Chandio, A., Asiamah Korankye, B., Ali, A., and Wang, F. (2021). Modeling the nexus between carbon emissions, energy consumption, and economic progress in Pakistan: Evidence from cointegration and causality analysis. Energy Rep. 7, 4642–4658. doi:10.1016/j.egyr.2021.07.020
Afzal, M., Farooq, M., and Ahmad, H. (2010). Relationship between school education and economic growth in Pakistan: ARDL bounds testing approach to cointegration. Pak. Econ. Soc. Rev. 48 (1), 39–60. doi:10.2307/41762413
Ahmed, M., Qiu, L., Li, H., Liu, W., and He, G. (2018). A nexus between air pollution, energy consumption and growth of economy: A comparative study between the USA and China-based on the ARDL bound testing approach. Agric. Econ. 64, 265–276. doi:10.17221/101/2017-AGRICECON
Akaike, H. (1974). A new look at the statistical model identification. IEEE Trans. Autom. Contr. 19 (6), 716–723. doi:10.1109/TAC.1974.1100705
Ali, S., Li, G., Liu, Y., Ishaq, M., and Shah, T. (2019a). The relationship between carbon dioxide emissions, economic growth and agricultural production in Pakistan: An autoregressive distributed lag analysis. Energies 12 (24), 4644. doi:10.3390/en12244644
Ali, S., Liu, Y., Abdullah, A. N., Ishaq, M., Shah, T., Ye, X., et al. (2019b). The effect of climate change on economic growth: Evidence from Pakistan. Pac. Int. J. 2 (3), 44–53. doi:10.1007/s10018-015-0116-3
Ali, S., Liu, Y., Shah, T., Azam, T., Ali Chandio, A., and Ali, I. (2019c). Analysis of the nexus of CO2 emissions, economic growth, land under cereal crops and agriculture value-added in Pakistan using an ARDL approach. Energies 12 (23), 4590. doi:10.3390/en12234590
Ali, S., Liu, Y., Nazir, A., Ishaq, M., Bahadar Khan, S. A., and Shah, T. (2020). Does technical progress mitigate climate effect on crops yield in Pakistan? J. Animal Plant Sci. 30 (3), 663–676. doi:10.36899/JAPS.2020.3.0079
Ali, S., Liu, Y., Anjum, R., Nazir, A., Abdullah, S., Shah, T., et al. (2021a). Analysis on the nexus of CO2 emissions, energy use, net domestic credit, and GDP in Pakistan: An ARDL bound testing analysis. Environ. Sci. Pollut. Res. 28 (4), 4594–4614. doi:10.1007/s11356-020-10763-7
Ali, S., Zubair, M., and Hussain, S. (2021b). The combined effect of climatic factors and technical advancement on yield of sugarcane by using ARDL approach: Evidence from Pakistan. Environ. Sci. Pollut. Res. 28 (29), 39787–39804. doi:10.1007/s11356-021-13313-x
Alper, A., and Onur, G. (2016). Environmental Kuznets Curve hypothesis for sub-elements of the carbon emissions in China. Nat. Hazards (Dordr). 82 (2), 1327–1340. doi:10.1007/s11069-016-2246-8
Amuakwa-Mensah, F., and Adom, P. K. (2017). Quality of institution and the FEG (forest, energy intensity, and globalization) -environment relationships in sub-saharan Africa. Environ. Sci. Pollut. Res. 24 (21), 17455–17473. doi:10.1007/s11356-017-9300-2
Appiah, K., Du, J., Ibn Musah, A. A., and Afriyie, S. (2017). Investigation of the relationship between economic growth and carbon dioxide (CO2) emissions as economic structure changes : Evidence from Ghana. Resour. Environ. 7 (6), 160–167. doi:10.5923/j.re.20170706.02
Appiah, K., Du, J., and Poku, J. (2018). Causal relationship between agricultural production and carbon dioxide emissions in selected emerging economies. Environ. Sci. Pollut. Res. 25 (25), 24764–24777. doi:10.1007/s11356-018-2523-z
Asumadu-Sarkodie, S., and Owusu, P. A. (2016). The relationship between carbon dioxide and agriculture in Ghana: A comparison of VECM and ARDL model. Environ. Sci. Pollut. Res. 23 (11), 10968–10982. doi:10.1007/s11356-016-6252-x
Atif, S. B., Saqib, Z., Ali, A., and Zaman, M. H. (2018). The impacts of socio-economic factors on the perception of residents about urban vegetation: A comparative study of planned versus semi-planned cities of islamabad and rawalpindi, Pakistan. Appl. Ecol. Environ. Res. 16 (4), 4265–4287. doi:10.15666/aeer/1604_42654287
Attavanich, W., and McCarl, B. A. (2013). How is CO2 affecting yields and technological progress? A statistical analysis. Clim. Change 124 (4), 747–762. doi:10.1007/s10584-014-1128-x
Azam, M., Qayyum Khan, A., Abdullah, H. B., and Qureshi, M. E. (2016). The impact of CO 2 emissions on economic growth : Evidence from selected higher CO 2 emissions economies. Environ. Sci. Pollut. Res. 23, 6376–6389. doi:10.1007/s11356-015-5817-4
Bakır, H., Ağbulut, Ü., Etem Gürel, A., Yıldız, G., Güvenç, U., Soudagar, M. E. M., et al. (2022). Forecasting of future greenhouse gas emission trajectory for India using energy and economic indexes with various metaheuristic algorithms. J. Clean. Prod. 360, 131946. doi:10.1016/j.jclepro.2022.131946
Bargaoui, S. A., Liouane, N., and Zouheir Nouri, F. (2014). Environmental impact determinants: An empirical analysis based on the STIRPAT model. Procedia - Soc. Behav. Sci. 109, 449–458. doi:10.1016/j.sbspro.2013.12.489
Bokhari, S. A., Saqib, Z., Ali, A., and Haq, M. Z. u. (2018). Perception of residents about urban vegetation: A comparative study of planned versus semi-planned cities of islamabad and rawalpindi, Pakistan. J. Ecosyst. Ecogr. 8 (1), 1–8. doi:10.4172/2157-7625.1000251
Boko, M., Niang, I., Nyong, A., Vogel, C., Githeko, A., Medany, M., et al. (2007). Climate change 2007: Impacts, adaptation and vulnerability. Contribution of working group II to the fourth assessment report of the intergovernmental panel on climate change. Cambridge, UK: Cambridge University Press, 976. doi:10.2134/jeq2008.0015br
Brown, R. L., Durbin, J., and Evans, J. M. (1975). Techniques for testing the constancy of regression relationships over time. J. R. Stat. Soc. Ser. B Methodol. 37, 149–192.
Brown, M. E., Carr, E. R., Grace, K. L., Keith, W., Funk, C. C., Attavanich, W., et al. (2017). Do markets and trade help or hurt the global food system Adapt to climate change? Food Policy 68, 154–159. doi:10.1016/j.foodpol.2017.02.004
Bruinsma, J. (2009). “The resources outlook: By how much do land, water and crop yields need to increase by 2050,” in Looking ahead in world food and agriculture: Perspectives to 2050, 558. I2280E/1/06.11.
Burney, J. A., Davis, S. J., and Lobell, D. B. (2010). Greenhouse gas mitigation by agricultural intensification. Proc. Natl. Acad. Sci. U. S. A. 107 (26), 12052–12057. doi:10.1073/pnas.0914216107
Churchill, A., Sefa, J. I., and Ivanovski, K. (2020). Stochastic convergence in per capita CO2 emissions: Evidence from emerging economies, 1921–2014. Energy Econ. 86, 104659. doi:10.1016/j.eneco.2019.104659
Danish, B. Z., Wang, Z., and Wang, B. (2018). Energy production, economic growth and CO2 emission: Evidence from Pakistan. Nat. Hazards (Dordr). 90 (1), 27–50. doi:10.1007/s11069-017-3031-z
Dickey, D. A., and Fuller, W. A. (1979). Distribution of the estimators for autoregressive time series with a unit root. J. Am. Stat. Assoc. 74, 427–431. doi:10.1080/01621459.1979.10482531
Elliott, R. J. R., Sun, P., and Zhu, T. (2017). The direct and indirect effect of urbanization on energy intensity : A province-level study for China. Energy 123, 677–692. doi:10.1016/j.energy.2017.01.143
Engle, R. F., and Granger, C. W. J. (1987). Co-integration and error correction: Representation, estimation, and testing. Econometrica 55, 251–276. doi:10.2307/1913236
FAO (2013). The state of food insecurity in the world the multiple dimensions of food security. Food and agriculture organization of the united nations. Rome: Food and Agriculture Organizaiton.
Farhani, S., and Ozturk, I. (2015). Causal relationship between CO2 emissions, real GDP, energy consumption, financial development, trade openness, and urbanization in Tunisia. Environ. Sci. Pollut. Res. 22 (20), 15663–15676. doi:10.1007/s11356-015-4767-1
Feng, K., Davis, S. J., Sun, L., and Hubacek, K. (2015). Drivers of the US CO2 emissions 1997-2013. Nat. Commun. 6, 7714–7718. doi:10.1038/ncomms8714
Granger, C. W. J., and Jji, E. (1988). Some recent development in a concept of causality. J. Econ. 39, 199–211. doi:10.1016/0304-4076(88)90045-0
Huang, Y., Li, H., Campbell, K. A., and Han, Z. (2011). “Defending false data injection attack on smart grid network using adaptive CUSUM test,” in Proceeding of the 2011 45th Annual Conference on Information Sciences and Systems, Baltimore, MD, USA, March 2011 (IEEE). doi:10.1109/CISS.2011.5766111
IPCC (2014). Climate change 2014: Synthesis report. Contribution of working groups I, II and III to the fifth assessment report of the intergovernmental panel on climate change. Geneva, Switzerland: IPCC. doi:10.1017/CBO9781107415324.004
IPCC (2018). Summary for policymakers of IPCC special report on global warming of 1.5oC approved by governments. Geneva, Switzerland: IPCC. Available at: https://www.ipcc.ch/site/assets/uploads/2018/11/pr_181008_P48_spm_en.pdf.
Iwata, H., and Okada, K. (2014). Greenhouse gas emissions and the role of the kyoto protocol. Environ. Econ. Policy Stud. 16 (4), 325–342. doi:10.1007/s10018-012-0047-1
Jayanthakumaran, K., Verma, R., and Liu, Y. (2012). CO2 emissions , energy consumption , trade and income : A comparative analysis of China and India. Energy Policy 42, 450–460. doi:10.1016/j.enpol.2011.12.010
Jebli, M. B., and Ben Youssef, S. (2017). Renewable energy consumption and agriculture: Evidence for cointegration and granger causality for Tunisian economy. Int. J. Sustain. Dev. World Ecol. 24 (2), 149–158. doi:10.1080/13504509.2016.1196467
Johansen, S., and Juselius, K. (1990). Maximum likelihood estimation and inference on cointegration — with applications to the demand for money. Oxf. Bull. Econ. Stat. 52 (2), 169–210. doi:10.1111/j.1468-0084.1990.mp52002003.x
Kasman, A., and Selman, Y. (2015). CO2 emissions , economic growth , energy consumption , trade and urbanization in new eu member and candidate countries : A panel data analysis. Econ. Model. 44, 97–103. doi:10.1016/j.econmod.2014.10.022
Khan, A. N., Ghauri, B. M., Jilani, R., and Rahman, S. (2004). “Climate change: Emissions and sinks of greenhouse gases in Pakistan,”. Symposium on “changing environmental pattern and its impact with special focus on Pakistan, 293, 1–15.
Koondhar, M. A., Qiu, L., Magsi, H., Ali Chandio, A., and Ge, H. (2018). Comparing economic efficiency of wheat productivity in different cropping systems of sindh province, Pakistan. J. Saudi Soc. Agric. Sci. 17 (4), 398–407. doi:10.1016/j.jssas.2016.09.006
Koondhar, M. A., Udemba, E. N., Cheng, Y., Khan, Z. A., Koondhar, M. A., Batool, M., et al. (2021). Asymmetric causality among carbon emission from agriculture, energy consumption, fertilizer, and cereal food production – a nonlinear analysis for Pakistan. Sustain. Energy Technol. Assessments 45, 101099. doi:10.1016/j.seta.2021.101099
Lal, R. (2004). Carbon emission from farm operations. Environ. Int. 30 (7), 981–990. doi:10.1016/j.envint.2004.03.005
Lee, S., Ha, J., Na, O., and Seongryong, N. (2003). The cusum test for parameter change in time series models. Scand. J. Stat. 30 (4), 781–796. doi:10.1111/1467-9469.00364
Lin, B., and Raza, M. Y. (2020). Analysis of energy security indicators and CO2 emissions. A case from a developing economy. Energy 200, 117575. doi:10.1016/j.energy.2020.117575
Lott, M. C., Pye, S., and Dodds, P. E. (2017). Quantifying the Co-impacts of energy sector decarbonisation on outdoor air pollution in the United Kingdom. Energy Policy 101, 42–51. doi:10.1016/j.enpol.2016.11.028
Mbarek, M., Saidi, K., and Rahman, M. M. (2018). Renewable and non-renewable energy consumption, environmental degradation and economic growth in Tunisia. Qual. Quant. 52 (3), 1105–1119. doi:10.1007/s11135-017-0506-7
Mendelsohn, R., Nordhaus, W. D., and Shaw, D. (1994). The impact of global warming on agriculture: A ricardian analysis. Am. Econ. Rev. 84 (4), 753–771.
Miao, R., Khanna, M., and Huang, H. (2015). Responsiveness of crop yield and acreage to prices and climate. Am. J. Agric. Econ. 98 (1), 191–211. doi:10.1093/ajae/aav025
Naseem, S., Tong, G. J., and Kashif, U. (2020). Asymmetrical ARDL correlation between fossil fuel energy, food security, and carbon emission: Providing fresh information from Pakistan. Environ. Sci. Pollut. Res. 27 (25), 31369–31382. doi:10.1007/s11356-020-09346-3
Nkoro, E., and Uko, A. K. (2016). Autoregressive distributed lag (ARDL) cointegration technique: Application and interpretation. J. Stat. Econ. Methods 5, 63–91.
Özokcu, S., and Özdemir, Ö. (2017). Economic growth, energy, and environmental Kuznets Curve. Renew. Sustain. Energy Rev. 72, 639–647. doi:10.1016/j.rser.2017.01.059
Parry, M. L., Rosenzweig, C., Iglesias, A., Livermore, M., and Fischer, G. (2004). Effects of climate change on global food production under SRES emissions and socio-economic scenarios. Glob. Environ. Change 14 (1), 53–67. doi:10.1016/j.gloenvcha.2003.10.008
Payne, J. E. (2002). Inflationary dynamics of a transition economy: The Croatian experience. J. Policy Model. 24 (3), 219–230. doi:10.1016/S0161-8938(02)00106-0
Pesaran, M. H., and Pesaran, B. (1997). Working with microfit 4.0: Interactive econometric analysis. Oxford: Oxford University Press.
Pesaran, M. H., Shin, Y., and Smith, R. J. (2001). Bounds testing approaches to the analysis of level relationships. J. Appl. Econ. Chichester. Engl. 16 (3), 289–326. doi:10.1002/jae.616
Phillips, P. C. B., and Pierre Perron, P. (1988). Testing for a unit root in time series regression. Biometrika 75 (2), 335–346. doi:10.1093/biomet/75.2.335
Ploberger, W., and Kramer, W. (1992). The CUSUM test with ols residuals. Econometrica 60 (2), 271–285. doi:10.2307/2951597
Rahman, M., Mafizur, M., and Abul Kashem, M. (2017). Carbon emissions, energy consumption and industrial growth in Bangladesh: Empirical evidence from ARDL cointegration and granger causality analysis. Energy Policy 110, 600–608. doi:10.1016/j.enpol.2017.09.006
Rauf, A., Zhang, J., Li, J., and Amin, W. (2018). Structural changes, energy consumption and carbon emissions in China: Empirical evidence from ARDL bound testing model. Struct. Change Econ. Dyn. 47, 194–206. doi:10.1016/j.strueco.2018.08.010
Reay, D. S., Davidson, E. A., Smith, K. A., Melillo, J. M., Frank, D., Crutzen, P. J., et al. (2012). Global agriculture and nitrous oxide emissions. Nat. Clim. Chang. 2 (6), 410–416. doi:10.1038/nclimate1458
Rehman, A., Rauf, A., Ahmad, M., Ali Chandio, A., and Zhang, D. (2019). The effect of carbon dioxide emission and the consumption of electrical energy, fossil fuel energy, and renewable energy, on economic performance: Evidence from Pakistan. Environ. Sci. Pollut. Res. 26 (21), 21760–21773. doi:10.1007/s11356-019-05550-y
Rehman, A., Ma, H., Ahmad, M., Irfan, M., Traore, O., and Ali Chandio, A. (2021). Towards environmental sustainability: Devolving the influence of carbon dioxide emission to population growth, climate change, forestry, livestock and crops production in Pakistan. Ecol. Indic. 125, 107460. doi:10.1016/j.ecolind.2021.107460
Saidi, K., Rahman, M. M., and Amamri, M. (2017). The causal nexus between economic growth and energy consumption: New evidence from global panel of 53 countries. Sustain. Cities Soc. 33, 45–56. doi:10.1016/j.scs.2017.05.013
Sakadevan, K., and Nguyen, M. L. (2017). Livestock production and its impact on nutrient pollution and greenhouse gas emissions. Advances in Agronomy. 1st ed., 141. Elsevier. doi:10.1016/bs.agron.2016.10.002
Sarkodie, S. A., and Owusu, P. A. (2017). The relationship between carbon dioxide, crop and food production index in Ghana: By estimating the long-run elasticities and variance decomposition. Environ. Eng. Res. 22 (2), 193–202. doi:10.4491/eer.2016.135
Schlenker, W., Robert, J. M., Jongschaap, R. E. E., Franke, A. C., Schaap, B. F., Dueck, T. A., et al. (2009). Nonlinear temperature effects indicate severe damages to U.S. Crop yields under climate change. Proc. Natl. Acad. Sci. U. S. A. 106 (43), E120. author reply E121-98. doi:10.1073/pnas.0910618106
Schwarz, G. (1978). Estimating the dimension of a model. Ann. Stat. 6 (2), 461–464. doi:10.1214/aos/1176344136
Seker, F., Murat Ertugrul, H., and Cetin, M. (2015). The impact of foreign direct investment on environmental quality: A bounds testing and causality analysis for Turkey. Renew. Sustain. Energy Rev. 52, 347–356. doi:10.1016/j.rser.2015.07.118
Shahbaz, M., Adnan Hye, Q. M., Tiwari, A. K., and Carlos Leitão, N. (2013). Economic growth, energy consumption, financial development, international trade and CO2 emissions in Indonesia. Renew. Sustain. Energy Rev. 25, 109–121. doi:10.1016/j.rser.2013.04.009
Smadja, J., Aubriot, O., Puschiasis, O., Duplan, T., Hugonnet, M., Hugonnet, M., et al. (2015). Climate change and water resources in the himalayas: Field study in four geographic units of the koshi. J. Alp. Res. 103 (2), 2–22. doi:10.4000/rga.2910
Smith, J., Sones, K., Grace, D., MacMillan, S., Tarawali, S., and Herrero, M. (2013). Beyond milk, meat, and eggs: Role of livestock in food and nutrition security. Anim. Front. 3 (1), 6–13. doi:10.2527/af.2013-0002
Smith, P. (2012). Agricultural greenhouse gas mitigation potential globally, in europe and in the UK: What have we learnt in the last 20 Years? Glob. Chang. Biol. 18 (1), 35–43. doi:10.1111/j.1365-2486.2011.02517.x
Tao, F., and Zhang, Z. (2013). Climate change, wheat productivity and water use in the North China plain: A new super-ensemble-based probabilistic projection. Agric. For. Meteorology 170, 146–165. doi:10.1016/j.agrformet.2011.10.003
Tao, F., Zhang, Z., Xiao, D., Zhang, S., Rötter, R. P., Shi, W., et al. (2014). Responses of wheat growth and yield to climate change in different climate zones of China, 1981-2009. Agric. For. Meteorology 189-190, 91–104. doi:10.1016/j.agrformet.2014.01.013
Tubiello, F. N., Salvatore, M., Rossi, S., Ferrara, A., Fitton, N., and Smith, P. (2013). The FAOSTAT database of greenhouse gas emissions from agriculture. Environ. Res. Lett. 8, 015009. doi:10.1088/1748-9326/8/1/015009
Westerlund, J. (2005). A panel CUSUM test of the null of cointegration. Oxf. Bull. Econ. Stat. 67 (2), 231–262. doi:10.1111/j.1468-0084.2004.00118.x
Wilcox, J., and Makowski, D. (2014). A meta-analysis of the predicted effects of climate change on wheat yields using simulation studies. Field Crops Res. 156, 180–190. doi:10.1016/j.fcr.2013.11.008
Woods, B. A., Ørsted Nielsen, H., Branth Pedersen, A., and Kristofersson, D. (2017). Farmers’ perceptions of climate change and their likely responses in Danish agriculture. Land Use Policy 65, 109–120. doi:10.1016/j.landusepol.2017.04.007
Xiang, X., Ma, M., Ma, X., Chen, L., Cai, W., Feng, W., et al. (2022). Historical decarbonization of global commercial building operations in the 21st century. Appl. Energy 322, 119401. doi:10.1016/j.apenergy.2022.119401
Xiao, Z., and Phillips, P. C. B. (2002). A CUSUM test for cointegration using regression residuals. J. Econ. 108 (1), 43–61. doi:10.1016/S0304-4076(01)00103-8
Xu, B., and Lin, B. (2017). What cause a surge in China’s CO2 emissions? A dynamic vector autoregression analysis. J. Clean. Prod. 143, 17–26. doi:10.1016/J.JCLEPRO.2016.12.159
Yeh, J. C., and Liao, C. H. (2017). Impact of population and economic growth on carbon emissions in taiwan using an analytic tool STIRPAT. Sustain. Environ. Res. 27 (1), 41–48. doi:10.1016/j.serj.2016.10.001
Yu, Y., YDeng, , , and Chen, F. F. (2018). Impact of population aging and industrial structure on CO2 emissions and emissions trend prediction in China. Atmos. Pollut. Res. 9 (3), 446–454. doi:10.1016/j.apr.2017.11.008
Zakarya, G., Mostefa, B., Mohammed Abbes, S., and Mohammed Seghir, G. (2015). Factors affecting CO2 emissions in the BRICS countries: A panel data analysis. Procedia Econ. Finance 26, 114–125. doi:10.1016/s2212-5671(15)00890-4
Zhang, S., Ma, M., Li, K., Ma, Z., Feng, W., and Cai, W. (2022a). Historical carbon abatement in the commercial building operation: China versus the US. Energy Econ. 105, 105712. doi:10.1016/j.eneco.2021.105712
Zhang, S., Ma, M., Xiang, X., Cai, W., Feng, W., and Ma, Z. (2022b). Potential to decarbonize the commercial building operation of the top two emitters by 2060. Resour. Conservation Recycl. 185, 106481. doi:10.1016/j.resconrec.2022.106481
Zhang, T., and Huang, Y. (2013). Estimating the impacts of warming trends on wheat and maize in China from 1980 to 2008 based on county level data. Int. J. Climatol. 33 (3), 699–708. doi:10.1002/joc.3463
Glossary
CO2 Carbon dioxide
GHG Greenhouse gas emissions
DOLS Dynamic ordinary least squares
ADF Augmented Dickey-Fuller
P.P. Phillips-Perron
BRICS Brazil, Russia, India, China, South Africa
ASEAN Association of Southeast Asian Nations
INDC Intended Nationally determined Contribution
U.S. United State
FMOLS Fully Modified Ordinary Least Square
OECD Organization for Economic Co-operation and Development
GDP Gross domestic product
POP Population
AL Agricultural Land
LCC Land Under Cereal Crop
AVA Agriculture value-added
FAO Food and Agriculture Organization
VECM Vector error correction model
ARDL Autoregressive distributed lag
MENA Middle East and North African
EKC Environmental Kuznets Curve
CUSUM Cumulative Sum
CUSUMsq Cumulative Sum of the Square
CIS Commonwealth of Independent States
WDI World Development Indicator
J-B Jarque-Bera
CSD Cross-section dependency
LM Lagrange multiplier
AIC Akaike Information Criterion
SIC Schwarz Information Criterion
VAR Vector Autoregression
CADF Cross-sectional Augmented Dickey-Fuller
ECM Error Correction Model
Keywords: CO2 emissions, livestock production index, agricultural land, ARDL model, granger causality, Pakistan
Citation: Ali S, Shah AA, Ghimire A and Tariq MAUR (2022) Investigation the nexus between CO2 emissions, agricultural land, crop, and livestock production in Pakistan. Front. Environ. Sci. 10:1014660. doi: 10.3389/fenvs.2022.1014660
Received: 08 August 2022; Accepted: 05 September 2022;
Published: 17 October 2022.
Edited by:
Kangyin Dong, University of International Business and Economics, ChinaCopyright © 2022 Ali, Shah, Ghimire and Tariq. This is an open-access article distributed under the terms of the Creative Commons Attribution License (CC BY). The use, distribution or reproduction in other forums is permitted, provided the original author(s) and the copyright owner(s) are credited and that the original publication in this journal is cited, in accordance with accepted academic practice. No use, distribution or reproduction is permitted which does not comply with these terms.
*Correspondence: Muhammad Atiq Ur Rehman Tariq, YXRpcS50YXJpcUB5YWhvby5jb20=