 Jiang Li
 Jie Wang
 Yanlan Wu1,2,3
 Yuhuan Cui
94% of researchers rate our articles as excellent or good
Learn more about the work of our research integrity team to safeguard the quality of each article we publish.
Find out more
ORIGINAL RESEARCH article
Front. Environ. Sci., 28 October 2022
Sec. Environmental Informatics and Remote Sensing
Volume 10 - 2022 | https://doi.org/10.3389/fenvs.2022.1014155
This article is part of the Research TopicRemote Sensing of Aquatic Environment and Its Implication for Environmental ManagementView all 8 articles
Remote sensing is useful for quantifying water-quality parameters for managing inland water systems. However, the single water-quality retrieval model usually has poor applicability in large regions. To solve the issue of low retrieval accuracy of water-quality parameters in inland water, the study area herein is geographically divided into rural water and urban water according to the proportion of land-use types in the riparian zones. Furthermore, the machine-learning regression algorithms are used to construct the retrieval models suitable for the total nitrogen (TN) and total phosphorus (TP) concentrations based on the measured water-quality data and the simultaneous Sentinel-2 Multispectral Imager (MSI) images. Additionally, the optical retrieval models are applied to the MSI images acquired on different dates to analyze the variations of TN and TP concentrations in the water around Chaohu Lake of China. The results show that the three accuracy indices of determination coefficient (R2), mean square error (MSE), and mean absolute percentage error (MAPE) of the TN concentration retrieval models for rural water and urban water were 0.67, 0.37 mg/L, and 36.81%, and 0.78, 0.34 mg/L, and 8.34%, respectively, while those of the TP concentration retrieval model for rural water and urban water reached 0.46, 0.0034 mg/L, and 38.60%, and 0.58, 0.018 mg/L, and 37.57%, respectively. The accuracy of the TN and TP concentration retrieval model constructed using geographical division is significantly better than that which does not use geographical division. According to the retrieval results from MSI images, the TN and TP concentrations in urban water are higher than those in rural water. TN and TP concentrations in urban water are stable throughout the year and peak in December, while those of rural water are highest in March and lowest in November. The method proposed in this study can provide a new idea for improving the retrieval accuracy of water-quality parameters in different water bodies in a large-scale region, and the relevant conclusion can provide a theoretical basis for water pollution control and prevention strategies in agricultural basins.
In recent years, the eutrophication of inland water has become one of the major global environmental issues, mainly due to the combined effects of lake overexploitation, watershed surface pollution, and climate change. The excess amount of nitrogen and phosphorus nutrients in water is the main cause of eutrophication (Sinha et al., 2017; Álvarez et al., 2017; Ortiz-Reyes and Anex, 2018; Liao et al., 2020). As rivers are the main surface-runoff channels linking land and lakes, the high nitrogen and phosphorus concentrations in the rivers entering lakes are significant for lake eutrophication (Wang et al., 2011; Zhang et al., 2015; Li et al., 2016; Wang et al., 2017; He et al., 2020). Chaohu Lake is one of the three lakes with severe eutrophication in China (Yin and Zhang, 2003; Yang et al., 2020), and its water’s quality deterioration has restricted the sustainable development of the region. Therefore, it is necessary to monitor the spatiotemporal variations of nitrogen and phosphorus concentrations in the water around Chaohu Lake to comprehensively investigate the water pollution status of the lake and effectively control it.
Field measurement and remote-sensing retrieval are two primary methods for monitoring water quality parameters in inland water. Field measurement has the high accuracy; however, it requires a large amount of human and material resources, and water-quality parameters can only be monitored at spatially discrete sites. Remote-sensing retrieval establishes the relationship between satellite-based remote-sensing reflectance (Rrs) and water-quality parameters. Real-time dynamic monitoring of water quality can be performed on a macroscopic scale by remote sensing, providing an advanced detection means for earth-resource investigation and environmental-change monitoring. Thus, remote-sensing retrieval has become an important method of monitoring water-quality parameters in large-scale regions (Guo H. et al., 2020; Huangfu et al., 2020; Lu et al., 2021; Qun’ou et al., 2021; Yuan et al., 2020; Zhao et al., 2021).
Currently, the water-quality parameters quantitatively monitored by remote sensing include chlorophyll a, turbidity, suspended solids, and other indicators. Only a few studies have been conducted on the remote-sensing retrieval of the total nitrogen (TN) and total phosphorus (TP) concentrations (Gao et al., 2015; Guo H. et al., 2020; Xiong et al., 2022). It is because TN and TP, as non-optically active substances, do not have notable spectral characteristics (Guo H. et al., 2020; Xiong et al., 2022; Yang et al., 2022). Sentinel-2 Multispectral Imager (MSI) images, with 13 multispectral bands, spatial resolution of up to 10 m, and a revisit period of 5 days (Drusch et al., 2012), can provide a continuous and reliable data source for remote-sensing retrieval of water-quality parameters. This type image is mainly used in the retrieval of optically active substances such as chlorophyll, turbidity, transparency, and fluorescent-dissolved organic matter, but it is rarely used in TN and TP (Gao et al., 2015; Ansper and Alikas, 2018; Peterson et al., 2020; Maciel et al., 2021; Mansaray et al., 2021; Pérez-González et al., 2021; Aptoula and Ariman, 2022; Caballero et al., 2022; Meng et al., 2022). Some studies have shown that TN and TP are significantly correlated with optically active substances (Gao et al., 2015; Sagan et al., 2020; Zhang L. et al., 2021; Xiong et al., 2022), and some studies have also achieved the remote-sensing monitoring of TN and TP of water bodies using Sentinel-2 MSI image (Guo H. et al., 2020; Huangfu et al., 2020).
Various methods, such as empirical, statistical, semi-analytical, and machine learning, have been used to construct the different forms of water-quality parameter-retrieval models (Yuan et al., 2020; Aguilar et al., 2021; Lu et al., 2021; Zhao et al., 2021; Xiong et al., 2022; Yang et al., 2022). Empirical statistical and semi-analytical methods are mostly used to retrieve water-quality parameters by analyzing the optical characteristics of the water and depend on high-precision atmospheric-correction algorithms (Li et al., 2021; Yang et al., 2022). Machine-learning regression algorithms, driven by a large amount of datasets, through multiple training, validation, and fitting to construct complex nonlinear relationships among the variables, have been widely used for remote-sensing monitoring of water quality in recent years (Reichstein et al., 2019). Recent studies also illustrated the advantages of machine-learning algorithms in retrieving water-quality parameters in eutrophic water (Huang et al., 2021; Xiong et al., 2022). Thus, this type algorithm has a strong technical potential for the remote-sensing retrieval of TN and TP concentrations in inland water.
The remote-sensing retrieval models of TN and TP concentrations in the aforementioned studies are primarily applicable to single inland water bodies such as lakes, reservoirs, and certain river sections. Influenced by the surrounding environment, there are spatial differentiations in the water-quality parameters of different water bodies, resulting in the poor applicability of the same retrieval model in large-scale regions. However, there are few studies on the construction of retrieval models for multiple water bodies in the same basin. Land types in the riparian zone are extremely important influential factors in the spatial difference of river water quality (Kandler et al., 2017; Liu et al., 2017). TN and TP in different rivers are present in different forms due to the land composition of the riparian zone (Meneses et al., 2015; Giri and Qiu, 2016; Zhang J. et al., 2020; Zhang Y. et al., 2021; Shu et al., 2022). Related studies confirmed that the composition of TN and TP in the Chaohu Lake Basin differed significantly among the different water bodies (Huang et al., 2013; Zhang et al., 2015; Guo B. et al., 2020; Zhang L. et al., 2021), and the nutrients mainly came from the soil (Yu et al., 2018). Considering the influence of land type on the spatial differentiation of water quality in large-scale regions (Ding et al., 2016; Li et al., 2018; Liu et al., 2021; Wu and Lu, 2021), clustering analysis, a data-driven approach to identify discrete subgroups of the dataset without a priori labeling (Serafin et al., 2019; Dalmaijer et al., 2022), is applied to the geographical division of the water bodies around Chaohu Lake. Then, machine-learning algorithms are adopted in this study to construct the TN and TP concentrations’ retrieval models for different zones. Lastly, the spatiotemporal variations and influencing factors based on TN and TP concentrations retrieved from Sentinel-2 MSI images are analyzed to provide the scientific references for preventing the pollution and eutrophication of Chaohu Lake.
Chaohu Lake is located in the southeast part of Hefei city, the central part of Anhui Province, China (Figure 1). The lake covers an area of ∼770 km2, with a maximum depth of 3.77 m and an average depth of 2.69 m; the average annual air temperature is 16 ± 4°C; and rainfall is higher in the summer and lower in the winter. Thirty-three rivers, including the Hangbu River, Baishitian River, Pai River, Nanfei River, Tongyang River, Zhegao River, and Zhao River, converge into the lake from the south, west, and north and are injected into the Yangtze River via Yuxi River.
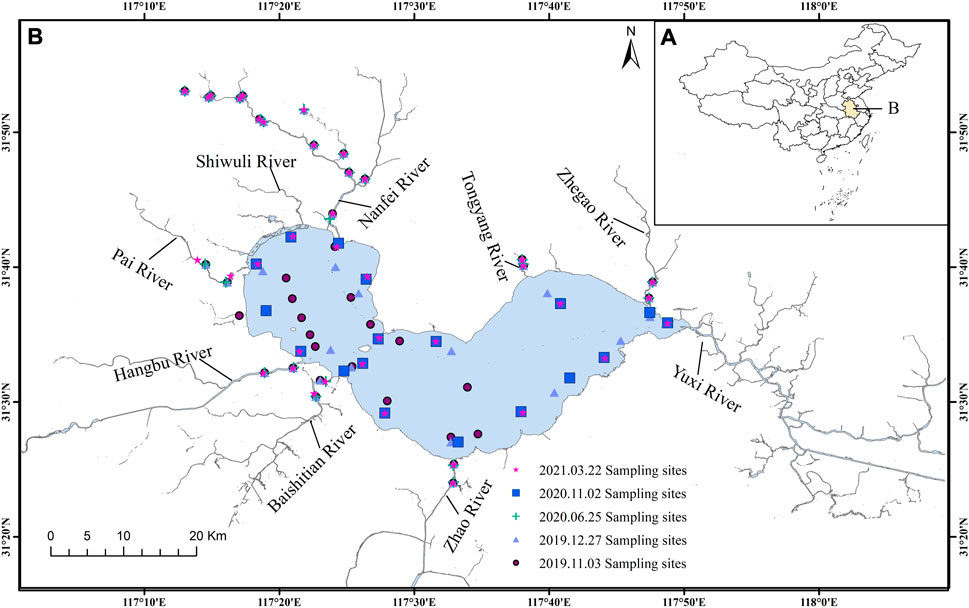
FIGURE 1. Location of Chaohu Lake and distribution of the sampling sites. (A): China Map (B): The location of study area in china.
According to the surface-water environmental quality standard GB3838-2002 of China (Supplementary Table S1), the water quality of Chaohu Lake is at the level of Ⅳ-inferior V. The water in the western lake is more seriously polluted than that in the eastern part (Yang et al., 2020; Zhang M. et al., 2020). Recently, the government has introduced policies to restrict the discharge standards of sewage pollutants in rivers (e.g., Nanfei River), which improved the water quality of the western lake. However, the water quality of the eastern lake has gradually deteriorated and is now stable at Class IV (Yang et al., 2020).
Considering the seasonal differences in the water quality of water bodies around Chaohu Lake, five field surveys were conducted on 3 November 2019, 27 December 2019, 25 June 2020, 2 November 2020, and 25 March 2021, and a total of 156 water samples were collected (Figure 1). According to the water-quality sampling technical regulations (SL187-96) formulated by China, water samples were collected using a small pump at a depth of 50 cm from the water surface, and 1-L water samples were sealed, refrigerated, and sent to an environmental laboratory to measure TN and TP concentrations. Meanwhile, the geographical location of each sample point was recorded using a Trimble GPS receiver (GEOXH 2008).
TN in water has various forms of nitrogenous compounds, including nitrate, nitrite, ammonia, and organic nitrogen (Qun’ou et al., 2021). The basic potassium persulfate UV spectrophotometric method (HJ 636-2012) was used to determine the TN concentrations herein. This study took 20-ml water from a sample and added basic potassium persulfate and potassium persulfate, fixed the volume, and then disintegrated it in an autoclave at 120°C for 30 min. Then, we cooled the sample to 25°C, added hydrochloric acid, fixed the volume, and shook it well for colorimetry. TP in water primarily includes total dissolved phosphorus and particulate phosphorus (Zhang et al., 2015). The TP concentration was measured using the ammonium molybdate spectrophotometric method (GB11893-89): 20-ml water from each sample was taken and added to potassium persulfate, followed by digestion in an autoclave at 120°C for 30 min. After cooling, the pH was adjusted by adding a 2,6-dinitrophenol reagent until the solution became slightly yellow, and the color was fixed by adding a molybdenum antimony anti-reagent.
The 14 scenes of Sentinel-2 Level-1C MSI images used in our study, acquired on the sampling date (Supplementary Table S2), were obtained from the ESA website (https://scihub.copernicus.eu/). This type image contained 13 spectral bands from visible and near-infrared to short-wave infrared, and its spatial resolutions were 10, 20, and 60 m, respectively. After removing the small amounts of thin clouds present in the Sentinel-2 MSI images, the ACOLITE atmospheric correction algorithm (Caballero and Stumpf, 2020; Renosh et al., 2020) was used to radiometrically correct the images, to obtain the band Rrs, and to resample the image resolution to 10 m in this study. The Modified Normalized Difference Water Index (MNDWI), proven to be more suitable for the extraction of water bodies in eutrophic waters due to its ability to easily distinguish shadows (Xu, 2005; Wang, 2017), was calculated (Eq. 1) to extract the water region around Chaohu Lake with a threshold of 0.1. GIS software was used to extract the band Rrs from the Sentinel-2 MSI images according to the sample locations.
where ρ(Green) and ρ(MIR) denote the Rrs in the green and middle-infrared bands, respectively.
The land-use dataset was obtained from the Global 30 m Land Cover Fine Classification System in 2020 (GLC_FCS30-2020), which was obtained from the Earth Big Data Science Project Data Sharing Service System website (https://data.casearth.cn/). The meteorological dataset was obtained from the China Meteorological Data Network website (https://data.cma.cn/).
The study area was divided into two zones according to the land-type proportion of riparian zones by using the hierarchical cluster method. The rivers with a high proportion of agricultural land were divided into Zone A, and those with a high proportion of urban land were divided into Zone B. Sensitive band analysis was carried out based on the band Rrs and the measured TN and TP concentrations, and machine-learning regression methods were used to construct TN and TP retrieval models for zones A and B, respectively. Then, the verification sites were selected based on geographic locations of the sites to verify the accuracy of the constructed retrieval models. Moreover, a comparison with the accuracy of the retrieval model constructed without using geographical divided strategy was also performed. Lastly, the spatiotemporal variations and influencing factors of TN and TP concentrations retrieved from Sentinel-2 MSI images were analyzed (Figure 2).
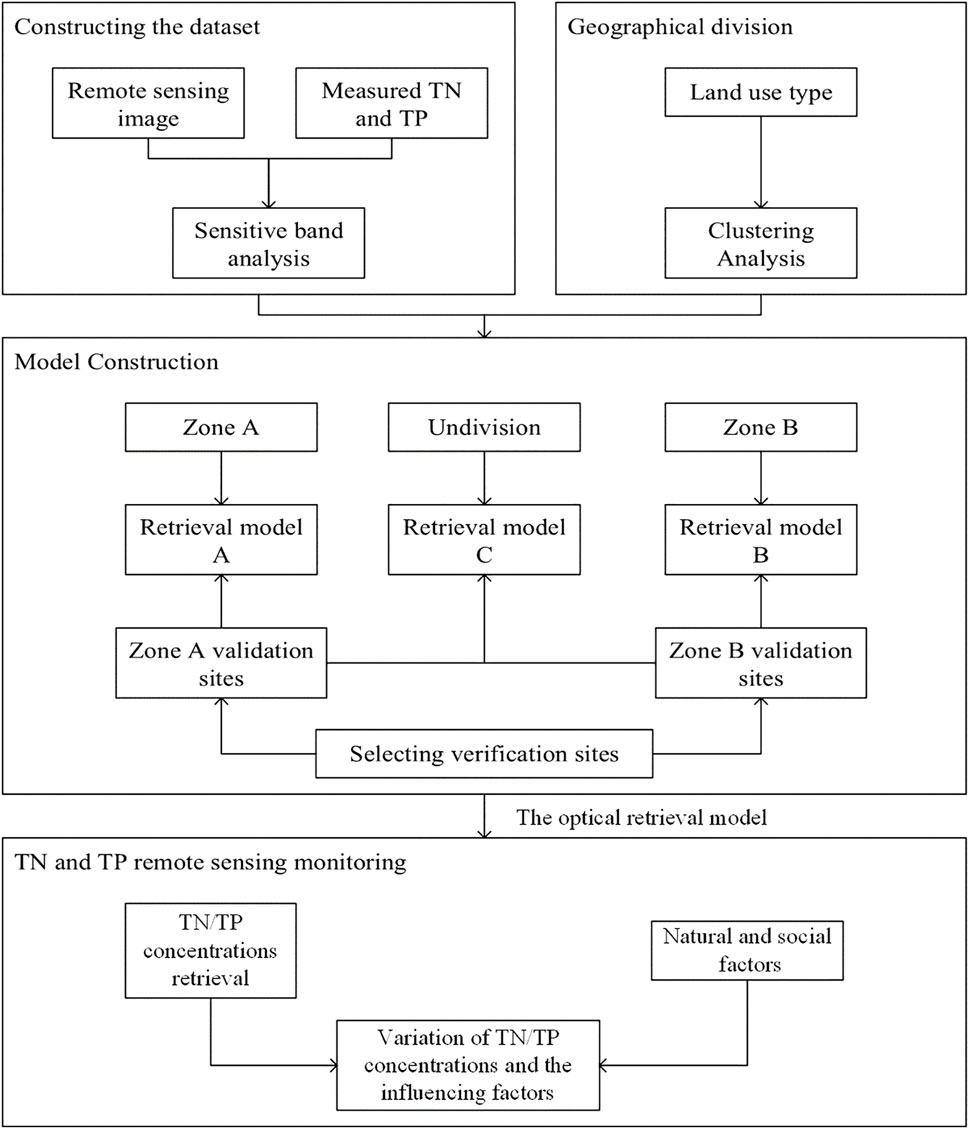
FIGURE 2. Flow chart of remote-sensing monitoring of the TN and TP concentrations.
The previous study in Chaohu Lake Basin has shown that land use in the 1,000-m riparian zone has a significant impact on river water quality (Zhang et al., 2011). Therefore, 1,000 m was taken as a buffer distance of the rivers in this study, and ArcGIS software was used to analyze the buffer zone of the rivers around Chaohu Lake to establish the riparian zone and to measure the proportion of agricultural land, urban land, forest, and grassland in the riparian zone. Then, the hierarchical cluster analysis method in SPSS software was used to geographically divide the water around Chaohu Lake according to the land-type proportion in the riparian zone.
The band Rrs and the measured TN/TP concentrations at all the sampling sites were used as the modeling dataset. Considering the influence of the sampling site geographic locations on the model accuracy evaluation, which was not considered in previous studies (Isenstein and Park, 2014; Li et al., 2017; Mbuh, 2017; Guo H. et al., 2020; Huangfu et al., 2020; Qun’ou et al., 2021; Zhao et al., 2021), the sample sites were divided into the sites of zones A and B according to the hierarchical cluster analysis results to generate the modeling datasets separately.
In this study, the K-nearest neighbor (KNN), linear regression (LR), random forest (RF), gradient-boosting tree (GBT), extra trees regressor (ETR), support-vector regression (SVR), and back-propagation neural network (BPNN) algorithms were used to construct TN and TP concentration retrieval models. KNN was given a training dataset and a new input sample, where the new sample was predicted after finding the K-nearest samples to the instance in the training dataset (Modaresi and Araghinejad, 2014). LR minimized the mean square error (MSE) between the predicted and true values by finding the parameters w (slope) and b (intercept) (Ahmed et al., 2019; Aguilar et al., 2021). RF is a classifier that uses multiple decision trees to train and predict samples (Ahmed et al., 2019; Chen et al., 2020). ETR is similar to RF in that classification is performed by constructing multiple decision trees; however, in constructing the split nodes of each tree, a random portion of features are first collected, and then the best node features are selected for model construction using the information entropy/Gini index (Ahmed et al., 2019). To minimize the MSE, GBT uses a forward stepwise algorithm to determine each decision tree by minimizing the loss function based on the previously calculated model residuals, making the previous residuals decrease in the direction of the gradient, thus gradually improving the model-prediction accuracy. SVR, however, constructs a decision function for LR by mapping nonlinear data to a high-dimensional space through a kernel function, which has its unique advantages in solving nonlinear and high-dimensional pattern-recognition problems in the case of small samples (Modaresi and Araghinejad, 2014; Ahmed et al., 2019). BPNN is a local search optimization method that approximates the minimum error by continuously adjusting the weights of neurons, which is easy to converge to produce local minima, and the approximation and generalization ability of the network is strongly dependent on the training samples (Fei et al., 2020).
Inthe modeling process, Pearson correlation analysis was used to correlate a single band or band combinations of the Rrs with the TN and TP concentrations via the scipy.stats function in the Python library. The bands or band combinations with high correlation were selected as independent variables of retrieval models, and TN and TP concentrations were selected as dependent variables. The modeling dataset was then randomly divided into a training set (about 75%) and a validation set (about 25%) according to the geographic location of the sampling sites, and the TN and TP concentration retrieval models were constructed.
Ensuring that the number of samples for the validation dataset was more than a quarter of the total samples, and that at least one site of each river was used, the accuracy of the retrieval models was evaluated using the determination coefficient (R2), mean square error (MSE), and mean absolute percentage error (MAPE) (Eqs 2–4).
where m is the total number of samples,
In our study, based on the hierarchical cluster analysis results of the land-type proportions in the riparian zones, the water with a low proportion of urban land (<20%), including Baishitian River, Zhao River, Hangbu River, Zhegao River, Tongyang River, Yuxi River, and Chaohu Lake, were taken as rural water (Zone A), and those with a high proportion of urban land (>20%), including Nanfei River, Shiwuli River, Pai River, and Tangxi River, were taken as urban water (Zone B) (Figure 3 and Supplementary Table S3).
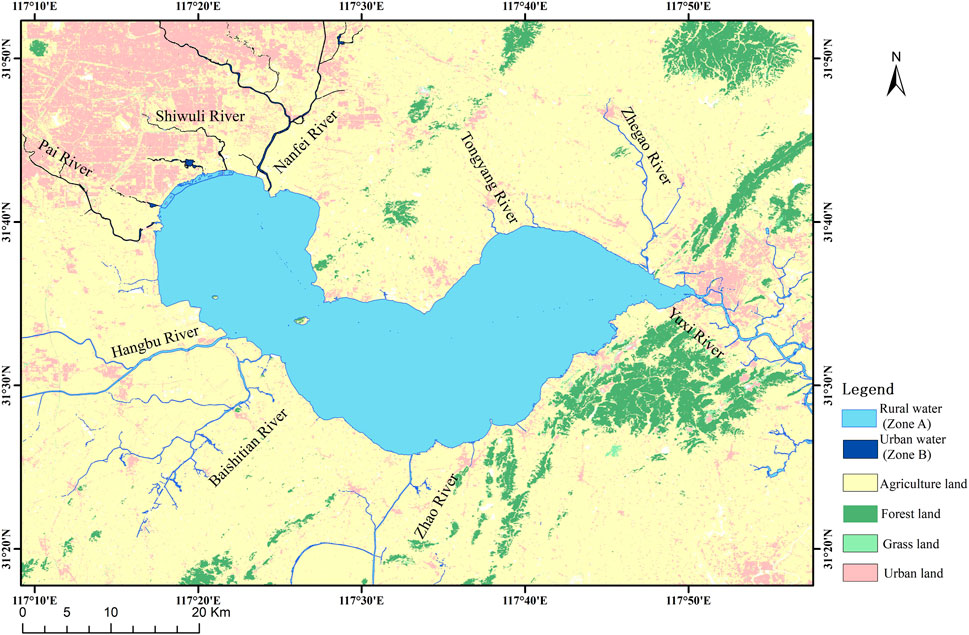
FIGURE 3. Geographical division of the study area according to land-type proportions in the riparian zones.
According to the method in Section 3.2, Pearson correlation analysis of the measured TN/TP concentrations and the band Rrs combinations was performed in our study. To construct the retrieval models of the TN and TP concentrations suitable for the study area, the bands or band combinations with high correlation in Table 1 were selected as input-independent variables in this study, and the retrieval models of the TN and TP concentrations were constructed using machine-learning regression algorithms (such as KNN, LR, RF, GBT, ETR, and SVR), respectively.
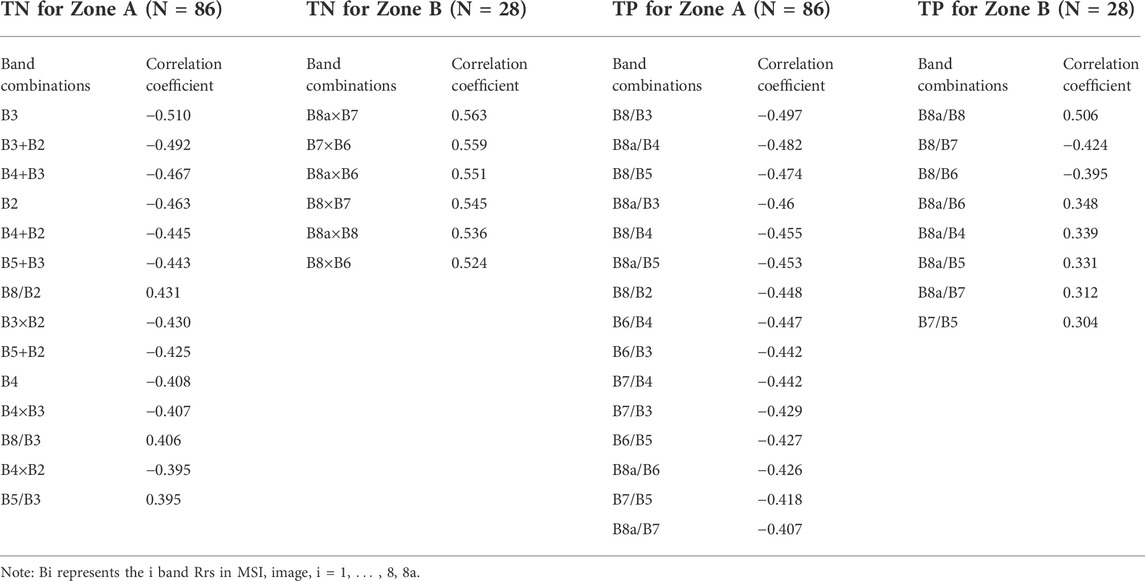
TABLE 1. Band combinations as the input variables for the TN/TP-retrieved models.
After eliminating some samples with abnormal TN and TP concentration values by analyzing box plots, the validation datasets for the zones A and B were selected by using the method in Section 3.2 and the accuracy of the constructed TN and TP concentration retrieval models was evaluated by the three indicators of R2, MSE, and MAPE (Table 2).
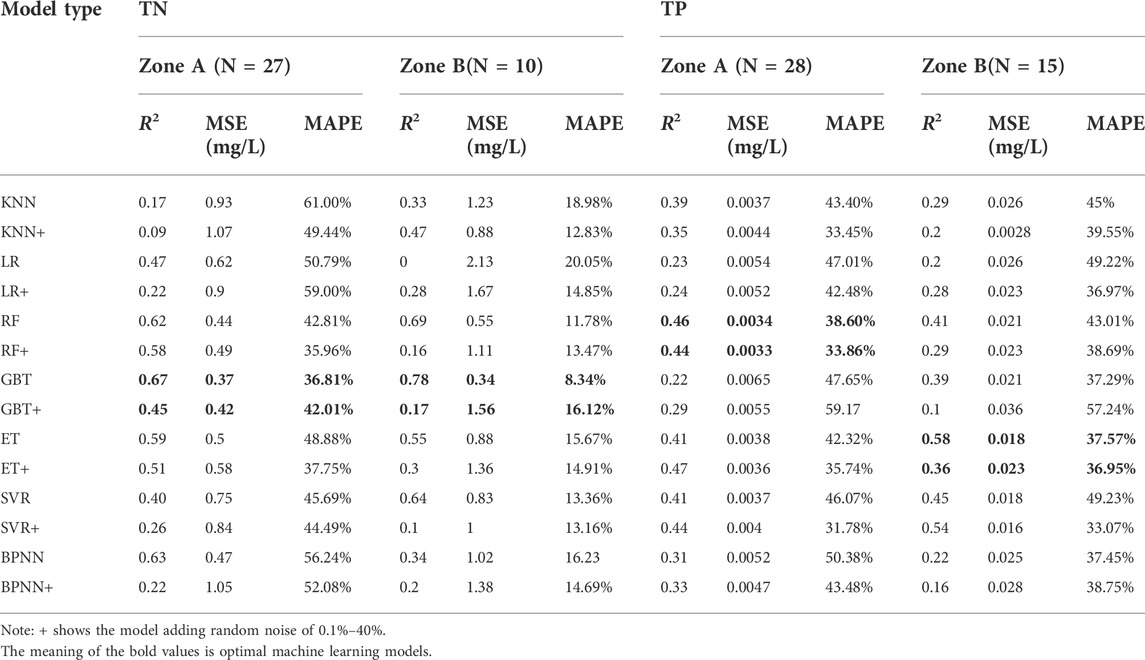
TABLE 2. The accuracy evaluation results for different TN/TP concentration-retrieval models.
As seen in Table 2, the optimal TN concentration retrieval model was both the GBT model in zones A and B. The three accuracy indices of R2, MSE, and MAPE for the two zones were 0.67, 0.37 mg/L, and 36.81% and 0.78, 0.34 mg/L, and 8.34%, respectively (Figures 4A, B).
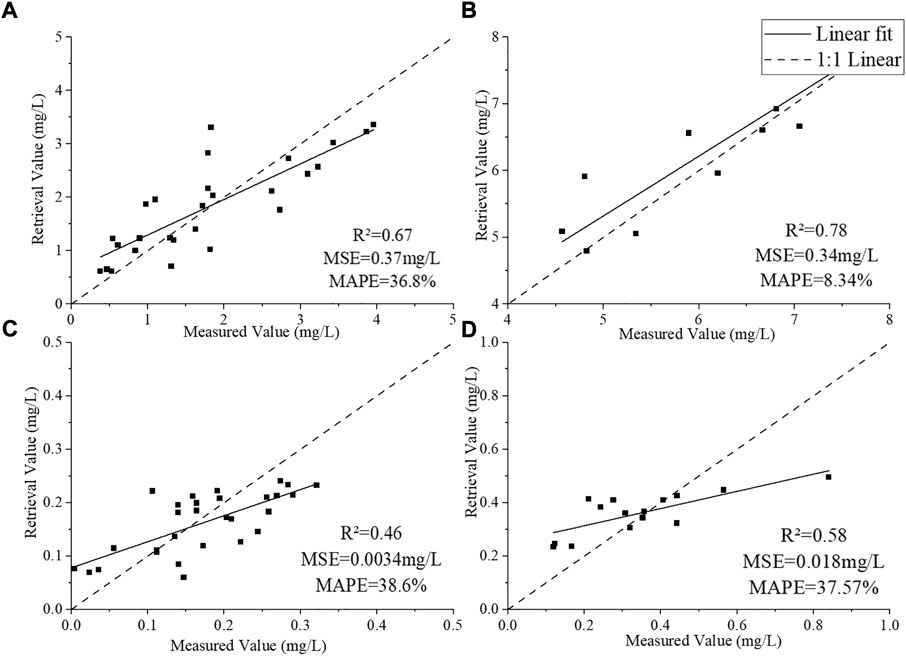
FIGURE 4. Performance evaluation of the optimal TN and TP retrieval models using geographic division strategy. (A) TN retrieval model for Zone A; (B) TN retrieval model for Zone B. (C) TP retrieval model for Zone A; and (D) TP retrieval model for Zone B.
The optimal TP concentration retrieval models for zones A and B were the RF and ET models, respectively. The three indices of R2, MSE, and MAPE for these two zones were 0.46, 0.0034 mg/L, and 38.60% and 0.58, 0.018 mg/L, and 37.57%, respectively (Figures 4C, D). In addition, when the TP concentration retrieval model is estimating the samples with high concentrations (>0.4 mg/L), the convergence effect of machine-learning regression on extreme data leads to an underestimation of its retrieval values. The optimal TP retrieval model was overestimated when estimating the samples with the concentrations between 0.3 and 0.4 mg/L. It is because the corresponding sampling sites are mainly located in the narrow river channels, which are affected by the reflections from the neighboring land (Supplementary Figure S1).
Then, the robustness of the retrieval model was evaluated by using the method mentioned in a water-transparency retrieval study (Cui et al., 2022). The input variables of the model were processed by adding noise of 0.1%–40% to the training set randomly, re-modeled with the train set with noise, and evaluated using the original test set (Table 2). The accuracy of the optimal TN concentration model (GBT) for zones A and B decreased to R2 = 0.45, MSE = 0.42 mg/L, and MAPE = 42.01%, and R2 = 0.17; MSE = 1.56 mg/L, and MAPE = 16.12%, respectively, and those of the optimal TP concentration models for zones A and B (RF, ET) decreased to R2 = 0.44, MSE = 0.0033 mg/L, and MAPE = 33.86%; and R2 = 0.36, MSE = 0.023 mg/L, and MAPE = 36.95%, respectively. Both RF and ET models have better robustness than GBT because they are less prone to overfitting owing to the random sampling of each decision tree during the fitting process, which improves their robustness.
The optimal retrieval models of the TN and TP concentrations constructed previously were applied to Sentinel-2 MSI images acquired in different seasons, and the TN and TP concentration maps of the water around Chaohu Lake were obtained, respectively (Figures 5, 6). The results showed that TN and TP concentrations throughout the study area ranged from 0.67∼10.13 mg/L and 0.0 to 1.08 mg/L, respectively. According to the environmental quality standards for surface water in China (GB3838-2002), the water quality of Nanfei River, Shiwuli River, Pai River, and other rivers was stable as level poor V and fluctuated less with time, while the water quality of Hangbu River, Baishitian River, and Yuxi River fluctuated notably between level Ⅳ and poor V.
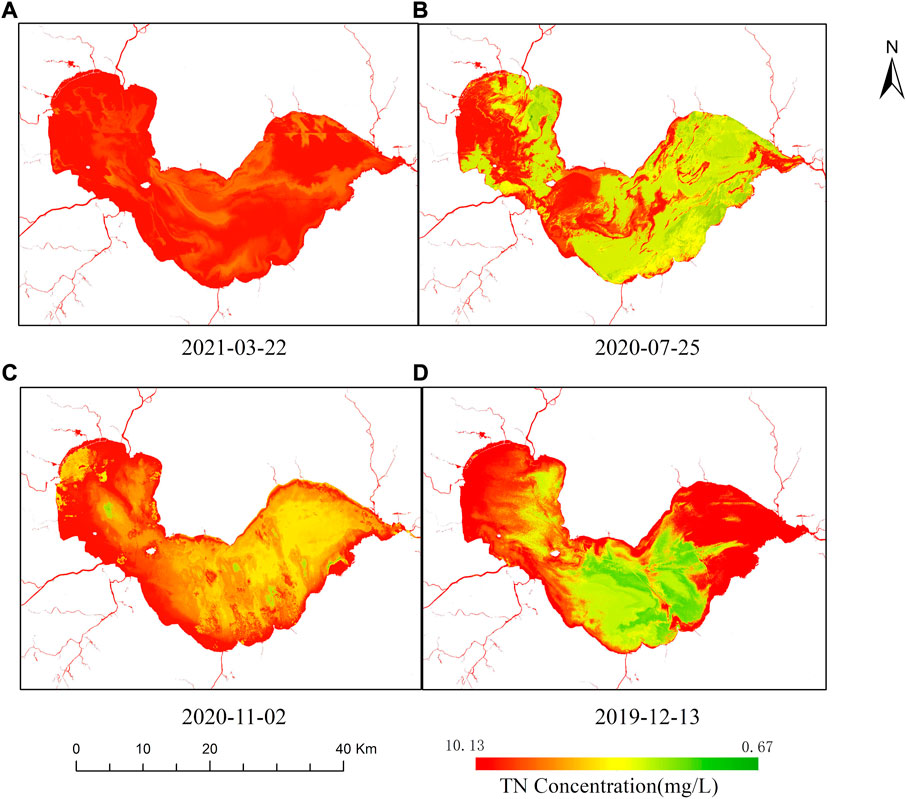
FIGURE 5. Remote-sensing retrieval results of the TN concentrations in the water around Chaohu Lake. (A) Total nitrogen distribution on March 22, 2021 (B) Total nitrogen distribution on July 25, 2020 (C) Total nitrogen distribution on November 2, 2020 (D) Total nitrogen distribution on December 13, 2019.
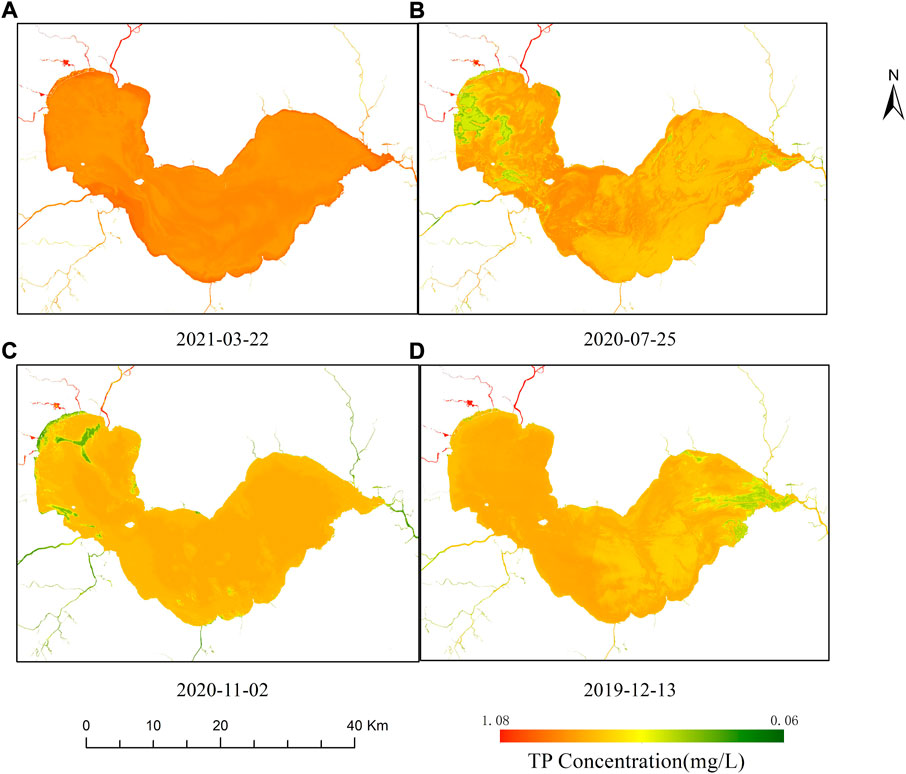
FIGURE 6. Remote-sensing retrieval results of the TP concentrations in the water around Chaohu Lake. (A) Total phosphorus distribution on March 22, 2021 (B) Total phosphorus distribution on July 25, 2020 (C) Total phosphorus distribution on November 2, 2020 (D) Total phosphorus distribution on December 13, 2019.
The TN and TP concentrations in the water surrounding Chaohu Lake were separately calculated in the GIS software and their spatial variation were also analyzed (Figure 7). The spatial variation of the TN concentration is shown as Nanfei River, Shiwuli River, and Pai River > other rivers > the lake. The TN concentrations in all the rivers were higher than those in the lake, and the TN concentration in the western lake was higher than that in the eastern lake, which is consistent with the fact that the western part of Chaohu Lake is more eutrophic than the eastern part (Yang et al., 2020; Zhang M. et al., 2020). The seasonal differences in TN concentrations of Nanfei River, Shiwuli River, and Pai River are not significant, and the TN concentrations of other rivers are higher in December and March than those in July and November.
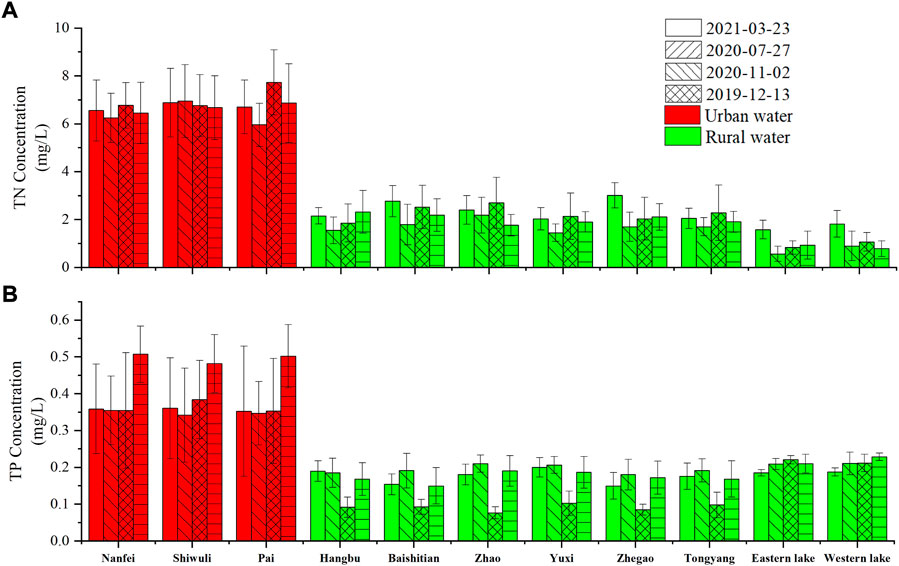
FIGURE 7. Inner-annual variation of the retrieved TN/TP concentration in the water around Chaohu Lake. (A) TN concentration; (B) TP concentration.
The spatial variation of TP concentration showed that Nanfei River, Shiwuli River, and Pai River > the lake > other rivers. TP concentrations in Nanfei River, Shiwulil River, and Pai River were higher in December than those in other months, while the difference among the other seasons was not significant. The lowest TP concentrations in Baishitian River, Zhao River, Yuxi River, and Hangbu River all occurred in November, and the highest concentrations occurred in July, with the same intra-annual variation pattern as in previous years (Yang et al., 2020). The spatial differences in the TP concentration of Chaohu Lake were not significant, showing that the TP concentration in the western lake was slightly higher than that in the eastern part, which is consistent with the development that the water quality in the western lake has slightly improved and that in the eastern part has been gradually deteriorating (Lai and He, 2021). The TP concentration in Chaohu Lake was slightly higher in November and December than in March and July.
The TN/TP concentration retrieval models (RF/BPNN) for small lakes and the TP concentration retrieval model (BPNN) for rivers have been constructed based on Sentinel-2 MSI images (Guo H. et al., 2020; Huangfu et al., 2020), which performed with high accuracy but poor universality. The RF and BPNN algorithms were then applied to our study area, and the retrieval accuracy of TN for zones A and B was found to R2 = 0.62, MSE = 0.44 mg/L, and MAPE = 42.81%; and R2 = 0.69, MSE = 0.55 mg/L, and MAPE = 11.78%, respectively, and that of TP for Zones A and B was R2 = 0.31, MSE = 0.0052 mg/L, and MAPE = 50.38%; and R2 = 0.22, MSE = 0.025 mg/L, MAPE = 37.45%, (Table 2), respectively, which were lower than the accuracy of the optimal retrieval models in our study.
GBT, RF, and ET models in our study are all the decision-tree regression–integration algorithms, which are strong for low-dimensional, nonlinear, and small-sample data processing (Huang et al., 2018), and these three models in the TN/TP concentration retrieval performed better than other machine-learning algorithms. Thus, the retrieval method in our study is also suitable for the inland water with varying water quality conditions for watershed or regional scales. Compared to the study in Taihu Lake of China (Xiong et al., 2022), the accuracy of the TP retrieval model constructed in our study is poor because the model is affected by high spatial heterogeneity of the TP concentration in the study area and the presence of TP mainly in dissolved and particulate states, which is influenced by suspended matter and Chl-a (Zhang et al., 2015). Therefore, the TP concentration retrieval model constructed by the indirect method through suspended matter, Chl-a, etc. was considered in this work.
In addition, the robustness evaluation of the models in Table 2 showed that the retrieval model of TN/TP for Zone B was less robust because of the small modeling sample (N = 28), and the number of modeling samples of the current TN/TP retrieval model based on sentinel-2 MSI images was over 80 (Guo H. et al., 2020; Huangfu et al., 2020). Therefore, the TN/TP concentration retrieval model in our study can be further improved by increasing the number of modeling samples.
To analyze the influence of the geographic division strategy on the retrieval accuracy of the TN and TP concentrations in inland water, the machine-learning methods were used to construct the TN and TP concentration retrieval models when the study area was not divided, and the accuracy of the optimal retrieval model was also evaluated (Figure 8). Then, its accuracy was compared with the optimal model retrieval accuracy using the geographic dividing strategy.
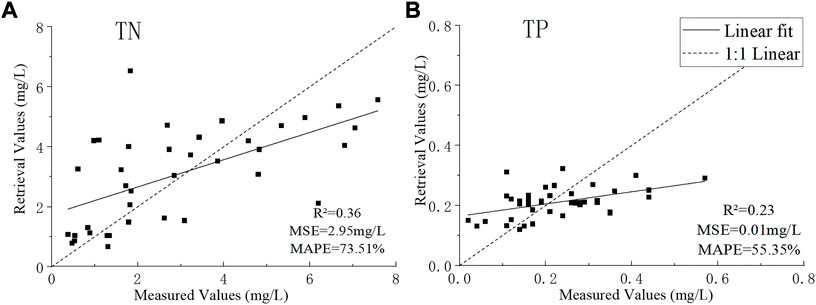
FIGURE 8. Performance evaluation of the optimal TN and TP retrieval models which did not use the geographic division strategy. (A) TN retrieval model; (B) TP retrieval model.
As seen in the two figures (Figures 4, 8), the retrieval accuracy using geographic division for the study area is significantly better than that without dividing, and the slope of its fitted equation is close to 1. The accuracy indices of R2, MSE, and MAPE of the TN concentration retrieval model were increased from 0.36, 2.95 mg/L, and 73.51% to 0.67, 0.37 mg/L, and 36.8% (Zone A) and 0.78, 0.67 mg/L, and 8.34% (Zone B), respectively. Those of the TP concentration retrieval model were improved from 0.23, 0.01 mg/L, and 55.35% to 0.46, 0.0034 mg/L, and 38.6% (Zone A) and 0.58, 0.0018 mg/L, and 37.57% (Zone B), respectively.
The current retrieval models of nitrogen and phosphorus concentrations are mainly constructed directly from remote-sensing images or through media water-quality parameters such as chlorophyll a and suspended solids, and their applicability has been proved, but their models are only applicable to single water bodies (He and Li, 2011; Huang et al., 2021; Isenstein and Park, 2014; Liu et al., 2015; Qun’ou et al., 2021; Wang et al., 2018). It is clear that narrowing the application region of the model when constructing the retrieval model for the total phosphorus concentration in Chaohu Lake can significantly improve the retrieval accuracy (Gao et al., 2015). However, from the perspective of the causes of water-quality deterioration, pollutant discharge, geography, hydrology, and climate are the fundamental causes of water-quality differences (Palviainen et al., 2016; Liu et al., 2017; Shrestha et al., 2018; Wu and Lu, 2021), and related studies have shown that there is a clear correlation between land type in riparian zones and river water quality (Ding et al., 2016; Giri and Qiu, 2016; Shi et al., 2017; Mello et al., 2018). Therefore, this study has constructed the retrieval models of TN and TP concentrations in the rivers around Chaohu Lake based on geographical division by the land-type proportions of river riparian zones and provides a reference for solving the problem of poor applicability of water-quality retrieval model.
The factors influencing TN and TP concentration variations in the water around Chaohu Lake were analyzed by investigating meteorological, statistical yearbook, and land-type datasets in the Chaohu Lake Basin. Figure 7 shows that the intra-annual variability of TN concentration in urban water is not significant, owing to the fact that the nitrogen sources in urban water are mainly discharged from urban industrial wastewater, and the monthly discharge is relatively stable (Xi et al., 2016; Yu et al., 2018). Meanwhile, the short-term intense precipitation caused intra-annual fluctuations of nitrogen concentration in urban water (Baron et al., 2012; Kaushal et al., 2014). TN concentrations in rivers of rural water show higher concentrations in March and November than in July, which is due to agricultural non-point source pollution as the primary source of nitrogen in rural water, and the low precipitation in March and November, so agricultural farming and seasonal precipitation have a combined influence on the intra-annual variation of TN concentrations in rivers of rural water (Yu et al., 2018; Yang et al., 2020). In addition, the western and eastern parts of Chaohu Lake showed the highest concentrations in spring, also due to the dramatic increase in river nitrogen output caused by agricultural activities in the spring, resulting in an increase of the total nitrogen discharged into Chaohu Lake (Wang et al., 2011; Zhang et al., 2015).
Recent studies have shown that phosphorus emissions from livestock surface pollution account for about 40% of phosphorus inputs to the Chaohu Lake Basin (Wu et al., 2020; Zhang M. et al., 2020). Sewage discharge is the main source of phosphorus in urban water (Yang et al., 2020), and the form of phosphorus present is dominated by SRP (soluble reactive phosphorus), which is the main source of phosphorus in Chaohu Lake (Zhang et al., 2015). The slower river flow in winter limits the rate of phosphorus migration, resulting in higher phosphorus concentrations of urban water in December (Xi et al., 2016). Agricultural non-point source pollution is the main source of phosphorus in rural water, mainly in the form of PP (particulate phosphorus) (Zhang et al., 2015), which is influenced by soil erosion. Soil erosion caused by the continuing precipitation is the main reason for the highest TP concentrations in rural water in July (Du et al., 2017).
Then, the optimal retrieval models of the TN/TP concentrations for zones A and B were applied to Zone B and Zone A, respectively, to further demonstrate the effectiveness of the geographic division modeling strategy (Supplementary Figure S2). By analyzing the cross-validation accuracy of the optimal retrieval model in the zones A and B, all the sample locations were basically distributed on a single side of 1:1, and their cross-validation accuracies were very low. The aforementioned results indicate that the retrieval models constructed based on geographic division exhibit high accuracy only in the water with a similar land-type composition for the watersheds, thus demonstrating the effectiveness of geographic division modeling based on land type in riparian zones. The nutrients in the Chaohu Lake Basin mainly come from the soil (Yu et al., 2018), and are highly correlated with the land type in the riparian zone (Lin et al., 2021). Thus, geographic division based on land type can extract data features, reduce discrete differences in the dataset, and improve modeling accuracy (Dalmaijer et al., 2022).
Remote-sensing retrieval models of the TN and TP concentrations in the water around Chaohu Lake were constructed using the geographical division strategy based on the land-type proportions in the riparian zone. The accuracy of the constructed models was evaluated using the validation dataset based on the geographic location of the sample sites. The R2, MSE, and MAPE of the optimal TN concentration retrieval model for rural water and urban water were 0.67, 0.37 mg/L, and 36.81% and 0.78, 0.34 mg/L, and 8.34%, respectively, while those of the TP concentration retrieval model for rural water and urban water reached 0.46, 0.0034 mg/L, and 38.60% and 0.58, 0.018 mg/L, and 37.57%, respectively. Comparing to which does not use the geographic division strategy, the retrieval accuracy of TN and TP concentrations has improved significantly. According to the retrieval results of TN and TP concentrations from Sentinel-2 MSI images, the TN and TP concentrations in urban water are higher than those in rural water. The TN and TP concentrations in urban water are stable throughout the year, peaking in December, while those of rural water are the highest in March and the lowest in November. Sewage discharge and intense rainfall are the main reasons for the variations of the TN and TP concentrations in urban water, while the TN and TP concentrations variations in rural water are affected by agricultural non-point source pollution and seasonal precipitation. Our study can provide new methods for retrieving the water-quality parameters in different water bodies in the large-scale region, and the relevant conclusions will provide the scientific reference for preventing pollution and eutrophication in the water around Chaohu Lake, China.
The raw data supporting the conclusions of this article will be made available by the authors, without undue reservation.
JL: methodology, software, investigation, and validation. JW: conceptualization, software, and data curation. YW: conceptualization and methodology. YC: data curation and methodology. SY: software and investigation.
This research was supported by the National Natural Science Foundation of China (No. 32171573 and No. 41801332), the Natural Science Foundation of Anhui Province (No. 201903a07020014 and No. 2008085ME158), and the Natural science research project of colleges and universities in Anhui Province (No. KJ 2021A0178).
The authors are thankful to the research team comprising Sun Qingye, School of Resources and Environmental Engineering, Anhui University for providing the laboratory measurement of TN and TP concentrations of water samples.
The authors declare that the research was conducted in the absence of any commercial or financial relationships that could be construed as a potential conflict of interest.
All claims expressed in this article are solely those of the authors and do not necessarily represent those of their affiliated organizations, or those of the publisher, the editors, and the reviewers. Any product that may be evaluated in this article, or claim that may be made by its manufacturer, is not guaranteed or endorsed by the publisher.
The Supplementary Material for this article can be found online at: https://www.frontiersin.org/articles/10.3389/fenvs.2022.1014155/full#supplementary-material
Aguilar, A. C., Cerón-Vivas, A., and Altuve, M. (2021). Multivariate prediction of nitrogen concentration in a stream using regression models. Environ. Earth Sci. 80 (9), 363. doi:10.1007/s12665-021-09659-7
Ahmed, U., Mumtaz, R., Anwar, H., Shah, A. A., Irfan, R., and García-Nieto, J. (2019). Efficient water quality prediction using supervised machine learning. Water 11 (11), 2210. doi:10.3390/w11112210
Álvarez, X., Valero, E., Santos, R. M. B., Varandas, S. G. P., Sanches Fernandes, L. F., and Pacheco, F. A. L. (2017). Anthropogenic nutrients and eutrophication in multiple land use watersheds: Best management practices and policies for the protection of water resources. Land Use Policy 69, 1–11. doi:10.1016/j.landusepol.2017.08.028
Ansper, A., and Alikas, K. (2018). Retrieval of chlorophyll a from sentinel-2 MSI data for the European union water framework directive reporting purposes. Remote Sens. 11 (1), 64. doi:10.3390/rs11010064
Aptoula, E., and Ariman, S. (2022). Chlorophyll-a retrieval from sentinel-2 images using convolutional neural network regression. IEEE Geosci. Remote Sens. Lett. 19, 1–5. doi:10.1109/lgrs.2021.3070437
Baron, J. S., Hall, E. K., Nolan, B. T., Finlay, J. C., Bernhardt, E. S., Harrison, J. A., et al. (2012). The interactive effects of excess reactive nitrogen and climate change on aquatic ecosystems and water resources of the United States. Biogeochemistry 114 (1-3), 71–92. doi:10.1007/s10533-012-9788-y
Caballero, I., Roca, M., Santos-Echeandía, J., Bernárdez, P., and Navarro, G. (2022). Use of the sentinel-2 and landsat-8 satellites for water quality monitoring: An early warning tool in the mar menor coastal lagoon. Remote Sens. 14 (12), 2744. doi:10.3390/rs14122744
Caballero, I., and Stumpf, R. P. (2020). Atmospheric correction for satellite-derived bathymetry in the caribbean waters: From a single image to multi-temporal approaches using sentinel-2A/B. Opt. Express 28 (8), 11742–11766. doi:10.1364/OE.390316
Chen, K., Chen, H., Zhou, C., Huang, Y., Qi, X., Shen, R., et al. (2020). Comparative analysis of surface water quality prediction performance and identification of key water parameters using different machine learning models based on big data. Water Res. 171, 115454. doi:10.1016/j.watres.2019.115454
Cui, Y., Yan, Z., Wang, J., Hao, S., and Liu, Y. (2022). Deep learning-based remote sensing estimation of water transparency in shallow lakes by combining Landsat 8 and Sentinel 2 images. Environ. Sci. Pollut. Res. 29 (3), 4401–4413. doi:10.1007/s11356-021-16004-9
Dalmaijer, E. S., Nord, C. L., and Astle, D. E. (2022). Statistical power for cluster analysis. BMC Bioinforma. 23 (1), 205. doi:10.1186/s12859-022-04675-1
Ding, J., Jiang, Y., Liu, Q., Hou, Z., Liao, J., Fu, L., et al. (2016). Influences of the land use pattern on water quality in low-order streams of the dongjiang river basin, China: A multi-scale analysis. Sci. Total Environ. 551-552, 205–216. doi:10.1016/j.scitotenv.2016.01.162
Drusch, M., Del Bello, U., Carlier, S., Colin, O., Fernandez, V., Gascon, F., et al. (2012). Sentinel-2: ESA's optical high-resolution mission for GMES operational services. Remote Sens. Environ. 120, 25–36. doi:10.1016/j.rse.2011.11.026
Du, C., Li, Y., Wang, Q., Liu, G., Zheng, Z., Mu, M., et al. (2017). Tempo-spatial dynamics of water quality and its response to river flow in estuary of Taihu Lake based on GOCI imagery. Environ. Sci. Pollut. Res. 24 (36), 28079–28101. doi:10.1007/s11356-017-0305-7
Fei, J., Wu, Z., Sun, X., Su, D., and Bao, X. (2020). Research on tunnel engineering monitoring technology based on BPNN neural network and MARS machine learning regression algorithm. Neural comput. Appl. 33 (1), 239–255. doi:10.1007/s00521-020-04988-3
Gao, Y., Gao, J., Yin, H., Liu, C., Xia, T., Wang, J., et al. (2015). Remote sensing estimation of the total phosphorus concentration in a large lake using band combinations and regional multivariate statistical modeling techniques. J. Environ. Manage. 151, 33–43. doi:10.1016/j.jenvman.2014.11.036
Giri, S., and Qiu, Z. (2016). Understanding the relationship of land uses and water quality in twenty first century: A review. J. Environ. Manage. 173, 41–48. doi:10.1016/j.jenvman.2016.02.029
Guo, B., Fang, Y., Jin, X., and zhou, Y. (2020). Monitoring the effects of land consolidation on the ecological environmental quality based on remote sensing: A case study of Chaohu lake basin, China. Land Use Policy 95, 104569. doi:10.1016/j.landusepol.2020.104569
Guo, H., Huang, J. J., Chen, B., Guo, X., and Singh, V. P. (2020). A machine learning-based strategy for estimating non-optically active water quality parameters using Sentinel-2 imagery. Int. J. Remote Sens. 42 (5), 1841–1866. doi:10.1080/01431161.2020.1846222
He, J., Wu, X., Zhang, Y., Zheng, B., Meng, D., Zhou, H., et al. (2020). Management of water quality targets based on river-lake water quality response relationships for lake basins - a case study of Dianchi Lake. Environ. Res. 186, 109479. doi:10.1016/j.envres.2020.109479
He, T. D., and Li, J. W. (2011). A method for water quality remote retrieva based on support vector regression with parameters optimized by genetic algorithm. Adv. Mat. Res. 383-390, 3593–3597. doi:10.4028/www.scientific.net/AMR.383-390.3593
Huang, J., Wang, D., Gong, F., Bai, Y., and He, X. (2021). Changes in nutrient concentrations in shenzhen bay detected using landsat imagery between 1988 and 2020. Remote Sens. 13 (17), 3469. doi:10.3390/rs13173469
Huang, J., Zhan, J., Yan, H., Wu, F., and Deng, X. (2013). Evaluation of the impacts of land use on water quality: A case study in the Chaohu lake basin. Sci. World J. 2013, 1–7. doi:10.1155/2013/329187
Huang, Y., Liu, Y., Li, C., and Wang, C. (2018). GBRTVis: Online analysis of gradient boosting regression tree. J. Vis. (Tokyo). 22 (1), 125–140. doi:10.1007/s12650-018-0514-2
Huangfu, K., Li, J., Zhang, X., Zhang, J., Cui, H., and Sun, Q. (2020). Remote estimation of water quality parameters of medium- and small-sized inland rivers using sentinel-2 imagery. Water 12 (11), 3124. doi:10.3390/w12113124
Isenstein, E. M., and Park, M. H. (2014). Assessment of nutrient distributions in Lake Champlain using satellite remote sensing. J. Environ. Sci. 26 (9), 1831–1836. doi:10.1016/j.jes.2014.06.019
Kandler, M., Blechinger, K., Seidler, C., Pavlu, V., Sanda, M., Dostal, T., et al. (2017). Impact of land use on water quality in the upper Nisa catchment in the Czech Republic and in Germany. Sci. Total Environ. 586, 1316–1325. doi:10.1016/j.scitotenv.2016.10.221
Kaushal, S. S., McDowell, W. H., and Wollheim, W. M. (2014). Tracking evolution of urban biogeochemical cycles: Past, present, and future. Biogeochemistry 121 (1), 1–21. doi:10.1007/s10533-014-0014-y
Lai, X., and He, G. (2021). Water quality modelling based on 4-dimensional variational assimilation method in the Nanfei River,Lake Chaohu Basin. J. Lake Sci. 33 (05), 1458–1466. doi:10.18307/2021.0513
Li, K., Chi, G., Wang, L., Xie, Y., Wang, X., and Fan, Z. (2018). Identifying the critical riparian buffer zone with the strongest linkage between landscape characteristics and surface water quality. Ecol. Indic. 93, 741–752. doi:10.1016/j.ecolind.2018.05.030
Li, L., Wang, S., Wang, H., Zhang, X., Jiao, L., Ding, S., et al. (2016). Temporal and spatial variations of phosphorus loading and the forms, compositions and contributions in inlet river of Lake Dianchi. J. Lake Sci. 28 (05), 951–960. doi:10.18307/2016.0504
Li, S., Song, K., Wang, S., Liu, G., Wen, Z., Shang, Y., et al. (2021). Quantification of chlorophyll-a in typical lakes across China using Sentinel-2 MSI imagery with machine learning algorithm. Sci. Total Environ. 778, 146271. doi:10.1016/j.scitotenv.2021.146271
Li, Y., Zhang, Y., Shi, K., Zhu, G., Zhou, Y., Zhang, Y., et al. (2017). Monitoring spatiotemporal variations in nutrients in a large drinking water reservoir and their relationships with hydrological and meteorological conditions based on Landsat 8 imagery. Sci. Total Environ. 599-600 1705, 1717. doi:10.1016/j.scitotenv.2017.05.075
Liao, S., Wu, Y., Wong, S. W., and Shen, L. (2020). Provincial perspective analysis on the coordination between urbanization growth and resource environment carrying capacity (RECC) in China. Sci. Total Environ. 730, 138964. doi:10.1016/j.scitotenv.2020.138964
Lin, C., Xiong, J., Ma, R., and Zhu, C. (2021). Identifying the critical watershed regions creating lake nutrient enrichment (SLRs) based on a watershed-lake integrated perspective – a case study of Chaohu Lake Basin, China. Ecol. Indic. 121, 107037. doi:10.1016/j.ecolind.2020.107037
Liu, J., Xu, J., Zhang, X., Liang, Z., and Rao, K. (2021). Nonlinearity and threshold effects of landscape pattern on water quality in a rapidly urbanized headwater watershed in China. Ecol. Indic. 124, 107389. doi:10.1016/j.ecolind.2021.107389
Liu, J., Zhang, X., Wu, B., Pan, G., Xu, J., and Wu, S. (2017). Spatial scale and seasonal dependence of land use impacts on riverine water quality in the Huai River basin, China. Environ. Sci. Pollut. Res. 24 (26), 20995–21010. doi:10.1007/s11356-017-9733-7
Liu, J., Zhang, Y., Yuan, D., and Song, X. (2015). Empirical estimation of total nitrogen and total phosphorus concentration of urban water bodies in China using high resolution IKONOS multispectral imagery. Water 7 (11), 6551–6573. doi:10.3390/w7116551
Lu, Q., Si, W., Wei, L., Li, Z., Xia, Z., Ye, S., et al. (2021). Retrieval of water quality from UAV-borne hyperspectral imagery: A comparative study of machine learning algorithms. Remote Sens. 13 (19), 3928. doi:10.3390/rs13193928
Maciel, D. A., Barbosa, C. C. F., de Moraes Novo, E. M. L., Flores Júnior, R., and Begliomini, F. N. (2021). Water clarity in Brazilian water assessed using Sentinel-2 and machine learning methods. ISPRS J. Photogrammetry Remote Sens. 182, 134–152. doi:10.1016/j.isprsjprs.2021.10.009
Mansaray, A. S., Dzialowski, A. R., Martin, M. E., Wagner, K. L., Gholizadeh, H., and Stoodley, S. H. (2021). Comparing PlanetScope to landsat-8 and sentinel-2 for sensing water quality in reservoirs in agricultural watersheds. Remote Sens. 13 (9), 1847. doi:10.3390/rs13091847
Mbuh, M. J. (2017). Optimization of airborne real-time cueing hyperspectral enhanced reconnaissance (ARCHER) imagery, in situ data with chemometrics to evaluate nutrients in the Shenandoah river, Virginia. Geocarto Int. 33 (12), 1326–1349. doi:10.1080/10106049.2017.1343395
Mello, K. d., Valente, R. A., Randhir, T. O., dos Santos, A. C. A., and Vettorazzi, C. A. (2018). Effects of land use and land cover on water quality of low-order streams in Southeastern Brazil: Watershed versus riparian zone. Catena 167, 130–138. doi:10.1016/j.catena.2018.04.027
Meneses, B. M., Reis, R., Vale, M. J., and Saraiva, R. (2015). Land use and land cover changes in Zezere watershed (Portugal)--Water quality implications. Sci. Total Environ. 527-528, 439–447. doi:10.1016/j.scitotenv.2015.04.092
Meng, H., Zhang, J., and Zheng, Z. (2022). Retrieving inland reservoir water quality parameters using landsat 8-9 OLI and sentinel-2 MSI sensors with empirical multivariate regression. Int. J. Environ. Res. Public Health 19 (13), 7725. doi:10.3390/ijerph19137725
Modaresi, F., and Araghinejad, S. (2014). A comparative assessment of support vector machines, probabilistic neural networks, and K-nearest neighbor algorithms for water quality classification. Water Resour. manage. 28 (12), 4095–4111. doi:10.1007/s11269-014-0730-z
Ortiz-Reyes, E., and Anex, R. P. (2018). A life cycle impact assessment method for freshwater eutrophication due to the transport of phosphorus from agricultural production. J. Clean. Prod. 177, 474–482. doi:10.1016/j.jclepro.2017.12.255
Palviainen, M., Lauren, A., Launiainen, S., and Piirainen, S. (2016). Predicting the export and concentrations of organic carbon, nitrogen and phosphorus in boreal lakes by catchment characteristics and land use: A practical approach. Ambio 45 (8), 933–945. doi:10.1007/s13280-016-0789-2
Pérez-González, R., Sòria-Perpinyà, X., Soria, J. M., Delegido, J., Urrego, P., Sendra, M. D., et al. (2021). Phycocyanin monitoring in some Spanish water bodies with sentinel-2 imagery. Water 13 (20), 2866. doi:10.3390/w13202866
Peterson, K. T., Sagan, V., and Sloan, J. J. (2020). Deep learning-based water quality estimation and anomaly detection using Landsat-8/Sentinel-2 virtual constellation and cloud computing. GIScience Remote Sens. 57 (4), 510–525. doi:10.1080/15481603.2020.1738061
Qun'ou, J., Lidan, X., Siyang, S., Meilin, W., and Huijie, X. (2021). Retrieval model for total nitrogen concentration based on UAV hyper spectral remote sensing data and machine learning algorithms – a case study in the Miyun Reservoir, China. Ecol. Indic. 124, 107356. doi:10.1016/j.ecolind.2021.107356
Reichstein, M., Camps-Valls, G., Stevens, B., Jung, M., Denzler, J., Carvalhais, N., et al. (2019). Deep learning and process understanding for data-driven Earth system science. Nature 566 (7743), 195–204. doi:10.1038/s41586-019-0912-1
Renosh, P. R., Doxaran, D., Keukelaere, L. D., and Gossn, J. I. (2020). Evaluation of atmospheric correction algorithms for sentinel-2-MSI and sentinel-3-OLCI in highly turbid estuarine waters. Remote Sens. 12 (8), 1285. doi:10.3390/rs12081285
Sagan, V., Peterson, K. T., Maimaitijiang, M., Sidike, P., Sloan, J., Greeling, B. A., et al. (2020). Monitoring inland water quality using remote sensing: Potential and limitations of spectral indices, bio-optical simulations, machine learning, and cloud computing. Earth-Science Rev. 205, 103187. doi:10.1016/j.earscirev.2020.103187
Serafin, S., Strauss, L., and Dorninger, M. (2019). Ensemble reduction using cluster analysis. Q. J. R. Meteorol. Soc. 145 (719), 659–674. doi:10.1002/qj.3458
Shi, P., Zhang, Y., Li, Z., Li, P., and Xu, G. (2017). Influence of land use and land cover patterns on seasonal water quality at multi-spatial scales. Catena 151, 182–190. doi:10.1016/j.catena.2016.12.017
Shrestha, S., Bhatta, B., Shrestha, M., and Shrestha, P. K. (2018). Integrated assessment of the climate and landuse change impact on hydrology and water quality in the Songkhram River Basin, Thailand. Sci. Total Environ. 643, 1610–1622. doi:10.1016/j.scitotenv.2018.06.306
Shu, X., Wang, W., Zhu, M., Xu, J., Tan, X., and Zhang, Q. (2022). Impacts of land use and landscape pattern on water quality at multiple spatial scales in a subtropical large river. Ecohydrology 15 (3), e2398. doi:10.1002/eco.2398
Sinha, E., Michalak, A. M., and Balaji, V. (2017). Eutrophication will increase during the 21st century as a result of precipitation changes. Science 357, 405–408. doi:10.1126/science.aan2409
Wang, D., Cui, Q., Gong, F., Wang, L., He, X., and Bai, Y. (2018). Satellite retrieval of surface water nutrients in the coastal regions of the east China sea. Remote Sens. 10 (12), 1896. doi:10.3390/rs10121896
Wang, J., Zhao, Q., Pang, Y., and Hu, K. (2017). Research on nutrient pollution load in Lake Taihu, China. Environ. Sci. Pollut. Res. 24 (21), 17829–17838. doi:10.1007/s11356-017-9384-8
Wang, L. (2017). Comparative study on the water index of MNDWI and NDWI for water boundary extraction in eutrophic lakes. Adv. Geosciences 07 (06), 732–738. doi:10.12677/ag.2017.76074
Wang, S., Jiang, X., and Jin, X. (2011). Classification and pollution characteristic analysis for inflow rivers of Chaohu lake. Environ. Sci. 32 (10), 2834–2839. doi:10.13227/j.hjkx.2011.10.024
Wu, H., Yang, T., Liu, X., Li, H., Gao, L., Yang, J., et al. (2020). Towards an integrated nutrient management in crop species to improve nitrogen and phosphorus use efficiencies of Chaohu Watershed. J. Clean. Prod. 272, 122765. doi:10.1016/j.jclepro.2020.122765
Wu, J., and Lu, J. (2021). Spatial scale effects of landscape metrics on stream water quality and their seasonal changes. Water Res. 191, 116811. doi:10.1016/j.watres.2021.116811
Xi, S., Zhou, C., Liu, G., Wu, L., and Wang, P. (2016). Spatial and temporal distributions of nitrogen and phosphate in the Chaohu lake. Environ. Sci. 37 (02), 542–547. doi:10.13227/j.hjkx.2016.02.019
Xiong, J., Lin, C., Cao, Z., Hu, M., Xue, K., Chen, X., et al. (2022). Development of remote sensing algorithm for total phosphorus concentration in eutrophic lakes: Conventional or machine learning? Water Res. 215, 118213. doi:10.1016/j.watres.2022.118213
Xu, H. (2005). A study on information extraction of water body with the modified normalized difference water index (MNDWI). J. Remote Sens. 9, 1007–4619. doi:10.11834/jrs.20050586
Yang, H., Kong, J., Hu, H., Du, Y., Gao, M., and Chen, F. (2022). A review of remote sensing for water quality retrieval: Progress and challenges. Remote Sens. 14 (8), 1770. doi:10.3390/rs14081770
Yang, X., Cui, H., Liu, X., Wu, Q., and Zhang, H. (2020). Water pollution characteristics and analysis of Chaohu Lake basin by using different assessment methods. Environ. Sci. Pollut. Res. 27 (15), 18168–18181. doi:10.1007/s11356-020-08189-2
Yin, F., Zhang, Z., and Lina, J. (2003). The studies on the bioavailability of heavy metals in the sediments of lake donghu, wuhan. J. Lake Sci. 15 (04), 319–325. doi:10.18307/2003.0414
Yu, Q., Wang, F., Li, X., Yan, W., Li, Y., and Lv, S. (2018). Tracking nitrate sources in the Chaohu Lake, China, using the nitrogen and oxygen isotopic approach. Environ. Sci. Pollut. Res. 25 (20), 19518–19529. doi:10.1007/s11356-018-2178-9
Yuan, Q., Shen, H., Li, T., Li, Z., Li, S., Jiang, Y., et al. (2020). Deep learning in environmental remote sensing: Achievements and challenges. Remote Sens. Environ. 241, 111716. doi:10.1016/j.rse.2020.111716
Zhang, J., Li, S., and Jiang, C. (2020). Effects of land use on water quality in a river basin (daning) of the three gorges reservoir area, China: Watershed versus riparian zone. Ecol. Indic. 113, 106226. doi:10.1016/j.ecolind.2020.106226
Zhang, L., Fang, Y., Cai, H., and Zhang, S. (2021). Spatio‐temporal heterogeneities in water quality and their potential drivers in Lake Chaohu (China) from 2001 to 2017. Ecohydrology 14 (7), e2333. doi:10.1002/eco.2333
Zhang, L., Shao, S., Liu, C., Xu, T., and Fan, C. (2015). Forms of nutrients in rivers flowing into lake chaohu: A comparison between urban and rural rivers. Water 7 (12), 4523–4536. doi:10.3390/w7084523
Zhang, M., Shi, X., Yang, Z., and Chen, k. (2020). The variation of water quality from 2012 to 2018 in Lake Chaohu and the mitigating strate- gy on cyanobacterial blooms. J. Lake Sci. 32 (01), 11–20. doi:10.18307/2020.0102
Zhang, Y.-J., Chen, S., and Jing-chang, X. (2011). Correlation between the water quality and land use composition in the river side area ———a case of Chaohu lake basin in China. Resour. Environ. Yangtze Basin 20 (09), 1054–1061.
Zhang, Y., Finn, D., Bhattacharyya, R., Dennis, P. G., Doolette, A. L., Smernik, R. J., et al. (2021). Long-term changes in land use influence phosphorus concentrations, speciation, and cycling within subtropical soils. Geoderma 393, 115010. doi:10.1016/j.geoderma.2021.115010
Keywords: geographical division, remote sensing retrieval, total nitrogen, total phosphorus, inland water
Citation: Li J, Wang J, Wu Y, Cui Y and Yan S (2022) Remote sensing monitoring of total nitrogen and total phosphorus concentrations in the water around Chaohu Lake based on geographical division. Front. Environ. Sci. 10:1014155. doi: 10.3389/fenvs.2022.1014155
Received: 08 August 2022; Accepted: 12 October 2022;
Published: 28 October 2022.
Edited by:
Kaishan Song, Northeast Institute of Geography and Agroecology (CAS), ChinaReviewed by:
Zhigang Cao, Nanjing Institute of Geography and Limnology (CAS), ChinaCopyright © 2022 Li, Wang, Wu, Cui and Yan. This is an open-access article distributed under the terms of the Creative Commons Attribution License (CC BY). The use, distribution or reproduction in other forums is permitted, provided the original author(s) and the copyright owner(s) are credited and that the original publication in this journal is cited, in accordance with accepted academic practice. No use, distribution or reproduction is permitted which does not comply with these terms.
*Correspondence: Jie Wang, d2FuZ2ppZUBhaHUuZWR1LmNu
Disclaimer: All claims expressed in this article are solely those of the authors and do not necessarily represent those of their affiliated organizations, or those of the publisher, the editors and the reviewers. Any product that may be evaluated in this article or claim that may be made by its manufacturer is not guaranteed or endorsed by the publisher.
Research integrity at Frontiers
Learn more about the work of our research integrity team to safeguard the quality of each article we publish.