 Xiang Wang1
 Yaqi Mao
- 1Department of Civil Engineering, Zhengzhou University of Aeronautics, Zhengzhou, China
- 2Department of Civil Engineering, Henan University of Technology, Zhengzhou, China
The emission peak and carbon neutrality targets pose a great challenge to carbon emission reduction in the coal industry, and the coal industry will face an all-around deep adjustment. The forecast of coal price is crucial for reducing carbon emissions in the coal industry in an orderly manner under the premise of ensuring national energy security. The volatility and instability of coal prices are a result of multiple influencing factors, making it very difficult to make accurate predictions of coal price changes. We propose in this paper an innovative hybrid forecasting method (CEEMDAN-GWO-CatBoost) for forecasting coal price indexes by combining machine learning models, feature selections, data decomposition, and model interpretation. By combining high forecasting accuracy with good interpretability, this method fills a gap in the field of coal price forecasting. Initially, we examine the factors that influence coal prices from five angles: Supply, demand, macroeconomic factors, freight costs, and substitutes; and we employ Spearman correlation analysis to reduce the complexity of the attribute set and devise a coal price forecasting index system. Secondly, the CEEMDAN method is used to decompose the raw coal price index data into seven intrinsic modal functions and one residual term in order to weaken the volatility of the data caused by complex factors. Next, the CatBoost model hyperparameters are optimized using the Grey Wolf Optimizer algorithm, while the coal price data is fed into the combined forecasting model. Lastly, the SHAP interpretation method is introduced for studying the important indicators affecting coal prices. The experimental results show that the combined CEEMDAN-GWO-CatBoost forecasting model proposed in this paper has significantly better forecasting performance than other comparative models, and the SHAP method employed in this study identifies the macroeconomic environment, freight costs, and coal import volume as significant factors affecting coal prices. As part of the contribution of this paper, specific recommendations are made to the government regarding the formulation of a regulatory policy for the coal industry in the context of carbon neutrality based on the findings of this research.
Introduction
The world is confronted with a slew of environmental issues, one of which is attenuating the detrimental impacts of carbon dioxide (CO2) emission-induced climate change (Doğan et al., 2021; Murshed et al., 2022; Talbi et al., 2022). As the largest developing country in the world, China proposed in September 2020 a low-carbon development goal to “achieve peak carbon dioxide by 2030 and carbon neutrality by 2060”, and General Secretary Xi Jinping, of the CPC Central Committee, has repeatedly stressed the necessity of implementing this goal at international and domestic meetings. Yet, in terms of the overall level of emissions, China is still experiencing “high total and high incremental” carbon emissions, of which more than 85% are the result of energy-related activities (Lin et al., 2022). In China, coal-based fossil fuel energy is the largest source of carbon emissions, and carbon reduction in the coal industry is the main focus of its carbon neutral efforts (Bouckaert et al., 2021). It is necessary to change the current energy consumption structure in order to mitigate environmental degradation. However, numerous studies have confirmed the existence of numerous strong links between economic complexity, energy consumption and carbon emissions (Dogan et al., 2020; Doğan et al., 2020; Shahzad et al., 2020; Shahzad et al., 2021; Doğan et al., 2022a; Doğan et al., 2022b; Doğan et al., 2022c; Khalfaoui et al., 2022; Lv et al., 2022; Reddy Paramati et al., 2022; Shahzad et al., 2022). The inseparability of economic development from energy consumption, and the widespread use of energy and its fundamental support for society and the economy determine the complexity of the transition to a new energy system. Without an appropriate relationship between short- and medium-term stable economic growth and a low-carbon transition, it will not only be difficult to achieve the anticipated emission reduction effects, but also may pose hidden risks to energy security and economic growth (Mo et al., 2021). The coal industry faces the dual challenge of ensuring reliable energy supply and achieving carbon neutrality (Wei et al., 2020). Recently, China’s coal prices have fluctuated significantly and triggered a series of chain reactions, causing a large impact on China’s energy security and national economic and social development. In the “double carbon” goal, due to energy restructuring and industrial transformation and upgrading is a non-linear multi-oscillation process, coal prices will change significantly is a norm. An accurate scientific prediction of coal prices will allow coal enterprises to adapt their business strategies, government agencies to develop price control measures, and individual investors to make timely investment decisions. Therefore, establishing an effective coal price forecasting model is crucial both to the smooth implementation of the current Chinese coal revolution strategy and to maintaining the smooth operation of the macroeconomic system. This is also one of the important ways of strengthening the energy market governance and reducing energy price risks.
Many domestic and foreign scholars have conducted extensive research on coal prices from various perspectives. By examining and analysing the existing literature, it has been found that coal price research can generally be divided into two categories: analysis of coal price influencing factors and coal price forecasting. In exploring the factors that influence coal prices, Lin et al. (2007) examined the factors underlying the fluctuations in coal prices from the perspective of market supply and demand equilibrium. Yuan et al. (2010) conducted an empirical study on the factors affecting coal prices using cointegration analysis with VEC models. Wang et al. (2013) demonstrate asymmetry between factors affecting coal demand and coal supply in China, and coal demand from key coal-consuming industries has a significant impact on the domestic coal price. The effect of the power sector on coal prices has been highlighted by Wang et al. (2021a). He et al. (2013) analysed the correlation between Chinese and international energy prices and observed that Australian coal prices are strongly correlated with Chinese coal prices. Li et al. (2019) examined the interaction between the Chinese coal market and the crude oil and international coal markets Hasan and Ratti (2015) analysed the effect of oil prices on stock returns in the coal industry and concluded that there is a negative correlation between them Zamani (2016) confirmed that oil supply and demand have an effect on coal prices.
Among the existing methods for coal price simulation forecasting, there are both econometric and machine learning methods. Time series data are used in econometrics for forecasting. For example, Zhang and Ma (2011) extracted the principal components of the coal price index for the past 20 days to construct a least square forecasting model in order to achieve autoregressive forecasting of coal prices. Zhao et al. (2016) used multiple fractal detrended volatility analysis to study the volatility of power coal prices and proposed quarterly volatility indices for predicting coal prices. Jiang et al. (2018) built an ARIMA model to estimate coal prices in China for 2016–2030. Although the econometric approach is capable of capturing the time series information on coal prices, it only uses historical data of the target quantity to fit a target value, ignoring the inter-coupling effects of other influencing factors on coal prices (Ho et al., 2002). With the development of computer science and artificial intelligence techniques, machine learning methods have become widely used for predicting energy consumption in recent years (Herrera et al., 2019; Ding et al., 2022; Meng et al., 2022). Coal prices are affected by a number of factors, including domestic and international macroeconomic developments, the level of development of coal downstream industries, thermal power generation, coal alternative energy prices, coal futures market quotes, environmental protection policies, and national politics and diplomacy. In comparison to econometric methods, the emergence of artificial intelligence provides new ideas for modeling multivariate nonlinear time series forecasting problems. Machine learning methods make use of training data to better model the nonlinear mapping relationship between coal prices and their influencing factors, which can improve the accuracy of forecasting results when predicting future price trends (Yan and Aasma, 2020). Fan et al. (2016) used a multilayer perceptron network (MLP) to predict coal prices in Qinhuangdao, and the experimental results showed that the neural network algorithm prediction was more accurate than the ARIMA model. Alameer et al. (2020) suggested a model that uses a LSTM-DNN to predict monthly fluctuations in the price of Australian power coal. Ding et al. (2021) established a hybrid data sampling (C-MIDAS) combined with XGBoost model to achieve probability density prediction of the FOB price of Qinhuangdao power coal. Zhang et al. (2022) presented a hybrid VMD-A-LSTM-SVR forecasting model and demonstrated this model’s effectiveness using three typical coal price datasets. Machine learning models can achieve high prediction accuracy due to the rapid development of artificial intelligence and there is an increasing demand for interpretable machine learning so that the reasons why the models make decisions can be reliably explained (Miller, 2019). While the learning performance and prediction accuracy of the above coal price machine learning forecasting model has been greatly improved, the interpretability of the model in the forecasting process has been overlooked.
Furthermore, coal prices are typically non-linear and non-smooth time series data, and because they are affected by multiple factors, directly using the collected coal price data for forecasting will have poor forecasting accuracy, which requires the use of appropriate data pre-processing techniques to reduce noise in the collected coal prices. In the field of forecasting, some scholars have discovered information-rich and valuable subseries by decomposing the original time series signal into sub signals (Bedi and Toshniwal, 2020). Representative methods are such as Variational Mode Decomposition (VMD) (Niu et al., 2018), Wavelet Transform (WT) (Liu et al., 2018), and Empirical Mode Decomposition (EMD) (Zhang et al., 2016). In particular, the EMD method is able to decompose data into multiple Intrinsic Mode Functions (IMFs) at varying frequencies based on the data’s characteristics, which has better decomposition properties for nonlinear and nonsmooth data and can extract features from the data at different frequency scales (Huang et al., 1998). Nevertheless, EMD is susceptible to the phenomenon of modal mixing during decomposition, which in turn affects the decomposition effect. In order to address these issues, Wu and Huang (2009) proposed an integrated Empirical Mode Decomposition (EEMD) method that can effectively resolve the modal mixing phenomenon by introducing Gaussian white noise to the original signal. However, there remains residual Gaussian white noise in the eigenfunction components decomposed by the EEMD method, which causes errors in the reconstruction. Based on this, Torres proposed the CEEMDAN (Torres m e Colominas-, 2011) method to improve EEMD. CEEMDAN adds adaptive white noise at each stage, which can effectively overcome the large reconstruction error problem associated with the EEMD method. Based on this advantage of the CEEMDAN decomposition method, the method has been used in forecasting problems in several fields (Zhang et al., 2017; Cao et al., 2019; Wang et al., 2021b), however, the current energy forecasting problem has not yet been studied by combining the method with coal price forecasting.
Overall, the existing literature has examined the coal price issue from various perspectives, but there are still some shortcomings. Firstly, there are many studies on the factors which influence coal prices, but most of them focus exclusively on a local level and fail to compare and analyse the factors which influence coal prices in China in a comprehensive manner along with their degree of influence. Secondly, most econometric models for coal price forecasting are only linear fitting forecasts of historical data, and the method ignores the nonlinear coupling between multidimensional effective features. Finally, the prediction research of existing coal price machine learning methods primarily uses deep learning models, despite greatly improving prediction accuracy. It, however, does not take into account the deeper information present in the time series data, nor does it decompose coal price data prior to prediction, and the model prediction is poorly interpretable after completion, making it easy to create a “black box”. The purpose of this paper is to address the above deficiencies by making the following contributions to the coal price forecasting problem.
(1) Five indicators are considered to influence coal price factors: supply, demand, macroeconomics, freight costs, and substitutes, and the indicators with high correlations with coal prices are selected as the final variables by Spearman’s correlation analysis.
(2) A hybrid CEEMDAN-GWO-CatBoost prediction model was developed. To begin with, the coal price data is decomposed by using the CEEMDAN method; then, the finalized forecast indicators and the decomposed data are input into the CatBoost model, and then the model hyperparameters are optimized by using the GWO algorithm in order to increase the forecasting ability of the combined model; and finally, the SHAP interpretation method is used to determine the important factors affecting coal prices after the forecasting has been completed.
The remainder of the paper is structured as follows: the second part provides an overview of the CEEMDAN method, the Gray Wolf optimization algorithm, and the CatBoost model, followed by a description of the implementation steps of the combined model presented here and the SHAP interpretation process; the third section presents the predictive index system and data used in this study; in the fourth part, experimental analysis of coal prices is presented and discussed; the fifth section summarizes the conclusions of this paper, then proposes some policy recommendations based on the findings, and finally discusses the shortcomings of this paper and the next steps of the research.
Methodology
CEEMDAN
A key idea behind the EMD algorithm is to convert the nonlinear waveform signal into a series of single-frequency component signals and residual signals. However, during the decomposition process, the local poles will jump multiple times thereby resulting in the modal presentation of the mixing problem. Ensemble empirical modal decomposition (EEMD) is an improved type of EMD that can suppress modal aliasing to some extent by introducing auxiliary white noise. Nevertheless, the IMF components decomposed by EEMD have noise residue, which reduces decomposition efficiency and results in large reconstruction errors. CEEMDAN solves the issues of modal mixing and residual noise that arise in EEMD and CEEMD algorithms from two perspectives. The Gaussian white noise is first added to the noisy IMF component that has been processed by the EMD algorithm in order to reduce the effects of residual noise that tend to appear in the vibration signal when added directly. CEEMDAN abandons the averaging of the overall IMF components after the EMD decomposition, but computes the overall averaging of the first order IMF components until the final 1st order components are obtained, and repeats this operation for the residual parts, which effectively addresses the problem of noise transfer from high to low frequencies and improves the completeness of the decomposition process. The steps involved in decomposing CEEMDAN are as follows.
Step1. Add
Step2. The EMD decomposition algorithm is used to decompose the signal
To obtain the residual component,
Step3. Continue to add
Then the EMD decomposition of
It is possible to express the residual component as follows:
Step4. Repeat Step1-Step3 until the signal can no longer be decomposed, i.e., the signal is monotonic, thus obtaining
Grey wolf optimizer
By simulating the predatory behaviour of grey wolf packs, Mirjalili and Lewis (2014) proposed a pack intelligence optimization algorithm, the Grey Wolf Optimizer (GWO), in 2014. The GWO optimization process is carried out by the
To begin, we can describe mathematically the process by which a wolf pack searches for and slowly surrounds its prey.
Here,
Secondly, the position of the three optimal wolves α, β, and δ are constantly updated to determine the prey. The following is a mathematical description of the hunting process of a wolf pack.
Here,
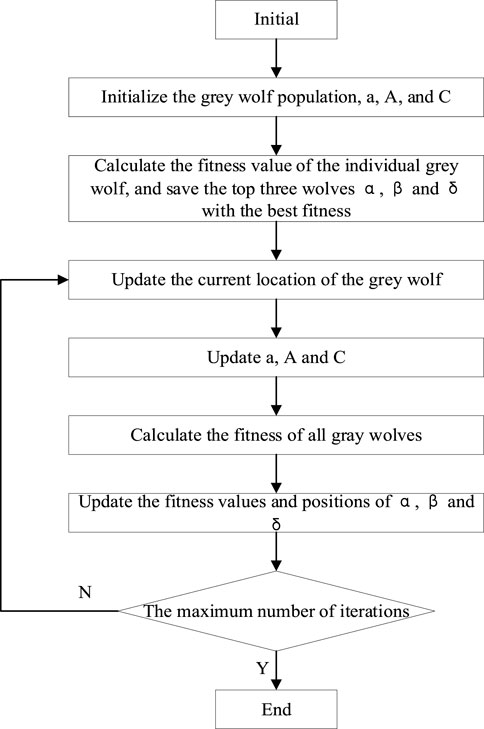
FIGURE 1. Flow chart of the grey wolf optimization.
CatBoost model
CatBoost is a new open source machine learning library proposed by Russian scholar Yandex in 2017, which is based on Categorical and Boosting (Prokhorenkova et al., 2018), a new gradient boosting algorithm that is implemented as a symmetric decision tree-based learner. Using ordered boosting, it improves the gradient estimation of the traditional Gradient Boosting Decision Tree (GBDT) algorithm and handles efficiently the category-based features in the gradient boosting decision tree algorithm. GBDT is an algorithm for regression and classification proposed by Friedman (2001) in 2000. This algorithm solves the problem of overfitting individual decision trees by internally integrating multiple decision trees and accumulating multiple decision trees. The GBDT algorithm constructs a loss-reducing learner at each step in the direction of the steepest gradient to compensate for the shortcomings of the currently constructed model, i.e., it uses gradient descent to optimize. The algorithm model is described as follows:
Where
By minimizing the loss function, the parameters of the optimal model can be determined:
where
As a result of the dependency between weak learners in the GBDT algorithm, it is difficult to train data in parallel. At the same time, the algorithm lacks smoothness, and the created model may still overfit. A CatBoost algorithm solves the overfitting problem of the traditional GBDT algorithm, which uses Ordered Boosting to obtain an unbiased estimation of the gradient to alleviate the effect of gradient estimation bias, thus increasing generalization capability of the model (Lu et al., 2022).
The traditional GBDT algorithm utilizes the label average as the criterion for splitting nodes, which can be expressed as follows:
where
The disadvantage of this approach is that features contain more information than labels, and the average of the labels is used as a representation of the features, which can cause a conditional bias problem when the data structure and distribution of the training and test datasets are different. The CatBoost algorithm incorporates terms and weighting factors that reduce the impact of noise and low frequency category type data on data distribution.
Where
The CatBoost algorithm uses the oblivious tree as the base predictor. In each iteration, the same partitioning rule is applied to the entire layer of the tree, ensuring that the left and right subtrees are perfectly symmetrical. For each leaf node of a oblivious tree, the index may be encoded as a binary vector of length equal to the depth of the tree. The binary eigenvalues of all samples are stored in the continuous vector
Where
CEEMDAN-GWO-CatBoost combined prediction model
The CEEMDAN-GWO-CatBoost coal price forecasting model presented in this paper is divided into two components: decomposition and prediction. We first decompose the raw coal price index data using CEEMDAN. Then, each of the IMF components and residual RES are predicted separately, and the hyperparameters of the CatBoost model are sought using the GWO optimization algorithm. The final result is obtained by summing each prediction. Figure 2 illustrates the specific implementation flow.

FIGURE 2. Flow chart of the coal price index forecasting model based on CEEMDAN-GWO-CatBoost.
SHAP interpretation method
Machine learning has achieved great success in many fields, but its application to real-world tasks is severely limited by the difficulty of interpreting the results. In the field of prediction, interpretability is of paramount importance. Although the machine learning model based on the integration algorithm has a better performance, it reduces the interpretability of the model as the complexity of the model increases, which renders the CatBoost model almost a black box. In order to address the problem of poor interpretability of the model, the SHAP framework is presented in this article to interpret the model results in order to support the model’s reliability.
SHAP is based on game theory (Štrumbelj and Kononenko, 2014) and local interpretation (Lundberg et al., 2020), and it belongs to the classic ex post explanation framework. This method is based on the Shapley value concept proposed by Lundberg et al. (2018) in 2017 from a game theory perspective, using each feature variable in the dataset as a player and training the model on that dataset to predict the results. It can be viewed as the result of many players cooperating to complete a project, considering the contribution made by each player, and sharing the benefits fairly through SHAP value. The SHAP method is a model interpretation tool applicable to tree-based algorithms that quantifies the contribution of each feature to the prediction and reveals the relationship between the individual values of the features and the prediction results (Carrieri et al., 2021). The model generates a prediction value for each sample, and the SHAP value reflects the value assigned to each feature in that sample. If the
Where
Description of data
Establishment of a primary indicator system
The purpose of this paper is to examine comprehensively the internal and external factors affecting coal price and establish a primary index system for coal price influencing factors in five dimensions: supply, demand, macroeconomic environment, freight costs, and substitutes.
On the supply side, coal production directly affects supply, which in turn influences coal prices. Due to the country’s commitment to the development of advanced production capacity, as well as the promotion and use of renewable energy, China’s coal production has declined, but it still accounts for a substantial proportion of the world’s coal production. The import and export of coal will disrupt the original supply and demand balance, affecting the coal price. In terms of demand, coal consumption is determined by the level of development of its downstream industries. With the rapid development of coal-consuming industries, coal demand is likely to increase and is subject to seasonal fluctuations. Power generation and summer thermal power generation by the power industry will also affect coal prices. Considering freight costs, coal as a bulk commodity, China’s “west coal east, north coal south” coal logistics pattern will undoubtedly influence the final coal price. The cost of coal transportation accounts for a significant portion of its total cost, so the cost of coal transportation is a very important factor. In terms of macroeconomic and social context, the degree of domestic economic development will affect coal prices, which can be reflected by fixed asset investment, industrial value added, and consumer price index. With regards to substitutes, the price increase of substitutes such as oil will to some extent increase the demand for coal, thereby affecting its price. Detailed classifications and secondary quantifications of each indicator level are presented in Table 1.
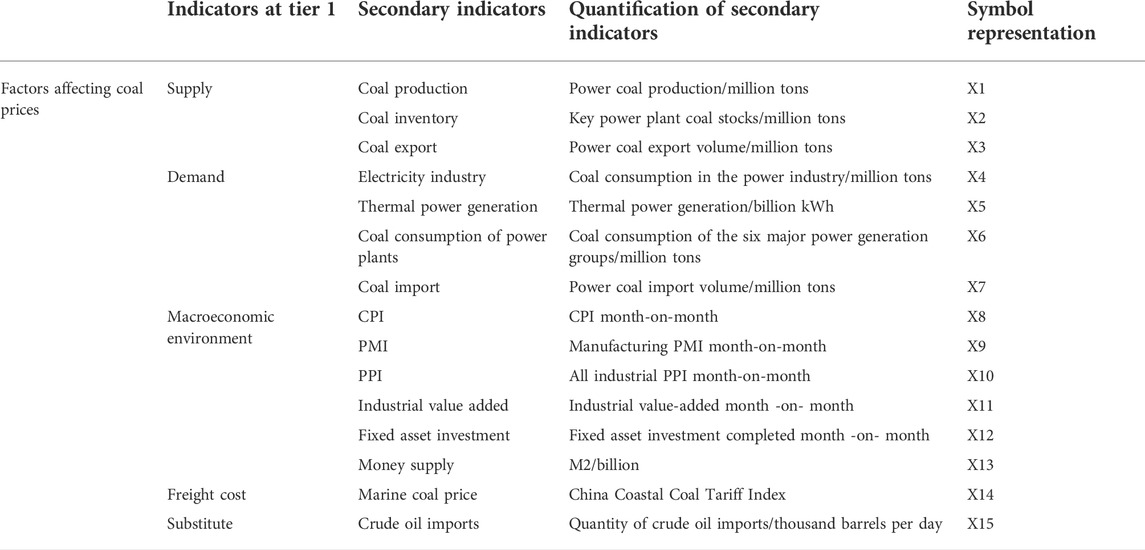
TABLE 1. Coal prices comprehensive impact factors indicators table.
Data source
Bohai-Rim Steam-Coal Price Index (BSPI) is based on market trading prices of power coal in the ports and closely related areas of the Bohai Sea region, which is authoritative, objective, stable and scientific enough to reflect the operating dynamics of the Chinese coal market (Wang et al., 2011). Therefore, in this paper, the Bohai Rim Power Coal Price Index is chosen as the predicted variable, denoted by the symbol
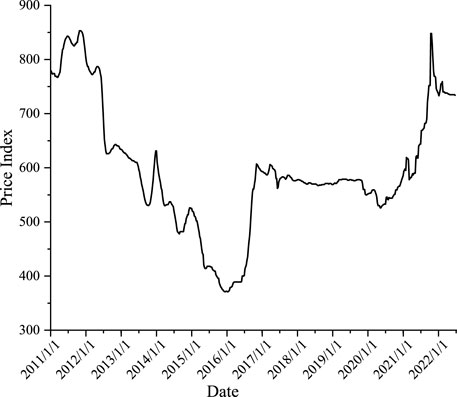
FIGURE 3. Trend of BSPI.
The predictor variables are the secondary indicators collected in Table 1, and the raw data are available from the China Wind Financial Database (https://www.wind.com.cn). In addition to the China Coastal Coal Price Index, which is a daily indicator, all other indicators are monthly indicators. For the purpose of ensuring the fairness of the experiment, Eivews software is used to convert the monthly data into weekly data and the China Coastal Coal Freight Index on the day the BPSI is announced is selected as the freight cost factor, with a period between 5 January 2011 and 22 June 2022, for a total of 598 samples. The missing values present in the data were filled in using the forward fill method (Eekhout et al., 2012), and descriptive statistics are presented for each indicator in Table 2.
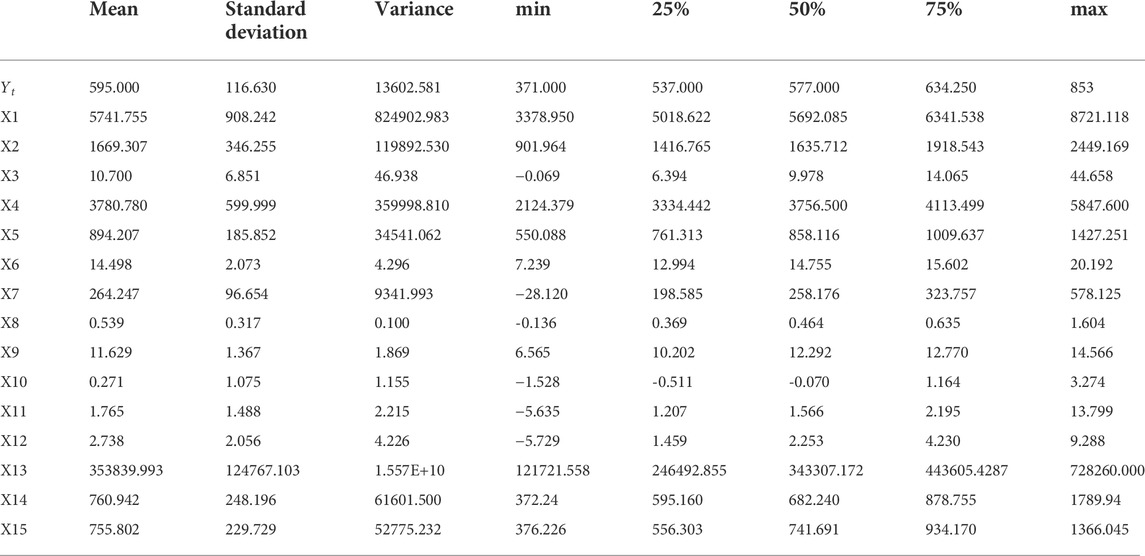
TABLE 2. Descriptive statistics of coal price data.
Data pre-processing
In practice, data of high dimensions can create problems such as high computational complexity and long execution times for the model. The basic concept of feature selection is to select the most effective variables among the original features in order to reduce data dimensionality. Feature selection should be conducted before modeling in order to reduce noise and over-fitting as well as improve training efficiency and prediction accuracy. In this study, Spearman correlation analysis, which is commonly used in statistics, is used for feature selection. Spearman’s rank correlation coefficient is a statistical method used to assess the correlation between two variables. The most important feature of the methodology is that it is quick and robust without considering sample size or distributional characteristics of the variables. For two vectors
Where,
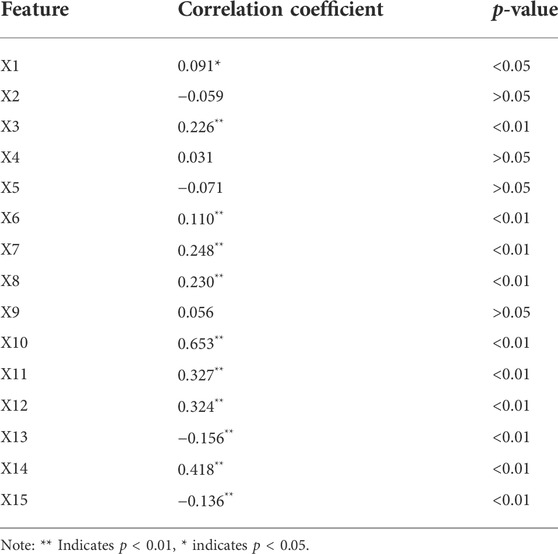
TABLE 3. Correlation of the predictor with the predicted label.
Table 3 shows that the 11 indicators in the index system established in this paper show a statistically significant correlation with the coal price index (p < 0.05). Therefore, to improve the efficiency of the model forecast, we have excluded from the input features of the model the four indicators X2 (coal inventory of key power plants), X4 (coal consumption in the power industry), X5 (thermal energy generation) and X9 (manufacturing PMI month-over-month) with p-values greater than 0.05. In addition, to reduce the influence of outliers on the model and to avoid the effect of different magnitudes of input variables on the predictive power of the model, Eq. 28 has been applied to standardize the experimental data set:
Where,
Empirical analysis
Performance evaluation index
In this paper, Root Mean Squared Error (RMSE), Mean Absolute Error (MAE) and Mean Absolute Percentage Error (MAPE) are selected as the evaluation functions of the prediction models. Among the three performance measures, smaller values of RMSE, MAE and MAPE indicate better model prediction performance, as shown in the following equations.
Where,
Model parameter setting
Multiple algorithms are used as comparison models in this paper to assess the forecasting performance of the proposed master model for coal price index. For single-model prediction, the commonly used econometric models (ARIMA), machine learning models (SVR and GBDT) and deep learning models (LSTM) are selected for comparison and analysis; in the combined algorithm, the PSO-optimized CatBoost model (PSO-CatBoost) is chosen for comparison and analysis with the GWO-optimized CatBoost model (GWO-CatBoost); for data decomposition, the EEMD-GWO-CatBoost is used to compare and analyze the prediction effect of the CEEMDAN-GWO-CatBoost model. Table 4 provides information regarding the parameters of each algorithm model. Figure 4 illustrates the results of the CEEMDAN decomposition of the raw data.
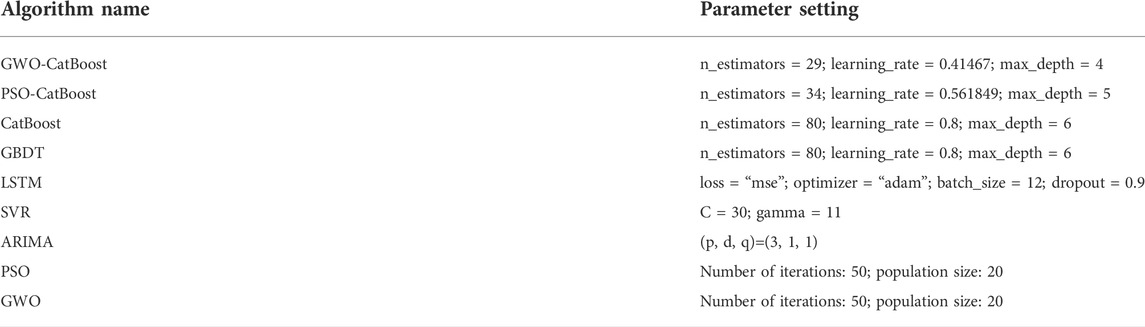
TABLE 4. Algorithm parameter setting.
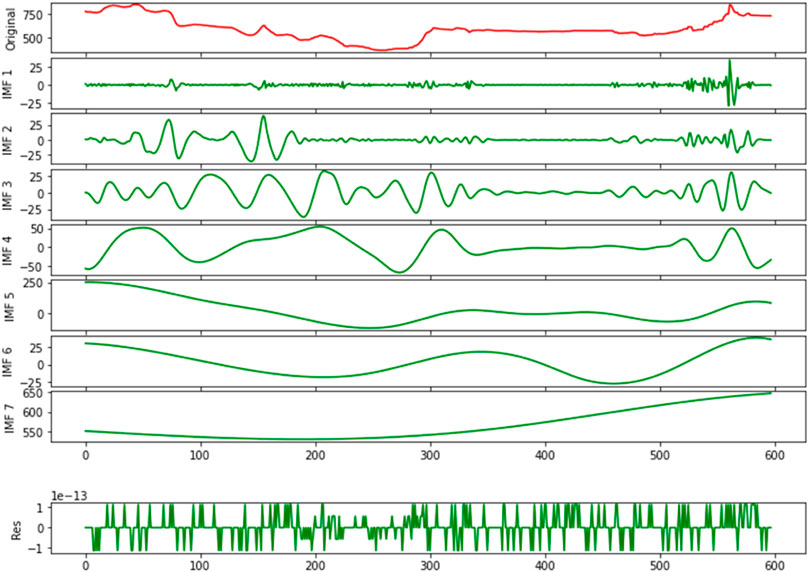
FIGURE 4. CEEMDAN decomposition results for BSPI.
Analysis of model prediction effect
Figure 5 and Table 5 present the fitting curves of each model for the coal price index in the test set sample and the prediction accuracy in each of the three evaluation indicators, respectively. From the analysis, the following conclusions can be drawn.
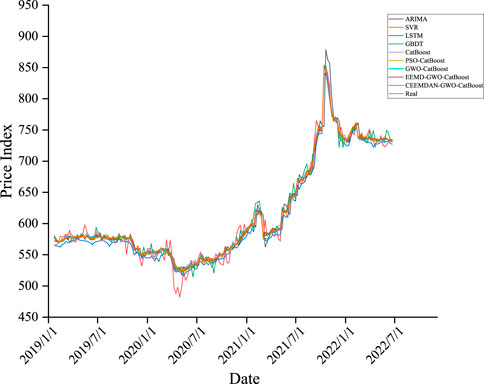
FIGURE 5. Model prediction effect.
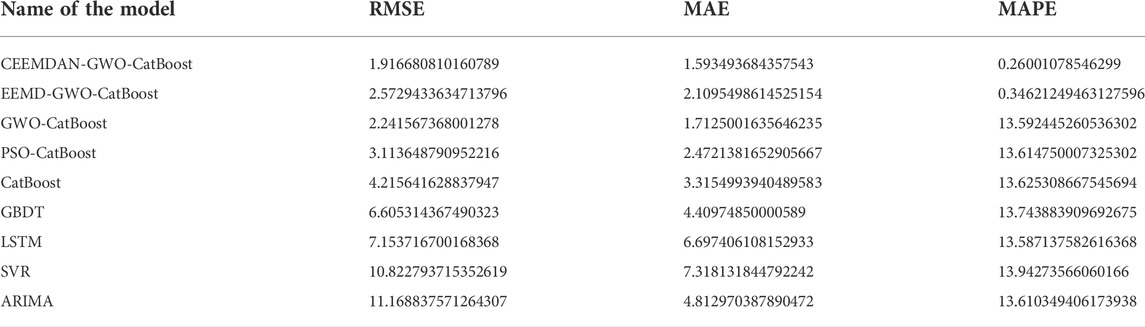
TABLE 5. Model prediction accuracy table for coal price index.
Based on single-model prediction, the CatBoost model performs best, with the GBDT model ranking second in RMSE and MAE metrics, which has been attributed primarily to the following reasons. Primarily, in contrast with ARIMA, SVR and LSTM models, CatBoost and GBDT are part of Boosting integrated learning framework models, and this integrated method can improve the prediction results of the models through combining the results of multiple base learner algorithms. As a second advantage, the Ordered Boosting method used in the CatBoost model effectively mitigates the effect of gradient estimation bias in comparison to the GBDT model. This improves the generalizability of the CatBoost model.
In the combined algorithm, the GWO-CatBoost model outperforms the PSO-CatBoost model in terms of prediction accuracy by 46.83%, 48.35%, and 0.24% for RMSE, MAE and MAPE metrics, respectively. The results show that the optimal parameters of the CatBoost model can be locked faster by selecting the GWO algorithm with the same parameter settings. An important point to note is that adding both EEMD and CEEMDAN algorithms to the prediction model can significantly enhance MAPE metrics. As such, decomposing the original data before prediction can unearth valuable information in the data, and incorporating the decomposed data into the established model can enhance the accuracy of prediction. Generally, the CEEMDAN-GWO-CatBoost models developed in this paper outperformed the other comparative models in this study in terms of prediction accuracy. This means that the combined model proposed in this paper can be applied to the field of coal price forecasting with high level of accuracy.
Analysis of the importance of factors influencing coal prices
An important issue in the current machine learning applications area is that machine learning makes it difficult for operators to understand which metrics play a key role, as linear regression models do. Other words, while the results can be relied upon, the process may not be reliable. In this paper, the SHAP interpretation method is proposed in order to address this issue and try to resolve it based on model interpretation.
Based on the GWO-CatBoost model that has been trained, we compute the SHAP values of the indicators once per sample point to ensure that the sum of the SHAP values of all indicators at the sample point corresponds to the output of the sample on the model. As part of this study, the average SHAP absolute value of each indicator on the training and test sets of the GWO-CatBoost model is calculated as the feature importance of each indicator, and the ranking results are reported in Table 6.
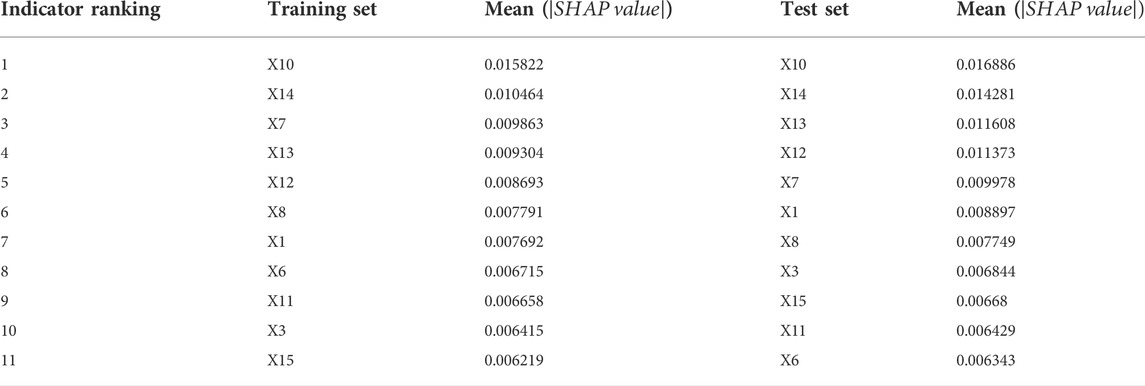
TABLE 6. Ranking of feature importance.
The results show that the top five indicators remain unchanged, i.e., the identification of important indicators is more robust, both in the training set as well as the test set, namely the PPI index, fixed asset investment, money supply, seaborne coal price index and coal imports. Of these, three are indicators of the macroeconomic environment category, indicating that the national economic development situation has a profound impact on coal prices. It also confirms the findings of the literature (Doğan et al., 2022a; Murshed et al., 2022) that the general economic development of country is inextricably linked to energy consumption. China’s coal resources are unevenly distributed geographically, which has led to the development of a coal logistics pattern of “sending coal from the west to the east and coal from the north to the south” for many years, which is why the maritime coal price index plays a significant role in the price of coal. In light of the fact that imported coal has always represented a significant portion of China’s coal supply and electricity coal rationing, changes in its quantity may have significant effects on coal prices. For a deeper understanding of the relationship between each metric and its SHAP value, the relationship between all metrics and SHAP values on the training and test set samples is plotted in Figure 6. The feature values, SHAP values and multi-indicator presentation are taken into consideration to reflect the global interpretation, and the magnitude of the indicator values on the sample points are represented by different colours; the red sample points are representative of the indicators with higher values in the sample, while the blue sample points are representative of the indicators with lower values, and the graph of each feature includes all the sample points in the data set. SHAP value is taken as zero as the middle divider. For the sample point on the left, the feature has a negative SHAP value, and it has a negative contribution to the output coal price prediction value in this case. In contrast, the indicators corresponding to the sample points on the right side of the middle dividing line contribute positively to the predicted coal price values. Thus, the figure should show blue on the left, purple in the middle, and red on the right for correlators contributing positively to the predicted value of coal prices, and red on the left, purple in the middle, and blue on the right for correlators that contribute negatively to the predicted value of coal prices.
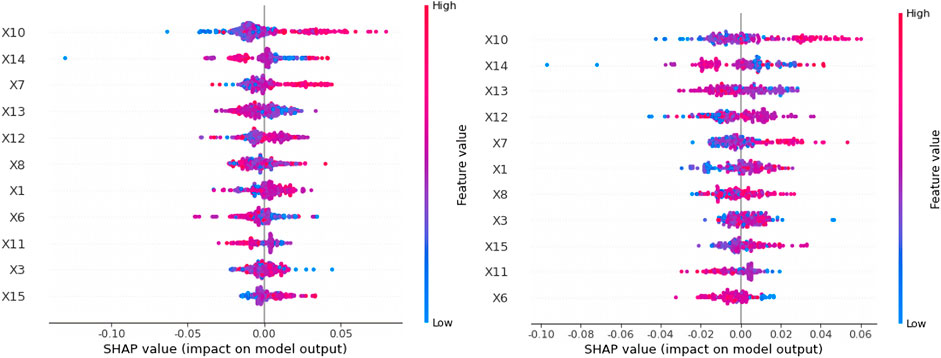
FIGURE 6. Training set (left) and test set (right) feature analysis graph.
As can be seen from the images of the model on the training and test sets, coal exports (X3), power plant coal consumption (X6), and industrial value added (X11) are strongly negatively correlated indicators, and the higher the value taken, the lower the model’s coal price prediction value. The PPI index (X10), seaborne coal price index (X14), money supply (X13), fixed asset investment (X12), coal imports (X7), coal production (X1), CPI index (X8), and crude oil imports (X15) are significantly positively correlated indicators, and the higher the forecasted coal price value, the higher the forecast value. Analysis of the results shows that the PPI index has the greatest impact on coal prices, which reflects the changing economic situation. An increase in coal production and coal imports indicates an increase in coal demand, and higher demand increases coal prices. An increase in money supply and fixed asset investment will result in increased costs for the coal industry, which will result in higher coal prices. As seaborne coal prices increase, the overall cost of coal will also increase, thus raising coal prices. The increase in coal exports will increase supply on the domestic coal market, and the oversupply will lower domestic coal prices. The decreases in the coal consumption of power plants and industrial value added indicate a decrease in the demand for coal at this time, which in turn leads to a decrease in coal prices.
Conclusion and suggestions
Obtaining timely and accurate forecasts of coal prices trends is essential for price regulation and resource allocation by the government and the market with the objective of guiding the Chinese coal industry toward reasonable control of supply and maintenance of supply and demand, as well as encouraging coal midstream and downstream businesses to respond quickly and accurately, and influencing the efficiency of coal use by the major coal consuming industries in China. Under the objectives of carbon neutrality and carbon peaking, accurate coal price predictions are even more critical to ensure national energy security. Based on existing research, the Bohai-Rim Steam-Coal Price Index from 5 January 2011 through 22 June 2022 is used as the forecast label for this study. It is proposed an impact factor indicator system based on five aspects: supply, demand, macroeconomic environment, freight costs and substitutes, and the Spielman correlation analysis is used to screen the indicators. A combined CEEMDAN-GWO-CatBoost forecasting model is then developed, and the following research conclusions are drawn from simulation experiments based on coal price data.
In the first instance, machine learning models can provide better forecasting results for nonlinear time series problems such as coal price forecasting. At the same time, the prediction accuracy of the integrated CatBoost model optimized with the GWO intelligent algorithm is significantly better than that of a single prediction model. Furthermore, by using the CEEMDAN data decomposition method, you can uncover non-linear valuable information in coal price data, and the addition of the decomposed data to the established model will further enhance the accuracy of prediction. Additionally, this research differs from prior research on machine learning modeling. This paper is intended to address the problems of “black boxes” and “algorithmic discrimination” encountered in machine learning forecasting, by starting from the factors influencing coal prices, and then identifying important indicators based on the SHAP explanation method for coal price forecasting and interpreting the principle of the importance of important indicators. It has been shown that the SHAP interpretation method with good interpretability of feature importance assignment based on machine learning model can give a richer interpretation of indicators and is an effective interpretation tool. In light of the above research, this paper presents the following policy recommendations.
(1) The government should take into account the PPI index, fixed asset investment, money supply and other macroeconomic variables to set up a reasonable benchmark price for coal, strengthen the supervision of coal medium- and long-term contract performance, and ensure the basic stability of coal prices. In the current state of the Chinese coal industry, which is experiencing an intricate political and economic situation at home and abroad, stable coal prices will be able to ensure power and energy security, as well as basic price stability in the energy industry. Based on a forecast model proposed by academia, the government’s scientific prediction of future coal prices is conducive to improving the coal price pricing mechanism, which will assist the coal industry in overcoming difficulties and effectively avoiding market risks.
(2) The government should fully recognize that the supply and demand of coal are important factors that affect its price, in order to promote the transformation of the development mode of coal enterprises under the premise of basic stability in the domestic coal supply and demand. Specifically, in terms of coal demand, the government needs to stabilize the scale of coal imports and achieve complementarity with domestic coal resources by continuously purchasing high-quality imported coal. In terms of coal supply, the governments should formulate relevant policies to gradually eliminate backward production capacity, improve the efficiency of coal resource utilization, and ensure that coal producers that do not meet environmental standards exit the market as soon as possible with regards to coal supply. By releasing coal quality production capacity in an orderly manner while ensuring safe, clean and efficient utilization, the total coal production will be stabilized.
(3) In order to achieve emission peak and carbon neutrality, the government should accelerate the transformation of the energy mix at the appropriate time. As a result of China’s resource endowment and distribution, its current energy structure relies excessively on coal, contributing to the pollution problems facing the country today. Under the premise of accurate prediction of coal price, the government should use the time window of coal price rebound to promote the transition from coal to clean energy sources, namely photovoltaics, natural gas, and wind energy, and gradually reduce the dependence on coal as a non-renewable energy source.
There is a point to be made about the indicator system used in this paper being based on market-based factors influencing coal prices. However, this system does not consider the impact of government decisions or social emergencies, such as the sudden outbreak of Corona Virus Disease 2019. It is therefore necessary to undertake subsequent studies in order to quantify policy decisions and major contingencies as exogenous input indicators, which will enhance the accuracy, reliability, and usefulness of the coal price forecasting model.
Data availability statement
The original contributions presented in the study are included in the article/Supplementary Material, further inquiries can be directed to the corresponding author.
Author contributions
XW was instrumental in the conceptualization and design of the study. YM was responsible for material preparation, data collection and analysis, and completed the writing of the manuscript. YD and YG contributed to the literature.
Funding
This research was funded by the National Natural Science Foundation of China (Grant No. 81973791).
Conflict of interest
The authors declare that the research was conducted in the absence of any commercial or financial relationships that could be construed as a potential conflict of interest.
Publisher’s note
All claims expressed in this article are solely those of the authors and do not necessarily represent those of their affiliated organizations, or those of the publisher, the editors and the reviewers. Any product that may be evaluated in this article, or claim that may be made by its manufacturer, is not guaranteed or endorsed by the publisher.
References
Herrera, G. P., Constantino, M., Miranda Tabak, B., Pistori, H., Su, J. J., and Naranpanawa, A. (2019). Long-term forecast of energy commodities price using machine learning. Energy 179, 214–221. doi:10.1016/j.energy.2019.04.077
Alameer, Z., Ahmed, F., Li, K., Ye, H., and Jianhua, Z. (2020). Multistep-ahead forecasting of coal prices using a hybrid deep learning model. Resour. Policy 65, 101588. doi:10.1016/j.resourpol.2020.101588
Bedi, J., and Toshniwal, D. (2020). Energy load time-series forecast using decomposition and autoencoder integrated memory network. Appl. Soft Comput. 93, 106390. doi:10.1016/j.asoc.2020.106390
Bouckaert, S., Fernandez Pales, A., and McGlade, C., Net zero by 2050: A roadmap for the global energy sector[J], 2021.
Cao, J., Li, Z., and Li, J. (2019). Financial time series forecasting model based on CEEMDAN and LSTM. Phys. A Stat. Mech. Its Appl. 519, 127–139. doi:10.1016/j.physa.2018.11.061
Carrieri, A. P., Haiminen, N., Maudsley-Barton, S., Gardiner, L. J., Murphy, B., Mayes, A. E., et al. (2021). Explainable AI reveals changes in skin microbiome composition linked to phenotypic differences[J]. Sci. Rep. 11 (1), 1–18.
Ding, L., Zhao, Z. C., and Wang, L. (2022). Probability density forecasts for natural gas demand in China: Do mixed-frequency dynamic factors matter? Appl. Energy 312, 118756. doi:10.1016/j.apenergy.2022.118756
Ding, L., Zhao, Z., and Han, M. (2021). Probability density forecasts for steam coal prices in China: The role of high-frequency factors. Energy 220, 119758. doi:10.1016/j.energy.2021.119758
Doğan, B., Balsalobre-Lorente, D., and Ali Nasir, M. (2020). European commitment to COP21 and the role of energy consumption, FDI, trade and economic complexity in sustaining economic growth. J. Environ. Manag. 273, 111146. doi:10.1016/j.jenvman.2020.111146
Doğan, B., Chu, L. K., Ghosh, S., Diep Truong, H. H., and Balsalobre-Lorente, D. (2022). How environmental taxes and carbon emissions are related in the G7 economies? Renew. Energy 187, 645–656. doi:10.1016/j.renene.2022.01.077
Doğan, B., Ferraz, D., Gupta, M., Duc Huynh, T. L., and Shahzadi, I. (2022). Exploring the effects of import diversification on energy efficiency: Evidence from the OECD economies. Renew. Energy 189, 639–650. doi:10.1016/j.renene.2022.03.018
Doğan, B., Ghosh, S., Hoang, D. P., and Chu, L. K. (2022). Are economic complexity and eco-innovation mutually exclusive to control energy demand and environmental quality in E7 and G7 countries? Technol. Soc. 68, 101867. doi:10.1016/j.techsoc.2022.101867
Doğan, B., M Driha, O., Lorente, D. B., and Shahzad, U. (2021). The mitigating effects of economic complexity and renewable energy on carbon emissions in developed countries. Sustain. Dev. 29 (1), 1–12. doi:10.1002/sd.2125
Dogan, B., Madaleno, M., Tiwari, A. K., and Hammoudeh, S. (2020). Impacts of export quality on environmental degradation: Does income matter? Environ. Sci. Pollut. Res. 27 (12), 13735–13772. doi:10.1007/s11356-019-07371-5
Eekhout, Iris, Michiel de Boer, R., Twisk, W. R., de Vet, H. C. W., and Heymans, M. W. (2012). Missing data: A systematic review of how they are reported and handled[J]. Epidemiology 23 (5), 729–732. doi:10.1097/ede.0b013e3182576cdb
Fan, X., Wang, L., and Li, S. (2016). Predicting chaotic coal prices using a multi-layer perceptron network model. Resour. Policy 50, 86–92. doi:10.1016/j.resourpol.2016.08.009
Friedman, J. H. (2001). Greedy function approximation: A gradient boosting machine[J]. Ann. Statistics, 1189–1232.
Hasan, M. Z., and Ratti, R. A. (2015). Coal sector returns and oil prices: Developed and emerging countries[J]. Int. J. Energy Econ. Policy 5 (2), 515–524.
He, Y., Wang, B., Wang, J., Xiong, W., and Xia, T. (2013). Correlation between Chinese and international energy prices based on a HP filter and time difference analysis. Energy Policy 62, 898–909. doi:10.1016/j.enpol.2013.07.136
Ho, S-L., Xie, M., and Goh, T. N. (2002). A comparative study of neural network and Box-Jenkins ARIMA modeling in time series prediction. Comput. Industrial Eng. 42 (2), 371–375. doi:10.1016/s0360-8352(02)00036-0
Huang, N. E., Shen, Z., Long, Steven R., Wu, M. C., Shih, H. H., Zheng, Q., et al. (1998). The empirical mode decomposition and the hilbert spectrum for nonlinear and non-stationary time series analysis[J]. Proc. Math. Phys. Eng. Sci. 454 (1971), 903–995.
Jiang, S., Yang, C., Guo, J., and Ding, Z. (2018). ARIMA forecasting of China’s coal consumption, price and investment by 2030. Energy Sources, Part B Econ. Plan. Policy 13 (3), 190–195. doi:10.1080/15567249.2017.1423413
Khalfaoui, R., Ben Jabeur, S., and Dogan, B. (2022). The spillover effects and connectedness among green commodities, Bitcoins, and US stock markets: Evidence from the quantile VAR network. J. Environ. Manag. 306, 114493. doi:10.1016/j.jenvman.2022.114493
Lee, S., Vo, T. P., Thai, H-T., Lee, J., and Patel, V. (2021). Strength prediction of concrete-filled steel tubular columns using Categorical Gradient Boosting algorithm. Eng. Struct. 238, 112109. doi:10.1016/j.engstruct.2021.112109
Li, J., Xie, C., and Long, H. (2019). The roles of inter-fuel substitution and inter-market contagion in driving energy prices: Evidences from China’s coal market. Energy Econ. 84, 104525. doi:10.1016/j.eneco.2019.104525
Lin, B., Zhan, Y., and Sun, C. (2022). A study of the coordinated development of energy supplies and the demand for carbon neutrality[J]. Gov. Stud. 38 (3), 24.
Lin, B. Q., Wei, W. X., and Li, P. D. (2007). China’s long-run coal demand: Impacts and policy choice[J]. Econ. Res. J. 2, 48–58.
Liu, H., Mi, X., and Li, Y. (2018). Smart deep learning based wind speed prediction model using wavelet packet decomposition, convolutional neural network and convolutional long short term memory network. Energy Convers. Manag. 166, 120–131. doi:10.1016/j.enconman.2018.04.021
Lu, C., Zhang, S., Xue, D., Xiao, F., and Liu, C. (2022). Improved estimation of coalbed methane content using the revised estimate of depth and CatBoost algorithm: A case study from southern sichuan basin, China. Comput. Geosciences 158, 104973. doi:10.1016/j.cageo.2021.104973
Lundberg, S. M., Gabriel, E., Chen, H., DeGrave, A., Prutkin, J. M., Nair, B., et al. (2020). From local explanations to global understanding with explainable AI for trees. Nat. Mach. Intell. 2 (1), 56–67. doi:10.1038/s42256-019-0138-9
Lundberg, S. M., Nair, B., Vavilala, M. S., Horibe, M., Eisses, M. J., Adams, T., et al. (2018). Explainable machine-learning predictions for the prevention of hypoxaemia during surgery. Nat. Biomed. Eng. 2 (10), 749–760. doi:10.1038/s41551-018-0304-0
Lv, Y., Pang, Y., and Doğan, B. (2022). The role of Chinese fiscal decentralization in the governance of carbon emissions: Perspectives from spatial effects decomposition and its heterogeneity. Ann. Reg. Sci. 68 (3), 635–668. doi:10.1007/s00168-021-01096-5
Meng, Z., Sun, H., and Wang, X. (2022). Forecasting energy consumption based on SVR and markov model: A case study of China[J]. Front. Environ. Sci., 363.
Miller, T. (2019). Explanation in artificial intelligence: Insights from the social sciences. Artif. Intell. 267, 1–38. doi:10.1016/j.artint.2018.07.007
Mirjalili, S., and Lewis, A. (2014). Grey wolf optimizer. Adv. Eng. Softw. 69, 46–61. doi:10.1016/j.advengsoft.2013.12.007
Mo, J., Zhang, W., Tu, Q., Yuan, J., Duan, H., Fan, Y., et al. (2021). The role of national carbon pricing in phasing out China's coal power. Iscience 24 (6), 102655. doi:10.1016/j.isci.2021.102655
Murshed, M., Saboori, B., Madaleno, M., Wang, H., and Dogan, B. (2022). Exploring the nexuses between nuclear energy, renewable energy, and carbon dioxide emissions: The role of economic complexity in the G7 countries. Renew. Energy 190, 664–674. doi:10.1016/j.renene.2022.03.121
Niu, M., Hu, Y., Sun, S., and Liu, Y. (2018). A novel hybrid decomposition-ensemble model based on VMD and HGWO for container throughput forecasting. Appl. Math. Model. 57, 163–178. doi:10.1016/j.apm.2018.01.014
Prokhorenkova, L., Gusev, G., Vorobev, A., Dorogush, A. V., and Gulin, A. (2018). CatBoost: Unbiased boosting with categorical features[J]. Adv. Neural Inf. Process. Syst. 31.
Reddy Paramati, S., Shahzad, U., and Doğan, B. (2022). The role of environmental technology for energy demand and energy efficiency: Evidence from OECD countries. Renew. Sustain. Energy Rev. 153, 111735. doi:10.1016/j.rser.2021.111735
Shahzad, U., Doğan, B., Sinha, A., and Fareed, Z. (2021). Does Export product diversification help to reduce energy demand: Exploring the contextual evidences from the newly industrialized countries. Energy 214, 118881. doi:10.1016/j.energy.2020.118881
Shahzad, U., Ferraz, D., Doğan, B., and Aparecida do Nascimento Rebelatto, D. (2020). Export product diversification and CO2 emissions: Contextual evidences from developing and developed economies. J. Clean. Prod. 276, 124146. doi:10.1016/j.jclepro.2020.124146
Shahzad, U., Madaleno, M., Dagar, V., Ghosh, S., and Dogan, B. (2022). Exploring the role of export product quality and economic complexity for economic progress of developed economies: Does institutional quality matter? Struct. Chang. Econ. Dyn. 62, 40–51. doi:10.1016/j.strueco.2022.04.003
Singh, J., Knapp, H. V., Arnold, J. G., and Demissie, M. (2005). Hydrological modeling of the Iroquois river watershed using HSPF and SWAT 1[J]. J. Am. Water Resour. Assoc. 41 (2), 343–360. doi:10.1111/j.1752-1688.2005.tb03740.x
Štrumbelj, Erik, and Kononenko, Igor (2014). Explaining prediction models and individual predictions with feature contributions. Knowl. Inf. Syst. 41 (3), 647–665. doi:10.1007/s10115-013-0679-x
Talbi, B., Ramzan, M., Iqbal, H. A., and Dogan, B. (2022). Appraisal of CO2 emission in Tunisia’s industrial sector: A dynamic vector autoregression method. Environ. Sci. Pollut. Res. 29 (25), 38464–38477. doi:10.1007/s11356-022-18805-y
Torres m e Colominas-, M-A. (2011). “A complete ensemble empirical mode decomposition with adaptive noise[C]//Acoustics Speech and Signal Processing,” in 2011 IEEE International Conference on IEEE (IEEE), 4144–4147.
Wang, D., Zhang, Y. F., and Yin, Q. (2013). Coal price volatility and price discovery function in China[J]. Res. Sci. 35, 1643–1650.
Wang, D., Zhang, Z., Yang, X., Zhang, Y., Li, Y., and Zhao, Y. (2021). Multi-scenario simulation on the impact of China's electricity bidding policy based on complex networks model. Energy Policy 158, 112573. doi:10.1016/j.enpol.2021.112573
Wang, J., Cao, J., Yuan, S., and Cheng, M. (2021). Short-term forecasting of natural gas prices by using a novel hybrid method based on a combination of the CEEMDAN-SE-and the PSO-ALS-optimized GRU network. Energy 233, 121082. doi:10.1016/j.energy.2021.121082
Wang, L. F., Liu, Z. P., and An, Z. Y. (2011). Analysis on the compilation and operation of Bohai sea steam coal price index [J]. China coal. 37 (5), 10–14.
Wei, Y-M., Han, R., Wang, C., Yu, B., Liang, Q. M., Yuan, X. C., et al. (2020). Self-preservation strategy for approaching global warming targets in the post-Paris Agreement era. Nat. Commun. 11 (1), 1624–1713. doi:10.1038/s41467-020-15453-z
Wu, Z., and Huang, N-E. (2009). Ensemble empirical mode decomposition: A noise — Assisted data analysis method[J]. Adv. Adapt. Data Anal. 1 (1), 1–41. doi:10.1142/s1793536909000047
Yan, B., and Aasma, M. (2020). A novel deep learning framework: Prediction and analysis of financial time series using CEEMD and LSTM[J]. Expert Syst. Appl. 159, 113609.
Yuan, C., Liu, S., and Wu, J. (2010). The relationship among energy prices and energy consumption in China. Energy Policy 38 (1), 197–207. doi:10.1016/j.enpol.2009.09.006
Zamani, N. (2016). The relationship between crude oil and coal markets: A new approach[J]. Int. J. Energy Econ. Policy 6 (4), 801–805.
Zhang, B., and Ma, J. (2011). Coal price index forecast by a new partial least-squares regression. Procedia Eng. 15, 5025–5029. doi:10.1016/j.proeng.2011.08.934
Zhang, C., Wei, H., Zhao, J., Liu, T., Zhu, T., and Zhang, K. (2016). Short-term wind speed forecasting using empirical mode decomposition and feature selection. Renew. Energy 96, 727–737. doi:10.1016/j.renene.2016.05.023
Zhang, K., Cao, H., Thé, J., and Yu, H. (2022). A hybrid model for multi-step coal price forecasting using decomposition technique and deep learning algorithms. Appl. Energy 306, 118011. doi:10.1016/j.apenergy.2021.118011
Zhang, W., Qu, Z., Zhang, K., Mao, W., Ma, Y., and Fan, X. (2017). A combined model based on CEEMDAN and modified flower pollination algorithm for wind speed forecasting. Energy Convers. Manag. 136, 439–451. doi:10.1016/j.enconman.2017.01.022
Keywords: carbon neutral, energy security, coal price forecast, machine learning, CEEMDAN
Citation: Wang X, Mao Y, Duan Y and Guo Y (2022) A Study on China coal Price forecasting based on CEEMDAN-GWO-CatBoost hybrid forecasting model under Carbon Neutral Target. Front. Environ. Sci. 10:1014021. doi: 10.3389/fenvs.2022.1014021
Received: 08 August 2022; Accepted: 18 August 2022;
Published: 12 September 2022.
Edited by:
Mihaela Simionescu, Romanian Academy, RomaniaReviewed by:
Buhari Doğan, Süleyman Demirel University, TurkeyUmer Shahzad, Anhui University of Finance and Economics, China
Copyright © 2022 Wang, Mao, Duan and Guo. This is an open-access article distributed under the terms of the Creative Commons Attribution License (CC BY). The use, distribution or reproduction in other forums is permitted, provided the original author(s) and the copyright owner(s) are credited and that the original publication in this journal is cited, in accordance with accepted academic practice. No use, distribution or reproduction is permitted which does not comply with these terms.
*Correspondence: Yaqi Mao, bWFveWFxaXdvcmtAZm94bWFpbC5jb20=