 Siyue Li
 Jing Zhang2
94% of researchers rate our articles as excellent or good
Learn more about the work of our research integrity team to safeguard the quality of each article we publish.
Find out more
ORIGINAL RESEARCH article
Front. Environ. Sci. , 30 November 2022
Sec. Freshwater Science
Volume 10 - 2022 | https://doi.org/10.3389/fenvs.2022.1013318
Exploring linkages between riverine water quality and land use is of great importance for catchment management and water quality conservation. Relationships between them are complex and site-specific. Therefore, land-use/landscape effects on water quality remain to be investigated. Multivariate statistics and empirical models are used to examine the influences of seasonality (wet and dry seasons), land use in various riparian strips, on water quality seasonality in the river networks of the Three Gorges Reservoir Area. Redundancy analysis (RDA) shows a comparable effect of land use on overall water quality (OWQ) during the two seasons. The variance of OWQ explained is generally higher in the 50 m riparian zone, whilst, the variance is higher along 200 m riparian in the wet season with land use composition presented as actual area. The explanatory variables of land use indices for the OWQ are quite distinct. Multiple linear regression (MLR) modeling indicates that models of water quality parameters (WQPs) depend on seasonality, riparian zone and representation of land use indices (calculated from percentage and actual area), this results in predictor variables of WQPs are highly variable. Land use within the 50 m riparian zone can predict WQPs well, and land use along the riparian zones predicts WQPs better in the dry season. We firstly compared the impacts of multi-riparian land use indices (presented as percentage and actual area) in combination with land use configuration on water quality. Our study provides critical information for efficiently land-use planning to protect water quality.
River networks are sentinels of their drained catchments. Riparian corridors have longitudinal, lateral, and vertical influences on their functional role in landscapes. The role in riparian zones has been recognized to be closely linked to water quality and biogeochemical process (Piney et al., 2018; Swanson and Bohlman, 2021). Land use/land cover (including land use compositions, configurations and intensity) has been proved to largely regulate riverine water quality through altering sediment, nutrient loads, and catchment hydrology (e.g., Peterjohn and Correll, 1984; Basnyat et al., 1999; Turner and Rabalais, 2003), because rivers are receivers and integrators of terrestrial materials (Zhou et al., 2012), consequently are reflective to water-land interactions. Current studies also concentrate on land use influences on riverine carbon geochemical process (Gu et al., 2022; Zhang et al., 2022; Zhang et al., 2023). Previous studies relating to influences of land use composition on riverine water quality usually adopted the proportion of land use composition rather than their actual area (i.e., Ye et al., 2009; de Mello et al., 2018). This may lead to a biased quantitative interpretation of water quality-land use relationship. Proportions and actual area of land use compositions reflect different water-land interactions, and thus expectedly exhibit distinct links to riverine water quality.
Land use configuration is an effective measure for characterizing land use structure (Zhang et al., 2019), and thus shows significant effects on water quality. For example, Ding et al. (2016) reported strong influences of water quality parameters (WQPs) posed by land use configurations (including aggregation index, patch density, largest patch index). Others, for example, Uuemma et al. (2007) and Shi et al. (2017) found the effects of landscape on nitrogen species at multi-spatial scales. They demonstrate that influences of landscape metrics on water quality are dependent on spatial-temporal scales. Characterizing the linkages of land use configurations with WQPs can increase our understanding of anthropogenic impacts on aquatic ecosystem.
Land use intensity (LUI), an indicator of the degree of land development, describes the number and variety of varying land use. Increase in LUI, especially agricultural and urban land uses, has been reported to show strong negative impacts on ecosystem functioning (e.g., biodiversity loss, air pollution, soil and water quality degradation) (Bierschenk et al., 2012). Previous studies focused on LUI effects on geodiversity (Tukiainen et al., 2017), ecosystem services (Xu et al., 2016; Chillo et al., 2018), and biodiversity in particular (Diggelen et al., 2005; Tuck et al., 2014). For example, Tukiainen et al. (2017) indicated that geodiversity is negatively linked to LUI. Xu et al. (2016) reported that LUI was associated with changes in ecosystem services. LUI effects of biodiversity demonstrated the correlations between plant species richness and nitrogen (Kleijn et al., 2009). There are several studies linking LUI to river water quality (Ometo et al., 2000), but few in the subtropical monsoonal area (cf. Zhang et al., 2019). The shape of their relations, to date, is unknown. Therefore, exploring LUI influence on river water quality is still a knowledge gap (Erb et al., 2013; Julian et al., 2017).
Land use indices influences on water quality depend on scales and extent of spatial analysis, such as riparian vs. sub-catchment scales. Riparian zones, representing an important aquatic-terrestrial ecotone, play a crucial role in regulating water quality (Vought et al., 1995; Mwaijengo et al., 2020). The vegetated riparian zones can considerably reduce terrestrial sediments and nutrients discharges via a variety of processes such as deposition, absorption and biological denitrification (Li et al., 2009). Prior studies revealed the importance of the riparian zones in predicting water quality (Smart et al., 2001; Li et al., 2013), but spatial extent of effects on WQPs was still uncertain (Sliva and Williams, 2001; Shi et al., 2017). For instance, Ding et al. (2016) found that land use could better predict water quality at catchment scale respective to at riparian zone, whereas others yielded contrary findings (Johnson et al., 1997; Shi et al., 2017). These studies all explored land use percentage as an index for riverine WQPs, actual land use area was, however, not considered, which is potentially expected to be the reason for the reported confounding results. Actual area of different land uses can provide information on the magnitude of pollutants via runoff to a receiving water body and can, therefore, be a good WQ indicator as well.
Previous studies relating water quality to land use in the TGR (Three Gorges Reservoir) area are very limited. These studies concentrated on several catchments in the huge area of 58,000 km2. For instance, Huang et al. (2016) examined land use influences on seasonal water quality in the Hegou River, a small river with a drainage area of 144 ha. Ye et al. (2009) reported the influences of land use in addition to topography on water quality of the Xiangxi (drainage area of 3,099 km2). However, couplings between water quality and land use in the entire TGR region have not been well documented. Further, study on influences of multiple - riparian land use on water quality is still limited, which can be critical for sustainable catchment planning, management, and water conservation.
We explored multiple riparian-river connections using metrics as indicators of land uses in the entire TGR area. Two specific objectives are to 1) assess the effects of land use at various riparian zones on river water quality (e.g., the overall water quality (OWQ) and individual WQP), and 2) compare the difference of land use composition on riverine water quality prediction between using a land use percentage and an actual land use area. The study is a sequel to our previous study dealing with effects of land use (land use composition only presented as a percentage) on water quality seasonality in the region (Zhang et al., 2019). Our previous study (Zhang et al., 2019) tested for water quality and land use in the entire TGR region and also for two riparian strips (100 and 500 m), whist this study design could miss some specific information on multiple riparian effects on riverine water quality. Therefore, the current study focuses on elaborated various riparian strips with detailed land use indices. We test the hypotheses that landscape influences on water quality are scale dependent, and the effects of land use percentage and actual land use area are different. Our original contributions to literatures therefore include 1) defining the seasonal effects of the elaborated riparian land uses on OWQ and single WQP in the TGR area, and developing models of water quality, as well as 2) uniquely comparing the effects of land use percentage and actual land use area on river water quality in the TGR area.
The TGR area (105°44′–111°39′E, 28°32′–31° 44′N) that is located in the upper reach of the Yangtze River (Supplementary Figure S1) has an area of 5.8 × 10⁴ km2 (Zhang et al., 2019). The region has a typical subtropical monsoon climate, with 80% of precipitation falling from April to October (1,000 mm–1,400 mm of average annual precipitation). The average annual temperature here is approximately 17°C, the relative humidity is around 70% (Mao et al., 2017). The watershed drains a mountainous area with an elevation ranging from 40 to 2,800 m. This area is dominated by carbonate lithology. Three main soil types are yellow soil (Ferralosols in FAO taxonomy, Oxisols in USDA taxonomy), calcareous soil (Cambisols in FAO taxonomy, Inceptisols in USDA taxonomy), and purple soil (Regosols in FAO taxonomy, Entisol in USDA taxonomy), accounting for 16.3%, 34.1%, and 47.8%, respectively (Ma et al., 2016). Major agricultural crops in the TGR area include corn, peanuts, wheat, rice, tea, citrus and medicinal plants (Ma et al., 2016).
The main land uses are farmland and vegetation in the TGR area, and they respectively account for 36.7% and 60.5%, other land uses account for 2.0% (urban) and 0.8% (water) (Zhang et al., 2019). In the year of 2016, domestic sewage discharge is 1,212 × 109 kg, much higher than the industrial sewage discharge of 136 × 109 kg. Agricultural fertilizer application is 119.5 × 10⁶ kg (equivalent to 290 kg/ha), including 83 × 106 kg for N, 28 × 106 kg for P and 8.5 × 10⁶ kg for K. Pesticide use is 518.5 t (1.27 kg/ha), which includes organophosphorus pesticides (190.8 t) herbicide (80.3 t), carbamic ester pesticides (40 t), yrethrum ester pesticides (92.2 t), and others (115.2 t), and the agricultural practices are centered during May to October (data are from Annual Statistical Bulletin). Due to the Great Protection of the Yangtze River, sewage and industrial effluents treatments are ample in the upper TGR, while in the lower TGR, there is not existence of local domestic discharges in the mountainous area.
For analyzing the land use metrics influences on water quality, we subdivided the TGR area into seven sub-catchments based on the criteria of changing urban and farmland percent in each sub-catchment; they varied largely from 0.44% to 12.43% (urban) and from 12.23% to 63.98% (farmland). Consequently, main water quality variables are potentially highly variable. We supplied compositions of land use/land cover in the Supplementary Figure S2.
Two field trips were made on 47 tributaries in the dry (from late October to early November, 2015), and wet (late June to early July in the wet season, 2016) seasons. A total of 94 samples from 47 sampling points were collected in the middle stream and downstream of river networks, covering most of the tributaries of the TGR area (Supplementary Figure S1). Water samples were collected at a depth of 10–20 cm below water surface, subsequently were filtered using 0.7 μm filter papers (Whatman GF/F) on the sampling day, placed in pickled HDPE (high density polyethylene) bottles, and brought back to the laboratory for analysis in the same month.
Twelve water quality parameters were taken into account in this study. Water temperature (WT, °C), pH, electrical conductivity (EC, μS cm−1), oxidation-reduction potential (ORP, mv), and dissolved oxygen (DO, mg L−1) were measured in-situ using a portable multi-parameter water quality meter (HQ40d, HACH, United States). N speciation nitrate nitrogen (NO3−-N, mg L−1), total dissolved nitrogen (TDN, mg L−1) and total nitrogen (TN, mg L−1) were determined by digestion-UV spectrophotometric method. Ammonium nitrogen (NH4+-N, mg L−1) was measured by salicylic acid-hypochlorite photometric method. P species total dissolved phosphorus (TDP, mg L−1), and total phosphorus (TP, mg L−1) were determined by molybdenum-antimony anti-spectrophotometry. Potassium permanganate method was used for permanganate index (CODMn, mg L−1) analysis. The sample collection protocols and processing methods used in this study strictly followed the national standard methods for the analyses of water and wastewater in China (NEPB, 2002).
The land use map in 2015 was extracted from Landsat 8 Operational Land Imager (OLI) data (Nine tiles, paths/rows, 125/038, 125/039, 126/038, 126/039, 127/038, 127/039, 127/040, 128/039, 128/040) using a support vector machine (SVM) algorithm in ENVI 5.1 software (Exelis Visual Information Solutions, United States). The image of 2015 is considered to be similar to the image in the sampled year of 2016. Six categories of land uses were extracted, including forest land (i.e., wooded land and mixed forest land), farmland (i.e., paddy field and dry land), grass land, water area (i.e., rivers, reservoirs, weirs, lakes, ponds and sandy beach), urban land (i.e., residential, commercial and industrial regions), and unused land (i.e., gravels, bare rocks and bare ground) (Ding et al., 2016). The accuracy of classification was 87%, and the Kappa coefficient was about 0.81. We noted that the accuracy of land use classification can potentially have an influence on the relationships between water quality and land use indices, while the accuracy is comparable to studies elsewhere (Shi et al., 2017). This shortcoming exists but is not deeply discussed.
Similar to previous studies relating land use to water quality (Ding et al., 2016; de Mello et al., 2018), the replicates for these analyses were the sub-catchments (n = 7), and there were several sampling sites (n ranges from 4 to 10) within each subcatchment. The sampled waters (4–10 sampling points) are used to represent the water quality in each sub-catchment. Thus, we delineated our riparian strips, 50–500 m wide section on each side along the river bank of all water courses extending for the entire catchment. For comparing the effects of multiple scales of riparian land uses on water quality, land use indices were calculated for seven sub-catchments (SUB 1-SUB 7) delineated using digital elevation model (DEM) and administrative regionalization (Supplementary Figure S1) (Li et al., 2009). Multiple-riparian strips of 50, 100, 200, 300, 400, and 500 m were delineated using buffering commands in ArcMap 10.3 software (ESRI Company, United States), based on distance from the stream centerline by Nash et al. (2009). Land use proportions and metrics were then calculated (Table 1).
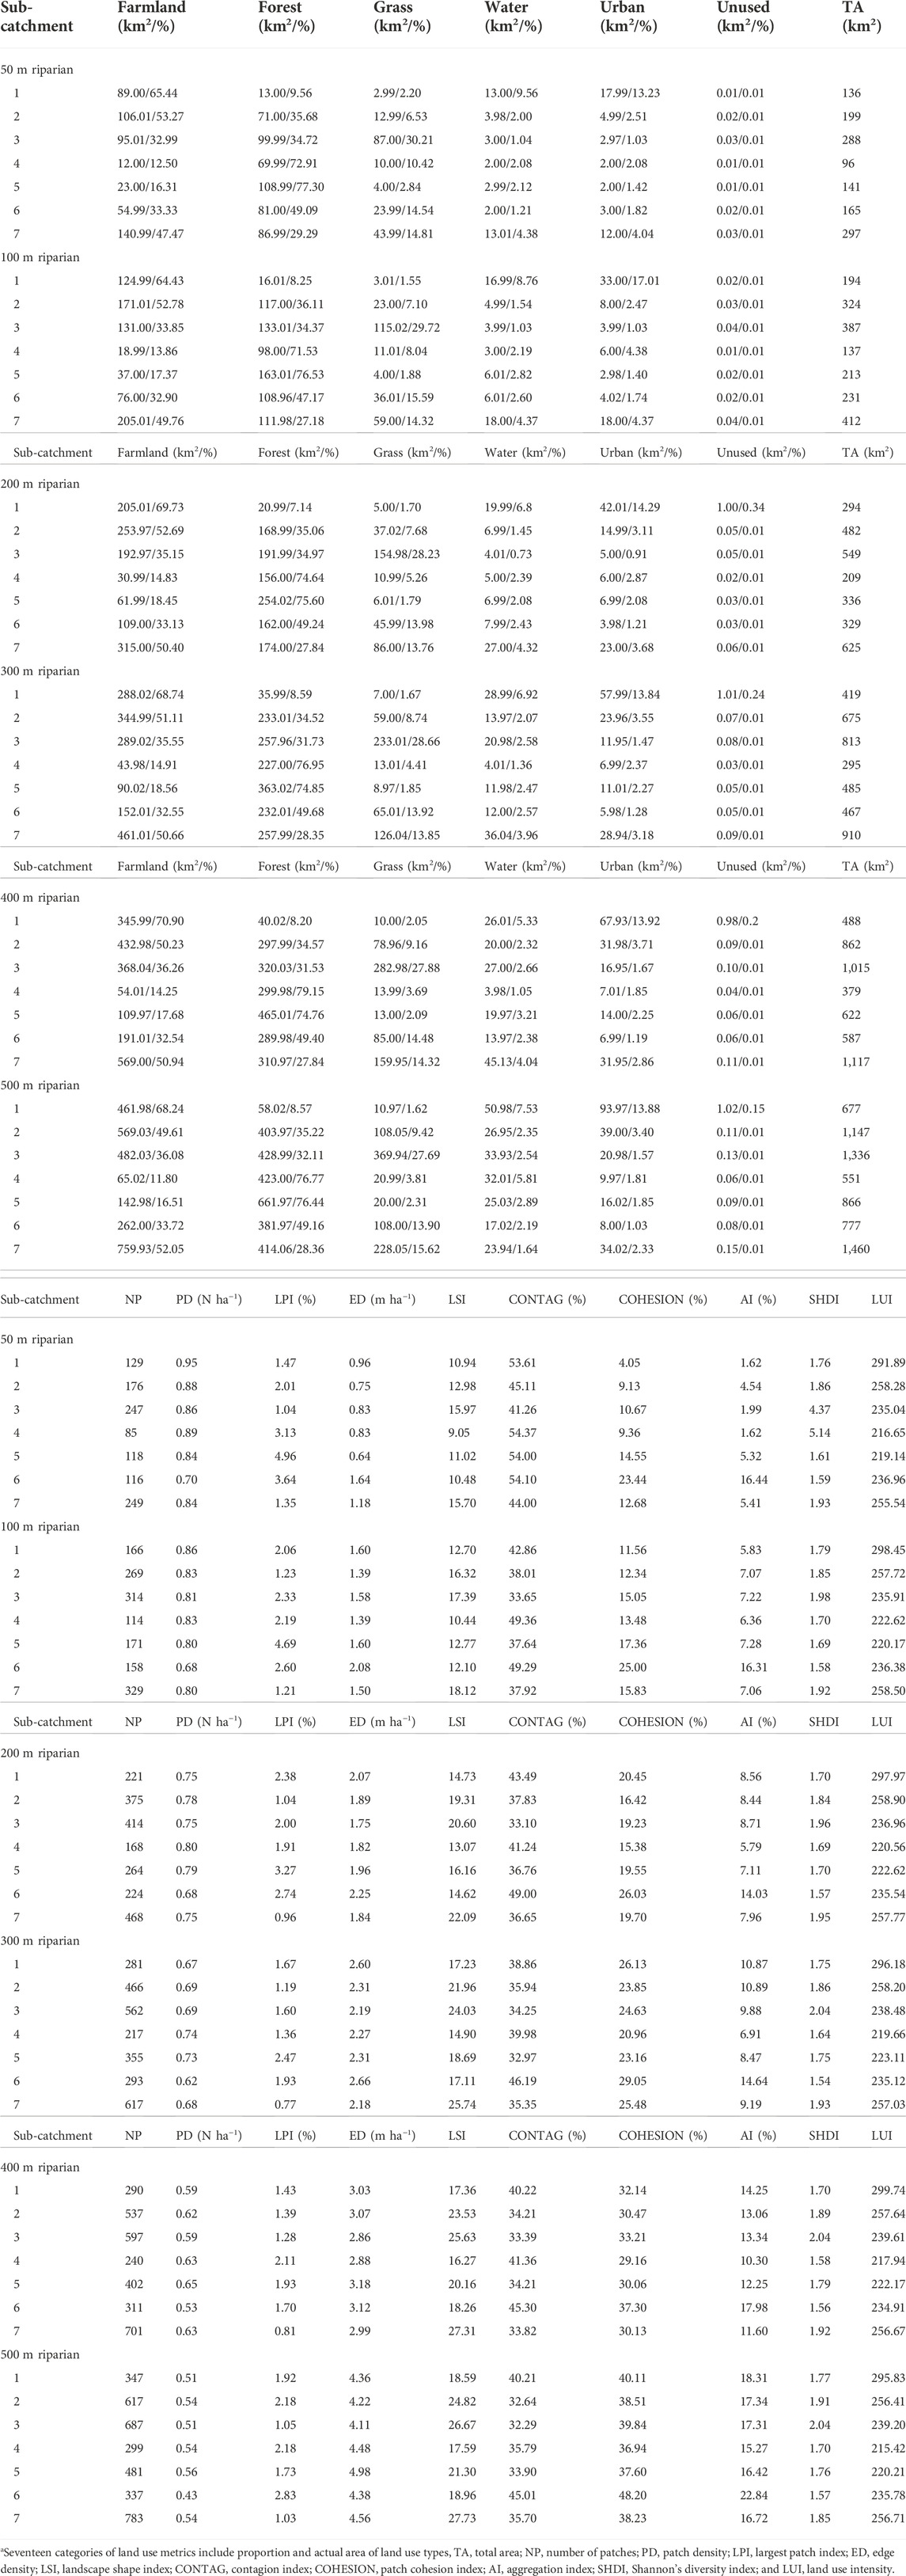
TABLE 1. Spatial changes of land use types, landscape metrics and LUI along multi-riparian zones of 50 m, 100 m, 200 m, 300 m, 400 m, and 500 m in the TGR area, China.
According to previous studies and field surveys (Zhang et al., 2019; Zhang et al., 2020), land use composition, configuration and intensity were quantified (Ding et al., 2016). Land uses included the percentage and actual area of classified land use compositions, total area (TA), landscape shape index (LSI), number of patches (NP), patch density (PD), patch cohesion index (COHESION), edge density (ED), largest patch index (LPI), aggregation index (AI), contagion index (CONTAG), Shannon’s diversity index (SHDI) and land use intensity (LUI). Details of these land use metrics can be found in Ding et al. (2016). Land use configurations were calculated with the FRAGSTATS V4.2.1 software (https://www.umass.edu/landeco/research/fragstats/fragstats.html). LUI (simply L) was computed following the reference Zhang et al. (2019). Where, authors designated the value of land use degree of variable land use types.
We separately analyzed the data in the dry and wet seasons. The Kolmogorov-Smirnov test was conducted to examine the normality of data, and logarithm was used for the data showing non-normal distribution when normalization of data is needed (i.e., analysis of variance, ANOVA). The non-parametric test of Mann-Whitney U test without normalizing was employed to compare seasonal variations in water quality. The ANOVA was applied to test differences in land use indices and WQPs among sub-catchments with a statistical significance at p < 0.05 level (least-significance difference, LSD). Redundancy analysis (RDA) is used to examine the relationship of land use metrics and WQPs and the explanations of land use metrics on OWQ are quantified. Before using RDA, DCA (de-trended correspondence analysis) was performed to test the gradient length of the 4 ordination axes. The longest gradient of the four ordination axes was smaller than 3 at each riparian zone.
For regression models of water quality, WQPs were used as responsible variables and land use indices were used as predictor variables (Li and Zhang, 2010; de Mello et al., 2018; Li et al., 2018). Because of the potential multicollinearity of predictor variables, we need to evaluate the multi-collinearity. Firstly, we did the correlation analyses between land use metrics (land use types and landscape indicators) before variables chosen for model development, and coefficients >0.8 were considered as multicollinearity effects. Second, we did the correlations of water quality and land use metrics to get potential variables for models. Six predictor variables including urban, ED, CONTAG (or TA or NP or LSI or LPI), COHESION (or PD or AI), SHDI, L (or farmland or forest) apply to the multiple regression analyses. Therefore, the replicates (seven sub-catchments), the number of response variables (water quality variables), and predictor variables (six) meet the statistical standard for multiple linear regression models (MLR) (Legendre and Legendre, 2012). RDA was run on the program of CANOCO 5.0 (Microcomputer Power Company, NY, United States). Other statistics were carried out using SPSS 18.0 (IBM Company, NY, United States).
Multi-scale analyses of land uses are listed in Table 1. The main land use compositions were farmland and forest land. Farmland showed the largest percentage in SUB 1 and the largest actual area in SUB 7, but the smallest percentage and actual area in SUB 4. Forest land had the largest percentage in SUB 4, but the smallest percentage and actual area in SUB 1. Grass land showed the smallest percentage and actual area in SUB 1, but the largest percentage and actual area in SUB 3. Water area, urban and unused lands accounted for the highest percentage and actual area in SUB 1 at multiple-riparian zones. Overall, intensive land uses such as farmland and urban land accounted for 39.4% and 3.4% at 50 m riparian, 40.3% and 4.0% at 100 m riparian, 41.4% and 3.6% at 200 m riparian, 41.1% and 3.6% at 300 m riparian, 40.8% and 3.5% at 400 m riparian, and 40.3% and 3.3% at 500 m riparian zones, respectively.
Regarding land use configurations, values of NP, ED, LSI, COHESION and AI considerably increased as riparian width increased (Table 1). The nonparametric Mann-Whitney U test showed that land use types and land use configuration metrics had significant spatial differences within varied riparians (p < 0.05) (Table 1).
Water quality variables shifted across the seasons and sub-catchments (Figure 1). The non-parametric Mann-Whitney U test revealed that two water quality variables of DO and TDN showed significant wet and dry seasonal differences with a degree of significance of 0.05, the other 6 variables of WT, ORP, EC, TP, TDP, and NH4-N did so with a p value less than 0.01. These variables with an exception of WT showed much higher concentrations in the dry season. The highest average concentrations of TDN (2.6 ± 0.4 mg L−1) and TN (3.1 ± 0.6 mg L−1) occurred in SUB 4, where Yichang City and urbans of Badong and Zigui are located. The lowest means of ORP, DO and the highest means of EC, CODMn and NH4+-N appeared in SUB 1, located in downtown Chongqing municipality (Figures 1, 2).
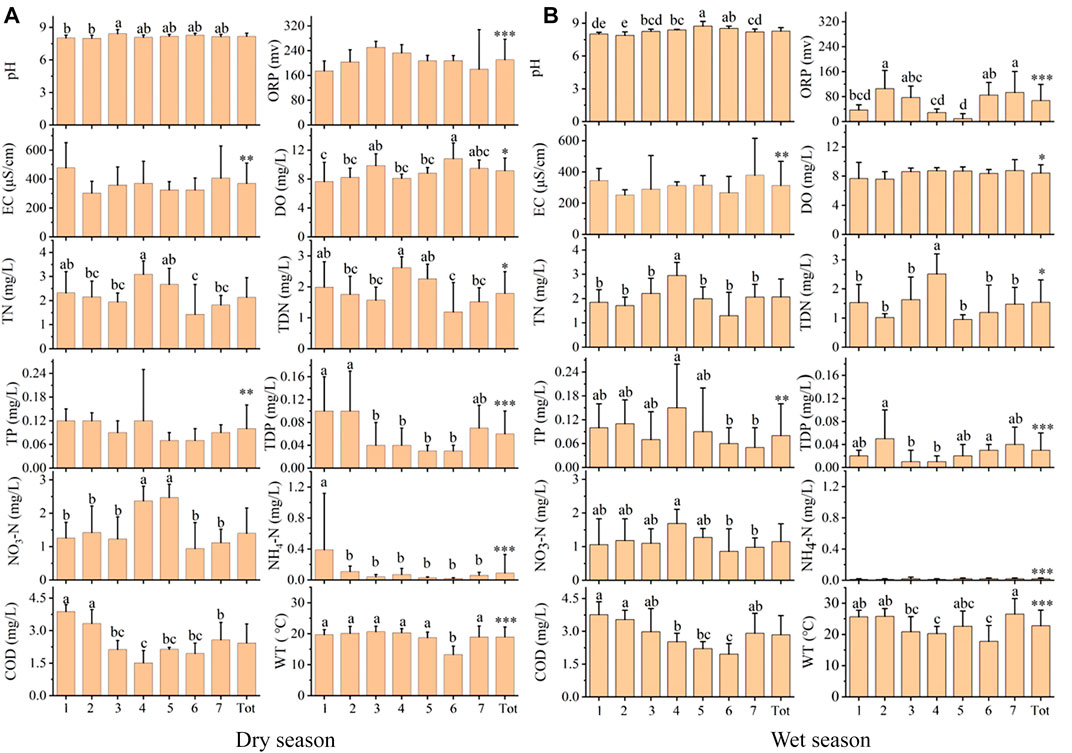
FIGURE 1. Spatial and temporal changes in water quality variables (different letters indicate significant differences among sub-catchments; asterisks indicate significant differences between dry and wet seasons with * at p < 0.05 level, ** at p < 0.01 level, and *** at p < 0.001 level). (A) Dry season (B) Wet season.
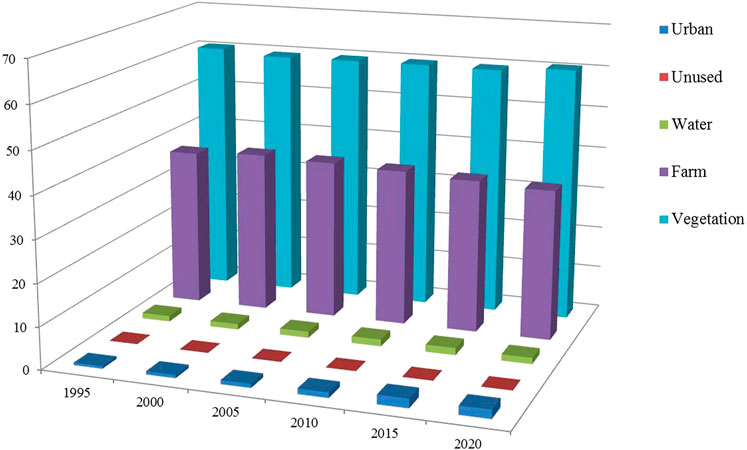
FIGURE 2. Land use/land cover changes from 1985 to 2020 in the TGR area.
The OWQ (overall water quality) could be well explained by the first two canonical axes from land use compositions both as the actual area and percentage (Table 2). The first two axes could explain (60%–85%) the water quality variation. The first axis explained 41%–80%, and the second axis explained 3%–38% of the OWQ. The explanatory variables were different. For the land use proportions, the most significant explanatory variables (MSEVs) were LPI (40.4%–60.0%) in the wet season and farmland (39.3%–40.3%) in the dry season over multiple riparian scales (Table 2a). PD appeared 4 times as one of the most important explanatory variables in the dry season. For the wet season, AI appeared three times as one of the most important explanatory variables. The variation was slightly better expounded by all of the canonical axes in the 50 m riparian zone than other riparians (Table 2a), and was slightly better explained in the wet season in comparison to the dry season, except for the 500 m riparian zone (Table 2a).
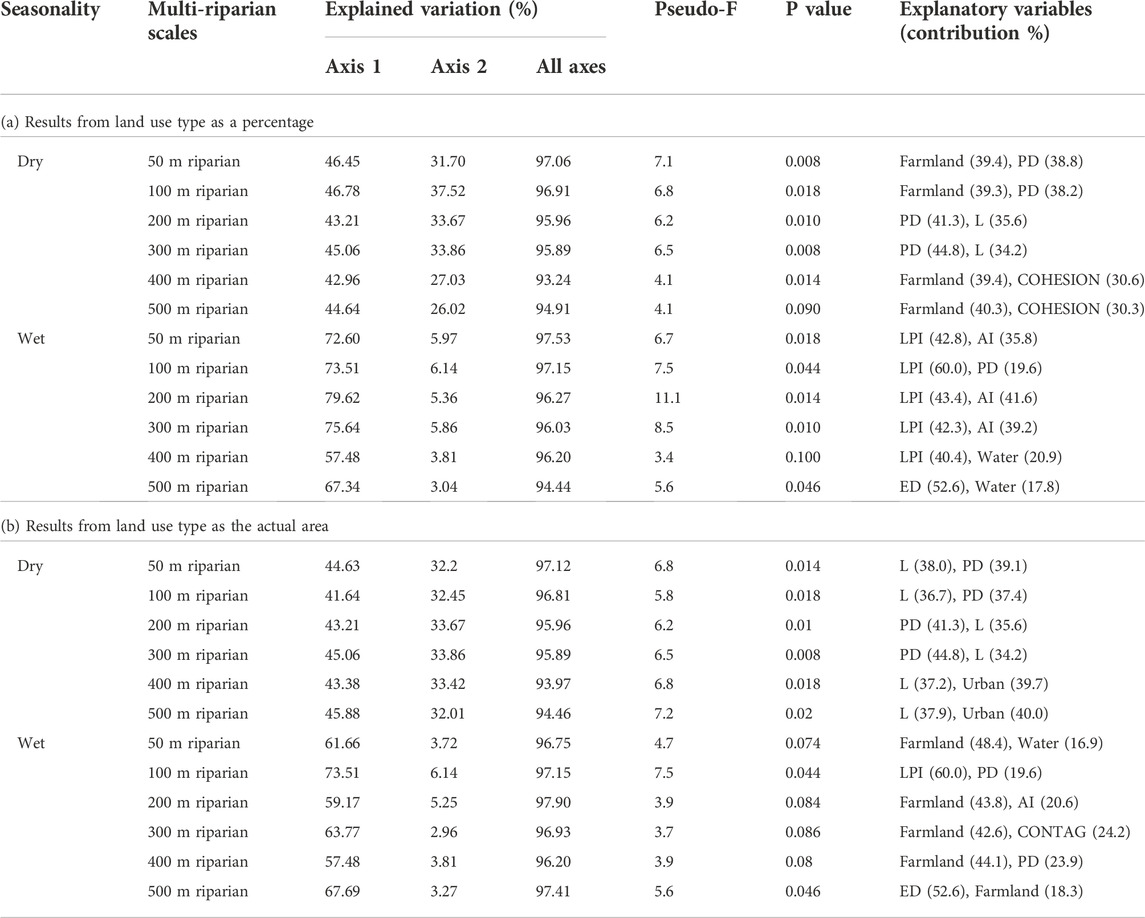
TABLE 2. RDA results for the overall water quality variance explained by the explanatory variables (explanatory variables include the percentage of land use types, TA, NP, PD, LPI, ED, LSI, CONTAG, COHESION, AI, SHDI, and L).
As for land use presented in actual area, the MSEVs were farmland (42.6%–48.4%) in the wet season and LUI (36.7%–38.0%) in the dry season (Table 2b). The variation was slightly better explained in the wet season when compared to the dry season, with an exception of 50 m riparian zone (Table 2b), and the explained variance of OWQ was generally higher in the 50 m riparian zone during the dry season, whilst, the variance explained was higher along 200 m riparian in the wet season (Table 2b).
Correlation analyses indicated that percentages of farmland, forest and L had significant and negative relationships among them. Five variables of CONTAG, TA, NP, LSI, and LPI showed significant relationships among them. COHESION, PD and AI had significant relations amongst them (Supplementary Table S1). This helps to test their multi-collinearity when they were considered as predictor variables for model development.
Correlations of water quality variables and land use metrics were variable and highly dependent on seasonality and riparian zones (Supplementary Table S1). For land use proportions, land use types were better related to water quality variables in the dry season than in the wet season. For 300-m riparian zone as an example, urban appeared seven times as variable that was significantly related to water quality variables, while farmland appeared two times in the dry season. In the wet season, urban and farmland percent was negatively to pH, and positively to COD. When land use was presented as actual area, urban land was positively related to COD in both the dry and wet seasons at 300 m, 400 m, and 500 m riparian scales (Supplementary Table S1). Overall, land use percent in the dry season had stronger correlations with water quality variables than in the wet season, also than land use presented by actual area in the wet and dry seasons, and urban had stronger correlations with water quality variables than forest.
In terms of land use configurations, there were more correlated pairs between COHESION and L and WQPs in 50-m, 100-m, and 300-m riparian scales, while in the 200-m riparian zone, there were more correlated pairs between PD and L and WQPs, and in the 400-m and 500-m riparian zones, land use configurations metrics appeared less times as variable that was significantly related to WQPs. Overall, land use configuration metrics seemed to appear more times as variables that were significantly related to WQPs in the dry season than in the wet season, while land use configurations in the increased width of riparians appeared less times as variables that were significantly related to WQPs.
MLR models (Table 3) demonstrated more models of WQPs by land use metrics in the dry season as compared with the wet season, for instance, eight WQPs were modeled in the dry season regardless of land use presented by percent and actual area within 50 m riparian zone, whilst, five or six WQPs were modeled in the wet season. The predictor variables were highly variable when land use proportion and land use presented by actual area were compared. Land use in the increased width of riparians from 50 m to 200 m seemed to could well predict WQPs in the dry season, while predictable capacity of land use within 400 m riparian largely declined.
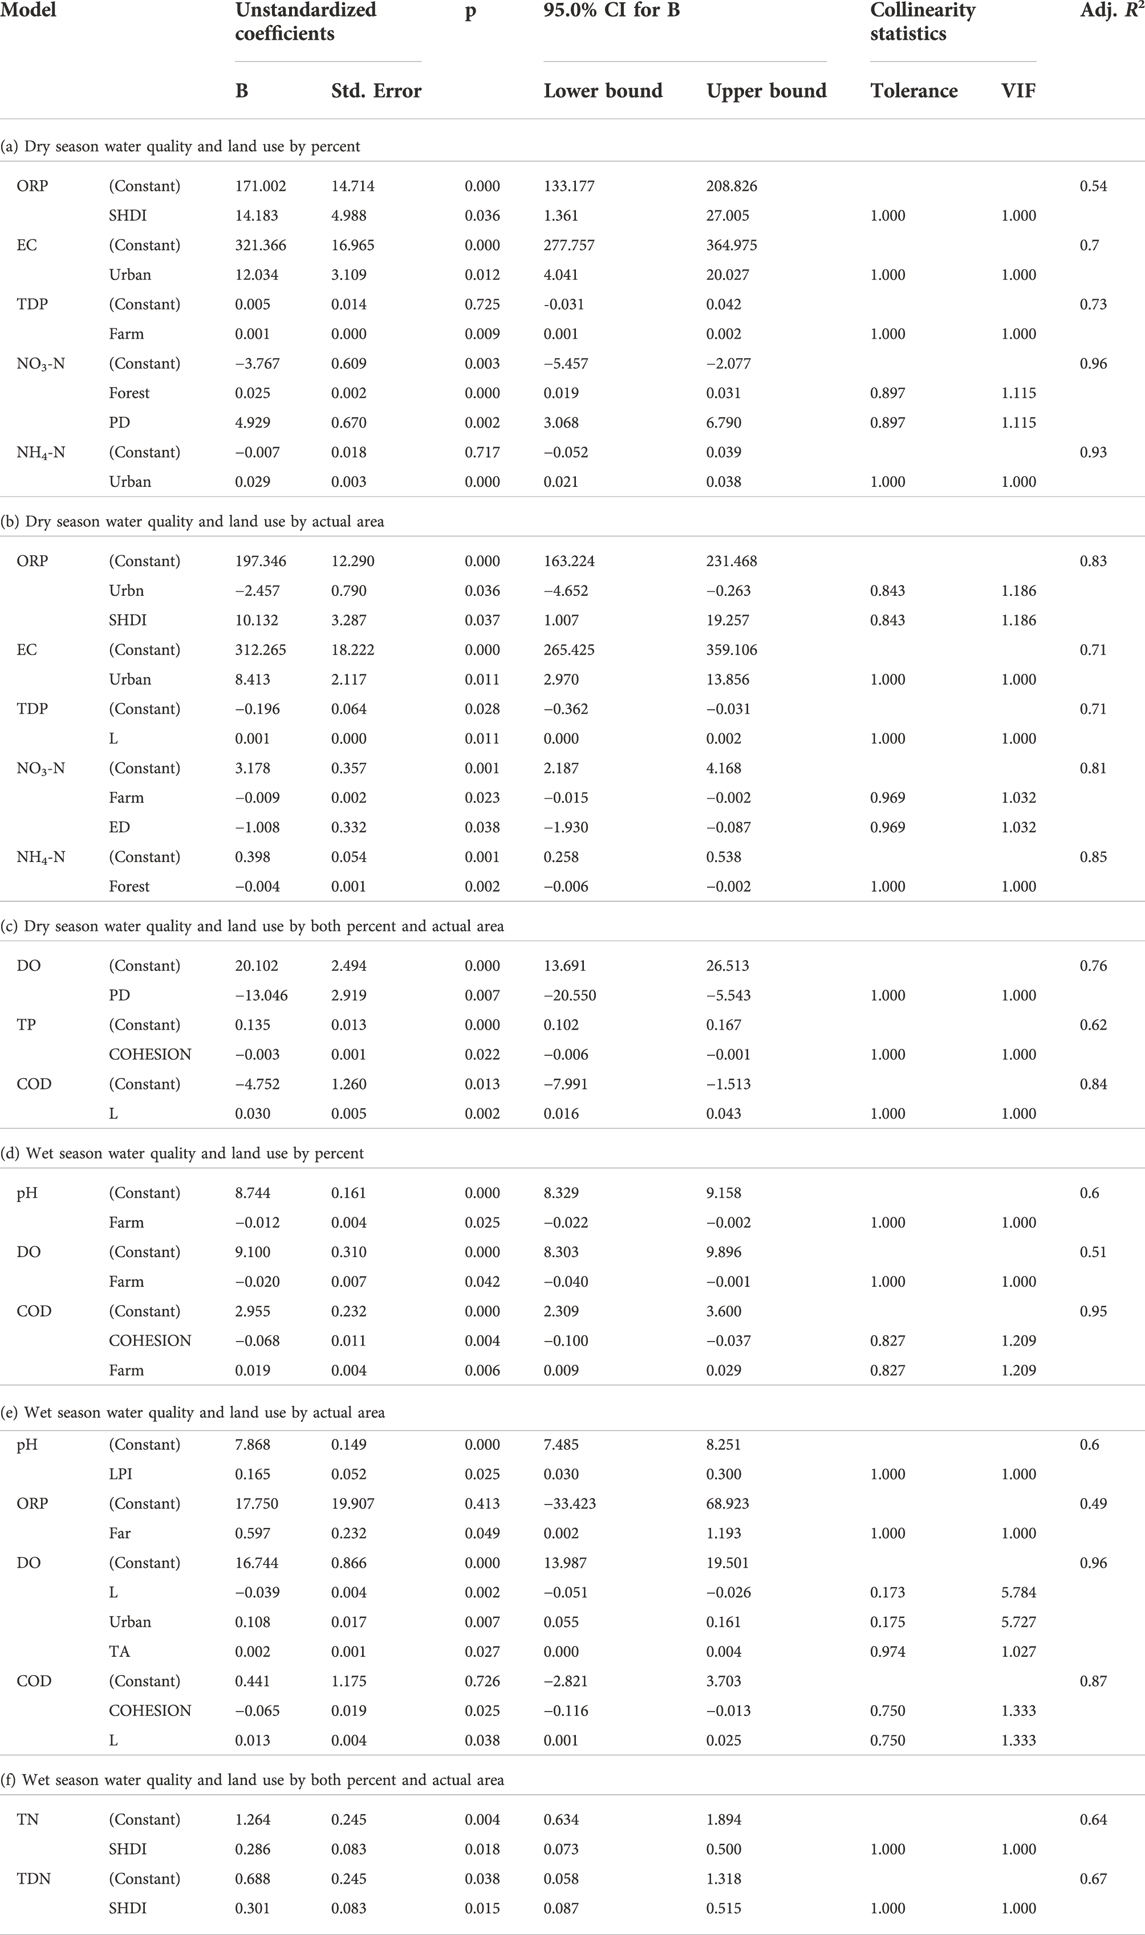
TABLE 3. Water quality parameter models developed from land use types and landscape metrics (50 m riparian is listed, and others of 200 m riparian and 400 m riparian are listed in supporting material).
When land use proportion was considered, urban could predict EC and NH4-N, L could predict COD in the dry season, while in the wet season, pH was modeled by farm in varied riparians. TN and TDN were modeled by SHIDI within 50 m riparian, and TN by AI in 200 and 400 m riparians (Table 3; Supplementary Table S2).
In terms of land use presented as actual area, in the 50 m riparian, both urban and L appeared two times as predictor variables in the dry season, L and SHDI appeared two times in the wet season. Urban appeared three times in both the 200 m and 400 m riparians during the dry season, but AI was the most important predictor variable in the wet season.
Land uses such as agriculture and urbanization cause a decline in riverine water quality, while forested land can improve water quality (Supplementary Table S1). This is understandably because that farmland and urban lands are more prone to non-point sources (NPS) pollution (Shi et al., 2017). Previous studies yielded similar findings (Li et al., 2009; Uriarte et al., 2011). Nonetheless, it is noting that in urban reaches, point sources also have a drastic effect on water quality. In farmland region, increased inputs of pesticides, organic and inorganic fertilizers, as well as soil erosion by agricultural activities contribute more NPS pollution to rivers (Shang et al., 2015). This is corroborated by thatfarmland had positive correlation with TDP and COD, and negative correlation with pH at varied riparian scales (Supplementary Table S1). As expected, urban land positively contributed to P, NH4-N, and COD, which is consistent with the strong positive linkages between nitrogen concentration and urban land by Shi et al. (2017). Nitrates, however, tend to decrease as this form dominates in more oxygenated waters downstream from urban point or nonpoint pollution sources (Marti et al., 2004). We found stronger correlations between urban land and WQPs in the dry season rather than in the wet season; this is ascribed to the fact that more rain runoff induced pollutants could mask their associations in the wet season. In addition, natural source to N should be considered in some river networks because of large contribution to nitrate (Li et al., 2022).
Compared to urban and farmland, forested land has been reported to largely reduce nutrient leaching into groundwater and surface water by absorption and assimilation, minimizes soil erosion and traps sediments (Xu et al., 2013; Li et al., 2008). Forest land thus negatively contributed to several WQPs of P and COD, while positively contributed to pH and DO (Supplementary Table S1). Given the fact that water area and unused land are smaller, we do not analyze their effects of water quality. Nevertheless, prior study reported that water area can partially remove nutrients through nitrification, sediment sorption, autotrophic respiration and heterotrophic assimilation (Li et al., 2012) especially in the area large surface-to-volume ratio.
We find that the impacts of land use compositions presented as percentage and actual area on water quality are highly variable (Table 1). For instance, 65.4% and 47.5% of the farmland in the two sub-catchments (SUB-1 vs. SUB-7) corresponds to the actual area of 89.0 km2 and 140.9 km2 at 50 m riparian zone, respectively, the influence of the former might be lower than the latter because of the smaller actual area of farmland. Therefore, we propose that effects of land use compositions as percentage and actual area on WQPs should be comparatively examined. Our study shows that land use compositions as actual area exert great effects on water quality, for instance, urban largely contributed to P species, NH4-N and COD within 100 m buffer (Supplementary Table S1). But to date, land use composition influences as actual area on water quality are not studied, to the best of our knowledge.
The spatial patterns of land use configurations are reported to play important roles in mediating ecological processes (i.e., nutrient cycles and energy flows) (Van Nieuwenhuyse et al., 2011), thereby resulting in varied linkages of land use configuration metrics with WQPs. For instance, TP is significantly related to COHESION, PD and AI, as well as TDP is related to COHESION (Supplementary Table S1). AI shows effective ability to absorb and fix pollutants, as reflected by their negative associations with TP and NH4-N, which also supports the prior study that vegetation is effective for nutrient fix (Ding et al., 2016).
NO3−-N is strongly associated with several landscape indices (i.e., ED in 50 m buffer, PD in 200 m buffer, PD and COHESION in 300 m buffer in both seasons (Supplementary Table S1). PD, a fragmentation index, represents the distribution of small piece of human land use (Shi et al., 2017). This corroborated by the very strong positive relationship between NO3-N and PD within 200 m buffer. COHESION represents the physical connectivity diversity of patches and is impacted by land uses of farmland and urban land, thereby largely routing riverine water quality.
ED is similar to PD as a fragmentation index, their higher levels mean more small-area blocks. Thus, ED is negatively related to NO3-N (50 m buffer), TN (200 and 300 m buffer) and TDN (400 m buffer), respectively (Supplementary Table S1). Land use intensity (LUI) reflects the degree of land development in an area, thus has a substantial effect on river ecosystem (Van Meerbeek et al., 2014). This could be reflected by the positive relationships between human land use (farmland and urban) and several key parameters of chemical pollutants (COD, pH, TDP; Supplementary Table S1). High LUI results in a severer eco-environmental deterioration, leading to more terrestrial sources to rivers, as reflected by positive relationships between LUI and CODMn (Supplementary Table S1).
Similar to prior studies by Sliva and Williams (2001) and Shi et al. (2017), we also observe that land use indices could slightly better explain OWQ in the wet season than in the dry season (Table 2). However, our previous study revealed that OWQ was slightly better explained by land use indices during the dry season (Zhang et al., 2019). This could be due to the difference in the selected land use indices and WQPs of interest. Our findings evidence that WQPs should be scrutinized for exploring land use influences on water quality, and more studies relating to multi-scale analysis of riparian land use on WQPs remains to be appreciated.
The RDA results identify the varied effects of land use on OWQ at multi-riparian scales (Table 2). We show that the overall water quality is slightly better explained by land use in the 50 m riparian zone (Table 2a). This implies that riparian that is closer to the water body showed the stronger influence of land use on riverine water quality. Shi et al. (2017) and Mwaijengo et al. (2020) also obtained the similar finding that riparian land use is superior to catchment and reach scales to explain the OWQ. However, Ding et al. (2016) reported that the OWQ is better explained by the catchment scale land use. Therefore, caution should be made for more representative regions with respect to land use effect on water quality.
MLR models demonstrated that land use metrics (including land use types and land configuration) better predicted water quality parameters in the dry season rather than in the wet season (Table 3). We found that predictor variables of land use metrics were changeable in the same season when land use represented as actual area is considered in comparison to land use proportions in individual riparian scale. For instance, NO3-N was predictable by forest and PD when land use is presented as percentage, while by farm and ED when land use is presented as actual area within 50 m riparian. It is worth noting that WQPs were overall better explained at 50 m riparian zone. Land use presented as percentage and actual area, as well as land use configuration should be integrated for land management on water quality conservation.
Seasonal effects of land use on water quality from RDA and MLR models are consistent (Tables 2, 3). RDA shows that land use has a slightly greater impact on OWQ at the 50 m riparian scale (Table 2) than other riparians, nevertheless, land use presented by actual area in varied riparian had comparable variation explained in the wet season, and MLR model shows that 50 m riparian land use appears to predict the WQPs well (Table 3). For instance, eight WQPs were predictable using 50 m riparian land use metrics in the dry season. However, RDA has taken into account the mutual influence and internal interaction among the WQPs. Previous studies also showed the interactions among the WQPs (Shi et al., 2017). We suggest that how to better predict land use effects on water quality is merited.
Long-term changes in land use/land cover in this area are presented (Figure 2), and their potential effects of water quality are analyzed. Urban land increased from 0.6% in 1995 to 2.2% in 2015 or 2020, which could increase the loadings of solutes and N species based on our regression models. The land use configuration also could regulate water quality parameters, for instance, NP and ED could decrease the nitrogen levels, while COHESION could decrease phosphorus levels. Our study demonstrates that we could regulate terrestrial nutrients outputs to aquatic systems using spatial planning of land use/land cover, particularly the location of urban land. Riparian zones with a width of 50–200 m are crucial for water quality conservation and predication under a framework of urbanization. For instance, farmland and urban positively contributed to phosphorus and COD (Supplementary Table S1). Thus, we suggest the importance of riverbanks in the conservation of water quality, and riverbank restoration strategies to improve water quality. Furthermore, human land uses largely regulate biogeochemical process of dissolved organic carbon (Zhang et al., 2022), and clearly increase aquatic greenhouse gases emission (Tang et al., 2021; Gu et al., 2022). Land use planning and landscape strategy is the core of reduction of pollution and carbon emission. Allan, 2004, Li et al., 2015.
We elaborate land use effects at multi-riparian zones on riverine water quality, and for the first time, investigate the difference in predicting river water quality between using land use composition percentage and actual area in a subtropical monsoonal area of 58,000 km2 in China’s Three Gorges Reservoir Area. Land use can slightly better predict the overall water quality (OWQ) in the wet season, rather than in the dry season. The explanation of land use (land use compositions presented as both percentage and actual area) on OWQ is slightly better in 50 m riparian zone. Multiple linear regression models demonstrate more models of individual water quality parameter (WQP) in the dry season rather than in the wet season, and 50 m riparian could well predict WQP. The model of individual WQP is highly dependent on seasonality, riparian zone and representation of land use indices (i.e., actual area or percentage). We also find the predictor variables of land use metrics are changeable when seasonality and varied riparian land use are considered. We also highlight that the OWQ is slightly better predicted by land use composition as the actual area than by land use composition as a percentage. This study provides a crucial investigation of multiple-scale analysis of land use impacts on riverine water quality in the TGR area. High sampling frequencies and high spatial resolution of digital maps, as well as selected parameters are required to achieve models in future work. We further suggest that land use configuration and composition using both percentage and actual area are needed to be comparatively studied for better predicting land use effects on stream water quality.
The original contributions presented in the study are included in the article/Supplementary Material, further inquiries can be directed to the corresponding author.
SL: Conceptualization, experimental design, sampling; SL, JZ, and LZ: Data compilation and data analysis; SL and JZ: Drafting and editing of the manuscript; All authors commented on the manuscript and approved it for publication.
This research was supported by the startup funding from Wuhan Institute of Technology (21QD02).
We are grateful to Drs. Rong Mao, Maofei Ni, and Mr. Jiachen Luo for their help in the field work. We are also grateful to the Editor, Prof. José Santos and three reviewers for their constructive comments and suggestions.
The authors declare that the research was conducted in the absence of any commercial or financial relationships that could be construed as a potential conflict of interest.
All claims expressed in this article are solely those of the authors and do not necessarily represent those of their affiliated organizations, or those of the publisher, the editors and the reviewers. Any product that may be evaluated in this article, or claim that may be made by its manufacturer, is not guaranteed or endorsed by the publisher.
The Supplementary Material for this article can be found online at: https://www.frontiersin.org/articles/10.3389/fenvs.2022.1013318/full#supplementary-material
Allan, J. D. (2004). Landscapes and riverscapes: The influence of land use on stream ecosystems. Annu. Rev. Ecol. Evol. Syst. 35, 257–284. doi:10.1146/annurev.ecolsys.35.120202.110122
Basnyat, P., Teeter, L. D., Flynn, K. M., and Lockaby, B. G. (1999). Relationships between landscape characteristics and nonpoint source pollution inputs to coastal estuaries. Environ. Manag. 23, 539–549. doi:10.1007/s002679900208
Bierschenk, A. M., Savage, C., Townsend, C. R., and Matthaei, C. D. (2012). Intensity of land use in the catchment influences ecosystem functioning along a freshwater-marine continuum. Ecosystems 15, 637–651. doi:10.1007/s10021-012-9536-0
Chillo, V., Vazquez, D. P., Amoroso, M. M., and Bennett, E. M. (2018). Land-use intensity indirectly affects ecosystem services mainly through plant functional identity in a temperate forest. Funct. Ecol. 32, 1390–1399. doi:10.1111/1365-2435.13064
de Mello, K., Valente, R. A., Randhir, T. O., dos Santos, A. C. A., and Vettorazzi, C. A. (2018). Effects of land use and land cover on water quality of low-order streams in Southeastern Brazil: Watershed versus riparian zone. Catena 167, 130–138. doi:10.1016/j.catena.2018.04.027
Diggelen, R. V., Sijtsma, F. J., Strijker, D., and van den Burg, J. (2005). Relating land-use intensity and biodiversity at the regional scale. Basic Appl. Ecol. 6, 145–159. doi:10.1016/j.baae.2005.01.004
Ding, J., Jiang, Y., Liu, Q., Hou, Z., Liao, J., Fu, L., et al. (2016). Influences of the land use pattern on water quality in low-order streams of the dongjiang river basin, China: A multi-scale analysis. Sci. Total Environ. 551, 205–216. doi:10.1016/j.scitotenv.2016.01.162
Erb, K. H., Haberl, H., Jepsen, M. R., Kuemmerle, T., Lindner, M., Müller, D., et al. (2013). A conceptual framework for analysing and measuring land-use intensity. Curr. Opin. Environ. Sustain. 5, 464–470. doi:10.1016/j.cosust.2013.07.010
Gu, S. J., Li, S. Y., and Santos, I. R. (2022). Anthropogenic land use substantially increases riverine CO2 emissions. J. Environ. Sci. 118, 158–170. doi:10.1016/j.jes.2021.12.040
Huang, Z. L., Han, L. Y., Zeng, L. X., Xiao, W. F., and Tian, Y. W. (2016). Effects of land use patterns on stream water quality: A case study of a small-scale watershed in the three Gorges reservoir area, China. Environ. Sci. Pollut. Res. 23, 3943–3955. doi:10.1007/s11356-015-5874-8
Johnson, L. B., Richards, C., Host, G. E., and Arthur, J. W. (1997). Landscape influences on water chemistry in Midwestern stream ecosystems. Freshw. Biol. 37, 193–208. doi:10.1046/j.1365-2427.1997.d01-539.x
Julian, J. P., de Beurs, K. M., Owsley, B., Davies-Colley, R. J., and Ausseil, A. G. E. (2017). river water quality changes in New Zealand over 26 years: Response to land use intensity. Hydrol. Earth Syst. Sci. 21, 1149–1171. doi:10.5194/hess-21-1149-2017
Kleijn, D., Kohler, F., Ba´ldi, A., Bata´ry, P., Concepcio´n, E. D., Clough, Y., et al. (2009). On the relationship between farmland biodiversity and land-use intensity in Europe. Proc. R. Soc. B 276, 903–909. doi:10.1098/rspb.2008.1509
Li, S. Y., Bush, R. T., Santos, I. R., Zhang, Q. F., Song, K. S., Mao, R., et al. (2018). Large greenhouse gases emissions from China's lakes and reservoirs. Water Res. 147, 13–24. doi:10.1016/j.watres.2018.09.053
Li, S. Y., Gu, S., Liu, W. Z., Han, H. Y., and Zhang, Q. F. (2008). Water quality in relation to land use and land cover in the upper Han River Basin, China. Catena 75, 216–222. doi:10.1016/j.catena.2008.06.005
Li, S. Y., Gu, S., Tan, X., and Zhang, Q. F. (2009). Water quality in the upper Han River basin, China: The impacts of land use/land cover in riparian buffer zone. J. Hazard. Mater. 165, 317–324. doi:10.1016/j.jhazmat.2008.09.123
Li, S. Y., Jiang, H., Xu, Z. F., and Zhang, Q. F. (2022). Backgrounds as a potentially important component of riverine nitrate loads. Sci. Total Environ. 838, 155999. doi:10.1016/j.scitotenv.2022.155999
Li, S. Y., Xia, X. L., Tan, X., and Zhang, Q. F. (2013). Effects of catchment and riparian landscape setting on water chemistry and seasonal evolution of water quality in the upper Han River Basin, China. Plos One 8, e53163. doi:10.1371/journal.pone.0053163
Li, S. Y., and Zhang, Q. (2010). Spatial characterization of dissolved trace elements and heavy metals in the upper Han River (China) using multivariate statistical techniques. J. Hazard. Mater. 176, 579–588. doi:10.1016/j.jhazmat.2009.11.069
Li, S. Y., Zhang, Y. L., and Zhang, Q. F. (2012). Interaction of landscape setting and stream flow seasonality on nitrogen concentrations in a subtropical river, China. Acta oecol. (Montrouge). 44, 38–45. doi:10.1016/j.actao.2011.08.005
Li, Y., Li, Y. F., Qureshi, S., Kappas, M., and Hubacek, K. (2015). On the relationship between landscape ecological patterns and water quality across gradient zones of rapid urbanization in coastal China. Ecol. Model. 318, 100–108. doi:10.1016/j.ecolmodel.2015.01.028
Ma, X., Li, Y., Li, B. L., Han, W. Y., Liu, D. B., and Gan, X. Z. (2016). Nitrogen and phosphorus losses by runoff erosion: Field data monitored under natural rainfall in Three Gorges Reservoir Area, China. Catena 147, 797–808. doi:10.1016/j.catena.2016.09.004
Mao, R., Chen, H. M., and Li, S. Y. (2017). Phosphorus availability as a primary control of dissolved organic carbon biodegradation in the tributaries of the Yangtze River in the Three Gorges Reservoir Region. Sci. Total Environ. 574, 1472–1476. doi:10.1016/j.scitotenv.2016.08.132
Marti, E., Aumatell, J., Godé, L., Poch, M., and Sabater, F. (2004). Nutrient retention efficiency in streams receiving inputs from wastewater treatment plants. J. Environ. Qual. 33, 285–293. doi:10.2134/jeq2004.2850
Mwaijengo, G. N., Msigwa, A., Njau, K. N., Brendonck, L., and Vanschoenwinkel, B. (2020). Where does land use matter most? Contrasting land use effects on river quality at different spatial scales. Sci. Total Environ. 715, 134825. doi:10.1016/j.scitotenv.2019.134825
Nash, M. S., Heggem, D. T., Wade, T. G., and Hall, R. K. (2009). Multi-scale landscape factors influencing stream water quality in the state of Oregon. Environ. Monit. Assess. 156, 343–360. doi:10.1007/s10661-008-0489-x
National Environmental Protection Bureau (Nepb), (2002). Standard methods for the examination of water and wastewater (version 4). Beijing: China Environmental Science Publish Press. in Chinese.
Ometo, J. P. H. B., Martinelli, L. A., Ballester, M. V., Gessner, A., Krusche, A. V., Victoria, R. L., et al. (2000). Effects of land use on water chemistry and macroinvertebrates in two streams of the Piracicaba river basin, south-east Brazil. Freshw. Biol. 44, 327–337. doi:10.1046/j.1365-2427.2000.00557.x
Peterjohn, W. T., and Correll, D. L. (1984). Nutrient dynamics in an agricultural watershed: Observations on the role of a riparian forest. Ecology 65, 1466–1475. doi:10.2307/1939127
Piney, G., Bernal, S., Abbott, B. W., Lupon, A., Marti, E., Sabater, F., et al. (2018). Riparian corridors: A new conceptual framework for assessing nitrogen buffering across biomes. Front. Environ. Sci. 6, 47. doi:10.3389/fenvs.2018.00047
Shang, F. Z., Ren, S. M., Yang, P. L., Li, C. S., and Ma, N. (2015). Effects of different fertilizer and irrigation water types, and dissolved organic matter on soil C and N mineralization in crop rotation farmland. Water Air Soil Pollut. 226, 396. doi:10.1007/s11270-015-2667-0
Shi, P., Zhang, Y., Li, Z. B., Li, P., and Xu, G. C. (2017). Influence of land use and land cover patterns on seasonal water quality at multi-spatial scales. Catena 151, 182–190. doi:10.1016/j.catena.2016.12.017
Sliva, L., and Williams, D. D. (2001). Buffer zone versus whole catchment approaches to studying land use impact on river water quality. Water Res. 35, 3462–3472. doi:10.1016/s0043-1354(01)00062-8
Smart, R. P., Soulsby, C., Cresser, M. S., Wade, A. J., Townend, J., Billett, M. F., et al. (2001). Riparian zone influence on stream water chemistry at different spatial scales: A GIS-based modelling approach, an example for the dee, NE scotland. Sci. Total Environ. 280, 173–193. doi:10.1016/s0048-9697(01)00824-5
Swanson, A. C., and Bohlman, S. (2021). Cumulative impacts of land cover change and dams on the land-water interface of the tocantins river. Front. Environ. Sci. 9, 662904. doi:10.3389/fenvs.2021.662904
Tang, W., Xu, Y. J., Ma, Y. M., Maher, D. T., and Li, S. Y. (2021). Hot spot of CH4 production and diffusive flux in rivers with high urbanization. Water Res. 204, 117624. doi:10.1016/j.watres.2021.117624
Tuck, S. L., Winqvist, C., Mota, F., Ahnstrom, J., Turnbull, L. A., and Bengtsson, J. (2014). Land-use intensity and the effects of organic farming on biodiversity: A hierarchical meta-analysis. J. Appl. Ecol. 51, 746–755. doi:10.1111/1365-2664.12219
Tukiainen, H., Alahuhta, J., Field, R., Ala-Hulkko, T., Lampinen, R., and Hjort, J. (2017). Spatial relationship between biodiversity and geodiversity across a gradient of land-use intensity in high-latitude landscapes. Landsc. Ecol. 32, 1049–1063. doi:10.1007/s10980-017-0508-9
Turner, R. E., and Rabalais, N. N. (2003). Linking landscape and water quality in the Mississippi river basin for 200 years. Bioscience 53 (6), 563–572. doi:10.1641/0006-3568(2003)053[0563:llawqi]2.0.co;2
Uriarte, M., Yackulic, C. B., Lim, Y. L., and Arce-Nazario, A. J. (2011). Influence of land use on water quality in a tropical landscape: A multi-scale analysis. Landsc. Ecol. 26, 1151–1164. doi:10.1007/s10980-011-9642-y
Uuemaa, E., Roosaare, J., and Mander, U. (2007). Landscape metrics as indicators of river water quality at catchment scale. Hydrology Res. 38, 125–138. doi:10.2166/nh.2007.002
Van Meerbeek, K., Helsen, K., and Hermy, M. (2014). Impact of land-use intensity on the conservation of functional and phylogenetic diversity in temperate semi-natural plant communities. Biodivers. Conserv. 23, 2259–2272. doi:10.1007/s10531-014-0720-8
Van Nieuwenhuyse, B. H. J., Antoine, M., Wyseure, G., and Govers, G. (2011). Pattern-process relationships in surface hydrology: Hydrological connectivity expressed in landscape metrics. Hydrol. Process. 25, 3760–3773. doi:10.1002/hyp.8101
Vought, L. B. M., Pinay, G., Fuglsang, A., and Ruffinoni, C. (1995). Structure and function of buffer strips from a water quality perspective in agricultural landscapes. Landsc. Urban Plan. 31 (1-3), 323–331. doi:10.1016/0169-2046(94)01057-f
Xu, K., Wang, Y. P., Su, H., Yang, J. X., Li, L. L., and Liu, C. (2013). Effect of land-use changes on nonpoint source pollution in the Xizhi River watershed, Guangdong, China. Hydrol. Process. 27, 2557–2566. doi:10.1002/hyp.9368
Xu, Y., Tang, H. P., Wang, B. J., and Chen, J. (2016). Effects of land-use intensity on ecosystem services and human well-being: A case study in huailai county, China. Environ. Earth Sci. 75, 416. doi:10.1007/s12665-015-5103-2
Ye, L., Cai, Q. H., Liu, R. Q., and Cao, M. (2009). The influence of topography and land use on water quality of Xiangxi River in Three Gorges Reservoir region. Environ. Geol. 58, 937–942. doi:10.1007/s00254-008-1573-9
Zhang, J., Li, S. Y., Dong, R. Z., Jiang, C. S., and Ni, M. F. (2019). Influences of land use metrics at multi-spatial scales on seasonal water quality: A case study of river systems in the three Gorges reservoir area, China. J. Clean. Prod. 206, 76–85. doi:10.1016/j.jclepro.2018.09.179
Zhang, J., Li, S. Y., and Jiang, C. S. (2020). Effects of land use on water quality in a river basin (daning) of the three Gorges reservoir area, China: Watershed versus riparian zone. Ecol. Indic. 113, 106226. doi:10.1016/j.ecolind.2020.106226
Zhang, L. Q., Xu, Y. J., and Li, S. (2022). Riverine dissolved organic matter (DOM) as affected by urbanization gradient. Environ. Res. 212, 113457. doi:10.1016/j.envres.2022.113457
Zhang, L. Q., Xu, Y. J., and Li, S. (2023). Source and quality of dissolved organic matter in streams are reflective to land use/land cover, climate seasonality and pCO2. Environ. Res. 216, 114608. doi:10.1016/j.envres.2022.114608
Keywords: land use indices, riparian zone, streamside management zone, water quality indicators, three Gorges reservoir area
Citation: Li S, Zhang J, Jiang P and Zhang L (2022) Linking land use with riverine water quality: A multi-spatial scale analysis relating to various riparian strips. Front. Environ. Sci. 10:1013318. doi: 10.3389/fenvs.2022.1013318
Received: 06 August 2022; Accepted: 14 November 2022;
Published: 30 November 2022.
Edited by:
José Maria Santos, University of Lisbon, PortugalReviewed by:
Andrea Bertora, National University of Central Buenos Aires, ArgentinaCopyright © 2022 Li, Zhang, Jiang and Zhang. This is an open-access article distributed under the terms of the Creative Commons Attribution License (CC BY). The use, distribution or reproduction in other forums is permitted, provided the original author(s) and the copyright owner(s) are credited and that the original publication in this journal is cited, in accordance with accepted academic practice. No use, distribution or reproduction is permitted which does not comply with these terms.
*Correspondence: Siyue Li, c3lsaTIwMDZAMTYzLmNvbQ==
Disclaimer: All claims expressed in this article are solely those of the authors and do not necessarily represent those of their affiliated organizations, or those of the publisher, the editors and the reviewers. Any product that may be evaluated in this article or claim that may be made by its manufacturer is not guaranteed or endorsed by the publisher.
Research integrity at Frontiers
Learn more about the work of our research integrity team to safeguard the quality of each article we publish.