 Xiehui Li
 Hejia Jia
 Yaling Chen
 Jun Wen
- Plateau Atmosphere and Environment Key Laboratory of Sichuan Province, School of Atmospheric Sciences, Chengdu University of Information Technology, Chengdu, Sichuan, China
The source area of the Yellow River (SAYR) is one of the world´s largest wetlands containing the greatest diversity of high altitude marshlands. For this reason, its response to climate change is extremely significant. As revealed by different studies, the response of hydrological processes to global warming results in high uncertainties and complexities in the water cycle of the SAYR. Thus, understanding and projecting future runoff changes in this region has become increasingly important. In the present investigation, we used runoff and meteorological data of the SAYR from 1976 to 2014 (historical period). In addition, Digital Elevation Model (DEM), land-use, and soil data for the period 1976 to 2100 were used considering three future SSPs (Shared Socioeconomic Paths) scenarios of 8 models selected from the Coupled Model Intercomparison Project Phase 6 (CMIP6). The Soil and Water Assessment Tool (SWAT) was used to simulate, project, and analyze potential variations and future runoff of the main hydrological stations (Jimai, Maqu, and Tangnaihai) located in the SAYR. The results showed that: 1) The SWAT model displayed good applicability in historical runoff simulation in the SAYR. A small runoff simulation uncertainty was observed as the simulated value was close to the measured value. 2) Under three different 2021–2100 SSPs scenarios, the yearly discharge of the three hydrological stations located in the SAYR showed an increasing trend with respect to the historical period. Future runoff is mainly affected by precipitation. 3) We compared the 1976–2014 average annual runoff with projected values for the periods 2021–2060 and 2061–2100. With respect to 2021–2060, the lowest and highest increases occurred at Tangnaihai and Maqu Stations in the emission scenarios without (SSP585) and with mitigation (SSP126), respectively. However, the highest and lowest increments at Jimai Station were observed in the intermediate emission (SSP245) and SSP126 scenarios, respectively. Moreover, in 2061–2100, the Maqu and Tangnaihai Stations showed the lowest and highest increments in the SSP585 and SSP245 scenarios, correspondingly. In Jimai Station, the lowest increment occurred in SSP126. The yearly average discharge in the near future will be smaller than that in the far future. Overall, this study provides scientific understanding of future hydrological responses to climate changes in the alpine area. This information can also be of help in the selection of actions for macro-control, planning, and management of water resources, and the protection of wetlands in the SAYR.
Introduction
The wetland ecosystem located in the SAYR is known as the “China Water Tower.” This area has played a unique role in flood storage, water conservation, and prevention of water and soil loss. The SAYR is about 12.2 × 10⁴ km2, accounting for 16.2% of the total catchment area of the Yellow River Basin (Wang et al., 2019). Between 1956 and 2017, the annual SAYR runoff reached 19.82 billion m3, which represents a 34.1% of the annual runoff of the entire region (Yang X. L. et al., 2021). Thus, the SAYR on the Qinghai-Tibetan Plateau represents the main runoff source of the Yellow River Basin (YRB). It has been reported that abundant runoff and scarce runoff directly affect water availability, economic development, income, and even the environmental safety of the entire ecosystem of the upper reaches of the Yellow River (Dong et al., 2007; Liu et al., 2011). The Qinghai-Tibetan Plateau is one of the amplifiers of global climate change. Shi and Zhang (1995) and Huang and Zhao (2004) studied the runoff evolution of large rivers in the Qinghai-Tibetan Plateau. According to their results, since the mid-1960s, annual runoff decreased as a result of drying and reduction of water resources caused by climate warming. It has been determined that climate change is the main responsible for runoff decrease in the upper reaches of the Yellow River (Arnell, 1999; Bolch et al., 2012; Wang et al., 2013; Li and Fang, 2021).
Working Group I contribution to the Sixth Assessment Report (AR6) of IPCC (Intergovernmental Panel on Climate Change) states that global annual average surface temperature increased by 1.09 [0.95–1.20]°C in the past 10 years (2011–2020), as compared to the period 1850–1900. From 2003 to 2012 (the historical period of the AR5), a global warming of 0.19 [0.16–0.22]°C was observed. In addition, the global average surface temperature has increased at higher rates in every decade of the past 40 years than in any other decade of previous periods (IPCC, 2021; Zhou and Qian, 2021; Li et al., 2022). Global warming will significantly impact the hydrological cycle by affecting the spatio-temporal distribution of precipitation, evaporation, runoff, and soil moisture. These changes will further influence the redistribution of water resources complicating their assessment and management. As effect of global warming, evapotranspiration has also significantly changed during the past decades, resulting in the loss of soil water and runoff (Donnelly et al., 2017; Hu et al., 2022). Different methodologies have been used to determine the impact of climate change on watershed hydrology, including the paired catchment approach, hydrological modelling approach, conceptual approach, empirically statistical method, and hydrological sensitivity method (Gao et al., 2016; Zhang et al., 2017).
Since the hydrological model is able to provide a significant amount of information from limited existing data and identifies the relationship between model parameters and physically observable land surface characteristics, it is the main method currently used for runoff simulation. The three types of hydrological models used in practical applications are the lumped, semi-distributed, and fully-distributed models, which are based on spatial discretization (Marahatta et al., 2021a). For example, Génie Rural à four paramètres Journalier (GR4J), Hydrologiska Byråns Vattenbalansavdelning (HBV) and a simplified version of the HYDROLOG (SIMHYD) are lumped models, while topographic hydrologic model (TOPMODEL), Variable Infiltration Capacity (VIC) and the SWAT are semi-distributed models. The Variant of Système Hydrologique Européen (MIKE_SHE) and Visualizing Ecosystem Land Management Assessments (VELMA) are fully distributed models.
At the same time, the GCMs (Global Climate Models) are the most important and powerful tools for future projections of climate change in the context of global climate warming. Thus, climate change simulations and future runoff projections can be performed by combining hydrological models and climate models with climate scenario model data for hydrological modeling, which is also the mainstream and hot topic of current research on climate change impacts on water resources in watersheds. For example, Harding et al. (2012) used 16 GCMs in CMIP3 to drive the macroscale VIC model. These researchers found that, by the middle of the century, the streamflow in the Upper Colorado River Basin will decrease and increase in approximately 30%. Fei et al. (2016) applied the Xinanjiang (XAJ) hydrological model by using historical climatic data and two future precipitation scenarios for streamflow simulations in the Pearl River Basin of China. Theirs results implied that future precipitation transformation methods were a source of uncertainty, affecting future discharge projections. Isam et al. (2019) simulated and compared the future runoff across three unregulated catchments in Australia by applying two different hydrological models (lumped-HBV and distributed-BTOPMC) in combination with a multi-model ensemble of 8 GCMs in CMIP5 under the RCP4.5 and RCP8.5 for the mid-(2016–2065) and late-(2080–2099) 21st century. Their results showed that the lumped model performed better than the distributed model in capturing the observed streamflow across the three contributing catchments. In addition, the performance of the models was relatively incompatible with the change in the direction of high and low flows for future climate scenarios. Ohba et al. (2022) investigated the influence of climate change on streamflow in a heavy snowfall area of mountainous central Japan using HYDREEMS (Hydrological Evaluation with Evapotranspiration Modeling System) simulations driven by climate projections obtained from the d4PDF-GCM in d4PDf database. Simulation performance of hydrological and climate models may vary across regions due to differences in working mechanisms, initial conditions, parameterization schemes, and spatial resolution (Walsh et al., 2008; Mote and Salathé, 2010; Kobierska et al., 2013; Isam et al., 2019; Li et al., 2022). Hence, in order to improve the accuracy of research results, model optimization and performance evaluation should be carried out before they are applied in the field.
The Soil and Water Assessment Tool (SWAT) model is a physically-based semi-distributed hydrological model developed by USDA ARS (U.S. Department of Agriculture, Agricultural Research Service). This tool is important in ecological and hydrological processes modelling. SWAT has been widely used in hydrology, soil erosion, land use, and agricultural management (Arnold et al., 1998; Mankin et al., 2010; Tan et al., 2019; Li W. T. et al., 2021). Many studies have confirmed the good performance of the SWAT model in hydrological runoff simulations (Griensven et al., 2012; Fukunaga et al., 2015; Anand et al., 2018; Das et al., 2019; Akoko et al., 2021). For example, Shrestha et al. (2018) evaluated the hydrological response of the SWAT model using data of 11 basins in two contrasting climatic regions of Asia. Their results revealed that SWAT was a suitable tool for modelling hydrological responses in both regions. Bera and Maiti, (2021) used SWAT to analyze the spatio-temporal distribution of runoff and water resources in the Ganges River Basin. Their results proved the good performance of this model. Serrao et al. (2022) applied the SWAT model to simulate the surface runoff and sediment yield in the Amazon River Basin in Brazil. The simulation results were in agreement with the real measurements. Thus, the SWAT model can be used to evaluate the hydrological and sedimentation processes of the Amazon River Basin. Similarly, Wang D. X. et al. (2020) demonstrated the applicability of the SWAT model to simulate the runoff of the Qingshui River Basin located in the Zhangjiakou city of Hebei Province. It has also been determined that precipitation is a primary factor influencing runoff. In this context, Song et al. (2016) used the SWAT model to build a simulation scheme for the Shiyang River Basin located in the Hexi Corridor. Their data indicated that the sequential uncertainty fitting algorithm SUFI-2 presented certain applicability in runoff simulation. Li et al. (2004) proved that the SWAT model displayed a good performance when they obtained yearly and monthly streamflow simulations for the Tangnaihai hydrological station in SAYR. Similarly, Wang et al. (2019) reported the SWAT model displayed the best performance when monthly runoff data of the SAYR was simulated.
As global climate warming persists, the ecological safety of the YRB is threatened to an unprecedented extent. For this reason, understanding and projecting future runoff changes in the YRB has become increasingly important. The sixth phase of the CMIP project involves the largest number of models among all CMIP phases. CMIP6 is also known for its significant improvement in experimental design and the massive amount of data provided for simulation. Besides, CMIP6 includes combined scenarios of future radiative forcing and shared socioeconomic pathway-representative concentration pathway (SSP-RCP), which further enhances the accuracy of future projections (Zhou et al., 2019). Existing studies have confirmed the applicability of CMIP6 models to different Chinese scenarios. For example, Yang Z. K. et al. (2021) compared and evaluated the simulation performance of 20 CMIP6 models for temperatures and precipitations of China. They found out that the CMIP6 global climate model was able to accurately reproduce the spatial distribution of temperatures and precipitations. Also, Wang et al. (2021) compared the CMIP5 and CMIP6 models using China’s extreme precipitations. These researchers determined that the simulation performance of the CMIP6 models was higher than that of the CMIP5 models. Jiang et al. (2020) applied the CMIP6 scenarios to the Huaihe River Basin and projected spatial distributions of temperature and precipitation. CMIP6 demonstrated a higher performance and lower deviations as compared with CMIP5.
At present, a large number of studies have been conducted in several river basins at home and abroad by coupling the SWAT model to CMIP in different stages (Gan et al., 2015; Bajracharya et al., 2018; Bhatta et al., 2019; Dahal et al., 2020; Marahatta et al., 2021b). Zhang and Xu (2009) incorporated the GCMs outputs into the SWAT model and performed runoff projection for the SAYR in three future periods (2020s, 2050s, and 2080s). Their data showed that future climate changes are likely to have a dramatic impact on runoff values in the SAYR. According to their projections, the runoff in this region will decrease in the future. Tang et al. (2012) used three climate models, CSIRO, INM, and MRI to determine how climate change affected by two greenhouse gas emissions scenarios (SRES A2 and SRES B1) will influence the runoff in the upper reaches of the Yellow River in two future periods (2046–2065 and 2081–2100). Their results showed that runoff in the study area stabilized or decreased under different greenhouse gas emission scenarios. Wang et al. (2014) combined the SWAT and the RegCM3 models to project runoff from 2010 to 2098 in the SAYR under the A1B emissions scenario. Their results indicated an alternation of upward and downward trends (decrease-increase-decrease) at the Tangnaihai hydrological station in the three future periods. Zhang et al. (2015) used the SWAT and GCM models to assess the impact of climate change on the SAYR’s hydrological components under three emission scenarios (A1B, A2, and B1) during the period 2013–2042. Their results showed that, in A1B and B1, the future streamflow in the Tangnaihai gauge showed an increasing trend. In addition, the A2 scenario was characterized by a declining trend.
The SAYR on the Qinghai-Tibetan Plateau is the dominant water source region of the whole YRB. Since temperature is expected to continuously rise in the future, increases and decreases in precipitation display a high level of uncertainty. The sensitive responses of hydrological processes to the intensifying global warming result in high uncertainties and complexities of the water cycle in the SAYR. An in-depth understanding of the effect of future climate changes on water cycle is of great significance for the proper management of water resources and the formulation of associated policies. To the best of our knowledge, most of the SAYR runoff data has been estimated using the hydrological information of the Tangnaihai Station, the main stream control station of the YRB (Wang L. et al., 2020). Significant differences in future runoff variations have been observed. Moreover, to the best of our knowledge, few studies have combined the CMIP6 and the SWAT models under different future scenarios, especially in the SAYR. Thus, in order to investigate the hydrological response to future climate change in the SAYR, we used historical runoff data of three hydrological stations, meteorological data of 11 meteorological stations, DEM, land use, and soil data. First, we considered different sensitivity parameters to evaluate the applicability of the SWAT model to the SAYR. Later, 8 selected models under CMIP6 were analyzed in order to project future runoff and runoff changes at three hydrological stations from 2021 to 2100 under three different scenarios (SSP126, SSP245, SSP585). Our research findings can provide an important basis and theoretical support for water resources management, flood control, water conservation, and the environmental protection of the SAYR wetland.
Data and methods
Study area
The Yellow River originates from the Qinghai-Tibetan Plateau in China and runs through nine provinces called Qinghai, Sichuan, Gansu, Ningxia, Neimenggu, Shannxi, Shanxi, Henan, and Shandong. This is China’s second longest river with a total length of about 5,464 km and a basin area of 795 thousand km2 (Zhai et al., 2021). The region of interest is located in the SAYR. It encompasses the upper reaches of the Tangnaihai hydrological station in the Yellow River upstream, covering three provinces, Qinghai, Sichuan, and Gansu. As shown in Figure 1, the study area is located between longitudes 95°E and 104°E, and latitudes 32°N and 37°N. The elevation varies from 2,145 to 6,248 m a.s.l., with higher landforms to the west as compared to the east. The river system is highly developed, serving as an important water conservation area in the Yellow River Basin. The wetland types include natural wetlands (rivers, lakes, marshes and beaches) and constructed wetlands (reservoirs, puddles and ponds), of which the marshy wetlands have the largest area, accounting for 63.2% of the total wetland area in the SAYR (Li, 2018). In this region, more water than sediments are present. In the SAYR, the predominant land use includes grassland, forest land, and water. Different types of soil are present, with the alpine soil as the dominant (Dai et al., 2014). Within the study area, the underlying surface is largely alpine grassland, with a typical continental climate. The precipitation distribution is uneven and is mostly concentrated in summer season. The annual average precipitation varies between 257.7 and 766.7 mm over the years. As for spatial distribution, precipitation decreases from southeast to northwest. In addition, temperature decreases from southeast to northwest. Figure 1 shows the geographic position of the study area and the spatial distribution of the annual average precipitations from 1976 to 2020.
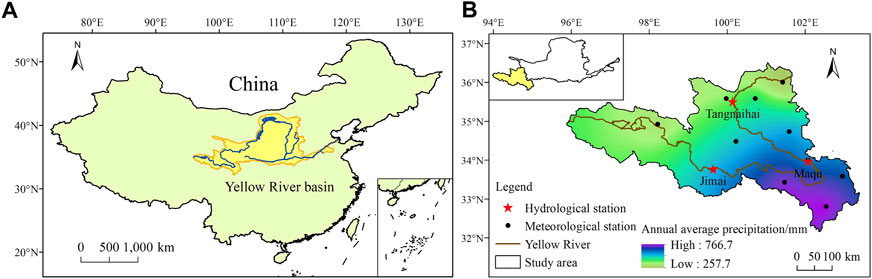
FIGURE 1. (A) Geographic location of the study area; and (B) average annual precipitation from 1976 to 2020.
Data
In the present study, we used daily meteorological data from 1976 to 2020 collected from meteorological stations located in the SAYR. The climatic elements included precipitation, temperature, pressure, evaporation, wind speed, sunshine hours, and relative humidity, which were obtained from China Meteorological Data Network (http://data.cma.cn/). DEM data were downloaded from GSCloud (http://www.gscloud.cn/), with a spatial resolution of 30 m × 30 m. Land use and soil type were obtained from the Resources and Environmental Science Data Center (https://www.resdc.cn/Datalist1.aspx?FieldTyepID=11,6), with a spatial resolution of 1 km × 1 km. The monthly runoff data from 1976 to 2014 at the Jimai, Maqu, and Tangnaihai hydrological stations were acquired from relevant hydrological stations and literature. The CMIP6 data, which mainly covered maximum temperature, minimum temperature, wind speed, precipitation, relative humidity and radiation, was acquired from the Coupled Model Intercomparison Project Phase 6 of the World Climate Research Program (WCRP) (https://esgf-index1.ceda.ac.uk/projects/cmip6-ceda/).
Many studies have indicated that GCMs is able to simulate some climatic factors on a regional scale (Seneviratne and Hauser, 2020; Quenum et al., 2021; Li et al., 2022). Numerous studies have also shown that the simulation effect of the multi-model ensemble is better than that of a single model, and the simulation uncertainty is smaller (Kim et al., 2020; Almazroui et al., 2021; Niu et al., 2021). Therefore, in this study, we selected 8 models with complete data for the period 1976–2100 in CMIP6 to simulate and project runoff in the SAYR. These data included historical climate simulations (Historical) and three future scenarios (SSP126, SSP245 and SSP585) representing sustainable socioeconomic development, intermediate socioeconomic development, and traditional fossil fuel-driven development, as well as the combination of low radiation forcing, medium radiation forcing, and high radiation forcing, respectively. Table 1 shows the basic information of the 8 selected models. Due to the different spatial resolution of each model, a bilinear interpolation was first applied to obtain 0.5° × 0.5° data for the 8 models. Later, multi-model ensemble mean of 8 models was determined. Finally, in order to reduce uncertainty, the results of multi-model ensemble mean were used for runoff projection in the near (2021–2060) and distant future (2061–2100). In addition, a comparative analysis of historical and future runoff data was performed.
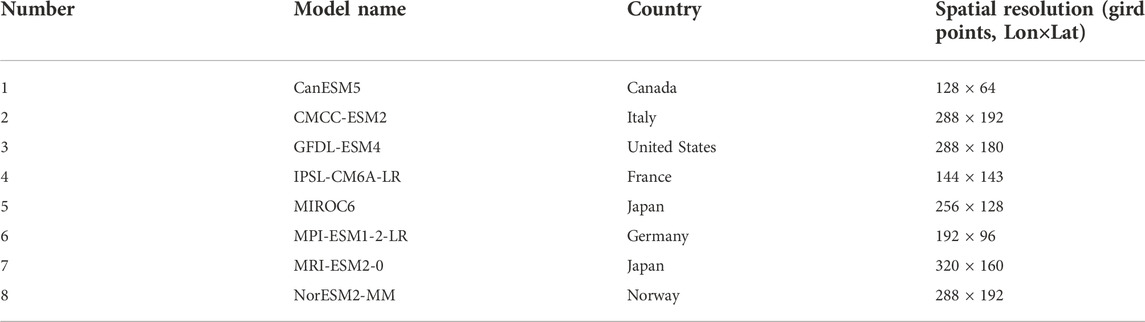
TABLE 1. Basic information of 8 models in CMIP6 chosen for future runoff projections.
SWAT model
In the SWAT model, the river basin is divided into several sub-basins, which are further decomposed into hydrological response units (HRUs) according to DEM, land use, water systems, and soil types. The HRU is the basic unit in SWAT model. The natural state of the river basin was simulated and runoff was calculated for each HRU. The sum of these values represented the total runoff of the main river channel (White et al., 2011). The SWAT model consists of several modules including the sediment and hydrology modules, which are run on a daily basis. Therefore, we can obtain monthly and yearly outputs. The SWAT model displays high computational efficiency and long-term continuous simulation capacity (Osei et al., 2019). Herein, we obtained a historical simulation and future projections of runoff using the ArcSWAT2012 model. The SWAT model uses the general water balance equation (Eq. 1) to simulate the water cycle (Neitsch et al., 2009; Arnold et al., 2011):
Where SWt and SW0 are the final and initial soil water content; i is the time t (days) for the simulation period; Rday (mm), Qsurf (mm), Ea (mm), Wseed (mm) and Qqw (mm) represent daily precipitation, surface runoff, evapotranspiration, water accumulated in the vadose zone, and return flow, respectively.
We first built a simulation scheme in SWAT using DEM, land use, soil types, water system, and 1976–2014 data from 11 meteorological stations relevant to the study area. For parameter optimization purposes, monthly runoff measurements of three hydrological stations were used to perform parameter calibration and validation. Afterwards, we obtained the optimal historical runoff simulation. Finally, the multi-model ensemble mean data in CMIP6 corresponding to the future scenarios were imported in order to obtain the runoff projection and analyze potential changes in the SAYR in the two future periods. Table 2 shows the results for land use reclassification and area ratio for each type of land use considered in the SWAT simulation. Figure 2 presents the spatial distributions of DEM, water system, land use, soil types, and the main inputs. Land use data were categorized into six classes (level 1) while soil data were segregated into 7 classes (order 1) and 29 sub-classes (subgroup 2).
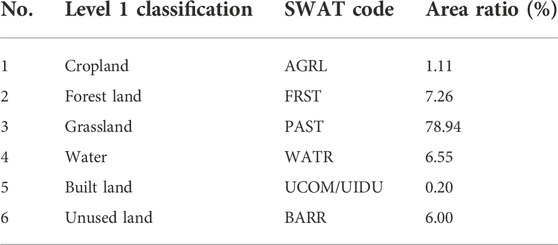
TABLE 2. Land use reclassification and area ratio in the SAYR.
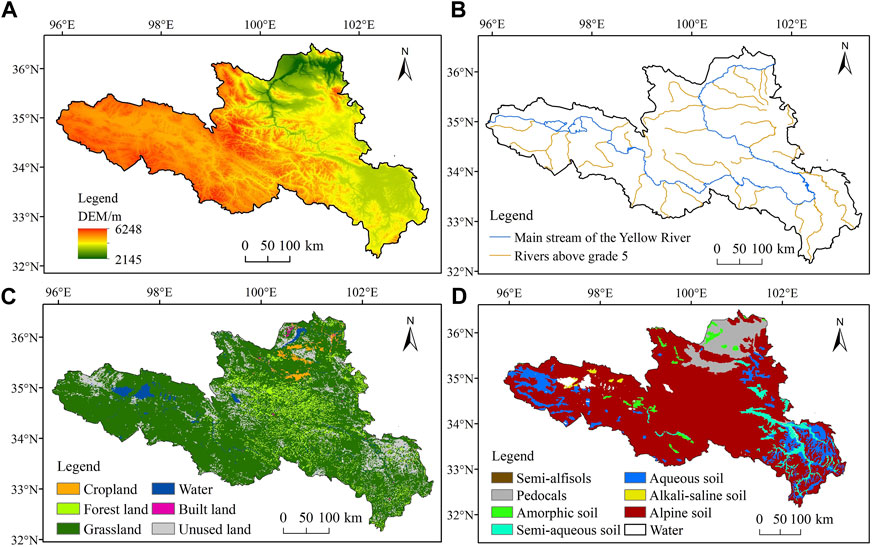
FIGURE 2. Regional distribution of the main input parameters of the SWAT model: (A) DEM; (B) water system; (C) land use type (level 1); and (D) soil type (order 1).
SUFI-2 algorithm in the SWAT Calibration Uncertainties Program (SWAT_CUP) can be used for the simultaneous calibration of several parameters. This algorithm involves uncertainties in calibration parameters, input data, model structure, and actual observed data. The range of uncertainty can be visualized on the 95PPU (95 Percent Prediction Uncertainty) plot using the simulated and measured values. In this context, it is helpful to find the best parameter combination. The SUFI-2 algorithm is used for parameter calibration of the SWAT model and uncertainty assessment of the hydrological model (Abbaspour et al., 2004). Yang et al. (2008) showed that the SUFI-2 algorithm was highly flexible and adaptable to any possible measurement or objective function. In addition, it provides an uncertainty interval with a minimum number of runs reasonably covering the data points. Considering this, we employed the SUFI-2 algorithm for parameter calibration and uncertainty analysis. Sensitivity was determined using the global sensitivity analysis in SWAT-CUP2012. Also, sensitivity was measured through t-statistic (t-Stat) and p-value, which indicate the significance of t-Stat. The absolute value of t-Stat indicates the sensitivity of the model parameter. The higher the absolute value, the greater the sensitivity of the model parameter. The p-value indicates the significance of t-Stat. The smaller the p-value, the greater the significance of t-Stat. Hence, the lower the contingency of the sensitivity, the greater the importance of the parameter. In other words, the higher the absolute t-Stat value and the lower the p-value, the higher the sensitivity (Li et al., 2015).
The performance of the hydrological model was assessed using two indicators, the coefficient of determination (R2) and Nash-Sutcliffe efficiency (NSE). The closer the R2 and NSE values to 1, simulated and observed values were more alike. It is generally considered that if R2 > 0.7 and NSE > 0.55, the model’s performance to simulate monthly runoff is satisfactory (Moriasi et al., 2015). The two indicators were calculated using Eqs 2, 3 (Cao et al., 2021).
where n is the time series length;
Taylor diagram
The Taylor diagram presents three statistics, the spatial correlation coefficient (R) between the simulated and the observed value, standard deviation (STD), and root mean square error (RMSE) of the simulated value relative to the observed field. Differences between the simulated results and the reference data can be observed intuitively. Taylor diagram offers a comprehensive image of the simulation performance of the model. We plotted the Taylor diagram for 8 selected models in CMIP6 to assess their performance for historical climatic factors in the SAYR and the applicability during future runoff simulations. The spatial correlation coefficient between the simulated and the observed values estimates the performance of model’s simulation at the central location. In addition, the standard deviation ratio (STDR) indicates the model’s simulation performance for central amplitude, and it corresponds to the ratio of the standard deviation of the test field to that of the observed field. Moreover, RMSE measures pattern similarities between the simulated and the observed values. The closer the RMSE to 0, the stronger the simulation performance. The formulas to calculate these three statistics are published in Taylor (2001) and Jiang and Chen (2021).
Results
SWAT sensitivity analysis
Twenty-seven parameters were selected for the analysis (Zhao and Xu, 2009; Zuo and Xu, 2012; Li S. Q. et al., 2021; Martínez-Salvador et al., 2021; Hu et al., 2022). Each iteration consisted of 500 simulations performed with the SUFI-2 algorithm, and the optimal parameter combination was obtained after reaching the pre-set number of iterations. As shown in Table 3, the parameters were ranked in terms of sensitivity. According to our results, soil evaporation compensation factor (ESCO) was the most sensitive parameter, which represents soil water evaporation. The higher the ESCO, the smaller the soil water evaporation and the larger the runoff. The high sensitivity of this parameter indicated that runoff was significantly related to soil water evaporation. The second most sensitive parameter was SCS (Soil Conservation Service) runoff for moisture condition II (CN2). This parameter shows the characteristics of the underlying surface. The higher the SCS value, the higher the underlying surface impermeability and runoff. The third most sensitive parameter corresponded to the groundwater “revap” coefficient (GW_REVAP) that indicates the ability of groundwater to enter the unsaturated layer from the shallow aquifer when the unsaturated soil layer is short of water. Elevated GW_REVAP values indicated a strong capacity for groundwater re-evaporation, high evaporation levels, and small runoff. The fourth most sensitive parameter was the threshold depth of water in the shallow aquifer required for return flow to streams (GWQMN). This is a measure of the amount of precipitation turning into runoff. The sensitivity of this parameter indicated that runoff in the study area was also influenced by precipitation. Other parameters with strong sensitivity included available water capacity of the soil layer (SOL_AWC), the threshold depth of water in the shallow aquifer for “revap” to occur (REVAPMN) and saturated hydraulic conductivity (SOL_K), among others.
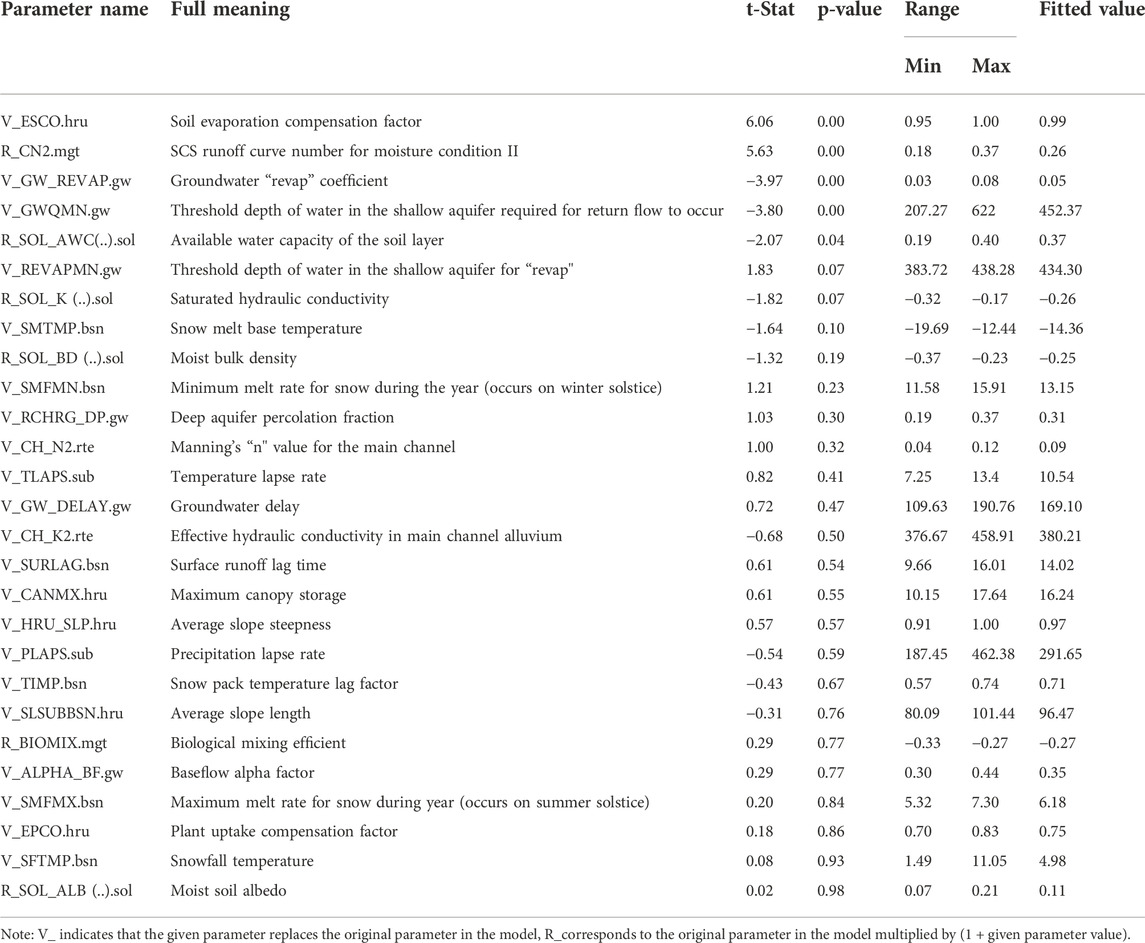
TABLE 3. SWAT model parameter sensitivity and calibration.
SWAT model calibration and validation
Calibration and validation processes were conducted after the sensitivity analysis. A warm-up period (to stabilize the model) of 2 years (1976–1977) was excluded from the analysis. The years 1978–1994 were set as the calibration period and 1995–2014 as the validation period. Table 4 shows the statistics of the runoff simulation and measurements at three hydrological stations during the calibration and validation periods. In the calibration and validation periods, R2 between simulated and observed value was consistently higher than 0.72. In addition, NSE was larger than 0.65. In both periods, the smallest R2 values (0.72) were observed at the upper reaches of the Jimai hydrological station. Similarly, in the calibration and validation periods, this station displayed the smallest NSE values, which were 0.69 and 0.65, respectively. According to these results, the SWAT model displayed good runoff simulation performance in the SAYR, and therefore, its applicability was proven. Figure 3 shows the temporal variations of simulated and measured monthly discharges in the two periods. The results showed that the simulated monthly discharge at the Jimai, Maqu, and Tangnaihai hydrological stations generally agreed with the observed data. The slight decreasing trend was mainly observed in the calibration period, while a small increasing trend occurred in the validation period. The peak precipitations and runoff occurred in summer season and presented a similar variation trend in both periods. The correlation coefficients were significant (at the significance level of 0.01 in both periods). The runoff was significantly influenced by precipitation. The variation trends of runoff and precipitation in the upstream of the Jimai Station were more consistent than those observed in the downstream of the Maqu and Tangnaihai Stations. Precipitation influenced runoff to a greater extent in the upper reaches of the SAYR, as compared to the lower reaches.
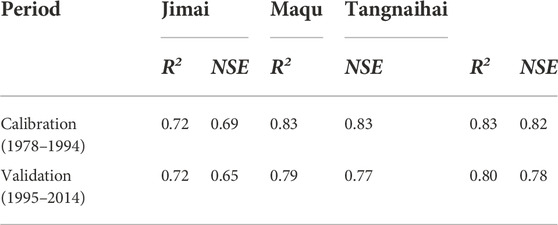
TABLE 4. Statistical values between simulated and measured data for monthly discharges in the three hydrological stations.
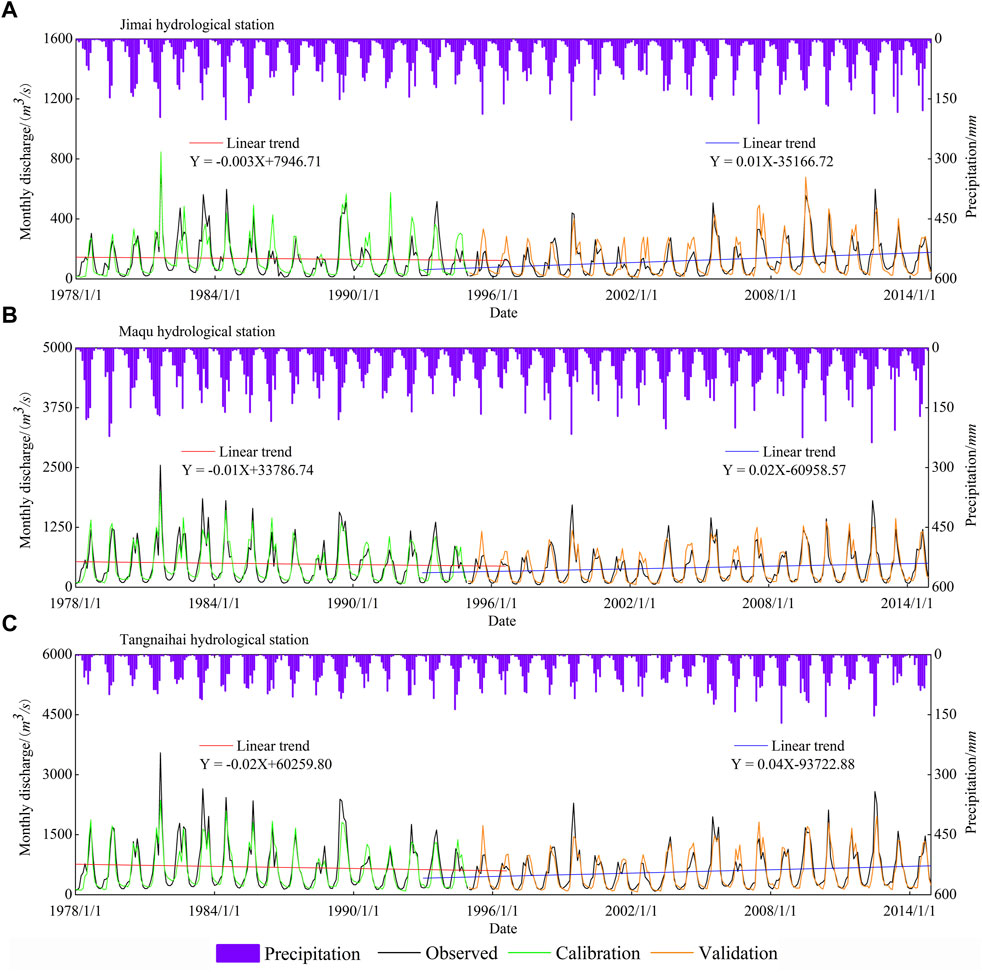
FIGURE 3. Temporal variation of the simulated and measured monthly discharge in the three hydrological stations ((A) Jimai (B) Maqu (C) Tangnaihai) during the calibration and validation periods.
The SUFI-2 algorithm performs the approximation at a 95 percent prediction uncertainty level called 95PPU (Chen et al., 2017). We assessed the uncertainty using p-factor and r-factor of the observed data bracketed by 95PPU. It was determined that the p-factor displayed values between 0 and 1. P-factor represents the percentage of the observed values bracketed by 95PPU. In addition, the r-factor represents the average width of the 95PPU band. The specific results are shown in Table 5. Our data showed that p-factors of the three hydrological stations displayed values higher than 0.64 in the calibration and validation periods, indicating a higher percentage of observed values bracketed by 95PPU. In the calibration period, R-factors of these three hydrological stations showed values below 0.50. In addition, the highest observed value was 0.65 in the validation period, indicating a relatively narrow uncertainty interval. According to these two indicators, the uncertainty in runoff simulation at the three hydrological stations was small, and the simulated values were close to the observed values.
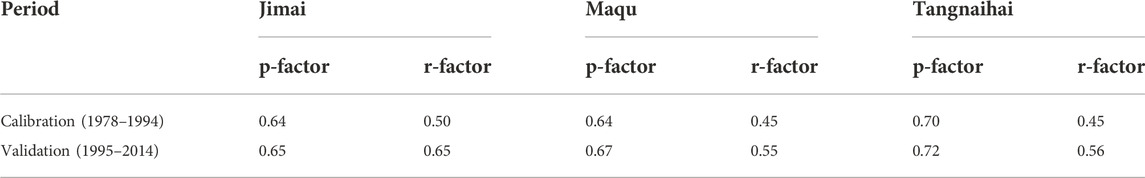
TABLE 5. Uncertainty of runoff simulation at three hydrological stations.
Applicability assessment of 8 models in CMIP6
Eight models in CMIP6 were chosen for future projections. Relative humidity, solar radiation, wind speed, precipitation, and temperature were input into the SWAT model during weather data definition. Therefore, before the projections, we assessed the applicability of the 8 selected single models and multi-model ensemble mean (MME) of 8 models to these five climatic factors in the historical period. In addition, results were compared with the observed values. Figure 4 shows the Taylor diagram comparing the historical simulations in 8 single models and MME of five monthly climatic factors (average minimum temperature, average maximum temperature, precipitation, average relative humidity and average wind speed) relative to the measured data from 1976 to 2014. Since solar radiation was calculated using daily sunshine hours, the errors relative to the test data might be amplified during the calculation. Therefore, no comparison was performed for this parameter.
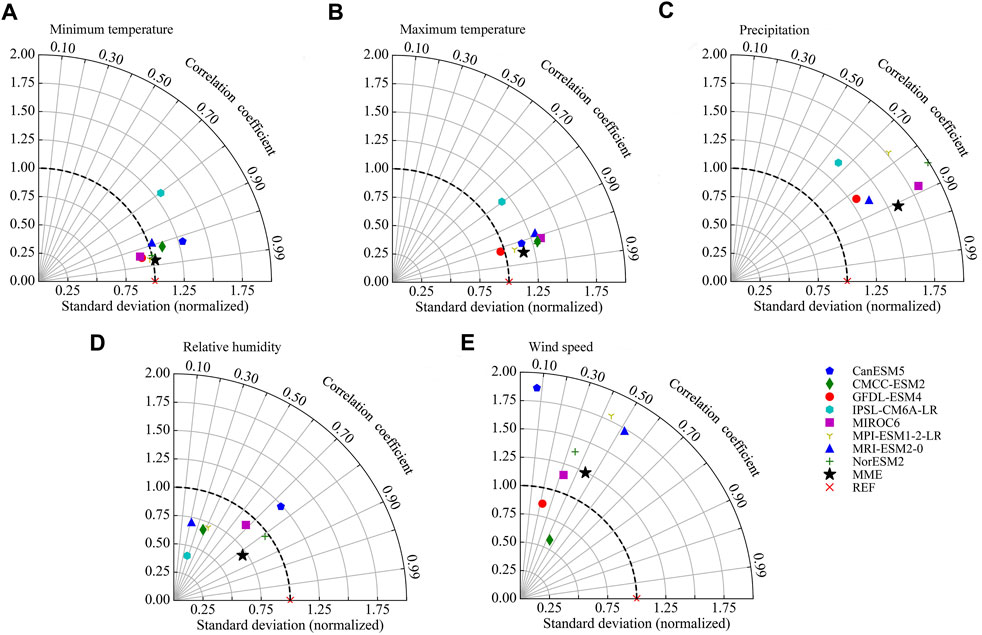
FIGURE 4. Taylor diagram for the monthly values of five climatic factors ((A) average minimum temperature (B) average maximum temperature (C) precipitation (D) average relative humidity and (E) average wind speed) between historical simulations of 8 models and observed data (REF) from 1976 to 2014.
Projection and analysis of runoff variation
In the 8 CMIP6 models, three emissions scenarios were selected, SSP126, SSP245, and SSP585. These scenarios combined shared socioeconomic pathways with radiative forcing pathways at low, intermediate, and high levels. The SSP126 corresponds to an update of CMIP5 RCP2.6, a combination of low socioeconomic vulnerability with low radiative forcing. Studies have shown that under this scenario, the annual average surface air temperature is expected to rise 2.12°C by 2100. Increment in annual precipitation in the upper reaches of the Yellow River will peak between 2041 and 2060, followed by a decrease between 2081 and 2100. On the other hand, the SSP245 is an update of the RCP4.5 scenario, a combination of intermediate socioeconomic vulnerability with intermediate radiative forcing. According to previous reports, under SSP245 conditions, the increment in annual precipitation in the upper reaches of the Yellow River will peak at the end of the 21st century. Moreover, SSP585 is an update of the RCP8.5 scenario, where the global radiative forcing reaches 8.5W/m2, a combination of high socioeconomic vulnerability with high radiative forcing. These studies showed that China’s annual average surface air temperature will rise 6.55°C in 2100 under SSP585. In addition, annual precipitation in the upper reaches of the Yellow River will also peak by the end of the 21st century (Zhang et al., 2019; Zhao et al., 2021).
The optimal parameter combination was obtained after SWAT model calibration. As shown in Figure 5, runoff projections in the SAYR in the SSP126, SSP245, and SSP585 scenarios were performed using MME results. Data indicated that, under the three scenarios, the yearly discharge at the three hydrological stations will increase between 2021 and 2100 as compared to the historical period. In the next two periods (2021–2060 and 2061–2100), the yearly discharge at the three hydrological stations will increase in the SSP126 and SSP245 scenarios. However, in the SSP585 scenario, it will increase in the near future (2021–2060) and then decrease in the distant future (2061–2100). Among them, the yearly discharge will significantly decline in 2030 and 2045 in the near future, while it will rebound in the distant future (in 2085) in the SSP585 scenario. Herein, we compared yearly discharge of the three hydrological stations during the historical period (1976–2014). Results indicated that in the historical period, yearly discharge decreased at the beginning and later increased. However, an overall slight downward trend was observed. Specifically, dry seasons occurred between 1990 and 2000. It was also observed that runoff increased after 2000. In the near future, runoff at the three hydrological stations will significantly increase under the SSP585 scenario. Moreover, in the distant future, a more significant increasing trend would be observed in the SSP126 scenario as compared to the SSP245 scenario. Moreover, the most obvious decreasing trend will correspond to the Tangnaihai Station in the SSP585 scenario.
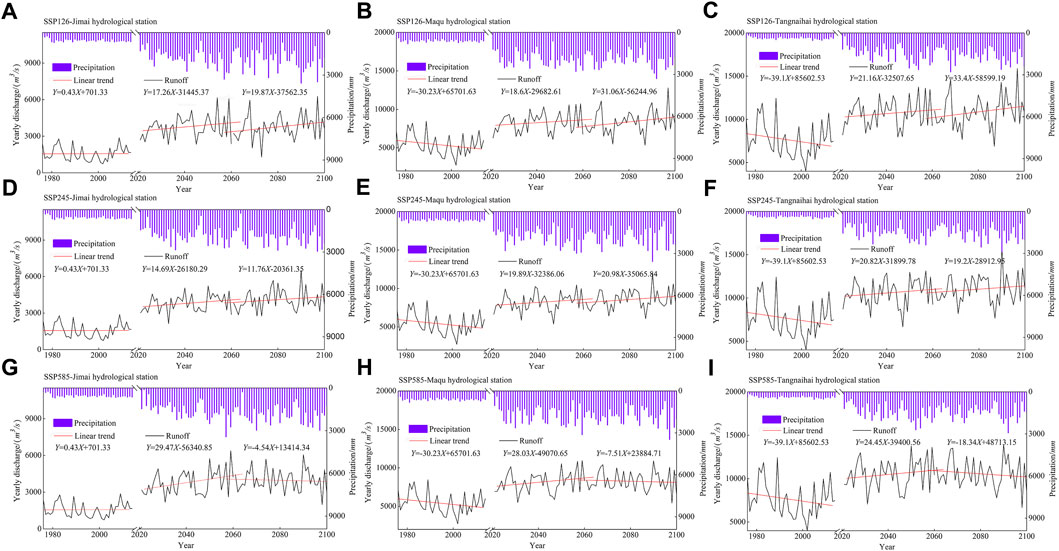
FIGURE 5. Temporal variations and trends of future yearly discharge at the three hydrological stations (Jimai (A,D,G), Maqu (B,E,H) and Tangnaihai (C,F,I)) in the SAYR under three scenarios (SSP126 (A–C), SSP245 (D–F) and SSP585 (G–I)).
Under any scenario, precipitation will increase between 2021 and 2100 at the three hydrological stations. All peaks will be observed during the summer, and the variation trends in precipitation will be similar to those of runoff. The correlation coefficients were significant at each stage at the significance level of 0.01. According to these results, precipitation is an important factor influencing runoff in the SAYR. We also performed a comparison with the historical data. Our results indicated that the increment in precipitation was different from that of runoff. At the Jimai Station in the upper reaches, the increase in precipitation was similar to that of yearly discharge. However, at the Maqu and Tangnaihai Stations in the lower reaches, the precipitation increment was larger than that of yearly discharge. This mainly occurred because in the SAYR northwestern sub-basins, runoff and deep aquifer recharge augmented more dramatically as temperature and snowmelt increased. Moreover, evapotranspiration in the northwestern region of the SAYR was smaller than that in the southeastern region. The lower reaches were more influenced by evapotranspiration, which reduced the excess of runoff caused by precipitation. This finding was consistent with the results obtained in the calibration and validation period (Li K. et al., 2021).
Table 6 displays yearly average discharges and variation rates from 1976 to 2100 at three hydrological stations. Between 1976 and 2014, the yearly average discharges at the three hydrological stations (Jimai, Maqu and Tangnaihai) were 1546.68 m3/s, 5390.27 m3/s, and 7601.99 m3/s, respectively. It was observed that yearly average discharges increased under the three future scenarios. In addition, smaller yearly average discharge values will be observed in the near future (2021–2060) as compared to the distant future (2061–2100). Moreover, yearly average discharges at the Jimai Station will increase 140.61%–142.02% in 2021–2060, as compared to values in the historical period (1976–2014). The increment in yearly average discharge at Maqu Station will be 50.9%–53.41%, and that at Tangnaihai Station will be 38.05%–40.38%. The lowest and highest increment at Tangnaihai and Maqu Stations correspond to SSP585 and SSP126, respectively. However, the highest and lowest increases at Jimai Station correspond to SSP245 and SSP126, respectively. Between 2061 and 2100, the increment in yearly average discharge at Jimai Station will be 141.15%–162.47% under the three scenarios. Moreover, the increment in yearly average discharge at Maqu Station will be 53.17%–59.09%, and 38.8%–45.06% at Tangnaihai Station. The lowest increase at the Jimai Station corresponds to the SSP126 scenario. In general, the lowest and highest increases at the Maqu and Tangnaihai hydrological stations correspond to SSP585 and SSP245, correspondingly. The reason may be that the SAYR is covered with snow and ice all year round. As temperature rises and the snow and ice melts, the most affected runoff is that closest to the upstream area. Under the SSP126 scenario and in the near future, moderate temperature increments will be observed. However, precipitation and runoff will significantly increase. In the distant future, moderate increase in runoff and precipitation will be observed. In the near future and under the SSP245 scenario, temperature, precipitation, and runoff will significantly increase. Additionally, with the further increase in precipitation in the distant future, runoff will also increase. Under the SSP585 scenario and in the near future, precipitation and temperatures will be more elevated. Snow and ice melting will cause a large runoff increase at the upstream Jimai Station, and a relatively small intensification of this parameter will be observed at downstream stations. In the distant future, the increase in runoff will slow down since precipitation will further increase and the evapotranspiration will be intensified due to the sharp rises in temperature.
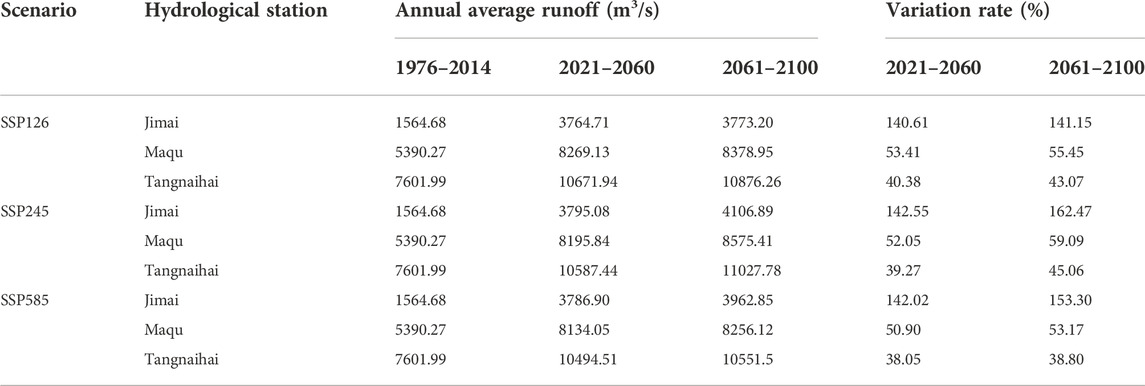
TABLE 6. Yearly average discharge and variation rate at three hydrological stations under different scenarios from 1976 to 2100.
Variations of hydrological components
Since HRU is defined as a unique aggregation of DEM, land use, soil properties, and water system, it is the basic unit in SWAT. We performed statistical analysis for the hydrological components of three hydrological stations considering three scenarios, one historical, and two future periods. Calculations were based on the HUR and results are presented in Tables 7, 8. As Table 7 shows, Maqu and Jimai Stations displayed the highest and lowest PRECIP values, respectively, in the historical period. In addition, Tangnaihai and Jimai Stations showed the largest and smallest ET, correspondingly. Also, the greatest and smallest SW_INIT and SW_END corresponded to Maqu Station and Jimai Station, in the same order. Maqu and Jimai Stations owned the highest and lowest PERC values, respectively. Our results indicated that the atmospheric rainfall in the SAYR during the historical period was mainly discharged in the form of evapotranspiration, with more ET in the downstream and less in the upstream. The highest values in soil water content and groundwater recharge were observed in the middle reaches of Maqu Station. In addition, the lowest values corresponded to the upper reaches of Jimai Station. In this region, groundwater recharge was more influenced by precipitation than surface runoff when the variability of precipitation was significant. Compared with the historical period, PRECIP will significantly increase in the future under the three scenarios. The largest increase is expected to occur in Maqu Station and the smallest in Tangnaihai Station. Also, ET will raise the most in Tangnaihai Station and the least in Jimai Station. In the three scenarios, the SW_INIT and SW_END showed a slightly increasing trend in Maqu Station. However, those values in Jimai and Tangnaihai Stations showed a slightly growing pattern under the SSP126 and SSP245 scenarios, and a decreasing trend in SSP585. An upward tendency was also observed in PERC under three scenarios. In this case, the highest and smallest increasing trends were observed in Maqu and Tangnaihai Stations, respectively. These data showed that, in the future, intense precipitation will be the main reason for runoff increase in three hydrological stations.
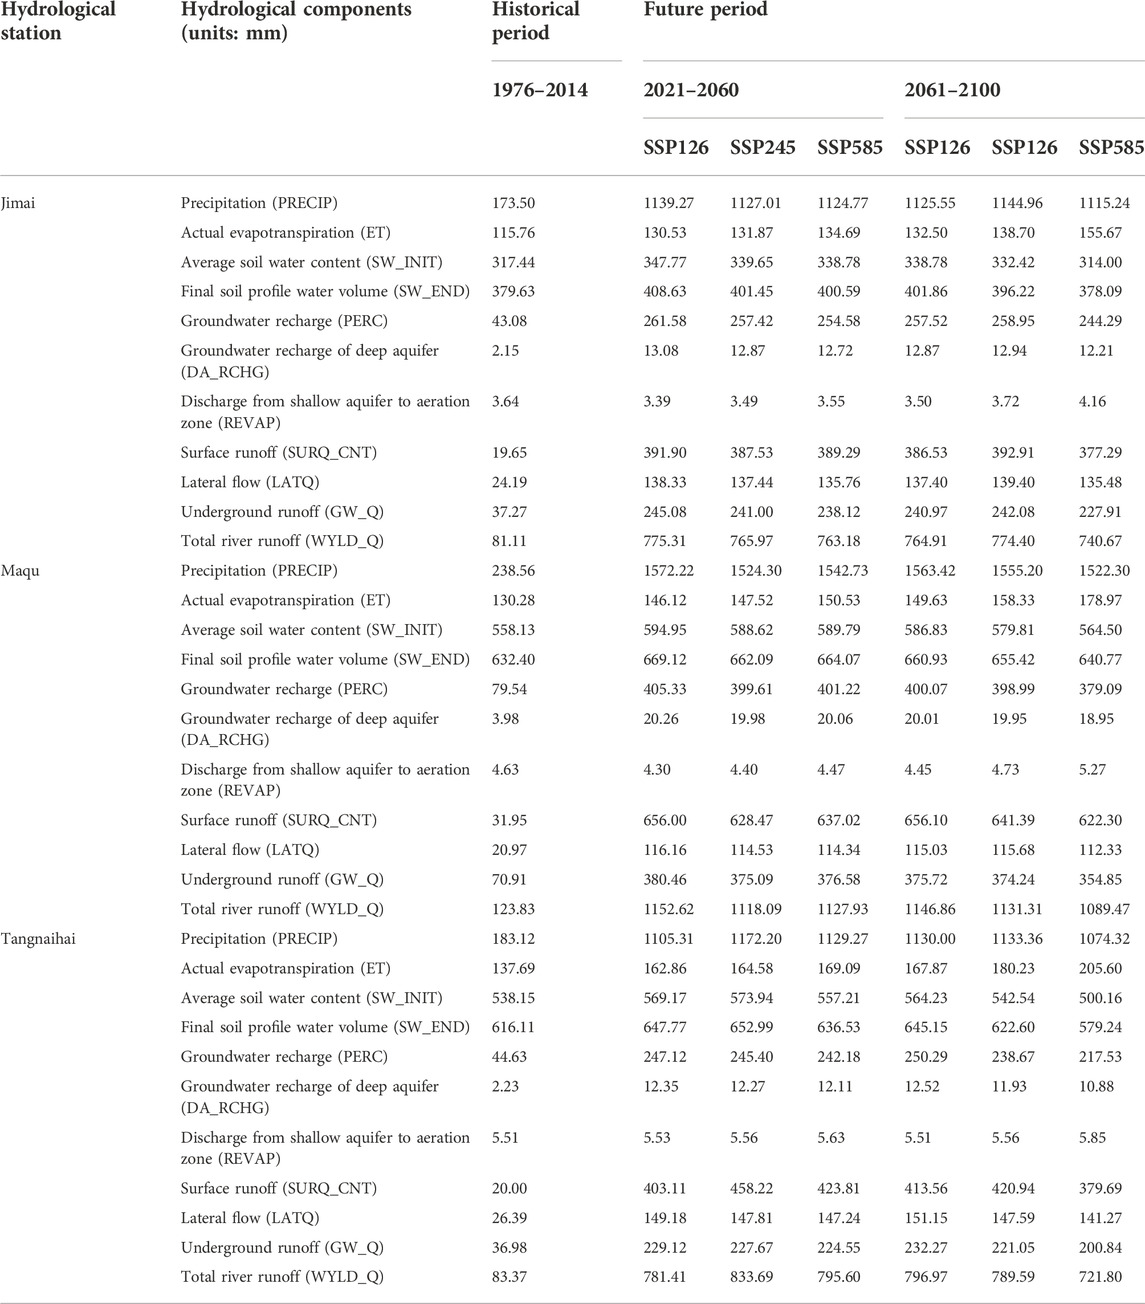
TABLE 7. Hydrological components of three hydrological stations in historical and future periods.
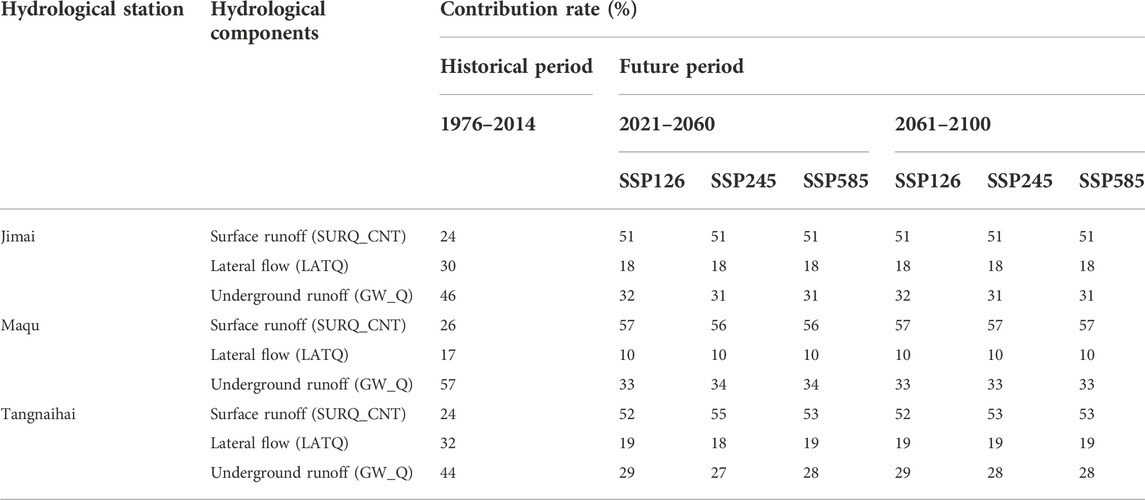
TABLE 8. Contribution rates to total river runoff of hydrological components in three hydrological stations during historical and future periods.
During the historical period, a contribution rate of 24%–26% was observed in SURQ_CNT in WYLD_Q in the three hydrological stations. In addition, those of LATQ and GW_Q were 17%–32% and 44%–57%, respectively (Table 8). According to these data, the largest contribution to the total river runoff corresponded to GW_Q. In the future period, little differences will be observed in the hydrological components of the three hydrological stations under different scenarios. The contribution rate of SURQ_CNT in WYLD_Q showed an increase of 51%–57%, and those of LATQ and GW_Q decreased 10%–19% and 27%–34%, respectively. These indicated that the largest contribution rate to total river runoff corresponded to SURQ_CNT. In summary, SURQ_ CNT, LATQ, and GW_ Q were negatively correlated with temperature and positively correlated with precipitation. In addition, small changes in DA_RCHG and REVAP were observed. During the historical period, the atmospheric rainfall in the SAYR was mainly discharged in the form of evapotranspiration. Specifically, dry seasons occurred between 1990 and 2000. In the two future periods and three scenarios, the large increase in precipitation will be the main reason for the increase in runoff in three hydrological stations as compared to that in the historical period.
Discussion
Future projections and runoff analysis
Zhao and Xu (2009) performed SAYR runoff projections using the Statistically Downscaled (SDS) technique. Their results indicated that runoff will inevitably decrease in the future. According to simulations performed using the Delta method, annual runoff variations in the SAYR were less significant. Annual average discharge will decrease in the 2020s and 2050s and increase in the 2080s, as compared to 1961–1990. Shen et al. (2010) performed a flow projection at the Longyangxia Dam in the upper reaches of the Yellow River under different emissions scenarios. Their data indicated that in the two future periods (2010s and 2020s), the average flow at the Longyangxia Dam will increase as compared to the baseline period between 1988 and 2008. In addition, a larger increment was observed under the B2 scenario as compared that under the A2 scenario. Liu et al. (2011) applied statistical downscaling to project the streamflow in the SAYR considering different future climate scenarios. Their results showed that in the two future periods (2020s and 2050s), the annual average discharge will be 593.61 m3/s and 525.11 m3/s, respectively. These data indicated a decrease of 14.9% and 24.7%, respectively, as compared with the baseline period (1961–1990). Tang et al. (2012) showed that in the two future periods (2046–2065 and 2081–2100), the runoff in the Yellow River basin will decrease. Moreover, the decrement will be larger in the later period than in the former. Under different climate scenarios, the annual average runoff in the Yellow River basin was generally larger in the upper than in the lower reaches. Wang et al. (2014) projected the future runoff trend under the A1B scenario. Their results indicated that runoff showed alternated decreasing and increasing changes (that is, decrease-increase-decrease) in the three periods (2010–2039, 2040–2069, 2070–2098) at Tangnaihai Station. The variation trend was insignificant between 2010 and 2039 and between 2040 and 2069. Moreover, a remarkable decreasing trend was observed between 2070 and 2098. Hu et al. (2022) projected soil water levels under three RCPs (RCP2.6, RCP4.5 and RCP8.5) based on 8 GCMs. Theirs results showed the annual average actual evapotranspiration will increase between 31.9%–35.3% during 2020–2059 and 33.5%–54.3% during 2060–2099, which might cause a slight decrease in soil water compared to the baseline (1976–2015) in the headwater area of the YRB. These results were compared with those obtained in our research. In previous studies, projections have shown decreasing or stabilizing runoff trends. However, our investigation indicated an increasing trend. Such differences for future change trends may be attributed to the use of different future climate scenarios, comparison of different historical periods, selection of dissimilar future periods, and climate models. For example, in Zhao and Xu (2009), the future climate scenario was generated using SDS (Delta method) and GCMs output data. Also, Liu et al. (2011) used the SRESA1B scenario, which assumed an intermediate level of future greenhouse gas concentration. This scenario was downscaled from China’s Climate Change Projection Dataset (Version 2.0). On the other hand, Tang et al. (2012) used the SRES A2 and SRES B1 emissions scenarios, Wang et al. (2014) performed the projections in the A1B scenario, and Hu et al. (2022) applied the three RCP2.6, RCP4.5, and RCP8.5 pathways. This also indicates a great level of uncertainty in the projection of future flow changes in the SAYR. In the present study, the latest MME results of 8 models with complete data in CMIP6 for the SAYR were selected for runoff projection in the near and distant future using three different scenarios. We have reasons to believe that our simulations were close to reality.
According to our simulations that considered three future scenarios, from 2021 to 2060 the lowest and highest increase in yearly average discharge at Tangnaihai and Maqu Stations corresponded to SSP585 and SSP126, respectively. However, the highest and lowest increases at Jimai Station were those of SSP585 and SSP126, correspondingly. Between 2061 and 2100, the lowest and highest increment in yearly average discharge at the three hydrological stations corresponded to SSP585 and SSP245, in that order. This probably occurred because the yearly average discharge was closely related to the precipitation trend and the surface air temperature projection under the future climate scenarios. We determined that precipitation was the main climatic factor affecting the future runoff in the SAYR. This conclusion agreed with that of Wang D. X. et al. (2020) and Bao et al. (2021). Working Group I contribution to the AR6 of IPCC states that the frequency and intensity of global-scale land-based intense precipitation events may have increased since the mid-20th century. And intense precipitation events are likely to become stronger and more frequent as global warming intensifies (IPCC, 2021). Therefore, precipitation intensity is an important factor influencing future runoff in the SAYR. With respect to the SSP126 scenario, the precipitation increment peaked between 2021 and 2060. The surface air temperature displayed a moderate rise. Since precipitation was identified as the primary factor affecting runoff, a significant runoff increase was observed under the SSP126 scenario. Since precipitation and higher temperatures will be more extreme between 2021–2060 under the SSP585 scenario, it is expected that ice and snow will melt in the SAYR. This will affect upstream runoff. The peak in precipitation increment is expected to occur between 2061–2100 under the SSP245 scenario, the temperature rise will be moderate, and higher runoff increases will be observed. Also, under the last scenario, precipitation increments will reach the peak. However, higher surface air temperatures are likely to occur, leading to greater water losses from evaporation than increases in ice and snow melting. As a consequence, a slower increase in runoff is expected to occur. The period 1976–2014 was selected for simulation. Specifically, between 1990 and 2000, the runoff time series corresponded to dry seasons. In recent years, China has implemented a series of construction projects in the SAYR, such as returning farmland to forests and grasslands. As a result, the area dedicated to farmland has decreased, and that to forests and grasslands increased. Changes in land use in the SAYR affect underlying surfaces and cause an increase in runoff. However, a long-term lag effect may occur (He et al., 2021). The results of this research also indicated that yearly average discharge at Maqu Station will increase every year in the 2020s, 2030s, and 2040s. This conclusion agreed with that published by Zhao et al. (2019).
Uncertainties and limitations
Due to the complexity of climate change, accurate projections of future climate changes are very difficult to achieve. In addition, uncertainties are inherent to GCMs processes. To address these uncertainties, the multimodal ensemble arithmetic mean from the hydrological model output driven by the 8 global climate models was selected for the present study. Some reports have indicated that the simulation performance of the multimodal ensemble with different weights was superior to that of the multimodal ensemble with equal weights. In addition, the limited resolution of the model might also add to uncertainties that affect future runoff projections. In the future, the use of different weighted multimodal ensemble or super ensemble simulation technology along with bias correction, in addition to statistical and dynamical downscaling methods will reduce uncertainties, improving the reliability and accuracy of future projections. For future work, we will carry out relevant research on this subject. In addition, the melting of glaciers and snow caused by global warming will also affect runoff in the SAYR; however, we did not take these processes into account because of the limited model simulation ability. Moreover, the degree of impact on different regions and the quantitative relationship with meteorological elements also need to be further investigated. Both, climate change and human activities will affect the runoff change in the SAYR in the future. With the intensification in anthropogenic activities and the transformation of land use, these influences will be more obvious leading to over/under-estimation of the hydrological components. Our study mainly focused on runoff projection under future climate change scenarios. Thus, some limitations should be considered. Also, some investigations indicated that the role of hydrological model uncertainty in climate change studies is remarkably high and should be routinely considered in impact studies. These aspects are beyond the scope of the present work. Hence, a more comprehensive research should consider the uncertainties and limitations inherent to runoff simulations and projections in the SAYR. This topic will be part of our future investigations.
Conclusion
In the present study, monthly runoff data for the period 1976–2014 of three SAYR hydrological stations were used along with related climatic data, DEM, land use, and soil type for simulation purposes. The simulation scheme was built for the SWAT model, and calibration and validation were carried out using the SUFI-2 algorithm. The MME data of 8 models in CMIP6 was chosen for runoff projections and analysis of data variation in the SAYR using three different scenarios and two future periods between 2021–2100. The main conclusions are as follows:
1) The sensitivity analysis showed that 27 hydrological parameters affected runoff simulation. Those parameters with strong sensitivity included ESCO, CN2, GW_REVAP, GWQMN, SOL_AWC, REVAPMN, SOL_K, SMTMP.
2) The simulated monthly discharge at the Jimai, Maqu, and Tangnaihai hydrological stations generally agreed with the observed data. In the calibration and validation periods, R2 values between the simulated and the observed values were consistently higher than 0.72 and NSE displayed values larger than 0.65. A good simulation performance for runoff in the SAYR was obtained with the SWAT model. Therefore, its applicability was proven. P-factors of the three hydrological stations displayed values higher than 0.64 in the calibration and validation period. R-factors of these three hydrological stations were below 0.50 in the calibration period, and the highest observed value was 0.65 in the validation period. In addition, small runoff simulation uncertainties were obtained at the three hydrological stations with similar simulated and observed results.
3) The annual discharge at the three hydrological stations located in the SAYR showed an overall increasing trend under the three 2021–2100 scenarios with respect to the historical period. In the next two periods (2021–2060 and 2061–2100), the yearly discharge at the three hydrological stations is expected to increase in the SSP126 and SSP245 scenarios. However, in the SSP585 scenario, it will increase in the near future (2021–2060) and then decrease in the distant future (2061–2100). In the SSP585 scenario, the yearly discharge will significantly decline in the near future (2030 and 2045) with a recovery in the distant future (2085).
4) Compared to 1976–2014, the yearly average discharge indicated that in the near future, the lowest and highest increments would be observed at Tangnaihai and Maqu Stations in the SSP585 and SSP126 scenarios, respectively. However, the highest and lowest increments at Jimai Station correspond to the SSP245 and SSP126 scenarios, correspondingly. Moreover, in the distant future, the lowest and highest increments in the Maqu and Tangnaihai Stations correspond to SSP585 and SSP245 scenarios, in the same order. The lowest increment in the Jimai Station would occur in the SSP126 scenario. It was also determined that the yearly average discharge will be smaller in the near future as compared to that in the long-term.
The Qinghai-Tibetan Plateau is one of the amplifiers of global climate change. The SAYR on the Qinghai-Tibetan Plateau represents the main runoff source of YRB and it is very crucial to the YRB. The wetland ecosystem located in the SAYR, known as the “China Water Tower,” has also played a unique role in flood storage, water conservation, and prevention of water and soil loss. Our study projected the runoff changes over time considering a continuous global warming in the future. The projections facilitate the development and implementation of an effective water management plan that minimizes negative impacts on water resources of the YRB. Our research findings can provide an important basis and theoretical support for water resources management, flood control, water conservation, and wetland protection in the SAYR.
Data availability statement
The raw data supporting the conclusion of this article will be made available by the authors, without undue reservation.
Author contributions
Project suggested by JW. Analysis done by HJ and XL. Data and comments contributed by XL and HJ. Article written by XL, HJ, JW, and YC. All authors revised it critically for important intellectual content.
Funding
This work was jointly supported by Science and Technology Plan Project in Sichuan Province (Grant 2021YJ0025) and Scientific Research Project of Chengdu University of Information Technology (Grant KYTZ201821).
Acknowledgments
The authors acknowledge the modelling groups, the Coupled Model Inter-comparison Project Phase 6 of the World Climate Research Program (WCRP) (https://esgf-index1.ceda.ac.uk/projects/cmip6-ceda/) for their roles in making available the NorESM2_MM model data set. The authors also thank the China Meteorological Data Network (http://data.cma.cn/), GSCloud (http://www.gscloud.cn/), Resources and Environmental Science Data Center (https://www.resdc.cn/Datalist1.aspx?FieldTyepID=11,6), for providing the relevant data required for the dissertation.
Conflict of interest
The authors declare that the research was conducted in the absence of any commercial or financial relationships that could be construed as a potential conflict of interest.
Publisher’s note
All claims expressed in this article are solely those of the authors and do not necessarily represent those of their affiliated organizations, or those of the publisher, the editors and the reviewers. Any product that may be evaluated in this article, or claim that may be made by its manufacturer, is not guaranteed or endorsed by the publisher.
References
Abbaspour, K. C., Johnson, C. A., and Genuchten, M. T. (2004). Estimating uncertain flow and transport parameters using a sequential uncertainty fitting procedure. Vadose Zone J. 3, 1340–1352. doi:10.2113/3.4.1340
Akoko, G., Le, T. H., Gomi, T., and Kato, T. (2021). A review of SWAT model application in Africa. Water 13, 1313. doi:10.3390/w13091313
Almazroui, M., Ashfaq, M., Islam, M. N., Rashid, I. U., Kamil, S., Abid, M. A., et al. (2021). Assessment of CMIP6 performance and projected temperature and precipitation changes over South America. Earth Syst. Environ. 5 (2), 155–183. doi:10.1007/s41748-021-00233-6
Anand, J., Gosain, A. K., Khosa, R., and Srinivasan, R. (2018). Regional scale hydrologic modeling for prediction of water balance, analysis of trends in streamflow and variations in streamflow: The case study of the Ganga River basin. J. Hydrology Regional Stud. 16, 32–53. doi:10.1016/j.ejrh.2018.02.007
Arnell, N. W. (1999). Climate change and global water resources. Glob. Environ. Change 9, S31–S49. doi:10.1016/S0959-3780(99)00017-5
Arnold, J. G., Kiniry, J. R., Srinivasan, R., Williams, J. R., Haney, E. B., and Neitsch, S. L. (2011). Soil and water assessment tool input/output file documentation, version 2009. Temple, TX, USA: Texas Water Resources Institute.
Arnold, J. G., Srinivasan, R., Muttiah, R. S., and Williams, J. R. (1998). Large area hydrologic modeling and assessment part I: Model development. J. Am. Water Resour. Assoc. 34 (1), 73–89. doi:10.1111/j.1752-1688.1998.tb05961.x
Bajracharya, A. R., Bajracharya, S. R., Shrestha, A. B., and Maharjan, S. B. (2018). Climate change impact assessment on the hydrological regime of the Kaligandaki Basin, Nepal. Sci. Total Environ. 625, 837–848. doi:10.1016/j.scitotenv.2017.12.332
Bao, G. Y., Nie, H., Dai, S., Yan, Z. N., Yang, C. H., and Dai, Q. C. (2021). Research on effects of different precipitation magnitudes on runoff changes in the headwater region of the upper Yellow River. Arid Zone Res. 38, 704–713. doi:10.13866/j.azr.2021.03.12
Bera, S., and Maiti, R. (2021). Assessment of water availability with SWAT model: A study on ganga river. J. Geol. Soc. India 97, 781–788. doi:10.1007/s12594-021-1760-9
Bhatta, B., Shrestha, S., Shrestha, P., and Talchabhadel, R. (2019). Evaluation and application of a SWAT model to assess the climate change impact on the hydrology of the Himalayan River Basin. Catena 181, 104082. doi:10.1016/j.catena.2019.104082
Bolch, T., Kulkarni, A., Kabb, A., Huggel, C., Paul, F., Cogley, J. G., et al. (2012). The state and fate of Himalayan glaciers. Science 336, 310–314. doi:10.1126/science.1215828
Cao, C., Sun, R., Wu, Z. X., and Li, Q. (2021). Response of runoff to climate change in the upper reaches of Nandujiang River basin based on SWAT model. Res. soil water conservation 29, 255–264. doi:10.13869/j.cnki.rswc.20210927.001
Chen, H., Luo, Y., Potter, C., Moran, P. J., Grieneisen, M. L., and Zhang, M. (2017). Modeling pesticide diuron loading from the san joaquin watershed into the sacramento-san joaquin delta using SWAT. Water Res. 121, 374–385. doi:10.1016/j.watres.2017.05.032
Chen, T., Gu, Z. S., Dai, H. G., and Ma, P. F. (2021). Applicability evaluation of soil moisture from CMIP6 in Tibetan Plateau. Plateau Mt. Meteorological Res. 41, 41–48. doi:10.3969/j.issn.1674-2184.2021.01.006
Dahal, P., Shrestha, M. L., Panthi, J., and Pradhananga, D. (2020). Modeling the future impacts of climate change on water availability in the Karnali River Basin of Nepal Himalaya. Environ. Res. 185, 109430. doi:10.1016/j.envres.2020.109430
Dai, J. G., Guo, W. Q., and Ren, D. F. (2014). The land cover change and the process of climate change in the source region of the Yellow River in late 20th century. Chin. J. Soil Sci. 45, 519–523. doi:10.19336/j.cnki.trtb.2014.03.002
Das, B., Jain, S., Singh, S., and Thakur, P. (2019). Evaluation of multisite performance of SWAT model in the gomti River Basin, India. Appl. Water Sci. 9, 134–143. doi:10.1007/s13201-019-1013-x
Dong, X. H., Yao, Z. J., and Chen, C. Y. (2007). Runoff variation and responses to precipitation in the source regions of the Yellow River. Resour. Sci. 29, 67–73. doi:10.3321/j.issn:1007-7588.2007.03.010
Donnelly, C., Greuell, W., Andersson, J., Gerten, D., Pisacane, G., Roudier, P., et al. (2017). Impacts of climate change on European hydrology at 1.5, 2 and 3 degrees mean global warming above preindustrial level. Clim. Change 143, 13–26. doi:10.1007/s10584-017-1971-7
Fukunaga, D. C., Cecílio, R. A., Zanetti, S. S., Oliveira, L. T., and Caiado, M. A. C. (2015). Application of the SWAT hydrologic model to a tropical watershed at Brazil. Catena 125, 206–213. doi:10.1016/j.catena.2014.10.032
Gan, R., Luo, Y., Zuo, Q., and Sun, L. (2015). Effects of projected climate change on the glacier and runoff generation in the Naryn River Basin, Central Asia. J. Hydrol. X. 523, 240–251. doi:10.1016/j.jhydrol.2015.01.057
Gao, G., Fu, B., Wang, S., Liang, W., and Jiang, X. (2016). Determining the hydrological responses to climate variability and land use/cover change in the Loess Plateau with the Budyko framework. Sci. Total Environ. 557, 331–342. doi:10.1016/j.scitotenv.2016.03.019
Griensven, V. A., Ndomba, P., Yalew, S., and Kilonzo, F. (2012). Critical review of SWAT applications in the upper Nile basin countries. Hydrol. Earth Syst. Sci. 16, 3371–3381. doi:10.5194/hess-16-3371-2012
He, X. H., Meng, J. L., Guo, H. L., and Tian, Z. H. (2021). Impacts of land use and climate change on runoff in Luohe River Basin. Hydropower Energy Sci. 39, 31–34.
Hu, J. Y., Wu, Y. P., Sun, P. C., Zhao, F. B., Ke, S., Li, T. J., et al. (2022). Predicting long-term hydrological change caused by climate shifting in the 21st century in the headwater area of the Yellow River Basin. Stoch. Environ. Res. Risk Assess. 36 (6), 1651–1668. doi:10.1007/s00477-021-02099-6
Huang, Q., and Zhao, X. H. (2004). Factors affecting runoff change in the upper reaches of the Yellow River. Prog. Nat. Sci. 14, 811–816. doi:10.1080/10020070412331344371
IPCC (2021). Climate change 2021: The physical science basis [M/OL]. 2021 [2021-08-01]. Availabe at: https://www.ipcc.ch/report/ar6/wgl/downloads/report/IPCC_AR6_WGI_Full_Report.pdf (Accessed 0801, 2021).
Jiang, T., Lv, Y. R., Huang, J. L., Wang, Y. J., Su, B. D., and Tao, H. (2020). New scenarios of CMIP6 model (SSP-RCP) and its application in the Huaihe River Basin. Adv. Meteorological Sci. Technol. 10, 102–109. doi:10.3969/j.issn.2095-1973.2020.05.016
Jiang, W. H., and Chen, H. P. (2021). Assessment and projection of changes in temperature extremes over the mid-high latitudes of Asia based on CMIP6 models. Trans. Atmos. Sci. 44, 592–603. doi:10.13878/j.cnki.dqkxxb.20210203001
Kim, Y. H., Min, S. K., Zhang, X., Sillmann, J., and Sandstad, M. (2020). Evaluation of the CMIP6 multi-model ensemble for climate extreme indices. Weather Clim. Extrem. 29, 100269. doi:10.1016/j.wace.2020.100269
Kobierska, F., Jonas, T., Zappa, M., Bavay, M., Magnusson, J., and Bernasconi, S. M. (2013). Future runoff from a partly glacierized watershed in central Switzerland: A two-model approach. Adv. Water Resour. 55, 204–214. doi:10.1016/j.advwatres.2012.07.024
Li, C. Y., and Fang, H. Y. (2021). Assessment of climate change impacts on the streamflow for the mun River in the mekong basin, southeast asia: Using SWAT model. Catena 201, 105199. doi:10.1016/j.catena.2021.105199
Li, D. F., Tian, Y., Liu, C. M., and Hao, F. H. (2004). Impact of land-cover and climate changes on runoff of the source regions of the Yellow River. J. Geogr. Sci. 14, 330–338. doi:10.1007/BF02837414
Li, K., Wang, Y. Q., Li, X. D., Yuan, Z., and Xu, J. J. (2021). Simulation effect evaluation of single-outlet and multi-outlet calibration of Soil and Water Assessment Tool model driven by Climate Forecast System Reanalysis data and ground-based meteorological station data-a case study in a Yellow River source. Water Supply 21, 1061–1071. doi:10.2166/ws.2020.312
Li, N. Y. (2018). Studies on the relationship between macro-ecological changes of marsh and climate in the Yellow River source region. Kunming: Yunnan University.
Li, Q., Zhang, J., and Gong, H. L. (2015). Hydrological simulation and parameter uncertainty analysis using SWAT model based on SUIF-2 algorithm for Guishuihe River Basin. J. China Hydrology 35, 43–48.
Li, S. Q., Liu, J. Y., Yan, X. C., Liao, Y. C., Chen, Q., Xie, Y., et al. (2021). Comparative analysis of SWAT model research trends at home and abroad based on bibliometrics. Chengdu: Journal of China West Normal University (Natural Sciences). http://kns.cnki.net/kcms/detail/51.1699.N.20211112.1821.018.html.
Li, W. T., Yang, X. L., Ren, L. L., Gao, T., and Gu, Y. J. (2021). Spatial and temporal distribution characteristics of blue and green water resources in the Yellow River source region based on SWAT model. China Rural Water Hydropower 8, 59–66.
Li, X. H., Chen, Z. F., Wang, L., and Liu, H. (2022). Future projections of extreme temperature events in Southwest China using nine models in CMIP6. Front. Earth Sci. 10, 942781. doi:10.3389/feart.2022.942781
Liu, C. H., Zhu, X. D., and Bai, Y. F. (2011). A study on runoff response to climate change and its prediction in the headwater region of the Yellow River over the recent 49 years. Resour. Sci. 33, 1236–1241. CNKI:SUN:ZRZY.0.2011-07-005.
Mankin, K. R., Srinivasan, R., and Arnold, J. G. (2010). Soil and water assessment tool (SWAT) model: Current developments and applications. Trans. ASABE 53, 1423–1431. doi:10.13031/2013.34915
Marahatta, S., Aryal, D., Devkota, L. P., Bhattarai, U., and Shrestha, D. (2021b). Application of SWAT in hydrological simulation of complex mountainous River Basin (Part II: Climate change impact assessment). Water 13, 1548. doi:10.3390/w13111548
Marahatta, S., Devkota, L. P., and Aryal, D. (2021a). Application of SWAT in hydrological simulation of complex mountainous River Basin (Part I: Model development). Water 13, 1546. doi:10.3390/w13111546
Martínez-Salvador, A., Millares, A., Eekhout, J. P. C., and Conesa-García, C. (2021). Assessment of streamflow from EURO-CORDEX regional climate simulations in semi-arid catchments using the SWAT model. Sustainability 13, 7120. doi:10.3390/su13137120
Moriasi, D., Gitau, M. N., Pai, N., and Daggupati, P. (2015). Hydrologic and water quality models: Performance measures and evaluation criteria. Trans. Am. Soc. Agric. Biol. Eng. 58, 1763–1785. doi:10.13031/trans.58.10715
Mote, P. W., and Salathé, E. P. (2010). Future climate in the pacific northwest. Clim. Change 102, 29–50. doi:10.1007/s10584-010-9848-z
Neitsch, S. L., Arnold, J. G., Kiniry, J. R., and Williams, J. R. (2009). Soil and water assessment tool theoretical documentation-version 2009, soil and water research laboratory. Temple, TX, USA: US Department of Agriculture-Agricultural Research Service.
Niu, Z., Feng, L., Chen, X., and Yi, X. (2021). Evaluation and future projection of extreme climate events in the Yellow River Basin and yangtze River Basin in China using ensembled CMIP5 models data. Int. J. Environ. Res. Public Health 18, 6029. doi:10.3390/ijerph18116029
Osei, M. A., Amekudzi, L. K., Wemegah, D. D., Preko, K., Obiridanso, K., and Obiri-Danso, K. (2019). The impact of climate and land-use changes on the hydrological processes of Owabi catchment from SWAT analysis. J. Hydrology Regional Stud. 25, 100620. doi:10.1016/j.ejrh.2019.100620
Quenum, G. M. L. D., Nkrumah, F., Klutse, N. A. B., and Sylla, M. B. (2021). Spatiotemporal changes in temperature and precipitation in west africa. Part I: Analysis with the CMIP6 historical dataset. Water 13, 3506. doi:10.3390/w13243506
Seland, Ø., Bentsen, M., Olivié, D., Toniazzo, T., Gjermundsen, A., Graff, L. S., et al. (2020). Overview of the Norwegian Earth System Model (NorESM2) and key climate response of CMIP6 DECK, historical, and scenario simulations. Geosci. Model. Dev. 13, 6165–6200. doi:10.5194/gmd-13-6165-2020
Seneviratne, S. I., and Hauser, M. (2020). Regional climate sensitivity of climate extremes in CMIP6 versus CMIP5 multimodel ensembles. Earths Future 8, e2019EF001474. doi:10.1029/2019EF001474
Serrao, E. A. O., Silva, M. T., Ferreira, T. R., Ataide, L. C. P., Santos, C. A., Lima, A. M. M., et al. (2022). Impacts of land use and land cover changes on hydrological processes and sediment yield determined using the SWAT model. Int. J. Sediment Res. 37, 54–69. doi:10.1016/j.ijsrc.2021.04.002
Shen, H. Y., Li, L., Chen, X. G., Dai, S., Wang, Z. Y., and Liu, C. H. (2010). Impacts of climate change and fluctuations on flows into the Longyangxia reservoir. Resour. Sci. 32, 1513–1519. CNKI:SUN:ZRZY.0.2010-08-012.
Shi, Y. F., and Zhang, X. S. (1995). Impacts and future trends of climate change on surface water resources in the Northwest Arid Zone. Sci. China (Series B) 9, 968–977. doi:10.1360/zb1995-25-9-968
Shrestha, S., Shrestha, M., and Shrestha, P. K. (2018). Evaluation of the SWAT model performance for simulating river discharge in the Himalayan and tropical basins of Asia. Hydrol. Res. 49, 846–860. doi:10.2166/nh.2017.189
Song, Z. F., Zeng, J. J., Jin, Y. C., Hu, X. Q., Sun, D. Y., Lu, S. C., et al. (2016). Distributed simulation of monthly runoff using SWAT and SUFI-2 algorithm in Shiyang River basin. Bull. soil water conservation 36, 172–177. doi:10.13961/j.cnki.stbctb.2016.05.035
Tan, M. L., Gassman, P. W., Srinivasan, R., Arnold, J. G., and Yang, X. (2019). A review of SWAT studies in Southeast Asia: Applications, challenges and future directions. Water 11, 914. doi:10.3390/w11050914
Tang, F. F., Xu, Z. X., and Zuo, D. P. (2012). Response of runoff to climate change in the upper Yellow River Basin. Resour. Sci. 34, 1079–1088.
Taylor, K. R. (2001). Summarizing multiple aspects of model performance in a single diagram. J. Geophys. Res. 106, 7183–7192. doi:10.1029/2000JD900719
Walsh, J. E., Chapman, W. L., Romanovsky, V., Christensen, J. H., and Stendel, M. (2008). Global climate model performance over Alaska and Greenland. J. Clim. 21, 6156–6174. doi:10.1175/2008jcli2163.1
Wang, D. X., Tian, S. M., Jiang, S. Q., Dong, X. N., Li, Z. W., and Zhang, L. (2020). Research progress of the evolution of runoff in the source area of the Yellow River. Yellow River 42 (9), 90–95. doi:10.3969/j.issn.1000-1379.2020.09.017
Wang, G. Q., Zhang, J. X., Xuan, Y. Q., Jin, J. L., Bao, Z. X., He, R. M., et al. (2013). Simulating the impact of climate change on runoff in a typical river catchment of the loess plateau, China. J. Hydrometeorol. 14, 1553–1561. doi:10.1175/JHM-D-12-081.1
Wang, J. Q., Liu, S. P., Hao, Y. L., and Yang, J. P. (2014). Change trend of runoff in source region of Yellow River under A1B scenario. J. Hohai Univ. Nat. Sci. 42, 95–100. doi:10.3876/j.issn.1000-1980.2014.02.001
Wang, L., Du, H., and Xie, J. Z. (2020). SWAT based runoff simulation of Qingshui River Basin in zhangjiakou City. J. Hydroecology 41, 34–40. doi:10.15928/j.1674-3075.2020.04.005
Wang, M. Y., Xie, H. W., Zhao, J., and Wu, Y. P. (2019). Runoff simulation of the Yellow River source region based on SWAT model. J. Qinghai Univ. 37, 39–46. doi:10.13901/j.cnki.qhwxxbzk.2019.01.007
Wang, Y., Li, H. X., Wang, H. J., Su, B., and Chen, H. (2021). Evaluation of CMIP6 model simulations of extreme precipitation in China and comparison with CMIP5. Acta Meteorol. Sin. 79, 369–386. doi:10.11676/qxxb2021.031
White, E. D., Easton, Z. M., Fuka, D. R., Collick, A. S., Adgo, E., Mccartney, M., et al. (2011). Development and application of a physically based landscape water balance in the SWAT model. Hydrol. Process. 25, 915–925. doi:10.1002/hyp.7876
Yang, J., Reichert, P., Abbaspour, K. C., Xia, J., and Yang, H. (2008). Comparing uncertainty analysis techniques for a SWAT application to the Chaohe Basin in China. J. Hydrology 385, 1–23. doi:10.1016/j.jhydrol.2008.05.012
Yang, X. L., Zhou, B. T., Xu, Y., and Han, Z. Y. (2021). CMIP6 evaluation and projection of temperature and precipitation over China. Adv. Atmos. Sci. 38, 817–830. doi:10.1007/s00376-021-0351-4
Yang, Z. K., Tian, J., Li, W. Y., Su, W. R., Guo, R. Y., and Liu, W. J. (2021). Spatio-temporal pattern and evolution trend of ecological environment quality in the Yellow River Basin. Acta eco. Sin. 41, 7627–7636. doi:10.5846/stxb202012083131
Zhai, Y. X., Cui, S. H., Gao, B., Zhang, Q. H., and Huang, W. (2021). Spatio-temporal characteristics of reactive nitrogen emission from agricultural production in the Yellow River Basin. Acta Sci. Circumstantiae 41, 2886–2895. doi:10.13671/j.hjkxxb.2021.0010
Zhang, J. M. (2020). Preliminary assessment of climate change in the lancang River Basin based on CMIP6 data set. Nanjing: Nanjing University of Information Science and Technology. doi:10.27248/d.cnki.gnjqc.2020.000302
Zhang, J. Y., Lun, Y. R., Liu, L., Liu, Y. X., Li, X., and Xu, Z. X. (2021). Assessment of adaptability and prediction of future climate change of CMIP6 multi-model over the Tibetan Plateau. Beijing: Journal of Beijing normal university (natural science edition). https://kns.cnki.net/kcms/detail/11.1991.n.20210811.1700.005.html.
Zhang, L., Karthikeyan, R., Bai, Z., and Srinivasan, R. (2017). Analysis of streamflow responses to climate variability and land use change in the Loess Plateau region of China. Catena 154, 1–11. doi:10.1016/j.catena.2017.02.012
Zhang, L. X., Chen, X. L., and Xin, X. G. (2019). Short commentary on CMIP6 scenario model Intercomparison project (ScenarioMIP). Clim. Change Res. 15, 519–525. doi:10.12006/j.issn.1673-1719.2019.082
Zhang, Y. G., Su, F. G., Hao, Z. C., Xu, C. Y., Yu, Z. B., Wang, L., et al. (2015). Impact of projected climate change on the hydrology in the headwaters of the Yellow River basin. Hydrol. Process. 29, 4379–4397. doi:10.1002/hyp.10497
Zhao, F. F., and Xu, Z. X. (2009). Hydrological response to climate change in headwater catchment of the Yellow River Basin. Resour. Sci. 31, 722–730. doi:10.3321/j.issn:1007-7588.2009.05.002
Zhao, M. X., Su, B. D., Jiang, T., Wang, A. Q., and Tao, H. (2021). Simulation and projection of precipitation in the upper Yellow River Basin by CMIP6 multi-model ensemble. Plateau Meteorol. 40, 547–558. doi:10.7522/j.issn.1000-0534.2020.00066
Zhao, N. N., Wang, H. N., Zhang, B. B., Liu, J., Xu, W. G., and Yu, Y. L. (2019). Runoff variation in Zoige Wetland Basin and its response to climate change. Water Resour. Prot. 35, 40–47. doi:10.3880/j.issn.1004-6933.2019.05.008
Zhou, B., T., and Qian, J. (2021). Changes of weather and climate extremes in the IPCC AR6. Clim. Change Res. 17, 713–718. doi:10.12006/j.issn.1673-1719.2021.167
Zhou, T. J., Zou, L. W., and Chen, X. L. (2019). Commentary on the coupled model Intercomparison project phase 6 (CMIP6). Clim. Change Res. 15, 445–456. doi:10.12006/j.issn.1673-1719.2019.193
Zhou, W. C., and Han, Z. Y. (2018). Assessing CMIP5 climate simulations and objective selection of models over the Yellow River basin. J. Meteorology Environ. 34, 42–55. doi:10.3969/j.issn.1673-503X.2018.06.005
Keywords: SWAT model, NorESM2_MM model, runoff simulation, runoff projection, the source area of the Yellow River
Citation: Li X, Jia H, Chen Y and Wen J (2022) Runoff simulation and projection in the source area of the Yellow River using the SWAT model and SSPs scenarios. Front. Environ. Sci. 10:1012838. doi: 10.3389/fenvs.2022.1012838
Received: 05 August 2022; Accepted: 17 November 2022;
Published: 01 December 2022.
Edited by:
Guobin Fu, CSIRO Land and Water, AustraliaReviewed by:
Ryan Thomas Bailey, Colorado State University, United StatesJunyu Qi, University of Maryland, College Park, United States
Copyright © 2022 Li, Jia, Chen and Wen. This is an open-access article distributed under the terms of the Creative Commons Attribution License (CC BY). The use, distribution or reproduction in other forums is permitted, provided the original author(s) and the copyright owner(s) are credited and that the original publication in this journal is cited, in accordance with accepted academic practice. No use, distribution or reproduction is permitted which does not comply with these terms.
*Correspondence: Jun Wen, andlbkBjdWl0LmVkdS5jbg==