 Qifen Zha
 Zhen Liu
 Zhihui Song
 Jian Wang
- School of Finance and Economics, Jiangsu University, Zhenjiang, Jiangsu, China
Based on the data of 85 cities in the three major urban agglomerations in the Yangtze River Economic Belt from 2011 to 2020, this paper measures the level of high-quality economic development of each city through the improved entropy-weighted TOPSIS method and uses the kernel density estimation method, Dagum Gini coefficient, and convergence model to further study the dynamic evolution, regional differences, and convergence state of the high-quality economic development level of the three major urban agglomerations in the Yangtze River Economic Belt. The study finds that: 1) the high-quality economic development level of each city within the three major urban agglomerations of the Yangtze River Economic Belt has been continuously improved over time, but the development level of each urban agglomeration is not the same; 2) the high-quality economic development level of the three urban agglomerations in the Yangtze River Economic Belt has spatial differences, that is, the high-quality economic development level of the Yangtze River Delta urban agglomeration is better than the two urban agglomerations; 3) the σ convergence and β convergence characteristics exist in the three major urban agglomerations as a whole as well as in each urban agglomeration, and the β convergence rates of the urban agglomerations are not consistent. On the whole, the convergence rate of the middle reaches of the Yangtze River urban agglomeration is the fastest, followed by the Chengdu-Chongqing urban agglomeration, and the Yangtze River Delta urban agglomeration is the slowest. Finally, based on the findings of the study, targeted policy recommendations to promote the high-quality economic development of the three major urban agglomerations in the Yangtze River Economic Belt are proposed.
1 Introduction
In the face of the world’s unprecedented changes in a century, China’s proposal to “accelerate the formation of a new development pattern in which the domestic cycle is the mainstay and the domestic and international cycles promote each other” is a strategic choice to promote China’s high-quality economic development. As socialism with Chinese characteristics has entered a new era, China’s economic development has also shifted from the past high-speed growth stage to a high-quality development stage. However, given the differences in regional resource endowments, the overall level of China’s high-quality economic development has been characterized by regional unbalances (Pan et al., 2021), As a new type of important carrier to promote high-quality economic development, urban agglomerations have become the focus of China’s current economic work to promote a coordinated regional economic development strategy with city agglomerations as the mainstay.
The concept of high-quality economic development, first introduced in the 19th Party Congress Report, is a concept with very Chinese characteristics, while foreign scholars tend to express it through the concept of quality of economic growth. (Barro, 2002) argues that the quality of economic growth does not only include the rate of economic growth but also other social factors such as life expectancy and environmental conditions. Mlachila et al. (2017) argue that good quality economic growth is a sustainable, socially friendly high rate of economic growth that is multidimensional and includes the intrinsic nature of economic growth and the social outputs that result from it. Chen and Wang (2021) argue that high-quality economic development differs from traditional economic growth in that it is a multidimensional economic development that meets the growing needs of people for a better life. Li et al. (2022) argue that the connotation of high-quality economic development is consistent with the UN’s goal of sustainable development, which emphasizes the harmonization of economic and social aspects. In terms of the characteristics of high-quality economic development, Zheng et al. (2019) argue that high-quality economic development is a new approach to development, which emphasizes the quality of economic development rather than speed. Liu et al. (2021) argue that high-quality economic development is a growth model for an innovation-driven economy characterized by innovation, efficiency, energy efficiency, environmental protection, and high value-addedness.
Research on the measurement of high-quality economic development has focused on two aspects. One is to measure the level of high-quality economic development through a single indicator. Li et al. (2021a) use GDP per capita as a proxy variable for high-quality economic development, this measurement is often too simplistic and does not capture the essence of quality economic development. There are also scholars who measure the level of quality economic development in terms of efficiency, i.e., total factor productivity (TFP) (Zhao and Yuan, 2020; Zeng et al., 2022). Gao et al. (2021) used the Global Malmquist Index to measure the quality of China’s economic growth and found that the quality of China’s economic growth has been on an upward trend. As high-quality economic development is a relatively comprehensive and integrated development process, the use of a single indicator as a proxy variable for the level of high-quality economic development often does not provide a good overview of all aspects of high-quality economic development, so some scholars have constructed a system of indicators to comprehensively evaluate the level of high-quality economic development. Wong et al. (2021a) construct an index system for evaluating the quality of economic growth of 268 cities in China in three dimensions: economic growth dynamics, economic growth structure, and economic growth performance. Kong et al. (2022) construct the evaluation index system of high-quality urban economic development in China from three dimensions: economic growth momentum, economic growth structure and economic growth results. Luo et al. (2021) Measuring the quality of economic growth in China’s provinces in terms of economic growth efficiency, economic growth stability, and economic growth persistence. Wong et al. (2021b) construct a system of indicators to evaluate the quality of urban economic growth in terms of six dimensions: innovation, stability, effectiveness, coordination, sustainability, and sharing. As the guiding concept of high-quality economic development, the new development concept includes the five development concepts of innovation, coordination, green, openness, and sharing, so the evaluation index system of high-quality economic development can be constructed from these five dimensions (Li et al., 2021b; Yan et al., 2021). Ou et al. (2020) construct an index system for evaluating the level of high-quality economic development of 21 prefecture-level cities in Guangdong Province based on the new development concept and finally find that the high-quality economic development of Guangdong Province presents an uneven development between regions.
In summary, the existing literature is rich in research on the connotation and measurement of high-quality economic development, but mainly at the provincial and city levels, while research at the urban agglomeration level is lacking. The possible marginal contribution of this paper includes the following points: 1) The improved entropy TOPSIS method is used to measure the level of high-quality economic development, so as to obtain a more accurate and reasonable result; 2) Compared with previous studies, the research scope of this paper is mainly on the level of urban agglomeration, that is, through and using the kernel density estimation method, Dagum Gini coefficient, kernel density estimation method and convergence model to study the dynamic evolution, regional differences and convergence state of the high-quality economic development level of the three major urban agglomerations in the Yangtze River Economic Belt; 3) This paper not only focuses on the gap and future trend of high-quality economic development level among cities within each urban agglomeration, but also on the difference of high-quality economic development level among the three urban agglomerations.
The arrangement structure of this paper is as follows: the second part is the introduction of materials and methods; the third part is the demonstration of empirical results; the fourth part is the analysis of empirical results; the fifth part is the conclusion; and the sixth part is the corresponding policy recommendations.
2 Materials and methods
2.1 Research methodology
2.1.1 Improved entropy TOPSIS method
The CRITIC method and the entropy method, as two methods of objective weighting, have their own advantages and disadvantages. The CRITIC method measures the objective weights of indicators by evaluating the comparative strength and conflict of indicators but cannot measure the dispersion of indicators, while the entropy method, as a method of determining the weights of indicators mainly by evaluating the dispersion of indicators, can combine the two and reflect the weights of indicators more objectively (Lu et al., 2022). Therefore, this paper uses the improved CRITIC-entropy-weighted TOPSIS method to integrate a number of indicators, i.e., first using the principle of minimum relative entropy to obtain the composite weights of the CRITIC method and the entropy-weighted method, and then combining them with the ideal approximation method (TOPSIS) to measure the final score of each evaluation object. However, TOPSIS using the traditional Euclidean distance sometimes cannot accurately reflect the superiority and inferiority of each scheme, so it is necessary to introduce the virtual worst sample to improve this problem. The specific calculation steps are as follows.
Assuming m evaluation indicators and n evaluation objects, the improved CRITIC-entropy-weighted TOPSIS model is constructed as follows.
Of which:
where Ci is the composite score of each evaluation object, wj is the composite weight obtained by the principle of minimum relative entropy, xij is the standardised value of the original data, w1j and w2j are the weights calculated by the CRITIC method and the entropy method respectively, where σj is the standard deviation of indicator j, Rkj is the correlation coefficient between indicator j and other indicators, Vj+ is the positive ideal solution, Vj- is the negative ideal solution and Vj* is the virtual worst solution.
2.1.2 Kernel density estimation
Kernel density estimation as a non-parametric estimation method (Rosenblatt, 1956; Parzen, 1962) is to be used to portray the distribution dynamics of the variables and further analyse the distribution variance status of the variables. In this paper, the Gaussian kernel density function is used to estimate the distribution dynamic level of high-quality economic development of urban agglomerations in the Yangtze River Economic Belt, and the absolute difference level of high-quality economic development is investigated by its distribution position, shape, ductility, and polarisation characteristics.
2.1.3 Dagum Gini coefficient and decomposition
The Dagum Gini coefficient is the main measure of inequality and is more realistic than the traditional Gini coefficient and the Thiel index, since it relaxes the original harsher assumptions and takes into account the overlap of sub-samples. Dagum (Dagum, 1997) decomposes the Gini coefficient (G) into three main components: intra-regional variation (Gw), inter-regional variation (Gnb) and hypervariable density (Gt), where the super-variable density (Gt) is the Gini coefficient due to the portion of the subgroups that overlap due to crossover. By comparing the magnitude of the contribution of the three components of intra-regional variation, inter-regional variation, and hypervariable density to the overall Gini coefficient, the main causes of the uneven level of quality development affecting the urban agglomerations in the Yangtze River Economic Zone can be further explored.
2.1.4 Convergence model
2.1.4.1 σ convergence
σ convergence is a process in which the deviation in the level of high-quality economic development in various regions decreases over time (Sala-i-Martin, 1996). In this paper, the coefficient of variation is used to describe the σ convergence of high-quality economic development. The main formulas are as follows:
in which hqdij represents the level of high-quality economic development of cities,
2.1.4.2 β convergence
β convergence is mainly derived from the macroeconomic theory of economic growth, which states that countries that are relatively backward in economic development tend to have a faster growth rate than developed countries, and the gap between the backward and developed countries will gradually decrease until it eventually converges to a steady state (Islam, 2003). β convergence can be divided into absolute β convergence and conditional β convergence. Absolute β convergence refers to the convergence of high-quality economic development among regions assuming that other factors remain unchanged, and absolute β convergence is as follows:
Where ln(hqdi,t+1/hqdi,t) represents the growth rate of high-quality urban economic development from moment t to moment t+1, β is the convergence coefficient, and if β is significantly less than 0, it means there is absolute convergence. μi represents individual fixed effects; ηt represents time-fixed effects; εit represents the random disturbance variable, and the rate of convergence ν is as follows:
Considering the existence of an economic agglomeration effect, the high-quality development of the regional economy will be affected by the high-quality development of adjacent areas. Therefore, it is necessary to introduce a spatial panel model for the study, so a spatial Durbin model (SDM) has been established:
where wij denotes the spatial weight matrix, because non-adjacent cities may also influence each other, this paper chooses to construct the inverse distance matrix instead of the adjacency matrix as the spatial weight matrix, with row normalization. ρ and δ represent the spatial correlation coefficients, and λ denotes the spatial error coefficient. When ρ≠0 but δ = λ = 0, the model degenerates to a spatial autoregressive model (SAR), and when λ≠0 and δ = ρ = 0, the model degenerates to a spatial error model (SEM) (Lesage and Pace, 2009), The appropriate spatial econometric model is selected for model estimation mainly by LM and LR tests, and if the results of LM and LR tests conflict, the more general SDM model should be selected in this case (Elhorst, 2010).
Conditional β convergence refers to the fact that the level of high-quality economic development between regions also shows convergence when considering the different conditions of the respective resource endowments of each city. Therefore, other factors that affect the level of high-quality economic development should be considered when constructing the conditional β convergence model. Specifically, these factors mainly include government policy-making, financial development, and demographic conditions (Li et al., 2021b; Liu et al., 2021; Zhou et al., 2022). The government takes the initiative to guide the development of urban industries through the implementation of fiscal policies, thus accelerating the flow of resource factors and promoting high-quality economic development; i.e., government intervention can, to a certain extent, guide the development of urban economies; finance, as the core of the economy (Nawaz et al., 2019), can promote the coupled and coordinated development of financial development and industrial upgrading by flexibly allocating financial resources, thus allocating funds to the corresponding industries in a rational manner. Therefore, the level of financial development of a city is closely related to the level of high-quality economic development of the city; the population, as an important element in promoting economic development, can provide sufficient human resources for economic development. In the stage of high-quality development, a single population quantity cannot promote high-quality economic development, but the quality of the population is the important engine to promote high-quality economic development (Kremer, 1993), i.e., a high-quality labour force population can lead the development of a city. As an important indicator of population quality, there is a close relationship between the level of human capital and the high-quality development of a city’s economy. Therefore, the level of government intervention (fina), the level of financial development (findv) and the level of human capital (human) are introduced as control variables for the study, where the level of government intervention is characterized by the share of fiscal expenditure in GDP, the level of financial development is characterized by the share of deposit and loan balances of financial institutions in GDP, and the level of human capital is characterized by the number of years of education per capita. The conditional β convergence model is as follows:
Where Xi,t represent the control variables, and construct a conditionally convergent spatial Durbin model as follows:
2.2 Research area and data
2.2.1 Research area
The Yangtze River Economic Belt covers 11 provinces and cities in China (Chen et al., 2018; Liu et al., 2020), spanning three major sectors in the east, west, and east China, with a population and economic volume that occupies “half of the country,” and is an important “growth pole” for the high-quality development of China’s regional economy. As shown in Figure 1, the Yangtze River Economic Belt comprises three major city clusters, namely the Yangtze River Delta urban agglomeration, the urban agglomeration in the middle reaches of the Yangtze River, and the Chengdu-Chongqing urban agglomeration1, which are located in the lower, middle, and upper reaches of the Yangtze River, respectively. As an important foundation for the economic development of the Yangtze River Economic Belt (Huang et al., 2018), the three major city agglomerations have good economic vitality of their own. In 2016, China put forward the Outline of the Development Plan of the Yangtze River Economic Belt, which emphasizes the leading role of the three major urban agglomerations and promotes the high-quality development of the Yangtze River Economic Belt (Huang et al., 2021). Therefore, accelerating the high-quality economic development of the three major city agglomerations in the Yangtze River Economic Belt under the new development pattern is the key to promoting the high-quality development of the Yangtze River Economic Belt, as well as an important means to promote and drive the high-quality coordinated development of other regions. However, the three major urban agglomerations in the Yangtze River Economic Belt are facing the problems of unbalanced and uncoordinated development (Liu et al., 2022). So, measuring the level of high-quality economic development of the three major urban agglomerations in the Yangtze River Economic Belt, and further exploring their differences and development dynamics, as well as exploring possible problems therein, is important and fundamental to effectively promoting the high-quality economic development of the urban agglomerations in the Yangtze River Economic Belt.
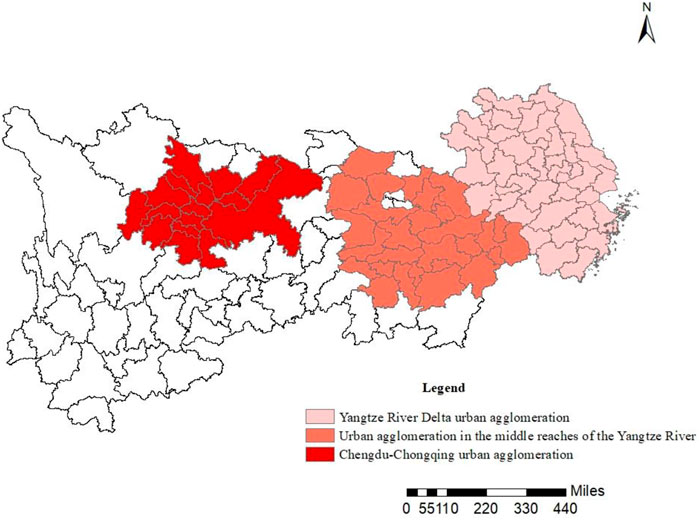
FIGURE 1. Distribution of three urban agglomerations in Yangtze river economic belt.
2.2.2 Data source
This paper focuses on data related to the three major urban agglomerations in the Yangtze River Economic Belt from 2011–20202. Most of the indicator data in the paper comes from the China Urban Statistical Yearbook, the CEIC database, and statistical bulletins of various cities in previous years, while patent data comes from the CNRDS database. In order to eliminate the influence of price factors, all indicator variables involving monetary prices are deflated in this paper, using the GDP deflator of 2003 as the base period. Linear interpolation and trend forecasting were used to fill in some of the missing data, and descriptive statistics are shown in Table 1.
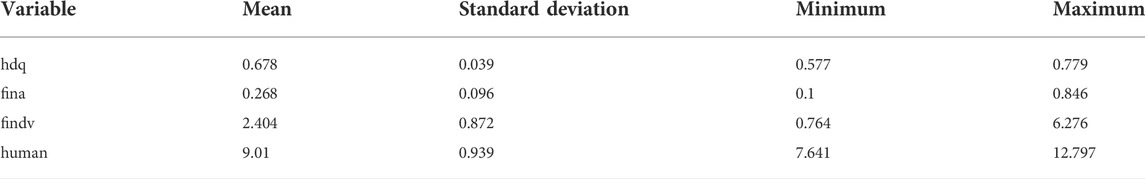
TABLE 1. Descriptive statistics of variables.
2.3 Construction of the index system
The new development concept is a strategic guideline for high-quality economic development proposed by the Chinese government, and the new development concept should be implemented to promote high-quality economic development in the new era. So this paper constructs an index system for the high-quality economic development of the Yangtze River Economic Belt Urban Agglomerations based on the five development concepts, which include five dimensions: innovation, coordination, green, openness, and sharing, with a total of 18 indicators, as shown in Table 2.
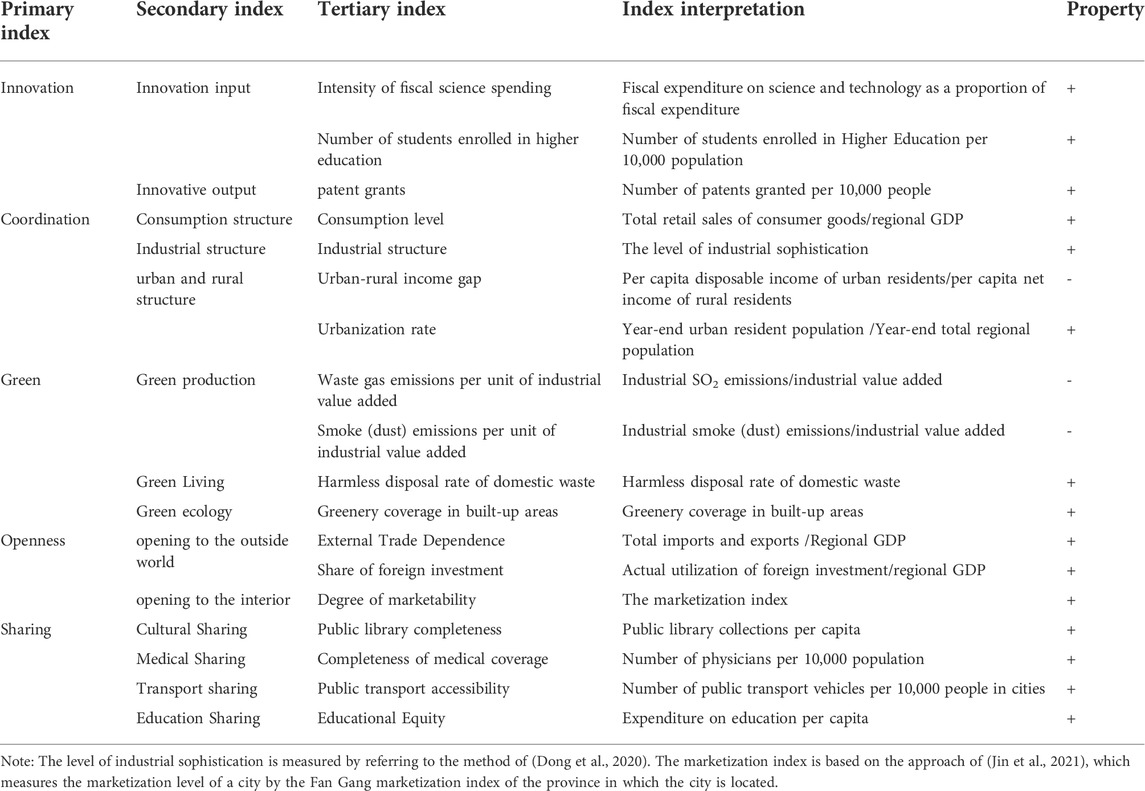
TABLE 2. Evaluation index system for high-quality economic development of the three major city agglomerations in the Yangtze River Economic Belt.
2.3.1 Innovation
Innovation is an important driver for promoting high-quality economic development. Innovation is an important factor leading to economic growth (Kogan et al., 2017). It can promote industrial change, improve total factor productivity, and drive high-quality economic development by stimulating factor dynamics. The level of innovation in a city is mainly considered from two perspectives: innovation input and innovation output. In general, the level of science and education in a city can reflect the city’s investment in innovation to a certain extent, and the higher the intensity of financial expenditure on science and the number of students in higher education, the greater the city’s investment in innovation to a certain extent. The number of patents granted reflects the level of innovation output of a city, with a higher number of patents granted indicating a higher level of innovation output of the city.
2.3.2 Coordination
A high-quality economy has an endogenous feature of coordination (Zhao et al., 2022). High-quality economic development emphasizes a more people-oriented approach and the need to meet the needs of all people for a better life, thus emphasizing inclusive development, i.e., a harmonious co-existence of social structures. High-quality economic development requires coordinated development of consumption, industry, and urban and rural areas within cities. Under the new development pattern, optimizing the consumption structure to promote consumption upgrading can accelerate the construction of a consumer market dominated by a large domestic cycle and further promote high-quality economic development. The coordination of the industrial structure can promote the reasonable flow of production factors within the region, speed up the coordinated development between industries and thus promote high-quality economic development; the coordination of the urban-rural structure is conducive to solving the long-standing dual structure problem in China; the more coordinated the urban-rural structure is, the more conducive it is to the coordinated development of the region and speeds up the process of high-quality economic development. This paper measures the coordination level of the urban-rural structure from the two angles of urbanization rate and urban-rural income gap.
2.3.3 Green
Green is an important symbol of high-quality economic development. The 14th Five-Year Plan states that we must co-ordinate the promotion of high-quality economic development and ecological protection, so adhering to green development is an important step towards achieving high-quality economic development. Green development mainly includes three aspects: green production, green living, and green ecology (Long et al., 2021). All three of them are interlinked and mutually constrained. Green production requires that enterprises abandon the crude production methods of the past and shift to green and intensive production methods; green living refers to a lifestyle that adheres to the concept of green development and establishes a green and low-carbon development concept; green ecology mainly reflects the development of the urban ecological environment. The green transformation of production and life, as well as the continuous improvement of the ecological environment, will help achieve the “carbon peaking and carbon neutrality goals” and promote the process of high-quality development of China’s economy.
2.3.4 Openness
Openness is an essential way to achieve high-quality economic development. In the new development pattern, it is necessary to adhere to the concept of openness in order to adhere to an open domestic and international double-circle market and to promote the reasonable flow of various factors of resources. Openness includes not only an open international market but also an open domestic market. Foreign trade is one of the three pillars that drive economic growth (Xu et al., 2019). Raising the level of openness to the outside world is conducive to deepening our position in the international market, creating a new pattern of opening up to the outside world and improving the quality of the open economy. However, the existence of a large domestic market with a relatively large market size should also be noted. Accelerating the construction of an open domestic market is more conducive to our ability to hedge the systemic risks posed by international trade, enhancing the economic resilience of the city and achieving high-quality development of an open economy.
2.3.5 Sharing
Sharing is the ultimate goal of achieving high-quality economic development. High-quality economic development requires people-centeredness, emphasizing that social development outcomes should be shared by all people and that common prosperity should be promoted effectively. Shared development is an important driving force for shifting the economy from high growth to high quality development (Yan et al., 2021). In order to meet the growing needs of the population for a better life, what it requires is a higher level of economic development. From the perspective of social welfare, this paper measures the level of shared economic and social development mainly in terms of aspects that reflect the public needs of the people, such as culture, healthcare, transport, and education. The better these aspects are, the higher the level of social welfare of the residents and the higher the level of quality economic development of the region.
3 Results
3.1 Measurement of the level of high-quality economic development
In this paper, the improved CRITIC-entropy TOPSIS method is used to measure the level of economic high-quality development of the three major urban agglomerations in the Yangtze River Economic Belt. To further reflect their change patterns more intuitively, visualization is carried out with the help of ARCGIS software, as shown in Figure 2. Drawing on Wallace and Boulton (Wallace and Boulton, 1968), the level of high-quality economic development was classified into three levels: high, middle, and low, based on the sum and difference between the mean level of high-quality economic development and 0.5 times the standard deviation of each city. A “high level” is greater than the sum of the average level of high-quality economic development and 0.5 times the standard deviation. A “middle level” is between the mean level of high-quality economic development and 0.5 times the standard deviation, and a “low level” is less than the sum of the average level of high-quality economic development and 0.5 times the standard deviation.
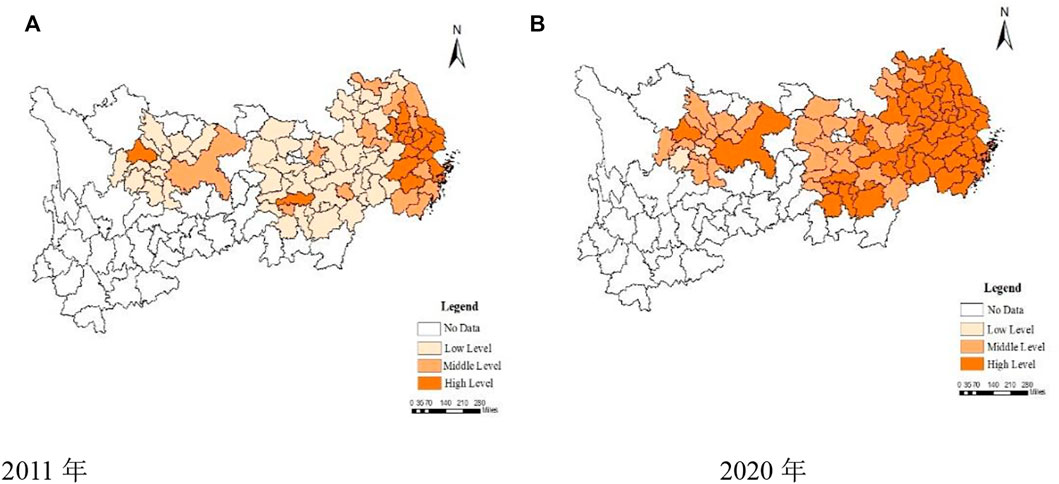
FIGURE 2. Levels of high-quality economic development in the three major urban agglomerations in the Yangtze River Economic Belt.
It can be seen from Figure 2 that the level of high-quality economic development of the three major urban agglomerations in the Yangtze River Economic Belt has gradually increased over time. In 2011, except for some cities in the Yangtze River Delta urban agglomeration, most of the cities in the urban agglomeration were in the low-level development stage, while in 2020, except for Leshan City, the cities in the urban agglomeration are in the medium-level and even high-level development stage. It is further found from the figure that the high-quality economic development level of the three major urban agglomerations presents a non-equilibrium feature, and the development status of the Yangtze River Delta urban agglomeration is significantly better than that of the middle reaches of the Yangtze River urban agglomeration and the Chengdu-Chongqing urban agglomeration.
3.2 Dynamic evolution of the level of high-quality economic development in the Yangtze River economic belt urban agglomerations
In order to further study the evolution trend of the absolute difference of high-quality economic development level among the three major urban agglomerations in the Yangtze River Economic Belt, this paper uses the kernel density estimation method to analyze the absolute difference of high-quality economic development level of urban agglomerations.
As shown in Figure 3, the distribution curves of the three major urban agglomerations overall, the Yangtze River Delta urban agglomeration, the middle reaches of the Yangtze River urban agglomeration, and the Chengdu-Chongqing urban agglomeration, show a certain rightward shift. In terms of distribution patterns, the overall distribution curves of the three major urban agglomerations in the Yangtze River Economic Belt show a rightward skewing trend, with the height of the main peak rising and the width narrowing. The main peak height of the Yangtze River Delta urban agglomeration shows a trend of rising, then falling before rising, with an overall upward trend and a narrowing of width; the height of the main peak of the middle reaches of the Yangtze River urban agglomeration shows a trend of rising and then falling, and overall still shows a trend of rising height and narrowing width; the height of the main peak of the Chengdu-Chongqing urban agglomeration shows a fluctuating rising trend; and there is a trend of narrowing width of the main peak, i.e., in general, the absolute difference in the level of high-quality economic development within the three urban agglomerations shows a decreasing trend. In terms of distribution extension, the three major urban agglomerations and the Yangtze River Delta urban agglomeration do not have a tail-dragging phenomenon, while the middle reaches of the Yangtze River and the Chengdu-Chongqing urban agglomeration both have a certain right tail-dragging phenomenon, i.e., there are cities with a high level of economic quality development in the region. That is, the possibility of a polarized distribution of high-quality economic development within the region is low, while the extension convergence of the Chengdu-Chongqing urban agglomeration is poor, which may be due to the large gap between the high-quality economic development level of other cities in the Chengdu-Chongqing urban agglomeration and the core cities in Chongqing, Chengdu, and other regions. The three major urban agglomerations in general and the Yangtze River Delta urban agglomeration show a unimodal distribution, indicating a more balanced development within the urban agglomerations, while the middle reaches of the Yangtze River urban agglomeration and the Chengdu-Chongqing urban agglomeration have a weak multipolar trend at the beginning of the sample, but this multipolar trend almost ceases to exist at the end of the sample over time, i.e. generally, the absolute difference in the level of economic quality development within the three major urban agglomerations is gradually decreasing.
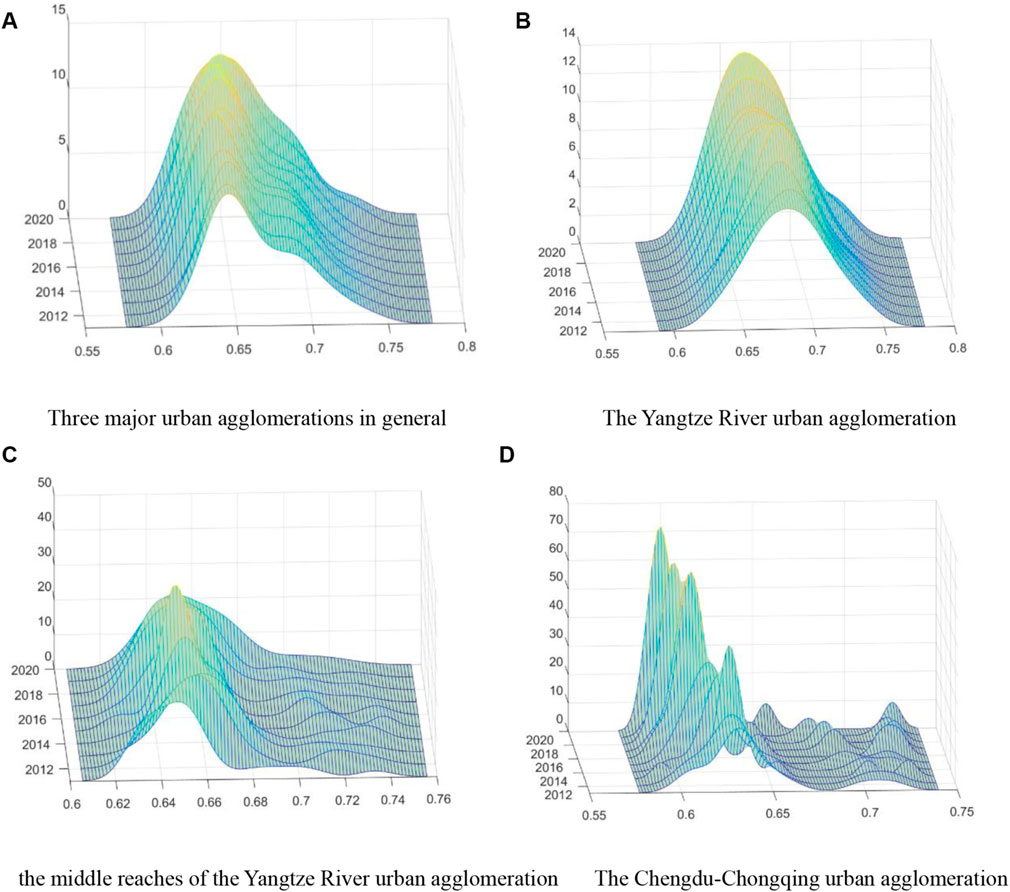
FIGURE 3. Dynamics of the distribution of economic high-quality development levels of the three major urban agglomerations in the Yangtze River Economic Belt. (A) Three major urban agglomerations in general (B) The Yangtze River urban agglomeration. (C) the middle reaches of the Yangtze River urban agglomeration (D) The Chengdu-Chongqing urban agglomeration.
3.3 Differences in the level of high-quality economic development
This paper uses the Dagum coefficient for decomposition measurement in order to further explore the relative spatial variability in the level of high-quality economic development of the three major urban agglomerations in the Yangtze River Economic Belt.
3.3.1 Differences in the level of quality economic development within the three major urban agglomerations of the Yangtze River economic belt
To analyze the differences in the level of high-quality economic development within the three major urban agglomerations in the Yangtze River Economic Belt, this paper further measures the Dagum Gini coefficient for each of the three major urban agglomerations in the Yangtze River Economic Belt as shown in Figure 4. It can be seen that the Gini coefficients of the three major urban agglomerations show a downward trend in the sample period, and the Gini coefficient of the Yangtze River Delta is obviously higher than that of the middle reaches of the Yangtze River and the Chengdu-Chongqing urban agglomerations. The internal differences of the Chengdu-Chongqing urban agglomeration were higher than those of the middle reaches of the Yangtze River urban agglomeration in 2011, but they declined more rapidly, and the level of internal differences between the two was similar in 2017.
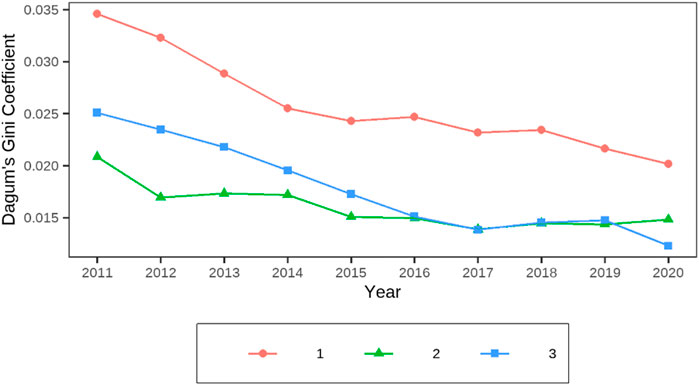
FIGURE 4. Changes in intra-regional disparities in the level of high-quality economic development of the three major urban agglomerations in the Yangtze River Economic Belt. Note: 1 represents the Yangtze River Delta urban agglomeration, 2 represents the middle reaches of the Yangtze River urban agglomeration, 3 represents the Chengdu-Chongqing urban agglomeration, the same below.
3.3.2 Differences in the level of high-quality economic development among the three major urban agglomerations in the Yangtze River economic belt
The three major urban agglomerations in the Yangtze River Economic Belt have very different levels of high-quality economic development between them because of their respective resource endowments. As shown in Figure 5, the differences between the Yangtze River Delta urban agglomeration and the Chengdu-Chongqing urban agglomeration are the largest; the differences between the Yangtze River Delta urban agglomeration and the middle reaches of the Yangtze River urban agglomeration are the second largest; and the differences between the middle reaches of the Yangtze River and the Chengdu-Chongqing urban agglomeration are the smallest. As time goes by, the differences between the urban agglomerations as a whole have been narrowing.
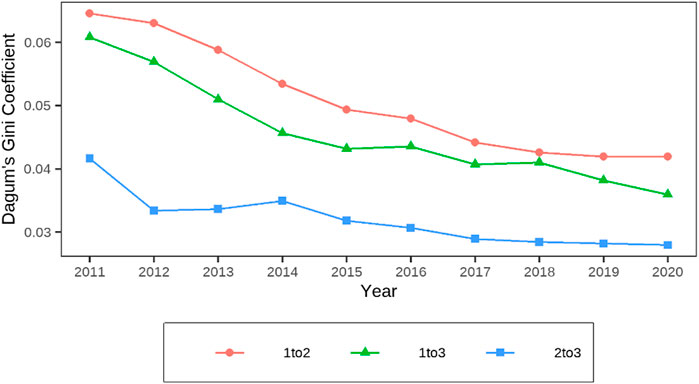
FIGURE 5. Inter-regional disparity in the level of high-quality economic development of the three major urban agglomerations in the Yangtze River Economic Belt.
3.3.3 Overall differences in the level of high-quality economic development of the three major urban agglomerations in the Yangtze River economic belt and their decomposition
It is found through Table 3 that the overall differences among the three major urban agglomerations in the Yangtze River Economic Belt are decreasing year by year, with the overall Gini coefficient decreasing by 33.33% from 2011 to 2020, indicating that the differences in economic-quality development among the three major urban agglomerations in the Yangtze River Economic Belt are decreasing and the overall level is gradually becoming balanced. Further decomposing the overall variation into intra-urban cluster variation, inter-urban cluster variation and hypervariable density, the overall Gini coefficient of intra-urban cluster variation, Gini coefficient of inter-urban cluster variation and hypervariable density showed a decreasing trend over the sample period, The mean value of the Gini coefficient for inter-group variation was 0.016, contributing 56.25% to the overall variation, while the mean values of the Gini coefficient and hypervariable density for intra-group variation were 0.009 and 0.004 respectively, contributing 29.95% and 13.8% to the overall variation. It can be seen that the contribution of differences between urban agglomerations is the highest, the contribution of differences within urban agglomerations is the second highest, and the contribution of super-variable density is the smallest.
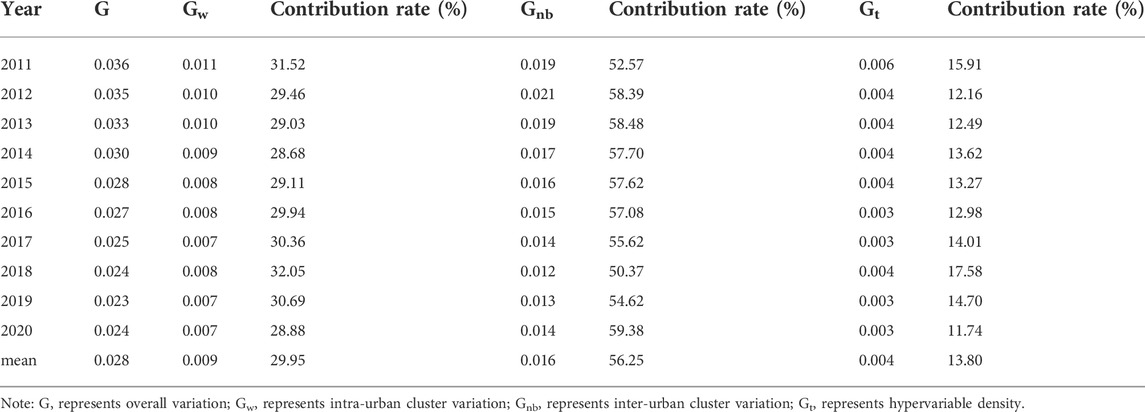
TABLE 3. Overall differences in the level of high-quality economic development of the three major urban agglomerations in the Yangtze River Economic Belt.
3.4 Convergence study on the level of high-quality economic development of urban agglomerations in the Yangtze River economic belt
In order to further examine the future trend of changes in the level of economic quality development of the three major urban agglomerations in the Yangtze River Economic Belt, this paper examines the dynamic evolution of the level of economic quality development of the three major urban agglomerations in the Yangtze River Economic Belt from a convergence perspective.
3.4.1 σ-convergence test and analysis
As shown in Figure 6, in general, the overall coefficient of variation of the three major urban agglomerations in the Yangtze River Economic Belt is showing a decreasing trend, i.e. indicating that there is an overall σ convergence trend in the three major urban agglomerations in the Yangtze River Economic Belt. The coefficients of variation of the three major urban agglomerations are basically consistent with the overall trend, while the coefficient of variation of the Yangtze River Delta urban agglomeration shows a “fast declining-slow declining” trend, i.e. the Yangtze River Delta urban agglomeration has more significant σ convergence; The coefficient of variation of the middle reaches of the Yangtze River urban agglomeration shows a decreasing trend in 2011–2012, but a weak increasing trend in 2012–2014, followed by a slow decreasing trend, but overall a decreasing trend, i.e. there is σ convergence in the middle reaches of the Yangtze River urban agglomeration; the coefficient of variation of the Chengdu-Chongqing urban agglomeration shows a slow decreasing trend from 2011 to 2013, a rapid decreasing trend from 2013 to 2017, and a weak increasing trend from 2017 to 2018, followed by a decreasing trend, which overall mainly shows a decreasing trend, i.e. there is also convergence in the Chengdu-Chongqing urban agglomeration. In summary, σ convergence exists for the three major city groups in the Yangtze River Economic Belt in general and for all three major urban agglomerations, which is consistent with the study above.
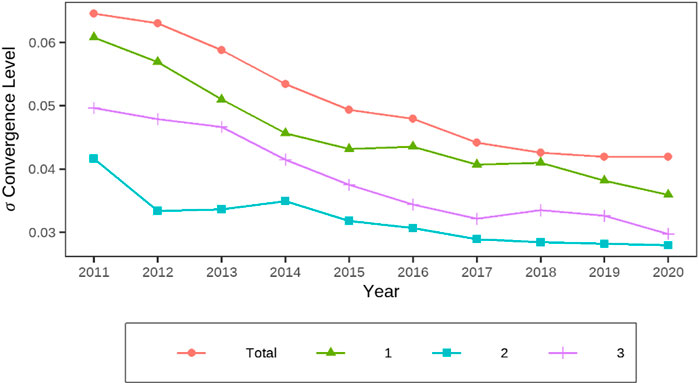
FIGURE 6. Levels of σ convergence in the three major urban agglomerations in the Yangtze River Economic Belt.
3.4.2 -unit root test
In order to avoid the “spurious regression” situation, in the panel data model estimation, a unit root test should be carried out to test whether the data is stable. The unit root test results are as follows:
As can be seen from Table 4, except that the level of government intervention (fina) and the level of financial development (findv) rejected the null hypothesis at the 10% level in the IPS unit root test, the rest of the cases rejected the null hypothesis at the 1% level, indicating that all variables are stationary data and can be used for subsequent estimation.
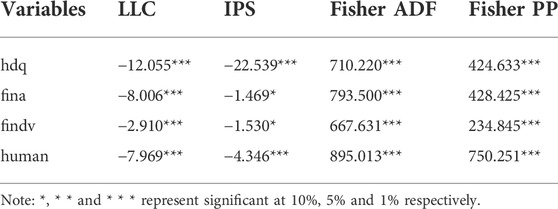
TABLE 4. Unit root test results.
3.4.3 β convergence test and analysis
Rosenthal and Strange (Rosenthal and Strange, 2020) pointed out that there is a certain economic agglomeration effect within urban agglomerations. The level of high-quality urban economic development has a certain spatial correlation, so its spatial effect should also be considered when considering β convergence. For conducting spatial β convergence, spatial autocorrelation analysis is needed first. In this paper, Moran’s I index test is conducted based on the geographical distance weight matrix, and Moran’s I index is significantly greater than 0 at 1% level, indicating that the economic high-quality development levels of the three major urban agglomerations in the Yangtze River Economic Belt have positive spatial correlation, so the spatial beta convergence test can be conducted.
The global Moran’s I index can only reveal whether there is an agglomeration effect between adjacent regions and cannot reflect the spatially localized forms of economic high-quality development agglomeration. In order to further explore the agglomeration patterns of economic high-quality development of the three major urban agglomerations in the Yangtze River Economic Belt, this paper uses Moran’s scatter diagram to further describe their spatial local characteristics, and the results are shown in Figure 7.
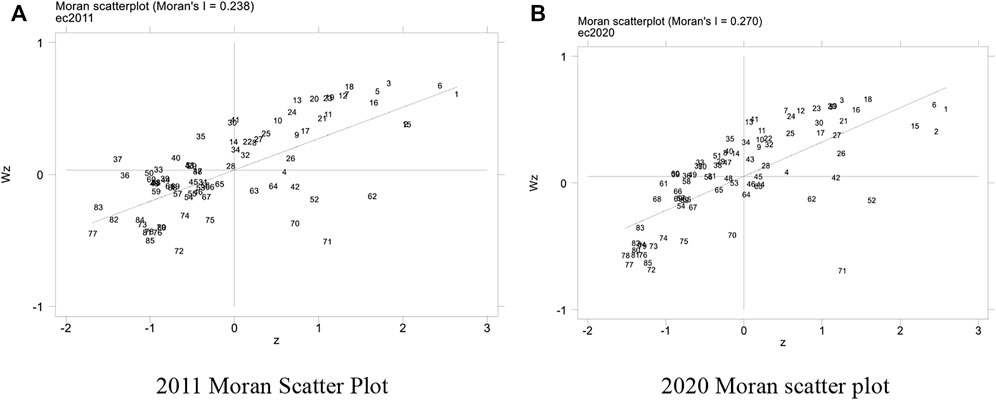
FIGURE 7. Moran scatter diagram of the high-quality economic development of the three major urban agglomerations in the Yangtze River Economic Belt. (A) 2011 Moran Scatter Plot (B) 2020 Moran scatter plot.
As can be seen from Figure 7, most cities are located in the ‘high and high’ aggregation and the ' low and low’ aggregation modules. In 2011, most cities in the Yangtze River Delta are located in the ‘high and high’ aggregation area, while most cities in the middle reaches of the Yangtze River and Chengdu-Chongqing urban agglomerations are located in the ‘low and low’ aggregation area. In 2020, most of the cities in the Yangtze River Delta urban agglomeration are still located in the ‘high and high’ gathering area. Some cities in the middle reaches of the Yangtze River and Chengdu-Chongqing urban agglomerations have shifted from ‘low and low’ gathering areas to ‘low and high’ gathering areas.
3.4.4 Absolute β convergence analysis
Based on the research objectives and research needs, the research sample in this paper is individually limited to 85 cities in the three major urban agglomerations in the Yangtze River Economic Belt, so a fixed-effects model is used to conduct a beta convergence test on the level of high-quality economic development in the urban agglomerations in the Yangtze River Economic Belt (Baltagi and Baltagi, 2008). Select the appropriate model to estimate by testing, where the results of the absolute beta convergence test are shown in Table 6.
It is found in Table 6 that the beta coefficients of all models are significantly negative at the 1% level in both the OLS model and the spatial econometric model, indicating a convergence trend in the level of high-quality economic development in the three major urban agglomerations in general as well as in each urban agglomeration. Further comparison of the speed of convergence among the three major urban agglomerations reveals that the urban agglomeration in the middle reaches of the Yangtze River is the fastest, followed by the Chengdu-Chongqing urban agglomeration, and the Yangtze River Delta urban agglomeration is the slowest. That is, the convergence speed of the economically backward middle and upper reaches of the Yangtze River is faster than that of the economically developed lower reaches of the Yangtze River.
3.4.5 Conditional β convergence analysis
After the absolute β convergence test, the conditional β convergence test was conducted to further examine the convergence state of high-quality economic development when there are differences in regional resource endowments, and the results are shown in Table 7.
It is found in Table 7 that the beta coefficients of models (9)–16) are all significantly negative at the 1% level, which shows that there is a trend of conditional convergence in the high-quality economic development of all three major urban agglomerations in the Yangtze River Economic Belt, and that the rate of convergence is comparable to that of absolute convergence when considering the regional financial, fiscal, and labor resource situation, The rate of convergence will accelerate for the three major urban agglomerations in the Yangtze River Economic Belt in general and for the Yangtze River Delta and Chengdu-Chongqing urban agglomerations in particular. Comparing the speed of convergence between the three major urban agglomerations, it can be seen that the middle reaches of the Yangtze River urban agglomeration converge the fastest, followed by the Chengdu-Chongqing urban agglomeration and the Yangtze River Delta urban agglomeration, which is the slowest, which is consistent with the previous findings and again proves the robustness of the results.
3.4.6 Robustness test
In order to ensure the accuracy of the above empirical results, this paper uses the method of replacing the spatial weight matrix to re-estimate. Referring to the approach of Zhang (Zhang, 2020), the composite spatial weight matrix nested in economic geography is selected for a robustness test. As shown in the following table, it can be seen that the β coefficients of models 17)–24) are significantly negative at the 1% level, and the β coefficients of absolute convergence are less than the β coefficients of conditional convergence, which indicates that the results obtained above are robust.
4 Discussion
As a new stage of economic development after China enters a new era, high-quality economic development is an important focus for realizing rural revitalization and promoting common prosperity. Therefore, it is of great significance to study the level of high-quality economic development in China. Many scholars have also conducted research based on the meaning, measurement, and influencing factors of high-quality economic development (Chen and Huo, 2022; Lin and Zhou, 2022). This paper, on the one hand, verifies the previous research by constructing a system of indicators of high-quality economic development to measure high-quality economic development, and on the other hand, it enriches the relevant research by studying the current situation and future trends of high-quality economic development in urban agglomerations from the perspective of urban agglomerations.
It can be found from Figure 2 that the high-quality economic development level of the three major urban agglomerations in the Yangtze River Economic Belt shows an unbalanced development trend. As one of the first urban agglomerations to be built by the country, the Yangtze River Delta urban agglomeration was proposed earlier than that of the middle reaches of the Yangtze River and the Chengdu-Chongqing urban agglomeration. Secondly, it includes Shanghai, Nanjing, and Hangzhou, and other cities with a high economic development level, so its high-quality economic development level is higher than the two urban agglomerations.
Figure 3 shows that over time, whether in the three major urban agglomerations as a whole or within the urban agglomerations, the level of high-quality economic development is increasing, and the absolute difference between them is shrinking. Among them, through the overall kernel density estimation curve of the three major urban agglomerations, it can be seen that the gap between the high-quality economic development levels of the three major urban agglomerations in the Yangtze River Economic Belt is narrowing, while the kernel density estimation curves of the three major urban agglomerations reflect that the gap between the high-quality economic development levels of the cities within the urban agglomeration is narrowing. Further from Figure 4, it can be seen from the internal difference level of the three major urban agglomerations in the Yangtze River Economic Belt that the gap of high-quality economic development level within the three major urban agglomerations continues to shrink, indicating that the construction of the three major urban agglomerations has certain achievements. The Gini coefficient of the Yangtze River Delta is significantly higher than that of the two major urban agglomerations of the middle reaches of the Yangtze River and Chengdu-Chongqing. The internal differences in the high-quality economic development level of the Yangtze River Delta urban agglomeration are large, indicating that there is a polarization phenomenon in the high-quality economic development of the Yangtze River Delta urban agglomeration at the beginning of the sample. However, with the implementation of the integration strategy of the Yangtze River Delta, the cooperation and exchanges within the urban agglomeration are accelerating, making the economic links between cities within the urban agglomeration closer (Zhao et al., 2021). The differences in the levels of high-quality economic development within the urban agglomeration are narrowing. It can be seen from Figure 5 that, from the perspective of the difference level among the three major urban agglomerations, the relative difference between the Yangtze River Delta urban agglomeration and the urban agglomeration in the middle reaches of the Yangtze River and the Chengdu-Chongqing urban agglomeration is relatively large, which is also the main reason for restricting the uneven development of the overall economic quality of the three urban agglomerations. This is consistent with reality. As one of the world-class urban agglomerations that the country is committed to building, The Yangtze River Delta urban agglomeration has a relatively reasonable industrial structure and a high degree of integration (Ouyang et al., 2018). The overall development level of the urban agglomeration is higher than that of the two urban agglomerations.
Through the σ-convergence test and β-convergence test, it can be seen that the overall high-quality economic development level of the three major urban agglomerations in the Yangtze River Economic Belt has passed the σ-convergence test, the absolute β-convergence test, and the conditional β-convergence test, which is consistent with the previous conclusions. It reflects to some extent that the gap in high-quality economic development among the three urban agglomerations is narrowing (Chen et al., 2020), which also reflects the necessity of implementing the coordinated development strategy of urban agglomerations. That is, by strengthening exchanges and cooperation among urban agglomerations and sharing resources, it can better promote the high-quality economic development of the Yangtze River Economic Belt. From the perspective of urban agglomeration, the Yangtze River Delta urban agglomeration, the middle reaches of the Yangtze River urban agglomeration, and urban agglomeration have also passed the σ-convergence test, absolute beta convergence test, and conditional beta convergence test. That is, the high-quality economic development level between cities within the urban agglomeration will eventually approach a steady level, which to some extent reflects the results of the implementation of the development plan of the three major urban agglomeration.
It can be found from Table 5 and Figure 7 that the high-quality economic development level of the three major urban agglomerations in the Yangtze River Economic Belt has a strong spatial correlation, which indicates that the economic links among the three urban agglomerations are becoming more and more closely linked (Zhong et al., 2021). Further, it can be found from Table 6 that the convergence rate of urban agglomerations in the middle reaches of the Yangtze River is the fastest, followed by the Chengdu-Chongqing urban agglomeration, and the Yangtze River Delta urban agglomeration is the slowest. Moreover, the rate of convergence in the spatial econometric model for both the overall and the three major urban agglomerations is greater than that in the ordinary panel condition, indicating that the economic quality development of each urban agglomeration converges faster when spatial conditions are taken into account, probably because the core cities within an urban agglomeration will drive the development of neighboring cities through diffusion effects when spatial correlation is considered (Chen et al., 2022). Except for the Chengdu-Chongqing urban agglomeration, the spatial autocorrelation coefficients of the Yangtze River Economic Belt as a whole, the two major urban agglomerations of the Yangtze River Delta and the middle reaches of the Yangtze River are all significantly positive, indicating that the level of high-quality economic development in neighboring regions has strong spillover and can accelerate the level of high-quality local economic development; The spatial lag term is significant for both the Yangtze River Economic Belt as a whole and for each city cluster, indicating that the growth rate of the economic quality development level of neighboring regions affects the growth rate of the local economic quality development level. In addition, the spatial lag coefficient of the Chengdu-Chongqing urban agglomeration is significantly negative, indicating that there is a competitive relationship between the high-quality economic development of cities in the Chengdu-Chongqing urban agglomeration. That is, the high-quality economic development of adjacent cities will restrict the high-quality development of the local economy. This may be due to the fact that the core cities in the Chengdu-Chongqing urban agglomeration have a weak radiation drive, which has led to the absence of a reasonable industrial division of production system within the agglomeration, thus causing competition between cities other than the core cities within the agglomeration. Through Table 7, it can be found that the convergence rate of high-quality development levels in the urban economy will be accelerated on the basis of considering urban heterogeneity (Ramajo et al., 2008). In the urban agglomeration in the middle reaches of the Yangtze River, the conditional convergence rate is greater than the absolute convergence rate under ordinary panel estimation, and the conditional convergence rate is less than the absolute convergence rate under the spatial SDM model. Through comparative analysis, it is found that the spatial autocorrelation coefficient of the urban agglomeration in the middle reaches of the Yangtze River is positive but not obvious, that is, the high-quality economic development of the surrounding cities has no significant effect on the growth rate of the local high-quality economic development level, which is also a possible reason for the conditional convergence rate to be less than the absolute convergence rate (refer to Table 8).
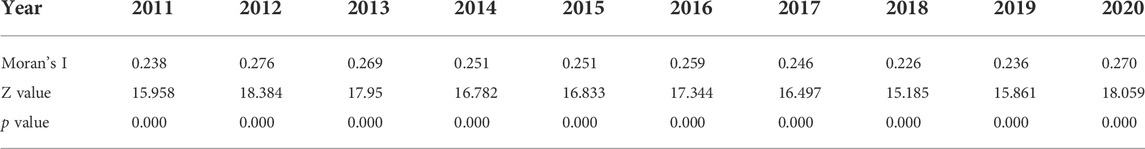
TABLE 5. Global Moran’s I index of high-quality economies of the three major urban agglomerations in the Yangtze River Economic Belt.
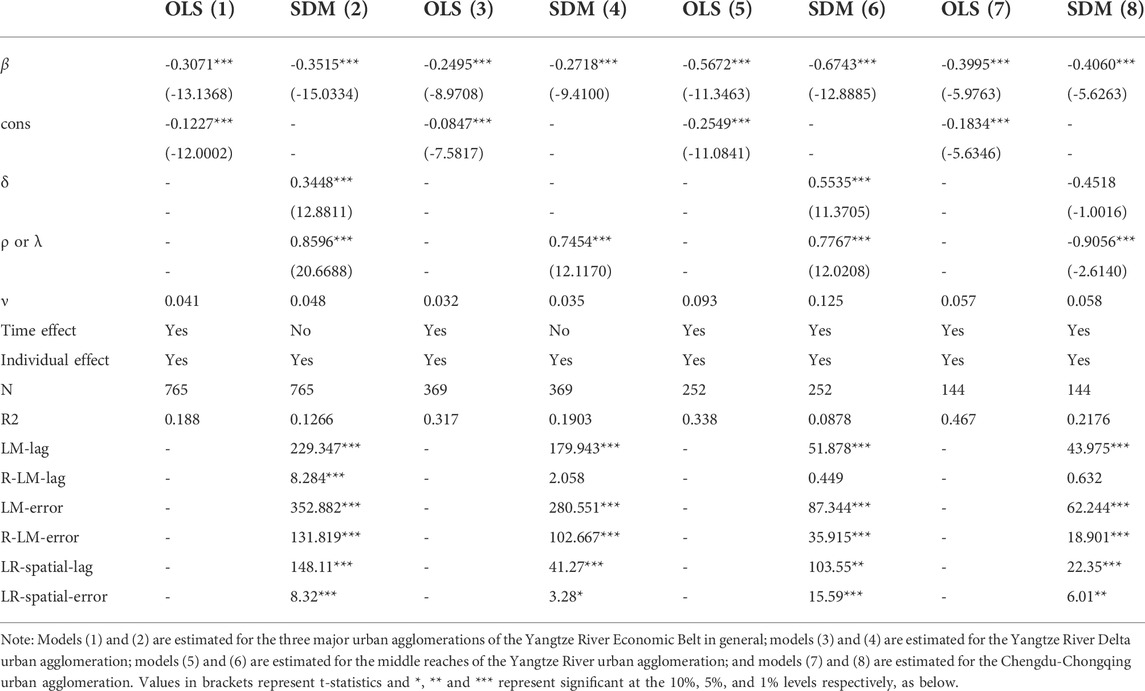
TABLE 6. Results of absolute beta convergence analysis.
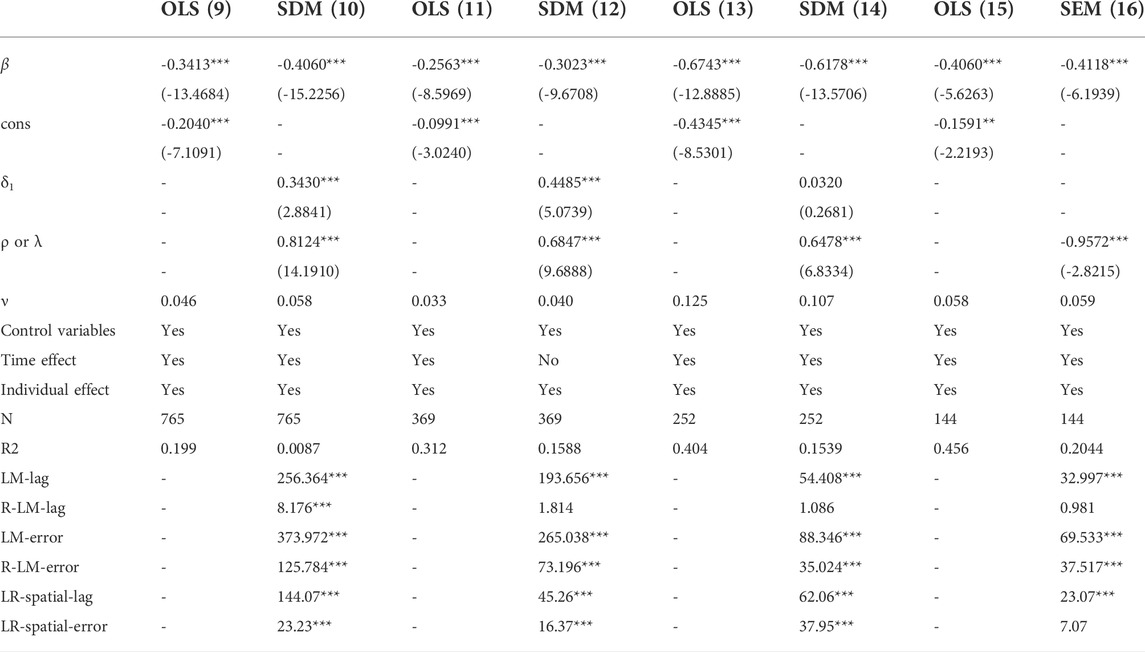
TABLE 7. Results of the conditional β convergence analysis.
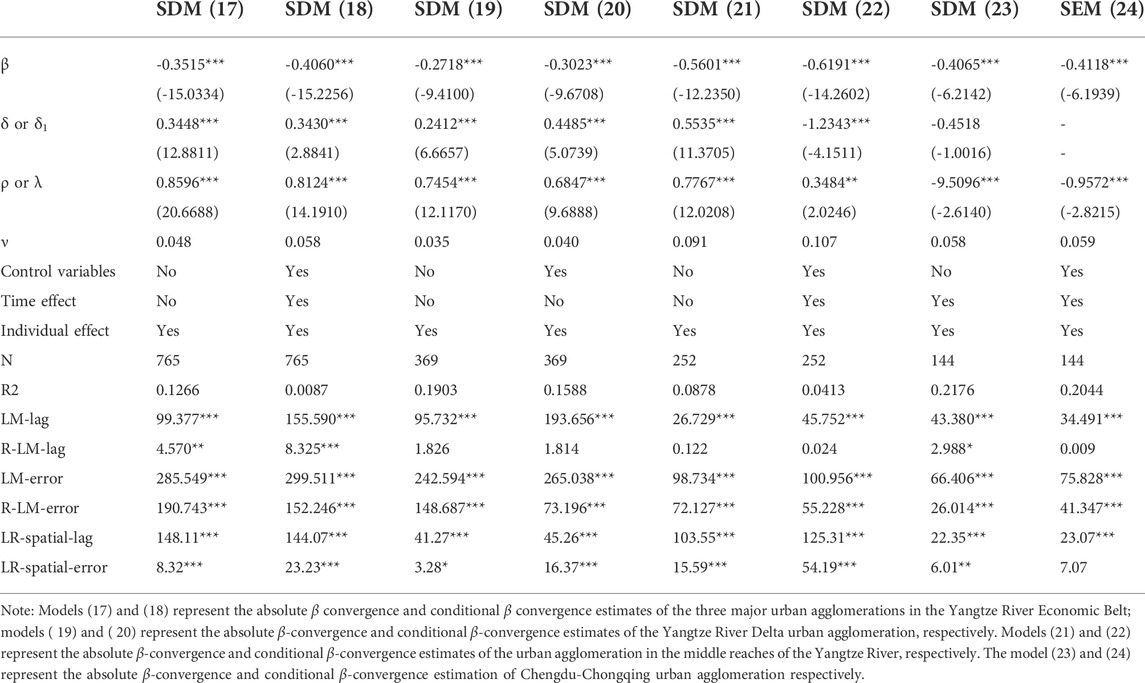
TABLE 8. Robustness test results
However, this paper explores the dynamic evolution, regional differences, and convergence of the high-quality economic development levels of the three major urban agglomerations in the Yangtze River Economic Belt, and it can be found that the difference in the high-quality economic development levels between the three urban agglomerations or within the urban agglomerations will gradually shrink. However, this paper does not further explore the mechanism that leads to the decline in the difference in the level of high-quality economic development among cities, and it can be further explored from this perspective in the future.
5 Conclusion
This paper takes 85 cities in three major city groups in the Yangtze River Economic Belt as research samples, measures the high-quality economic development level of each city from 2011 to 2020 through the improved entropy-weighted TOPSIS method, and uses the kernel density estimation method, Dagum Gini coefficient, and convergence model to further study the dynamic evolution, regional differences, and convergence state of the high-quality economic development level of the three major city groups in the Yangtze River Economic Belt and finally draws the following conclusions:
(1) The high-quality economic development level of the three major urban agglomerations in the Yangtze River Economic Belt and each urban agglomeration are continuously developing over time, but the development levels of each urban agglomeration are not the same. The high-quality economic development level of each city in the Yangtze River Delta urban agglomeration is relatively balanced, and there is no multi-polarization distribution. There is a certain multi-polarization trend in the high-quality economic development level of each city in the middle reaches of the Yangtze River and the Chengdu-Chongqing urban agglomeration. In other words, the high-quality economic development level of cities in the urban agglomeration is low except in the core city. That is, there is an imbalance in the high-quality economic development of cities in the urban agglomeration.
(2) The high-quality economic development level of the three major urban agglomerations in the Yangtze River Economic Belt has spatial differences. The high-quality economic development level of the Yangtze River Delta urban agglomeration is better than that of the middle reaches of the Yangtze River and the Chengdu-Chongqing urban agglomeration. Although the difference in the high-quality economic development levels among the three urban agglomerations is becoming smaller over time, the gap in the high-quality economic development levels among the three urban agglomerations is still an important reason for the imbalance in the high-quality economic development level of the overall economy.
(3) There is σ convergence and β convergence in the three major urban agglomerations as a whole as well as in each urban agglomeration, and the β convergence in the middle reaches of the Yangtze River urban agglomeration and the Chengdu-Chongqing urban agglomeration is faster than that in the Yangtze River Delta urban agglomeration, and under the condition that the spatial factor of the examination rate is influenced, the convergence of each urban agglomeration becomes faster.
6 Suggestions
(1) Balance internal urban agglomeration development Although the differences in high-quality development levels within urban agglomerations are narrowing, the differences within urban agglomerations cannot be ignored. Therefore, in order to balance the internal development of urban agglomerations, we should: give full play to the leading role of core cities within urban agglomerations; speed up the rational division of labour among large, medium, and small cities within urban agglomerations; form a reasonable industrial layout; further improve the efficiency of space utilisation; and promote the overall high-quality economic development of urban agglomerations.
(2) Improve coordination of development among urban agglomerations. The difference in high-quality economic development levels among urban agglomerations is an important factor restricting the high-quality coordinated development of the overall economy of urban agglomerations in the Yangtze River Economic Belt. Therefore, in order to promote the high-quality development of urban agglomerations, it is necessary to adhere to the “one chessboard” strategy of regional coordinated development. The three major urban agglomerations should break the restrictions between regions, realise the free flow of resources among the three urban agglomerations, and improve the efficiency of factor allocation so as to achieve the differentiated and coordinated development of the three urban agglomerations.
(3) Develop reasonable policies to guide high-quality economic development that is responsive to local conditions. Due to the differences in resource endowments, the initial high-quality economic development level of each urban agglomeration is not the same, and its development speed is also very different. Therefore, in order to better promote the high-quality economic development of each urban agglomeration, each urban agglomeration should adjust measures to local conditions and rely on existing advantageous resources to form its own comparative advantages, so as to promote the overall development of the urban agglomeration in the Yangtze River Economic Belt.
Data availability statement
The raw data supporting the conclusions of this article will be made available by the authors, without undue reservation.
Author contributions
All authors listed have made a substantial, direct, and intellectual contribution to the work and approved it for publication.
Acknowledgments
The authors would like to acknowledge the anonymous editors and colleagues for their valuable guidance and helpful comments.
Conflict of interest
The authors declare that the research was conducted in the absence of any commercial or financial relationships that could be construed as a potential conflict of interest.
Publisher’s note
All claims expressed in this article are solely those of the authors and do not necessarily represent those of their affiliated organizations, or those of the publisher, the editors and the reviewers. Any product that may be evaluated in this article, or claim that may be made by its manufacturer, is not guaranteed or endorsed by the publisher.
Footnotes
1In this paper, a total of 85 cities in the three major urban agglomerations of the Yangtze River Economic Belt were selected as samples for the study based on relevant national policies and consideration of data availability. Among them, the Yangtze River Delta urban agglomeration includes a total of 41 cities in Jiangsu Province, Anhui Province, Zhejiang Province and Shanghai Municipality; The middle reaches of the Yangtze River urban agglomeration including Wuhan, Huangshi, Ezhou, Huanggang, Xiaogan, Xianning, Xiangyang, Yichang, Jingzhou, Jingmen, Changsha, Zhuzhou, Xiangtan, Yueyang, Yiyang, Changde, Hengyang, Loudi, Nanchang, Jiujiang, Jingdezhen, Yingtan, Xinyu, Yichun, Pingxiang, Shangrao, Fuzhou and Ji’an; The Chengdu-Chongqing urban agglomeration includes Chongqing, Chengdu, Zigong, Luzhou, Deyang, Mianyang, Suining, Neijiang, Leshan, Nanchong, Meishan, Yibin, Guang’an, Dazhou, Ya’an and Ziyang. Among them, according to the “development plan of urban agglomeration in the middle reaches of the Yangtze River” and “Chengdu-Chongqing urban agglomeration development plan”, the urban agglomeration in the middle reaches of the Yangtze River does not include the whole region of Ji ' an City, and the Chengdu-Chongqing urban agglomeration does not include the whole region of Chongqing, Mianyang, Dazhou and Ya ' an. But in order to facilitate data collection, this paper unified to the whole domain processing.
22011 is the beginning year of the 12th Five-Year Plan. The transformation of economic development mode has become the focus of China’ s economic work, and it has begun to emphasize the sustainable development of economy. Therefore, it can be regarded as the beginning of China’ s economic development from speed to quality. Therefore, this paper chooses to study the high-quality economic development level of the three major urban agglomerations in the Yangtze River Economic Belt from 2011.
References
Chen, B., Wu, C., Huang, X., and Yang, X. (2020). Examining the relationship between urban land expansion and economic linkage using coupling analysis: A case study of the Yangtze River economic Belt, China. Sustainability 12 (3), 1227. doi:10.3390/su12031227
Chen, L., and Huo, C. (2022). The measurement and influencing factors of high-quality economic development in China. Sustainability 14 (15), 9293. doi:10.3390/su14159293
Chen, M., and Wang, H. (2021). Import technology sophistication and high-quality economic development: Evidence from city-level data of China[J]. Economic Research-Ekonomska Istraživanja, 35. 1–36. doi:10.1080/1331677X.2021.1956362
Chen, Y., Miao, Q., and Zhou, Q. (2022). Spatiotemporal differentiation and driving force analysis of the high-quality development of urban agglomerations along the yellow river basin. Int. J. Environ. Res. Public Health 19 (4), 2484. doi:10.3390/ijerph19042484
Chen, Z., Kahn, M. E., Liu, Y., and Wang, Z. (2018). The consequences of spatially differentiated water pollution regulation in China. J. Environ. Econ. Manag. 88, 468–485. doi:10.1016/j.jeem.2018.01.010
Dagum, C. (1997). A new approach to the decomposition of the Gini income inequality ratio. Empir. Econ. 22 (4), 515–531. doi:10.1007/bf01205777
Dong, B., Xu, Y., and Fan, X. (2020). How to achieve a win-win situation between economic growth and carbon emission reduction: Empirical evidence from the perspective of industrial structure upgrading. Environ. Sci. Pollut. Res. 27 (35), 43829–43844. doi:10.1007/s11356-020-09883-x
Elhorst, J. P. (2010). Applied spatial econometrics: Raising the bar. Spat. Econ. Anal. 5 (1), 9–28. doi:10.1080/17421770903541772
Gao, Y., Zhang, M., and Zheng, J. (2021). Accounting and determinants analysis of China's provincial total factor productivity considering carbon emissions. China Econ. Rev. 65, 101576. doi:10.1016/j.chieco.2020.101576
Huang, L., Yang, P., Zhang, B., and Hu, W. (2021). Spatio-temporal coupling characteristics and the driving mechanism of population-land-industry urbanization in the Yangtze River economic Belt. Land 10 (4), 400. doi:10.3390/land10040400
Huang, Y., Li, L., and Yu, Y. (2018). Do urban agglomerations outperform non-agglomerations? A new perspective on exploring the eco-efficiency of Yangtze River economic Belt in China[J]. J. Clean. Prod. 202, 1056–1067. doi:10.1016/j.jclepro.2018.08.202
Islam, N. (2003), What we have learn from the convergence debate?[J]. J. Econ. Surv. 17, 309–362. doi:10.1111/1467-6419.00197
Jin, G., Yu, B., and Shen, K. (2021). Domestic trade and energy productivity in China: An inverted U-shaped relationship. Energy Econ. 97, 105234. doi:10.1016/j.eneco.2021.105234
Kogan, L., Papanikolaou, D., Seru, A., and Stoffman, N. (2017). Technological innovation, resource allocation, and growth*. Q. J. Econ. 132 (2), 665–712. doi:10.1093/qje/qjw040
Kong, Q., Li, R., Jiang, X., Sun, P., and Peng, D. (2022). Has transportation infrastructure development improved the quality of economic growth in China’s cities? A quasi-natural experiment based on the introduction of high-speed rail[J]. Res. Int. Bus. Finance 62, 101726. doi:10.1016/j.ribaf.2022.101726
Kremer, M. (1993). The O-ring theory of economic development. Q. J. Econ. 108 (3), 551–575. doi:10.2307/2118400
Lesage, J. P., and Pace, R. K. (2009). Introduction to spatial econometrics[M]. Chapman and Hall/CRC.
Li, C., Wan, J., Xu, Z., and Lin, T. (2021). Impacts of green innovation, institutional constraints and their interactions on high-quality economic development across China. Sustainability 13 (9), 5277. doi:10.3390/su13095277
Li, X., Lu, Y., and Huang, R. (2021). Whether foreign direct investment can promote high-quality economic development under environmental regulation: Evidence from the Yangtze River economic Belt, China. Environ. Sci. Pollut. Res. 28 (17), 21674–21683. doi:10.1007/s11356-020-12032-z
Li, Y., Pan, W., Wang, J., et al. (2022). Spatial pattern and influencing factors of high-quality development of China at the prefecture level[J]. Acta Ecol. Sin. 42 (6), 2306–2320.
Lin, B., and Zhou, Y. (2022). Measuring the green economic growth in China: Influencing factors and policy perspectives. Energy 241, 122518. doi:10.1016/j.energy.2021.122518
Liu, Y., Liu, M., Wang, G., Zhao, L., and An, P. (2021). Effect of environmental regulation on high-quality economic development in China—an empirical analysis based on dynamic spatial Durbin model. Environ. Sci. Pollut. Res. 28 (39), 54661–54678. doi:10.1007/s11356-021-13780-2
Liu, Y., Liu, W., Yan, Y., and Liu, C. (2022). A perspective of ecological civilization: Research on the spatial coupling and coordination of the energy-economy-environment system in the Yangtze River economic Belt[J]. Environ. Monit. Assess. 194 (6), 1–21. doi:10.1007/s10661-022-10065-0
Liu, Y., Zhang, X., Pan, X., Ma, X., and Tang, M. (2020). The spatial integration and coordinated industrial development of urban agglomerations in the Yangtze River Economic Belt, China. Cities 104, 102801. doi:10.1016/j.cities.2020.102801
Long, R., Li, H., Wu, M., and Li, W. (2021). Dynamic evaluation of the green development level of China's coal-resource-based cities using the TOPSIS method. Resour. Policy 74, 102415. doi:10.1016/j.resourpol.2021.102415
Lu, H. A., Zhao, Y. M., Zhou, X., and Wei, Z. (2022). Selection of agricultural machinery based on improved CRITIC-entropy weight and GRA-TOPSIS method. Process. (Basel). 10 (2), 266. doi:10.3390/pr10020266
Luo, S., Shi, Y., Sun, Y., Zhao, Z., and Zhou, G. (2021). Can FDI and ODI two-way flows improve the quality of economic growth? Empirical evidence from China[J]. Appl. Econ. 53 (44), 5028–5050. doi:10.1080/00036846.2021.1914318
Mlachila, M., Tapsoba, R., and Tapsoba, S. J. (2017). A quality of growth index for developing countries: A proposal. Soc. Indic. Res. 134 (2), 675–710. doi:10.1007/s11205-016-1439-6
Nawaz, K., Lahiani, A., and Roubaud, D. (2019). Natural resources as blessings and finance-growth nexus: A bootstrap ardl approach in an emerging economy. Resour. Policy 60, 277–287. doi:10.1016/j.resourpol.2019.01.007
Ou, J., Xu, C., and Liu, Y. (2020). The measurement of high-quality development level from five development concepts: Empirical analysis of 21 prefecture-level cities in Guangdong province[J]. Econ. Geogr. 40 (6), 77–86.
Ouyang, X., Gao, B., Du, K., and Du, G. (2018). Industrial sectors' energy rebound effect: An empirical study of Yangtze River Delta urban agglomeration. Energy 145, 408–416. doi:10.1016/j.energy.2018.01.009
Pan, W., Wang, J., Lu, Z., Liu, Y., and Li, Y. (2021). High-quality development in China: Measurement system, spatial pattern, and improvement paths. Habitat Int. 118, 102458. doi:10.1016/j.habitatint.2021.102458
Parzen, E. (1962). On estimation of a probability density function and mode. Ann. Math. Stat. 33 (3), 1065–1076. doi:10.1214/aoms/1177704472
Ramajo, J., Marquez, M. A., Hewings, G. J., and Salinas, M. M. (2008). Spatial heterogeneity and interregional spillovers in the European Union: Do cohesion policies encourage convergence across regions?[J]. Eur. Econ. Rev. 52 (3), 551–567. doi:10.1016/j.euroecorev.2007.05.006
Rosenblatt, M. (1956). Remarks on some nonparametric estimates of a density function. Ann. Math. Stat. 27 (3), 832–837. doi:10.1214/aoms/1177728190
Rosenthal, S. S., and Strange, W. C. (2020). How close is close? The spatial reach of agglomeration economies[J]. J. Econ. Perspect. 34 (3), 27–49. doi:10.1257/jep.34.3.27
Sala-i-Martin, X. X. (1996). The classical approach to convergence analysis. Econ. J. 106, 1019–1036. doi:10.2307/2235375
Wallace, C. S., and Boulton, D. M. (1968). An information measure for classification. Comput. J. 11 (2), 185–194. doi:10.1093/comjnl/11.2.185
Wong, Z., Li, R., Peng, D., and Kong, Q. (2021). China-European railway, investment heterogeneity, and the quality of urban economic growth. Int. Rev. Financial Analysis 78, 101937. doi:10.1016/j.irfa.2021.101937
Wong, Z., Li, R., Zhang, Y., Kong, Q., and Cai, M. (2021). Financial services, spatial agglomeration, and the quality of urban economic growth–based on an empirical analysis of 268 cities in China. Finance Res. Lett. 43, 101993. doi:10.1016/j.frl.2021.101993
Xu, S-C., Gao, C., Miao, Y-M., Shen, W. X., Long, R. Y., Chen, H., et al. (2019). Calculation and decomposition of China's embodied air pollutants in Sino-US trade. J. Clean. Prod. 209, 978–994. doi:10.1016/j.jclepro.2018.10.333
Yan, B-R., Dong, Q-L., Li, Q., Amin, F. U., and Wu, J. N. (2021). A study on the coupling and coordination between logistics industry and economy in the background of high-quality development. Sustainability 13 (18), 10360. doi:10.3390/su131810360
Zeng, S., Shu, X., and Ye, W. (2022). Total factor productivity and high-quality economic development: A theoretical and empirical analysis of the Yangtze River economic Belt, China. Int. J. Environ. Res. Public Health 19 (5), 2783. doi:10.3390/ijerph19052783
Zhang, X. (2020). Estimation of eco‐efficiency and identification of its influencing factors in China's Yangtze River Delta urban agglomerations. Growth Change 51 (2), 792–808. doi:10.1111/grow.12376
Zhao, J., Zhu, D., Cheng, J., Jiang, X., Lun, F., and Zhang, Q. (2021). Does regional economic integration promote urban land use efficiency? Evidence from the Yangtze River Delta, China[J]. Habitat Int. 116, 102404. doi:10.1016/j.habitatint.2021.102404
Zhao, K., Wu, W-s., and Ye, J-m. (2022). How trade affects high-quality development through spillovers? Econ. Research-Ekonomska Istraz. 2022, 1–17. doi:10.1080/1331677x.2022.2048201
Zhao, Q., and Yuan, C-H. (2020). Did haze pollution harm the quality of economic development?—an empirical study based on China’s PM2. 5 concentrations[J]. Sustainability. 12 (4), 1607. doi:10.3390/su12041607
Zheng, J., Mi, Z., Coffman, D. M., Shan, Y., Guan, D., and Wang, S. (2019). The slowdown in China’s carbon emissions growth in the new phase of economic development. One Earth 1 (2), 240–253. doi:10.1016/j.oneear.2019.10.007
Zhong, Y., Lin, A., Xiao, C., and Zhou, Z. (2021). Research on the spatio-temporal dynamic evolution characteristics and influencing factors of electrical power consumption in three urban agglomerations of Yangtze River economic Belt, China based on DMSP/OLS night light data. Remote Sens. 13 (6), 1150. doi:10.3390/rs13061150
Keywords: high-quality economic development, Dagum Gini coefficient decomposition, kernel density estimation, convergence, urban agglomerations
Citation: Zha Q, Liu Z, Song Z and Wang J (2022) A study on dynamic evolution, regional differences and convergence of high-quality economic development in urban agglomerations: A case study of three major urban agglomerations in the Yangtze river economic belt. Front. Environ. Sci. 10:1012304. doi: 10.3389/fenvs.2022.1012304
Received: 05 August 2022; Accepted: 20 September 2022;
Published: 11 October 2022.
Edited by:
Deng Xiangzheng, Institute of Geographic Sciences and Natural Resources Research (CAS), ChinaCopyright © 2022 Zha, Liu, Song and Wang. This is an open-access article distributed under the terms of the Creative Commons Attribution License (CC BY). The use, distribution or reproduction in other forums is permitted, provided the original author(s) and the copyright owner(s) are credited and that the original publication in this journal is cited, in accordance with accepted academic practice. No use, distribution or reproduction is permitted which does not comply with these terms.
*Correspondence: Jian Wang, d2FuZ2pAdWpzLmVkdS5jbg==