 Shiliang Liu
 Yuhong Dong
 Fangfang Wang1
94% of researchers rate our articles as excellent or good
Learn more about the work of our research integrity team to safeguard the quality of each article we publish.
Find out more
ORIGINAL RESEARCH article
Front. Environ. Sci. , 30 November 2022
Sec. Land Use Dynamics
Volume 10 - 2022 | https://doi.org/10.3389/fenvs.2022.1011755
This article is part of the Research Topic Land Degradation Pattern and Ecosystem Services View all 12 articles
In the planning and restoration of land ecological space, the ecological restoration priority area has attracted more and more attention, especially in the regions with great vulnerability. As a typical area of karst ecological region in Southwest China, Wujiang River Basin experienced human disturbance and land uses which had great impacts on the ecological environment. Based on the land use evolution from 1985 to 2019, the change of ecological-production-living land in Wujiang River Basin was analyzed by transfer matrix, intensity analysis and long-time series trajectory approaches. The results showed that from 1985 to 2019, the ecological land in Wujiang River Basin significantly decreased, the production land increased first then decreased, and living land increased significantly. The reduced ecological land was mainly transformed to cropland. After 1990, the change intensity of land use in Wujiang River Basin gradually increased. At the category level, the intensity of forest land change was the most stable, and while that of barren land, shrub land and grassland were active. At the transition level, the increased impervious land was mainly from cropland, and the reduced forest land was mainly transformed into cropland. Trajectory analysis from 1985 to 2019 showed that the stable land use type of Wujiang River accounted for 67.36% of the total area of the basin and forest land was the main stable land use type. Our research spatially identified the land use change from different aspects which could be a new approach for ecological restoration. Also, our study can provide decision-making basis for the sustainable use of land resources in the study area.
Land use changes are one of the world-wide issues which have the most significant effects on the natural environment and ecosystem processes (Bryan et al., 2018; Hasan et al., 2020; Chu et al., 2022). The spatial-temporal change of land use provides basic data for other studies (Tang et al., 2020; Chen et al., 2021; Zhang et al., 2021; Chatterjee et al., 2022). In order to optimize and coordinate the leading functions of land use, the concept of ecological-production-living spaces is put forward, which is an effective integration and supplement for detailed land use classification (Yang et al., 2018). Many researches on ecological land have been carried out from different types (Guo et al., 2018), in different regions (Zheng and He, 2021) and at different scales (Zhao et al., 2022).
For quantitative methods on land use change, many approaches measuring the dynamics, pattern and process are gradually developed with different conceptual approaches. Usually, land use change was analyzed by transfer matrix method in different periods (Meyer and Früh-Müller, 2020), utilizing different land use data for various data sources (Chen et al., 2021). The land use transfer matrix can comprehensively and specifically analyze the quantitative and structural characteristics of regional land use change and the change direction of each category (Takada et al., 2010). Land use matrix was used to analyzed the ecological effects by ecosystem services value (Niu et al., 2018; Qiu et al., 2019). This method is simple and widely used which is effective for describing historical land use change and simulation analysis. However, the direct transformation information on different land use type change cannot reveal the inherent interaction process between human and environment. Also, it cannot be systematically conducted in-depth research on the multiple consecutive time intervals. The matrix method do not show the interval’s rate of change, the change of each category’s relative to the its size and specific transitions form one category to another category (Huang et al., 2012). Therefore, the intensity analysis method is proposed to calculate the intensity of land use change from the interval level, the category level and the transition level, respectively (Aldwaik and Pontius, 2012). The intensity analysis method can systematically study the transfer matrix of land use in multiple continuous time intervals (Mallinis et al., 2014). Land use intensity has been defined as an effective means of quantifying the intensity of human interference with land development and use, management and conservation, and the corresponding land outputs that result (Huang et al., 2012). Intensity analysis was used to identify systematic and stationary processes to analysis its relation with socioeconomic changes and policies (Mallinis et al., 2014). This concept and its methodology are commonly promoted in ecology, land science and socio-economic fields, where demand pressures on different land use types and land management approaches become the basis for constructing a land use intensity indicator system. However, both the two above methods are based on the comparison of adjacent land use data to reveal the spatio-temporal patterns of two or more periods. To acquire more information of land use evolution, trajectory method has been brought out to obtain not only the spatial and temporal characteristics of land use change, but also its transfer and flow direction (Swetnam, 2007). The method was used to reveal the effect of human activities and environmental factors (Zhou et al., 2008), reveal the relationships between change patterns and natural factors (Wang et al., 2012), the impact of land use trajectories on ground water (Zomlot et al., 2017), and the impacts of historical trajectories of land use on soil properties (Libessart et al., 2022). The spatial pattern of land use change trajectories can provide data support for land use policy and protection of ecological environment (Wang et al., 2020).
Karst land is an important and unique terrain on the earth’s surface because of its high ecological fragility. Wujiang River Basin is located in the typical karst area of Southwest China. The special geological background, coupled with the impact of human activities, has led to the continuous degradation of the ecological environment, which has evolved into a typical ecological fragile area (Wang and Li, 2007; Xu et al., 2021). Land use is the most important manifestation of human action on karst environment. The research on land use change in Wujiang River Basin mainly includes the impact of land use on soil erosion intensity (Wang et al., 2013b), analysis on the evolution of ecosystem service value based on land use (Niu et al., 2018), spatial and temporal evolution of land use based on topographic gradient (Liu et al., 2020), evaluation of eco-environmental effect of karst mountain basin based on land use transformation (Liu et al., 2021). Based on this, this study used the transformation matrix, the intensity analysis and the change trajectory analysis method to analyze the land use change in Wujiang River Basin. The objectives of this study were to 1) reveal the change of ecological-production-living land based on the land use matrix method; 2) evaluate the intensity and stability of land use change; 3) identify the spatio-temporal land use change trajectories, so provide basis for identification of priority areas for ecological restoration. Our study provided an integrated application of land use change trajectory method with traditional land use change analysis methods. The research can provide data support and decision-making basis for the sustainable use of land resources and ecological environment protection.
The Wujiang River Basin is located in Southwest China (26°06′–30°22′N, 104°10′–109°22′E), (Figure 1), with an area of 87,900 km2 and a total length of 1,037 km. The region is characterized by the subtropical temperate and humid monsoon climate, with an average annual temperature of 13–18°C, an annual average precipitation of 1,130 mm. It is a typical karst area and rocky desertification area, as well as an important water conservation area and soil conservation area designated by National Ecological Function Zoning. Irrational land use has led to ecological degradation of this fragile karst systems.
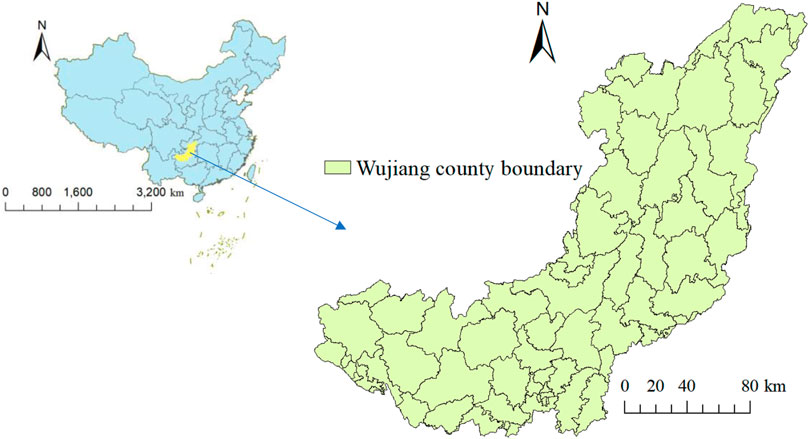
FIGURE 1. The position of Wujiang River Basin.
The land use data from 1985 to 2019 were derived from https://zenodo.org/record/4417810#.YuqLFc7YuUl, with a spatial resolution of 30 m and eight period. The land use in the study area is classified into 7 types, including cropland, forest land, shrub land, grassland, water area, barren land, impervious land. The land use codes used for trajectory analysis were shown in Table 1. The ecological lands include forest land, shrub land, grass land, water area and barren land. Cropland is classified as production land and impervious land is classified as living land.
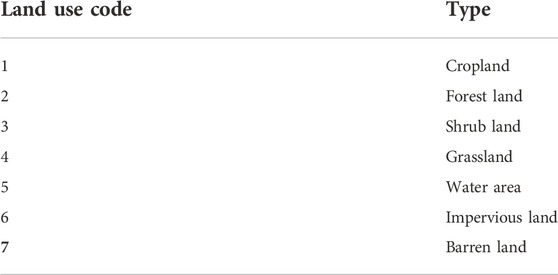
TABLE 1. Code table of land use types.
The land use transfer matrix was used to analyze the transformation of various land use types during one certain period, which can describe the changing area and direction of different land use types (Cai et al., 2017).
Intensity analysis includes three levels: time interval level, category level and transition level (Aldwaik and Pontius, 2012). The change area and change intensity of each time interval and each land type were calculated, and the observed change intensity was compared with the uniform change intensity to reveal the change characteristics of different levels.
The trajectory of land use change refers to successions of land use types over the eight periods. The trajectory codes was calculated using formula as below (Wang et al., 2013a):
where Ti is the trajectory code of land use change at the give gird; n is the number of time nodes; (G1)i, (G2)i, and (Gn)i are the codes of the land use type of each time node at the given grid.
A GIS database of the land use change trajectory of Wujiang River Basin was obtained using the formula. The database file of the change trajectory were processed further to extract three indices, namely: similarity (T), turnover (T) and diversity (D) (Swetnam, 2007; Wang et al., 2020). The STD method was used to determined land use change trajectory. The three indices were combined into one of six groups: stable, metastable, stepped, discontinuous, cyclical and dynamic (Table 2). These six groups were then linked back to the GIS database to map the spatial trajectory of land use change.
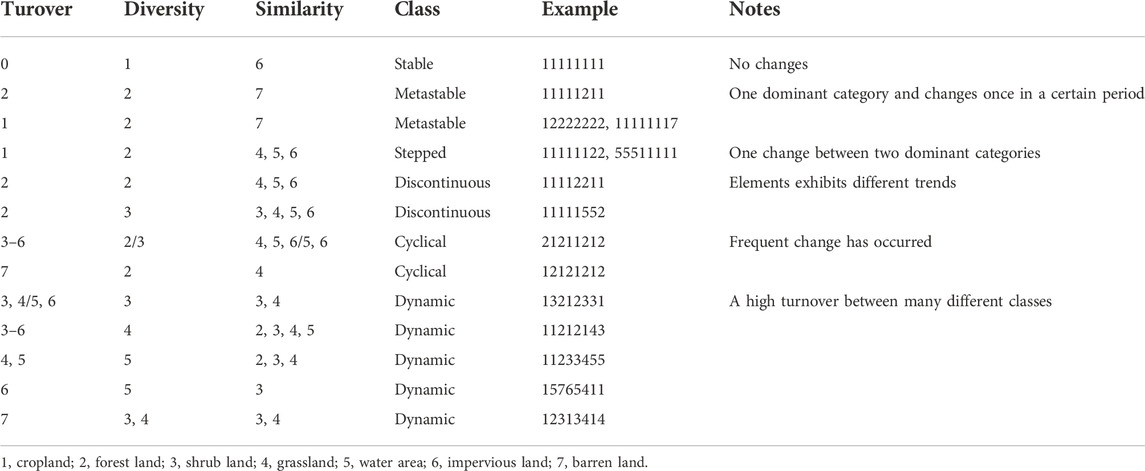
TABLE 2. Classification principle of land use change trajectory.
The land use in Wujiang River Basin was mainly cropland and forest land, followed by shrub land and grassland. From 1985 to 2000, the area of shrub land, grassland and barren land decreased, and the area of other land use types increased (Figure 2). The policy of returning farmland to forests from 2000 had an important impact on the land use change pattern of the Wujiang River basin. From 2000 to 2019, the area of shrub land, grassland and cropland decreased, and the area of other land use types increased. The ecological land decreased and the living land increased in the two time interval, while the production land increased in the first time interval and decreased in the second time interval.

FIGURE 2. The land use in Wujiang River Basin in 1985, 2000 and 2019.
As seen from Figure 3, the land use change in Wujiang River Basin in various periods was mainly the conversion between cropland and forest land, followed by the conversion from shrub land to forest land and cropland, forest land to shrub land, cropland to shrub land and grassland, and grassland to cropland. The main land use change showed different trends. From 1985 to 1995, shrub land decreased and cropland increased. From 1995 to 2000, cropland decreased and forest land increased. From 2000 to 2005, cropland and grassland decreased and shrub land increased. From 2005 to 2010, shrub land and grass land decreased and cropland increased. From 2010 to 2015, shrub land decreased and cropland and forest land increased. From 2015 to 2019, cropland decreased and forest land increased. The area of impervious land continued to increase, significantly increasing after 2005. The land use change was closely related to socio-economic factors and policy factors. The pilot project of returning farmland to forests was completed in 2000 and launched in 2002. In 2008, comprehensive desertification control was launched, and the water and soil conservation plan were implemented in 2017.
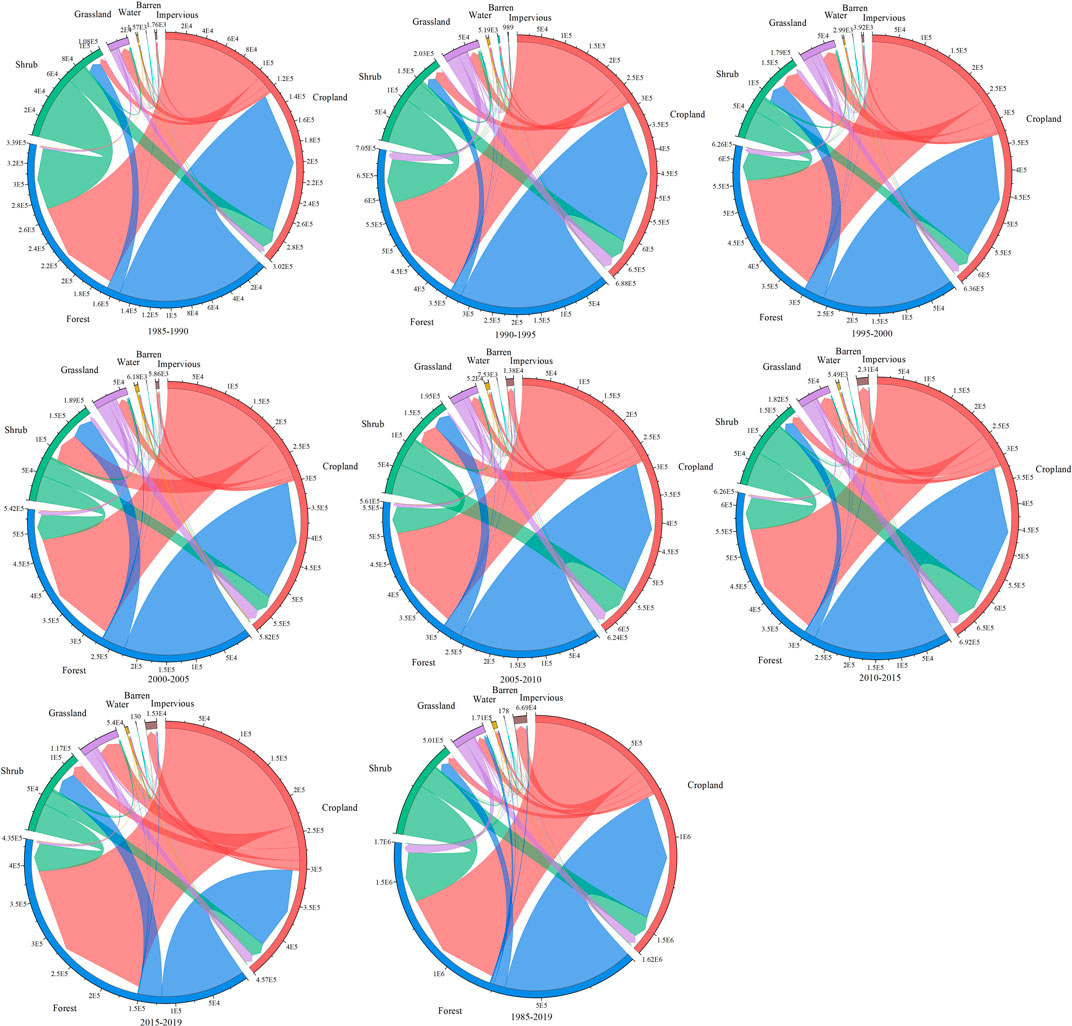
FIGURE 3. The change area of land use in different periods (The outer circle is the changed land type, the inner circle links the conversion direction and area between land types, the transfer line is the flow direction of a certain land type, and the line thickness indicates the conversion area).
The annual intensity of land use change in the time interval level is shown in Figure 4. The annual intensity in 1990–1995, 1995–2000, 2005–2010 and 2010–2015 was greater than the uniform annual change, indicating the rapidly change in these periods. The change intensity in 1985–1995, 2000–2005 and 2015–2019 was less than the uniform annual change, indicating that the annual intensity in these periods was slow. The trend of area change is consistent with the annual intensity change. The change area in 1990–1995 and 2010–2015 was the largest, accounting for 9.64% and 9.12% of the study area respectively. The change area in 1985–1990 was the smallest, accounting for 4.43% of the study area.
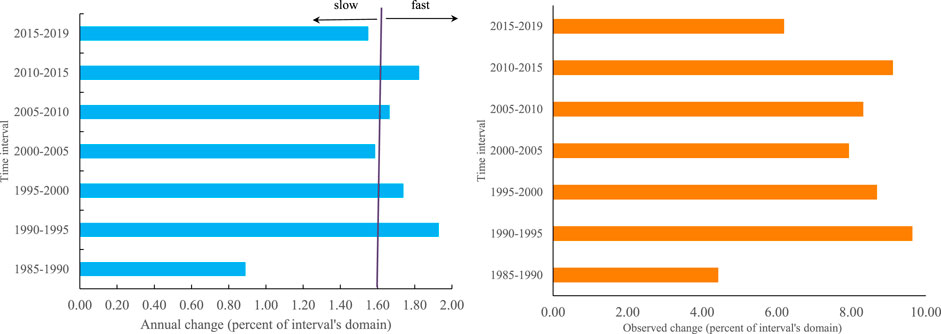
FIGURE 4. The interval level change of land use in Wujiang River Basin.
The change intensity of the land use in the category level is shown in Figure 5. The increase and decrease intensity of the forest land were less than the uniform intensity, and the forest land was stable in the whole period. The increasing intensity and decreasing intensity of shrub land and grassland were greater than the uniform intensity, and they are active in the whole period. Except that the increase intensity of barren land in the period of 1985–1990 was less than the average value, the increase and decrease intensity in other time intervals were greater than the uniform intensity, which was basically active in the whole period. Cropland, water area and impervious land showed different intensity change trends in different time intervals.
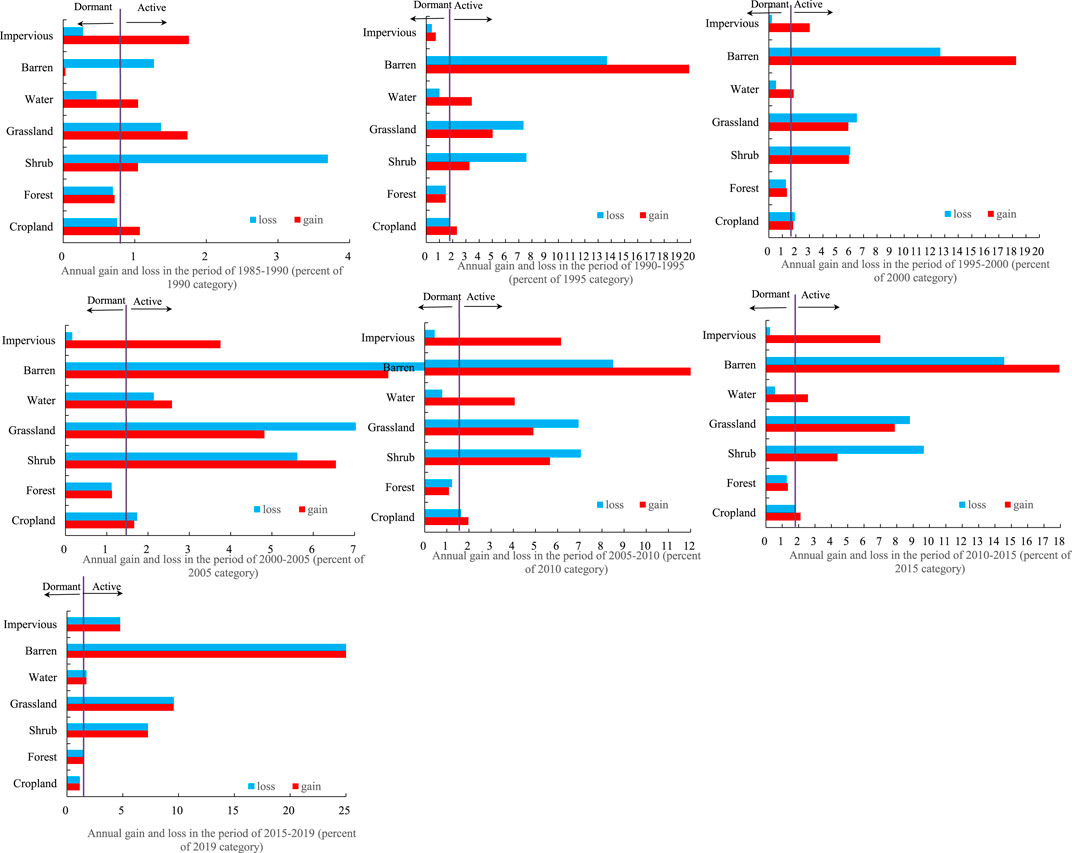
FIGURE 5. Intensity changes of land use in category level in Wujiang River Basin.
The transition level to impervious land in the seven time intervals is shown in Figure 6. The transition intensity of barren land, water area and cropland were greater than the uniform intensity in 1985–1990. The transition intensity of barren land, grassland and water area was greater than the uniform intensity in 1990–1995. The transition intensity of barren land, grassland land and cropland were greater than the uniform intensity in 1995–2000. In all periods after 2000, transition intensity of barren land, water area, grassland and cropland were greater than the average change intensity. The increase of impervious land was mainly from cropland, followed by grassland and forest land.
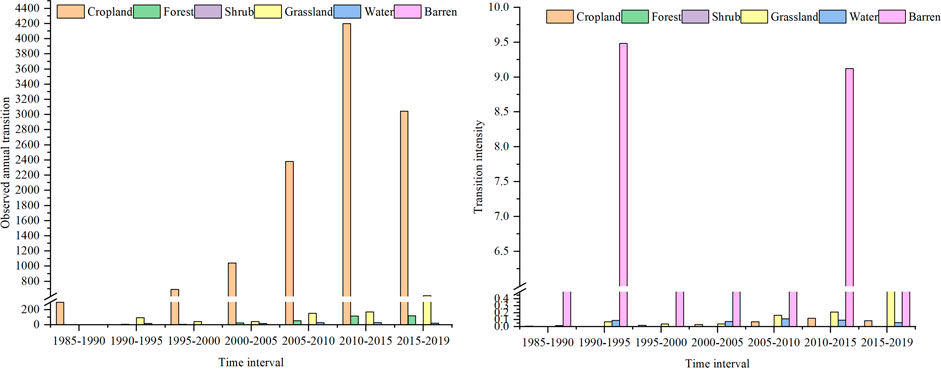
FIGURE 6. Transition from other land use types to impervious land in the transition level.
The annual transition and transition intensity from forest land to other land use types in transition level in seven time intervals are shown in Figure 7. The transition intensity of forest land into cropland from 1985 to 1990, from 1990 to 1995 and from 2010 to 2015 were greater than the uniform intensity, and the reduction from forest land into shrub land in the period from 1995 to 2019 were greater than the uniform intensity. The observed annual transition of forest land was mainly to cropland and shrub land.
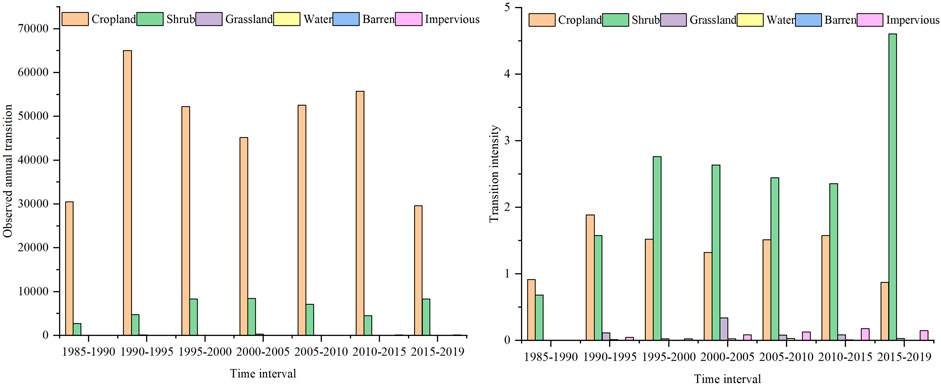
FIGURE 7. Transition from forest land to other land use types in the transition level.
The change trajectory with an area greater than 1 km2 is shown in Figure 8. The trajectory changes of different land use types in different periods were obvious. The change track was stable in the early stage, and changed drastically after 2000. From 1985 to 2019, cropland mainly flowed to forest land and shrub land, followed by grassland, water area and impervious land. Forest land mainly flowed to cropland and shrub land, followed by grassland, and shrub mainly flowed to cropland, forest land, followed by grassland.
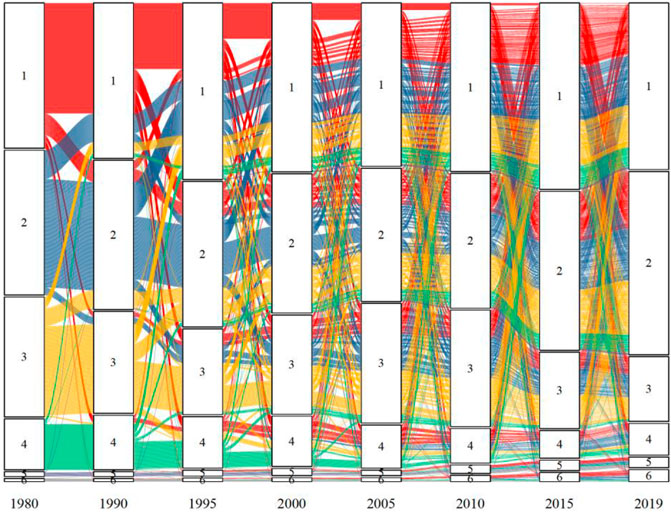
FIGURE 8. Land use change trajectory of Wujiang River Basin from 1985 to 2019 (1, Cropland; 2, Forest land; 3, Shrub land; 4, Grassland; 5, Water area; 6, Impervious land; area > 1 km2).
From 1985 to 2019, the land use change trajectories in Wujiang River Basin are shown in Figure 9. The stable type accounted for 67.36% of the total area and was the largest type. The metastable type, stepped type, discontinuous type, cyclical type and dynamic type accounts for 8.40%, 13.11%, 5.90%, 4.22% and 0.92% of the total area respectively. The discontinuous type, cyclical type and dynamic type of land use change trajectories are sporadically distributed in the whole Wujiang River Basin, of which the distribution in the high-altitude areas is affected by the karst landforms and mines, while in other regions, these three change trajectories changes are more distributed in the lower altitude areas.
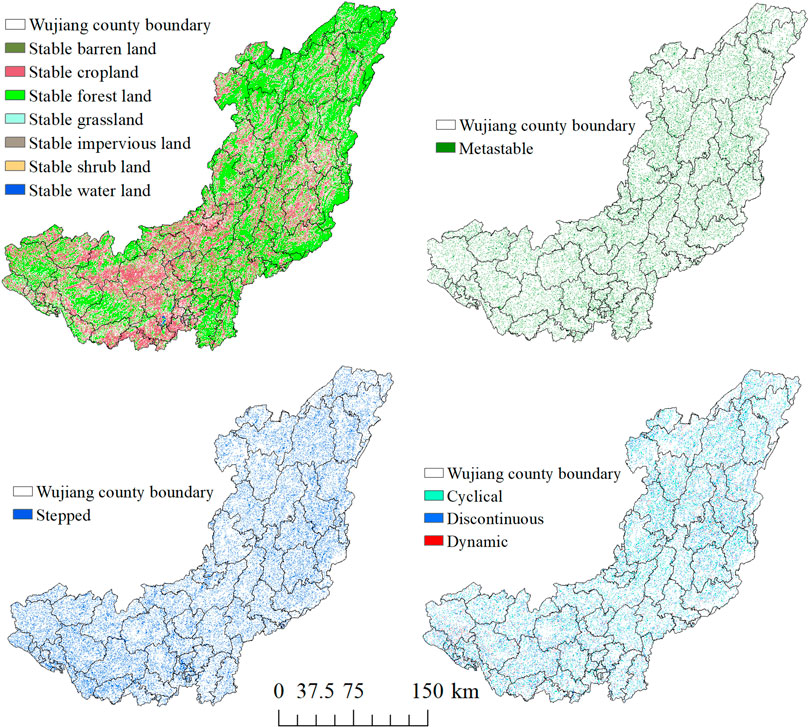
FIGURE 9. The land use change trajectory from 1985 to 2019.
Understanding the ecological effects of land use based on the ecological-production-life function is an important issue of land use/land cover change (Zhang et al., 2019). The eco-environmental effects and spatial heterogeneity of ecological-productive-living land is an important basis for regional territorial development planning and eco-environment protection (Han et al., 2021). In this study, the ecological land decreased from 1985 to 2000 and from 2000 to 2019, the production increased first then decreased, and living land increased in Wujiang River Basin, and the reduction of ecological land is mainly due to the reduction of shrub land and grassland. The land use change based on land use matrix method is mainly between cropland, forest land and shrub land. The land use change in Wujiang River Basin is closely related to terrain gradient, and also influenced by socioeconomic factors, and policy factors (Liu et al., 2020). Since 2000, the increase of ecological land area of forest land and water area in the Wujiang River basin is due to the ecological quality control projects such as the comprehensive control project of rocky desertification, the project of returning farmland to forest and grassland, and the construction of water conservancy facilities (Liu et al., 2021). Other research using land use transfer matrix showed that ecological land was decreasing continuously and living land expanded rapidly (Cai et al., 2017). The rapid increase of farmland and construction land has damaged the ecosystem, including grasslands, forest lands and aquatic regions, thus decreasing the ecosystem services value (Wang et al., 2017). The result of this study showed the most stable land was forest land, while baren land, shrub land and grassland were the most active in the category level. Other research showed that agriculture land and built land are active categories and the transition from agriculture land to built land is intensively systematic (Huang et al., 2012).
In this study, the land use change trajectory method was used to reveal the stability and change area of the ecological-production-living land during in the long-time series of Wujiang River Basin. As shown in Figure 8, the flow of land use type was obvious during the long-term time series. By classification of the land use change trajectory into six groups as shown in Table 2, the spatial distribution was shown if Figure 9. The results showed the most stable land was forest land. And the distribution of dynamic trajectory zone was affected by the karst landforms and mines in the higher altitude region, which may be identified as priority area in regional ecological restoration.
In this study, land use dynamics is revealed based on three methods, which is useful for ecological restoration priority identification. Intensity analysis is a top-down hierarchical interpretive mathematical framework, which is important for systematic and in-depth understanding of the land use change process. The complex land use in the study area is more suitable for using different levels of intensity analysis. However, intensity analysis cannot reveal the change trajectory. The trajectory method can accurately extract land use change trajectories to exhibit the transfer, flow and pattern of land use types, thus the spatial and temporal evolution characteristics of land can be derived from time series aspect. However, the main problem is that with the increase of study time series, the trajectories of land use change become more complicated and the trajectories are more difficult to extract.
The shortcomings of this study are that the driving force mechanism of land use change is not deeply elaborated and the future change trend is not predicted. In addition, the study of landscape fragmentation, spatial heterogeneity trends, and evaluation of the risk of human activities on ecosystem stability need to be further explored in depth.
The study area has undergone dramatic land use change in the past 34 years. The goal of this study was to quantify the spatial and temporal changes of ecological space and analyze its stability. The results showed that from 1985 to 2019, ecological land reduced, the production land increased first then decreased, and living land increased, and the conversion between production land and living land was frequent. The stable trajectory area accounted for the largest proportion of the study area, indicating that land use situation in the study area was stable on the whole. It is necessary to further investigate the ecological space that needs to be repaired from the aspects of ecosystem service function and ecological vulnerability.
The original contributions presented in the study are included in the article/Supplementary Materials, further inquiries can be directed to the corresponding authors.
SL: research design, review and editing; YD: drafting the article and revising; FW and HL: the methods and the reference.
This work was supported by National Key Research and Development Project (No. 2022YFF1303204) and National Natural Sciences Fund Project (No. 42271097).
The authors declare that the research was conducted in the absence of any commercial or financial relationships that could be construed as a potential conflict of interest.
All claims expressed in this article are solely those of the authors and do not necessarily represent those of their affiliated organizations, or those of the publisher, the editors and the reviewers. Any product that may be evaluated in this article, or claim that may be made by its manufacturer, is not guaranteed or endorsed by the publisher.
Aldwaik, S. Z., and Pontius, R. G. (2012). Intensity analysis to unify measurements of size and stationarity of land changes by interval, category, and transition. Landsc. Urban Plan. 106 (1), 103–114. doi:10.1016/j.landurbplan.2012.02.010
Bryan, B. A., Ye, Y., Zhang, J. e., and Connor, J. D. (2018). Land-use change impacts on ecosystem services value: Incorporating the scarcity effects of supply and demand dynamics. Ecosyst. Serv. 32, 144–157. doi:10.1016/j.ecoser.2018.07.002
Cai, E., Jing, Y., Liu, Y., Yin, C., Gao, Y., and Wei, J. (2017). Spatial–temporal patterns and driving forces of ecological-living-production land in Hubei Province, Central China. Sustainability 10 (1), 66. doi:10.3390/su10010066
Chatterjee, S., Dutta, S., Dutta, I., and Das, A. (2022). Ecosystem services change in response to land use land cover dynamics in Paschim Bardhaman District of West Bengal, India. Remote Sens. Appl. Soc. Environ. 27, 100793. doi:10.1016/j.rsase.2022.100793
Chen, H., Chen, C., Zhang, Z., Lu, C., Wang, L., He, X., et al. (2021). Changes of the spatial and temporal characteristics of land-use landscape patterns using multi-temporal landsat satellite data: A case study of zhoushan island, China. Ocean Coast. Manag. 213, 105842. doi:10.1016/j.ocecoaman.2021.105842
Chu, X., Lu, Z., Wei, D., and Lei, G. (2022). Effects of land use/cover change (LUCC) on the spatiotemporal variability of precipitation and temperature in the Songnen Plain, China. J. Integr. Agric. 21 (1), 235–248. doi:10.1016/s2095-3119(20)63495-5
Guo, X., Chang, Q., Liu, X., Bao, H., Zhang, Y., Tu, X., et al. (2018). Multi-dimensional eco-land classification and management for implementing the ecological redline policy in China. Land Use Policy 74, 15–31. doi:10.1016/j.landusepol.2017.09.033
Han, M., Kong, X., Li, Y., Wei, F., Kong, F., and Huang, S. (2021). Eco-environmental effects and its spatial heterogeneity of ‘ecological-production-living’ land use transformation in the Yellow River Delta. Sci. Geogr. Sinia 41 (6), 1009–1018. doi:10.13249/j.cnki.sgs.2021.06.010
Hasan, S. S., Zhen, L., Miah, M. G., Ahamed, T., and Samie, A. (2020). Impact of land use change on ecosystem services: A review. Environ. Dev. 34, 100527. doi:10.1016/j.envdev.2020.100527
Huang, J., Pontius, R. G., Li, Q., and Zhang, Y. (2012). Use of intensity analysis to link patterns with processes of land change from 1986 to 2007 in a coastal watershed of southeast China. Appl. Geogr. 34 (3), 371–384. doi:10.1016/j.apgeog.2012.01.001
Libessart, G., Franck-Néel, C., Branchu, P., and Schwartz, C. (2022). The human factor of pedogenesis described by historical trajectories of land use: The case of Paris. Landsc. Urban Plan. 222, 104393. doi:10.1016/j.landurbplan.2022.104393
Liu, C. J., Zhou, G. F., Huang, Q. F., Lei, C., Zhou, Y., and Zhang, N. (2020). Spatial-temporal evolution of land use in Wujiang River Basin in Guizhou Province based on the terrain gradient. J. Guizhou Normal Univ. ( Nat. Sci. 38 (6), 45–54. doi:10.1088/1755-1315/108/4/042066
Liu, C., Zhou, G., Huang, Q., Zhou, Y., and Zhang, D. (2021). Ecological environment effect on the karst mountain watershed based on land use transition. Ecol. Sci. 40 (3), 102–111. doi:10.14108/j.cnki.1008-8873.2021.03.013
Mallinis, G., Koutsias, N., and Arianoutsou, M. (2014). Monitoring land use/land cover transformations from 1945 to 2007 in two peri-urban mountainous areas of Athens metropolitan area, Greece. Sci. Total Environ. 490, 262–278. doi:10.1016/j.scitotenv.2014.04.129
Meyer, M. A., and Früh-Müller, A. (2020). Patterns and drivers of recent agricultural land-use change in Southern Germany. Land Use Policy 99, 104959. doi:10.1016/j.landusepol.2020.104959
Niu, Q., Zhou, X., Xu, Y., Yang, J., and Zhang, J. (2018). Analysis of ecosystem service value evolution of Wujiang River basin of Guizhou Province based on land use. Ecol. Sci. 37 (5), 165–173. doi:10.14108/j.cnki.1008-8873.2018.05.022
Qiu, L., Pan, Y., Zhu, J., Amable, G. S., and Xu, B. (2019). Integrated analysis of urbanization-triggered land use change trajectory and implications for ecological land management: A case study in Fuyang, China. Sci. Total Environ. 660, 209–217. doi:10.1016/j.scitotenv.2018.12.320
Swetnam, R. D. (2007). Rural land use in England and Wales between 1930 and 1998: Mapping trajectories of change with a high resolution spatio-temporal dataset. Landsc. Urban Plan. 81 (2), 91–103. doi:10.1016/j.landurbplan.2006.10.013
Takada, T., Miyamoto, A., and Hasegawa, S. F. (2010). Derivation of a yearly transition probability matrix for land-use dynamics and its applications. Landsc. Ecol. 25 (4), 561–572. doi:10.1007/s10980-009-9433-x
Tang, J., Li, Y., Cui, S., Xu, L., Ding, S., and Nie, W. (2020). Linking land-use change, landscape patterns, and ecosystem services in a coastal watershed of southeastern China. Glob. Ecol. Conservation 23, e01177. doi:10.1016/j.gecco.2020.e01177
Wang, D., Gong, J., Chen, L., Zhang, L., Song, Y., and Yue, Y. (2012). Spatio-temporal pattern analysis of land use/cover change trajectories in Xihe watershed. Int. J. Appl. Earth Obs. Geoinf. 14 (1), 12–21. doi:10.1016/j.jag.2011.08.007
Wang, D., Gong, J., Chen, L., Zhang, L., Song, Y., and Yue, Y. (2013a). Comparative analysis of land use/cover change trajectories and their driving forces in two small watersheds in the Western Loess Plateau of China. Int. J. Appl. Earth Obs. Geoinf. 21, 241–252. doi:10.1016/j.jag.2012.08.009
Wang, S., Feng, Z., Yu, Y., and Zhang, H. (2020). Land use/cover change trajectory analysis based on improved stable mapping method. China Acad. J. Electron. Publ. House 51 (8), 152–162. doi:10.6041/j.issn.1000-1298.2020.08.017
Wang, S., and Li, Y. (2007). Problems and development trends about researches on karst rocky desertification. Adv. Earth Sci. 22 (6), 573–582. doi:10.3321/j.issn:1001-8166.2007.06.003
Wang, X., Dong, X., Liu, H., Wei, H., Fan, W., Lu, N., et al. (2017). Linking land use change, ecosystem services and human well-being: A case study of the manas River Basin of xinjiang, China. Ecosyst. Serv. 27, 113–123. doi:10.1016/j.ecoser.2017.08.013
Wang, Y., Cai, Y. L., and Pan, M. (2013b). Analysis on the relationship between soil erosion and land use in Wujiang River Basin in Guizhou Province. Res. Soil Water Conservation 20 (3), 11–18.
Xu, G., Xiao, J., Oliver, D. M., Yang, Z., Xiong, K., Zhao, Z., et al. (2021). Spatio-temporal characteristics and determinants of anthropogenic nitrogen and phosphorus inputs in an ecologically fragile karst basin: Environmental responses and management strategies. Ecol. Indic. 133, 108453. doi:10.1016/j.ecolind.2021.108453
Yang, Q. K., Duan, X. J., and Wang, L. (2018). Land use transformation based on ecological-production-living spaces and associated eco-environment effects: A case study in the yangtze river Delta. Sci. Geogr. Sin. 38 (1), 97–106. doi:10.3390/land11071076
Zhang, L., Liu, G., Liu, Y., and Wei, J. (2019). The effects of "ecological-production-living" land use transformation on associated ecological service value: A case study of yingkou city. Chin. J. Ecol. 38 (3), 838–846. doi:10.13292/j.1000-4890.201903.024
Zhang, Y., Li, Y., Lv, J., Wang, J., and Wu, Y. (2021). Scenario simulation of ecological risk based on land use/cover change – a case study of the Jinghe county, China. Ecol. Indic. 131, 1–12. doi:10.1016/j.ecolind.2021.108176
Zhao, H. L., Xu, Y., Zhou, Y., Zhang, G. L., and Chen, X. (2022). Quantitative identification and analysis of spatiotemporal evolution characteristics of ecological space: Case study of Hulun Buir citys. J. Nat. Resour. 37 (8), 2153–2168. doi:10.31497/zrzyxb.20220815
Zheng, Z., and He, Q. (2021). Spatio-temporal evaluation of the urban agglomeration expansion in the middle reaches of the Yangtze River and its impact on ecological lands. Sci. Total Environ. 790, 148150. doi:10.1016/j.scitotenv.2021.148150
Zhou, Q., Li, B., and Kurban, A. (2008). Spatial pattern analysis of land cover change trajectories in Tarim Basin, northwest China. Int. J. Remote Sens. 29 (19), 5495–5509. doi:10.1080/01431160802060938
Keywords: land use change, ecological-production-living land, spatial-temporal variation, land use change trajectory, Wujiang River Basin
Citation: Liu S, Dong Y, Wang F and Liu H (2022) Priority area identification of ecological restoration based on land use trajectory approach—Case study in a typical karst watershed. Front. Environ. Sci. 10:1011755. doi: 10.3389/fenvs.2022.1011755
Received: 04 August 2022; Accepted: 10 November 2022;
Published: 30 November 2022.
Edited by:
Donatella Valente, University of Salento, ItalyReviewed by:
Kai Liu, Shandong Normal University, ChinaCopyright © 2022 Liu, Dong, Wang and Liu. This is an open-access article distributed under the terms of the Creative Commons Attribution License (CC BY). The use, distribution or reproduction in other forums is permitted, provided the original author(s) and the copyright owner(s) are credited and that the original publication in this journal is cited, in accordance with accepted academic practice. No use, distribution or reproduction is permitted which does not comply with these terms.
*Correspondence: Shiliang Liu, c2hpbGlhbmdsaXVAYm51LmVkdS5jbg==; Yuhong Dong, eWhvbmdkb25nQDE2My5jb20=
Disclaimer: All claims expressed in this article are solely those of the authors and do not necessarily represent those of their affiliated organizations, or those of the publisher, the editors and the reviewers. Any product that may be evaluated in this article or claim that may be made by its manufacturer is not guaranteed or endorsed by the publisher.
Research integrity at Frontiers
Learn more about the work of our research integrity team to safeguard the quality of each article we publish.