 Weipeng Lu
 Ji Qi
Ji Qi Huihui Feng
- School of Geosciences and Info-Physics, Central South University, Changsha, China
Urban functional zones (UFZs) are the fundamental units for urban management and operation. The advance in earth observation and deep learning technology provides chances for automatically and intelligently classifying UFZs via remote sensing images. However, current methods based on deep learning require numerous high-quality annotations to train a well-performed model, which is time-consuming. Thus, how to train a reliable model using a few annotated data is a problem in UFZ classification. Self-supervised learning (SSL) can optimize models using numerous unannotated data. In this paper, we introduce SSL into UFZ classification to use the instance discrimination pretext task for guiding a model to learn useful features from over 50,000 unannotated remote sensing images and fine tune the model using 700 to 7,000 annotated data. The validation experiment in Beijing, China reveals that 1) using a few annotated data, SSL can achieve a kappa coefficient and an overall accuracy 2.1–11.8% and 2.0–10.0% higher than that of supervised learning (SL), and 2) can also gain results comparable to that got by the SL paradigm using two times annotated data for training. The less the data used for finetuning the more obvious the advantage of SSL to SL. Besides, the comparison experiment between the model pretrained on the research region and that pretrained on the benchmark reveals that the objects with displacement and incompleteness are more difficult for models to classify accurately.
1 Introduction
Urban functional zones (UFZs), including commercial zones, industrial zones, and residential zones, have specific social activities. The spatial distribution of UFZs describes the city structure and reveals the land demand, playing an important role in urban management (Zhang et al., 2017; Chen et al., 2018). Nowadays, geographic big data like points of interest and geo-tagged photos become available, which were used to analyze UFZ spatial patterns. For example, Yin et al. (2021b) used the density of points of interest to determine the type of parcels and map out the UFZ. Kang et al. (2021) used photos from Flickr to investigate the landscapes to guide the tourisms industry. However, these data were uploaded by users, so their quality are uncontrollable (Yin et al., 2021a). The advance in earth observation provides high spatiotemporal-resolution remote sensing imagery (RSI), which is widely used for UFZ classification research (Bao et al., 2020; Cao et al., 2020; Liu et al., 2021).
Traditional RSI interpretation relies on handcrafted features (Dai and Yang, 2010; Zhu et al., 2014; Castelluccio et al., 2015), in which radiometric features, texture features, and shape features were used for image classification and retrieval (Luo et al., 2013). Zhang et al. (2018) proposed a hierarchical bottom-up and up-bottom feedback model to improve the classification accuracy of UFZs by handcrafted features like gray-level co-occurrence matrix (GLCM). Du et al. (2019) used window independent context (WIC) feature to extract spatial units of UFZs from very-high-resolution RSI. However, generating a well-designed handcrafted feature requires expert experience and has low robustness, which cannot provide satisfying results in complex RSI interpretation like UFZ classification (Cheng et al., 2017).
Recently, with the development of deep learning technology, the methods based on high-level visual features, like convolutional neural networks (CNNs), are employed in intelligent and automatic feature extraction (Ioffe and Szegedy, 2015; He et al., 2016; Szegedy et al., 2016). More and more UFZ researchers have adapted CNNs for representation and classification (Liu et al., 2017; Cheng et al., 2018; Wang et al., 2018). For UFZ classification, CNNs have become an essential part in recent 5 years (Bao et al., 2020; Liu et al., 2020; Xu et al., 2020; Zhou et al., 2020; Du et al., 2021; Lu et al., 2022). Zhou et al. (2020) proposed super-object based CNNs to classify UFZ in RSI. They used the AlexNet (Krizhevsky et al., 2012), a typical CNN model, to determine the class of a clipped RSI. Du et al. (2021) designed a multi-scale semantic segmentation network combining an object-level conditional random field to map UFZ at the object level.
Generally, the training of a CNN follows the supervised learning (SL) paradigm, which fits the parameters using numerous annotated training data. Under the SL paradigm, training a stable model requires a large number of high-quality samples (Ma et al., 2017). Large-scale image classification datasets, such as ImageNet (Krizhevsky et al., 2012) and Pattern Analysis, Statical modeling and ComputAtional Learning Visual Object Classes (PASCAL VOC) challenge dataset (Everingham et al., 2010) have promoted the development of SL in computer vision. However, when SL is applied to the field like remote sensing and medical image, this training paradigm often has insufficient training samples. Annotating an RSI dataset needs professional knowledge and tedious work, so annotating an RSI dataset as large as ImageNet is costly. Therefore, it is difficult to train a good-performance UFZ classification model with existing datasets under the SL paradigm.
Transfer learning (TL) pretrains a model on large-scale datasets via SL and then finetunes parts of model parameters by target tasks, like UFZ classification. It can reduce the annotation requirement (Wang et al., 2020; Yang et al., 2020). TL assumes that the model can learn a general representation from large amounts of datasets. And the representation can be transferred into the remote sensing domain by a few annotated data. But TL requires that the data used for pretraining and finetuning should have the same number of channels. Natural images have the three channels of red band, green band, and blue band (RGB bands), but different RSIs have different numbers of channels. For example, multispectral images and hyperspectral images have more than three channels and panchromatic imagery has only one channel. The difference in channel numbers causes difficulty in finetuning the RGB-pretrained model on RIS. In addition, the RGB-band RSIs have quite different visual characteristics from natural images, due to the different imaging mechanisms, such as angle and distance. Therefore, it is a problem to train a model via massive unannotated RSIs.
In the past few years, self-supervised learning (SSL) has become popular in model pretraining and gains results comparable to those got by previous learning paradigms in computer vision tasks such as image classification, semantic segmentation, and object detection (Doersch and Zisserman, 2017; Similarities, 2021; Tao et al., 2021; Li et al., 2022). SSL trains models to learn useful knowledge via pretext task, whose annotation is obtained directly from the training data. Thus, SSL has the advantage that its pretrain period is label-free. Recently, SSL researches on RSI have made great progress, but most of them only used public benchmark for experiments (Yu et al., 2020; Zhao et al., 2020; Stojnic and Risojevic, 2021). For example, Tao et al. (2022) investigated the potential of SSL on RSI interpretation by three open RSI datasets: EuroSAT, which is the Land Use and Land Cover Classification with Sentinel-2 (Helber et al., 2019), Aerial Image Dataset (AID) (Xia et al., 2017), and NWPU-RESISC45, which is the REmote Sensing Image Scene Classification (RESISC) dataset created by Northwestern Polytechnical University (NWPU) with 45 classes (Cheng et al., 2017). No relevant studies have been carried out in the practical application. The RSIs selected in open RSI datasets and those used for practical applications are different (Cheng et al., 2017, 2020; Hong, 2021).
• First, in the images selected for open RSI datasets, the objects of interest are always at the center. In the images used for practical application, the location of key objects is random, so the image is difficult to be cropped with the target at the center. The displacement of objects causes sample misclassification by the model pre-trained on benchmark.
• Second, the image size of a benchmark is always fixed, but the scales of objects in benchmarks are different (e.g., factory and airport). Thus, the benchmark spatial resolution changes to make sure the key object is contained in the image completely. However, in practice, the spatial resolution and the image size are always fixed, so some large-scale object might be cropped into several patches, which is difficult for the model to classify accurately.
Therefore, this paper intends to introduce the SSL into the UFZ classification of the region inside the Sixth Ring Road of Beijing, China, and to investigate the different performance of SSL in open RSI dataset and the practical application. Specifically, we pretrain the model on unannotated RSI of downtown Beijing via SSL, and then collect a small-scale UFZ classification dataset to fine-tune the model. Notably, in order to be like the practical application, all samples used in the experiments are randomly cropped with fixed resolution and size. The experiment result shows that SSL has advantages over SL in terms of sample demand and final classification accuracy.
2 Materials and methods
2.1 Study area and data
This study takes Beijing, China as the research region (shown in Figure 1). It has a spatial coverage of 3300 km2 (longitude 116°04′-116°44′E and latitude 39°40′-40°11′N) and a population of 21,000,000. This region contains a variety of urban landscapes, which can effectively denote old/new city areas and urban/suburbs.
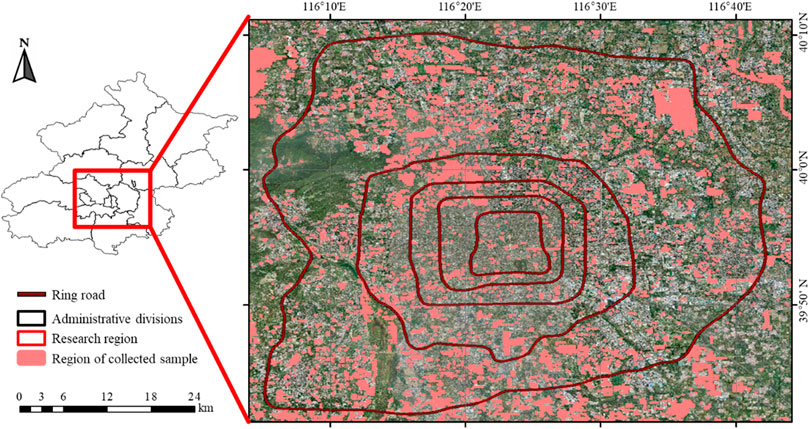
FIGURE 1. The study area and its location in Beijing, China.
The RSI used in this paper is downloaded from Bing Virtual with a size of
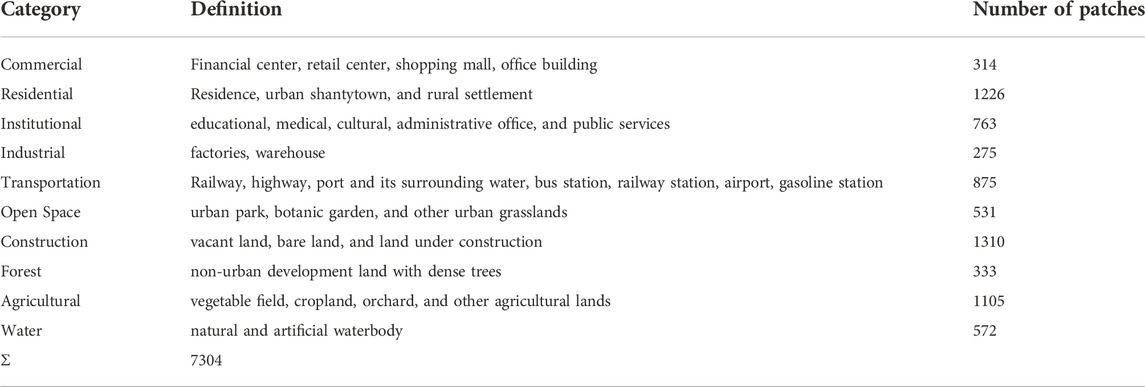
TABLE 1. The classification system and number of patches for each UFZ type of the collected dataset.
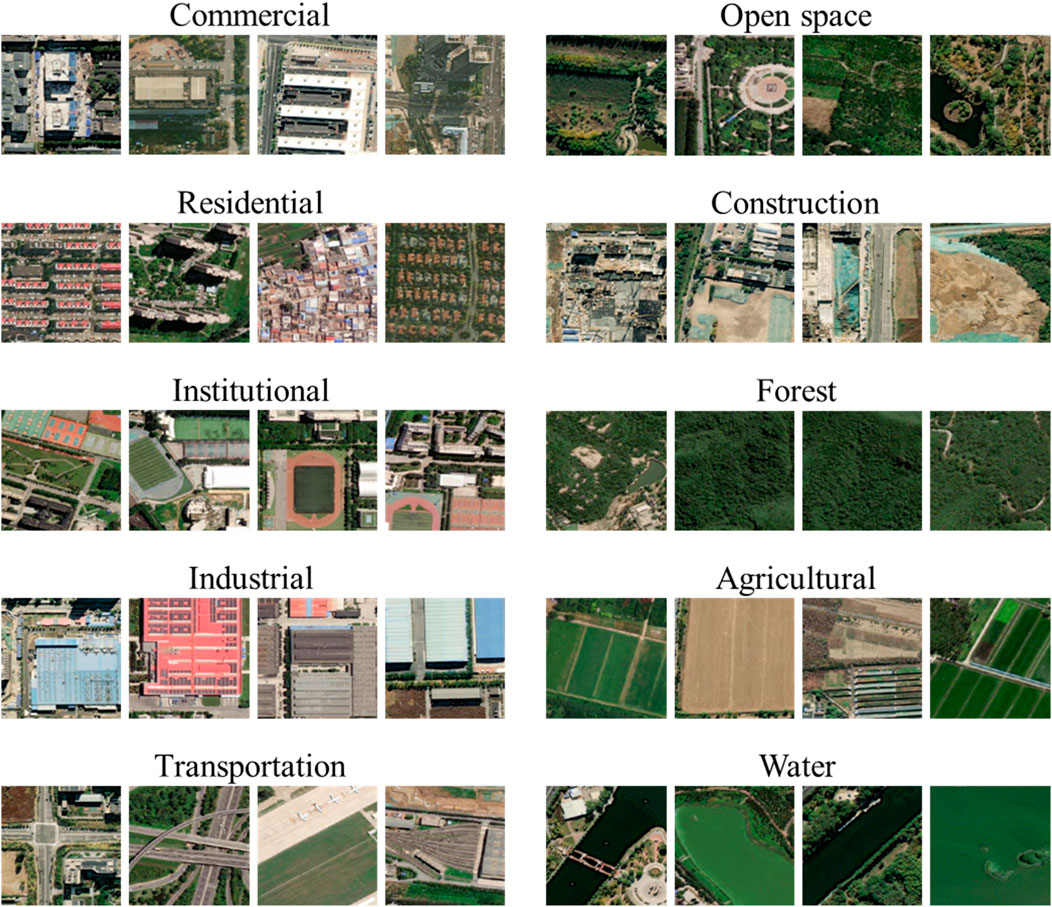
FIGURE 2. Samples of the 10 urban function zone (UFZ) types.
2.2 Paradigm of SL and SSL
The supervised learning (SL) is a model training paradigm that has been widely used in big data analysis. Given dataset
The SSL is to initialize a model’s parameters using pretext tasks, such as image reconstruction, rotation prediction, and instance discrimination (Tao et al., 2020). By solving the pretext tasks, the model can learn the useful features from unannotated samples. Here, we introduce the instance discrimination task that will be used in our research.
Given an image (instance)
where
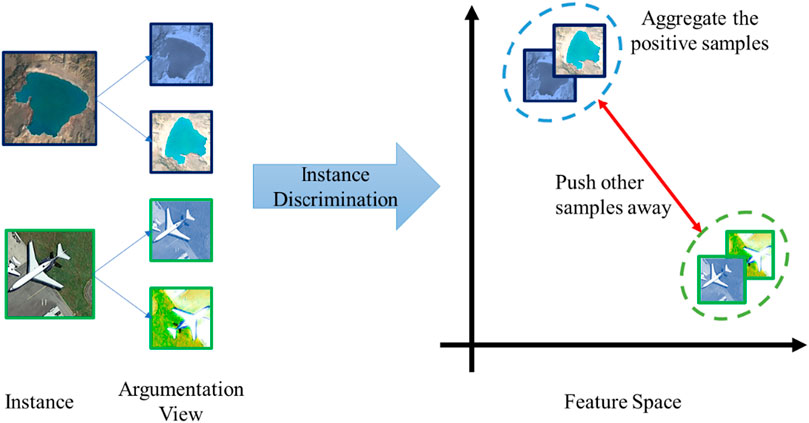
FIGURE 3. Understanding the instance discrimination task from the perspective of feature space.
2.3 Implementation of SSL on UFZ classification
As shown in Figure 4, the implementation of SSL on UFZ classification includes two steps: 1) learning useful knowledge via SSL, and 2) finetuning the pre-trained model to the UFZ classification domain via SL. In the first step, the model will be trained on large-scale unannotated RSIs to learn useful knowledge. In the second step, the model will be finetuned on a small-scale UFZ classification dataset with annotation to obtain a UFZ classification model.
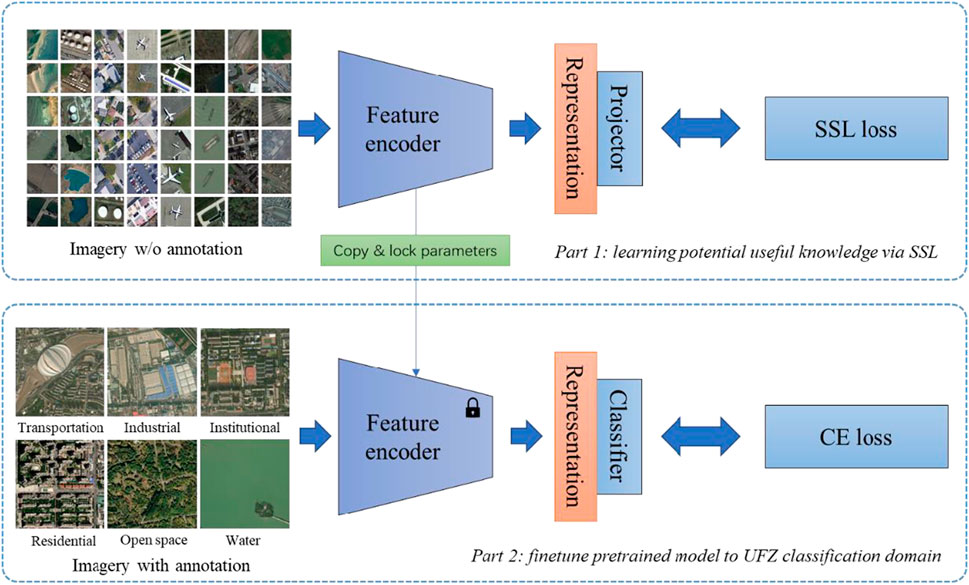
FIGURE 4. Flowchart of UFZ classification by SSL.
2.3.1 Learning potential useful knowledge via SSL
In this study, we use instance discrimination as the pretext task, as it can guide the model to learn the invariance of an image and the difference between two images (Chen et al., 2020).
We design a CNN that contains a visual feature encoder
1) Generation of positive samples: Randomly select a few unannotated data
2) Representation of argumentation views: represent the argumentation views in
3) Discrimination of instance: optimize
2.3.2 Finetune the pre-trained model to the UFZ classification domain
Finetuning the pre-trained model via SL is to use a small-scale annotated dataset to adjust some parameters of the pre-trained model. In this study, we use the collected UFZ classification dataset to finetune the pre-trained model to the UFZ classification domain through the following two steps:
1) Extracting useful features: randomly sample a mini batch of data
2) Finetuning the model by SL: randomly initialize a classifier
2.3.3 Implementation details
In the experiment, we use ResNet50 (He et al., 2016) as the backbone of the visual encoder
For model finetuning, we take a classifier with an FC layer. Mathematically, the classification process can be expressed by (Eq. 4).
3 Results
In quantitative evaluation, we use the Kappa coefficient (Kappa) and overall accuracy (OA) as the overall evaluation indexes and the producer accuracy (PA), user accuracy (UA), and F1 score (F1) as the evaluation indexes for each category. Table 2 shows the evaluation result of two initialization strategy with different numbers of finetuning samples. When 100% finetuning samples are used, the SSL method gains a better result than SL. The Kappa and OA increase by 2.4% and 2.1%, respectively. According to F1, the SSL method achieves the best results in 8 out of 10 categories. For both SSL and SL models, forests and water have an F1 value of above 0.9, due to the simple texture. Residential zones, transportations, open spaces, constructions, and agricultural lands are also visually distinguishable, so their F1 values are over 0.75. However, commercial, institutional, and industrial zones with strong social attributes are visually ambiguous, which are difficult to be accurately classified them using the visual characteristics provided by remote sensing images, so their F1 values are relatively low.
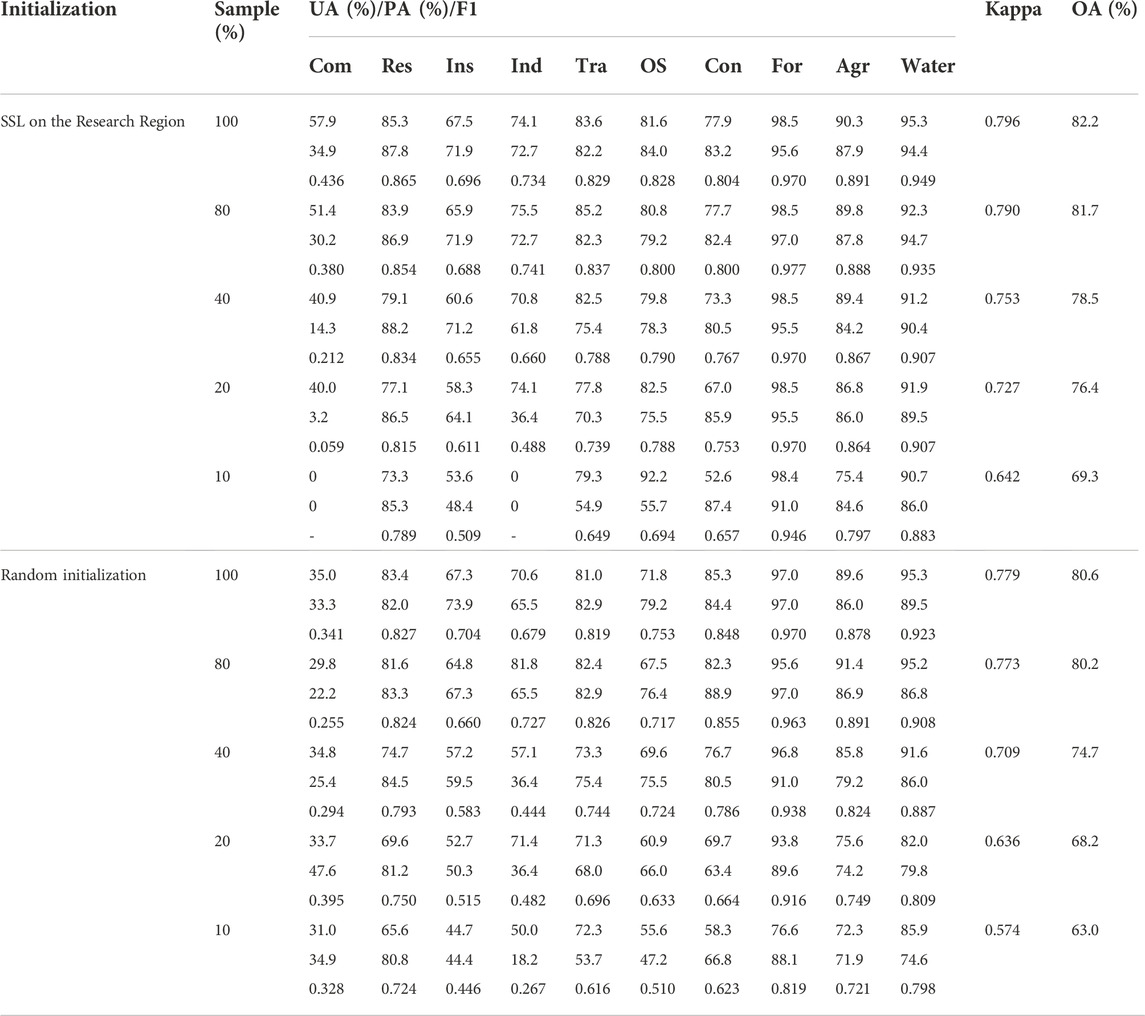
TABLE 2. Evaluation of the models using SSL initialization and random initialization using different percentage of finetune samples. Com: commercial, Res: residential, Ins: institutional, Ind: industrial, Tra: transportation, OS: open space, Con: construction, For: forest, Agr: agricultural.
Figure 5 shows the UFZ map predicted by two models. One model is initialized by SSL on the research region (SSL model) with 100% finetuning samples and another is randomly initialized (SL model) with 100% finetuning samples. We show four results in Figure 5, which intuitively demonstrate the superiority of the SSL model in UFZ classification. The comparison chart shows that SL is prone to misclassifying UFZs with visual homogeneity, such as open space, forest, residential zone and commercial zone. For example, in region A, the SSL model accurately identifies the area with forest trails as forest, while the SL model misclassifies it as an open space. A possible reason is that the SL model cannot distinguish between forest trails and park trails when the samples are limited, while the SSL model can distinguish between the two using many unlabeled samples.
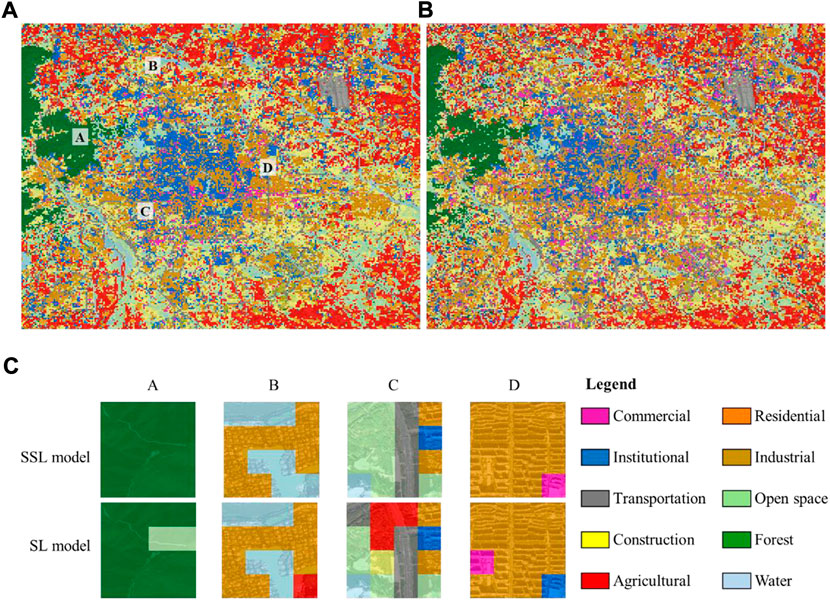
FIGURE 5. UFZ classification using 100% training samples. (A) UFZ map predicted by the SSL model; (B) UFZ map predicted by the SL model; (C) comparison result between the SSL model and the SL model.
3.1 The advantages of SSL in UFZ classification
To compare the performance of SSL and SL in UFZ classification, we carry out a set of experiments using 10%, 20%, 40%, 80%, and 100% training samples for finetuning, separately. The overall results are shown in Figure 6. For detailed qualitative evaluation, please refer to Table 2. Compared with the randomly initialized model (SL-based model), the model pretrained via SSL gains better results. Following are the advantages of SSL:
1) Using the same number of training samples, the SSL-based model achieves higher Kappa and OA than the SL-based model, and the fewer the training samples the more obvious the advantage. When 100% training samples are used for finetuning, the values of Kappa and OA of the SSL-based model are 2.1% and 2.0% higher than those of the SL-based model, respectively. When the samples reduce to 10%, the correspondence is 11.8% and 10.0%.
2) The SSL-based model achieves results comparable to or better than that got by the SL-based model but uses fewer samples. When the SSL-based model uses 10% (Kappa: 0.642; OA: 69.3%)and 20% (Kappa: 0.727; OA: 76.4%)samples for finetuning, the results are better than that got by SL-based models using 20% (Kappa: 0.636; OA: 68.2%)and 40% (Kappa: 0.709; OA: 74.7%)samples, respectively.
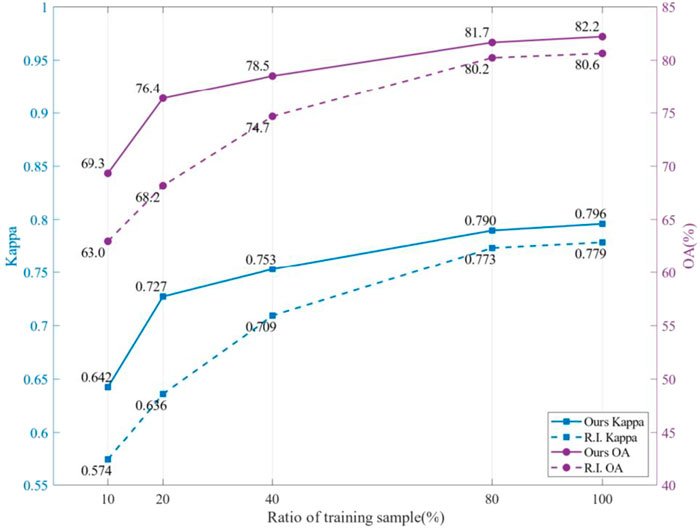
FIGURE 6. Results obtained using different ratio of training samples. R.I., random initialization.
3.2 Spatial patterns of the urban functional zones
As shown in the map in Figure 5, there are many institutional zones in downtown, like government buildings, universities, and research institutes, because this city is the cultural and political center of China. The residential zones rank the top ratio in the center city. In the suburb, there are large areas of forest, open space, and agricultural land. The construction regions between urban and suburban areas reflect the expansion of Beijing.
In this study, we analyze the spatial patterns of the UFZs in the research region. The location quotient (LQ) is used to evaluate the ratio of specialization of a region (Kolars and Haggett, 1967). LQ is calculated by Eq. 6, in which the area ratio of UFZ
When
The LQ based on ring roads (from the 2nd ring road to the 6th ring road) and administrative divisions (Xicheng, Dongcheng, Haidian, Chaoyang, Shijing, and Fengtai) is calculated and shown in Table 3 and Table 4.
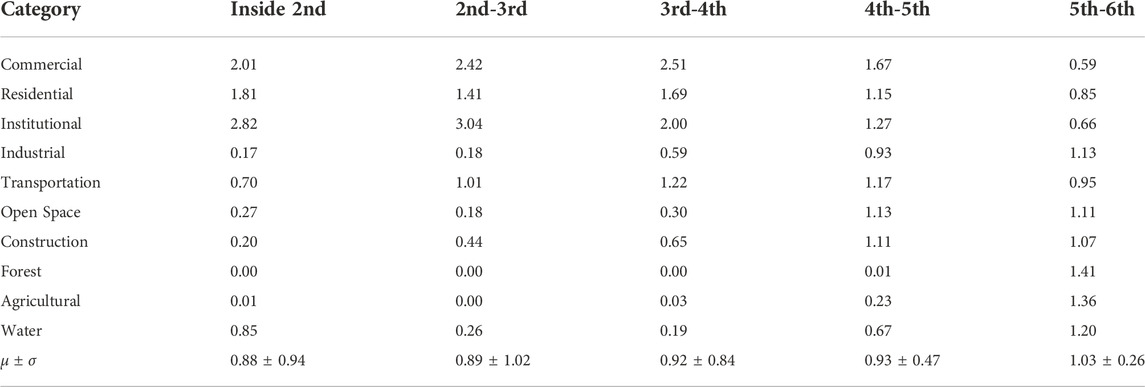
TABLE 3. Location quotient based on the ring road.

TABLE 4. Location quotient based on administrative district.
Commercial, residential, and institutional zones show different superiority in the regions divided by ring roads. The commercial zone shows high superiority inside the 5th ring road, the institutional zones are concentrated inside the 4th ring road, and the residential zones are prominent inside the 2nd and between the 3rd and 4th ring roads. Apart from the downtown, the superiority of the above functional zones reduces, and other UFZs increase.
From the perspective of administrative divisions, the commercial, residential, and institutional zones show superiority in the inner city (Xicheng and Dongcheng district). The forest shows superiority in the Haidian and Shijing districts, as they share the Western Hills National Forest Park. In Chaoyang and Fengtai districts, most kinds of UFZs are at the average level.
4 Discussion
4.1 The gap between benchmarks and practical application
As we mentioned in the Introduction, SSL has been investigated deeply using different data, but it is rarely used in practical applications like UFZ classification, and the gap between benchmarks and practical applications is also ignored. Here, we conducted an experiment, in which two ResNet50 models are pretrained by the sample generated from the research region and the sample in the AID (Xia et al., 2017) dataset via SSL separately, and finetuned by 100% annotated samples collected in the research region. Table 5 compares the performance of the two models.
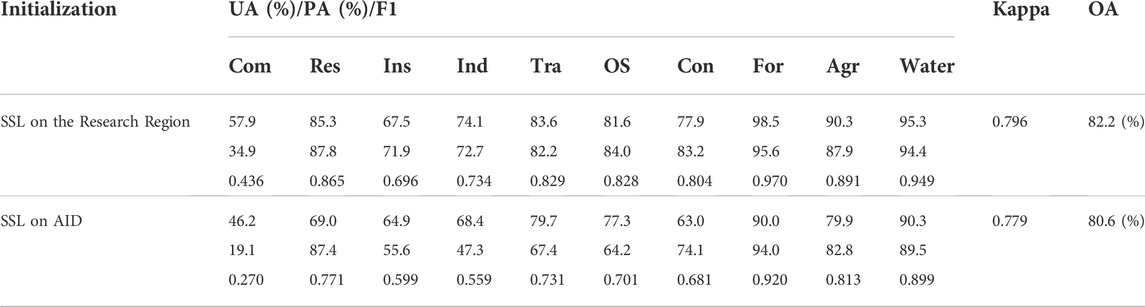
TABLE 5. Quantitative result of the models pretrained on the research region and AID.
Compared with the model pretrained on the AID, the model pretrained on the research region gains 15.9% and 12.0% higher Kappa and OA. The average F1 got by the research region based model was 19.2% higher than the other, with the maximum increase of 62% in commercial areas.
As shown in Figure 2, there are many patches in the dataset with incomplete objects, while in public datasets such as AID, samples are carefully selected that have higher visual discrimination and are easier for the model to capture its features. Figure 7 shows some samples misclassified by the AID pre-trained model. The objects are not in the center of the patches and some objects are incomplete. But they have been accurately classified by the research region pre-trained model. For example, airplanes are important objects for identifying the airport, but they are not at the center of patches in the practical samples, which leads misclassification. This conflicts the prior knowledge learned from the benchmark that objects used to determine the category of images should be in the image center.
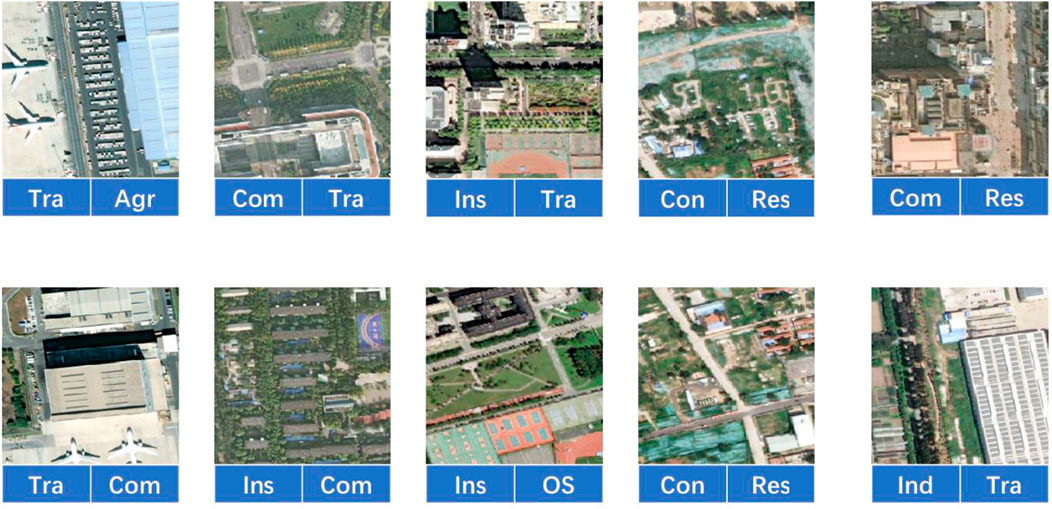
FIGURE 7. Samples misclassified by the model pretrained on AID. The texts at the bottom of each subfigure are the ground truth and the prediction. For example, the image in the left upper corner is for transportation, but it was misclassified as agricultural land. Com: commercial, Res: residential, Ins: institutional, Ind: industrial, Tra: transportation, OS: open space, Con: construction, For: forest, Agr: agricultural.
5 Conclusion
Current SL-based UFZ classification methods require a lot of training samples, which are not easy to acquire. Thus, this study conducts research on UFZ classification based on SSL. We collect 7304 typical UFZ samples as the finetuning and testing data and map the UFZ distribution inside the 6th ring road in Beijing. The experiment result proves that SSL gains better classification results than SL when the same number of training data is used and achieves comparable results to SL using half of the training samples. However, the classification accuracy of commercial, institutional, and industrial zones is still unsatisfying due to visual ambiguity. In addition, the comparison experiment between the model pretrained on the research region and that pretrained on the benchmark demonstrates the difficulties in the practical application of SSL. The displacement and incompleteness of objects in real data impact the performance of SSL models.
In the future, we will use social sensing data like geo-tagged photos, taxi trajectories, and points of interest as supplementary information for UFZ classification.
Data availability statement
The raw data supporting the conclusions of this article will be made available by the authors, without undue reservation.
Author contributions
WL: Data curation, Software, Visualization, Writing-Original draft preparation. JQ: Investigation and Reviewing. HF: Conceptualization, Methodology, Supervision, Editing.
Funding
This work was supported by the Inner Mongolia Science & Technology Plan (2022YFSJ0014).
Conflict of interest
The authors declare that the research was conducted in the absence of any commercial or financial relationships that could be construed as a potential conflict of interest.
Publisher’s note
All claims expressed in this article are solely those of the authors and do not necessarily represent those of their affiliated organizations, or those of the publisher, the editors and the reviewers. Any product that may be evaluated in this article, or claim that may be made by its manufacturer, is not guaranteed or endorsed by the publisher.
References
Bao, H., Ming, D., Guo, Y., Zhang, K., Zhou, K., and Du, S. (2020). DFCNN-based semantic recognition of urban functional zones by integrating remote sensing data and POI data. Remote Sens. (Basel). 12, 1088. doi:10.3390/rs12071088
Cao, R., Tu, W., Yang, C., Li, Q., Liu, J., Zhu, J., et al. (2020). Deep learning-based remote and social sensing data fusion for urban region function recognition. ISPRS J. Photogramm. Remote Sens. 163, 82–97. doi:10.1016/j.isprsjprs.2020.02.014
Castelluccio, M., Poggi, G., Sansone, C., and Verdoliva, L. (2015). Land use classification in remote sensing images by convolutional neural networks. arXiv preprint arXiv:1508.00092https://arxiv.org/abs/1508.00092 (Accessed August 01, 2015).
Chen, T., Kornblith, S., Norouzi, M., and Hinton, G. (2020). “A simple framework for contrastive learning of visual representations,” in Proceedings of the International Conference on Machine Learning (ICML) Proceedings of Machine Learning Research. (PMLR), 1597–1607, July 2020. Available at: http://proceedings.mlr.press/v119/chen20j.html (Accessed June 5, 2021).
Chen, W., Huang, H., Dong, J., Zhang, Y., Tian, Y., and Yang, Z. (2018). Social functional mapping of urban green space using remote sensing and social sensing data. ISPRS J. Photogramm. Remote Sens. 146, 436–452. doi:10.1016/j.isprsjprs.2018.10.010
Cheng, G., Han, J., and Lu, X. (2017). Remote sensing image scene classification: Benchmark and state of the art. Proc. IEEE 105, 1865–1883. doi:10.1109/jproc.2017.2675998
Cheng, G., Xie, X., Han, J., Guo, L., and Xia, G.-S. (2020). Remote sensing image scene classification meets deep learning: Challenges, methods, benchmarks, and opportunities. IEEE J. Sel. Top. Appl. Earth Obs. Remote Sens. 13, 3735–3756. doi:10.1109/JSTARS.2020.3005403
Cheng, G., Yang, C., Yao, X., Guo, L., and Han, J. (2018). When deep learning meets metric learning: Remote sensing image scene classification via learning discriminative CNNs. IEEE Trans. Geosci. Remote Sens. 56, 2811–2821. doi:10.1109/tgrs.2017.2783902
Dai, D., and Yang, W. (2010). Satellite image classification via two-layer sparse coding with biased image representation. IEEE Geosci. Remote Sens. Lett. 8, 173–176. doi:10.1109/lgrs.2010.2055033
Doersch, C., and Zisserman, A. (2017). “Multi-task self-supervised visual learning,” in Proceedings of the 2017 IEEE International Conference on Computer Vision (ICCV), Venice, Italy, October 2017 (IEEE). doi:10.1109/iccv.2017.226
Du, S., Du, S., Liu, B., and Zhang, X. (2019). Context-enabled extraction of large-scale urban functional zones from very-high-resolution images: A multiscale segmentation approach. Remote Sens. (Basel). 11, 1902. doi:10.3390/rs11161902
Du, S., Du, S., Liu, B., and Zhang, X. (2021). Mapping large-scale and fine-grained urban functional zones from VHR images using a multi-scale semantic segmentation network and object based approach. Remote Sens. Environ. 261, 112480. doi:10.1016/j.rse.2021.112480
Everingham, M., Van Gool, L., Williams, C. K. I., Winn, J., and Zisserman, A. (2010). The pascal visual object classes (VOC) challenge. Int. J. Comput. Vis. 88, 303–338. doi:10.1007/s11263-009-0275-4
He, K., Zhang, X., Ren, S., and Sun, J. (2016). “Deep residual learning for image recognition,” in Proceedings of the IEEE Computer Vision and Pattern Recognition (CVPR), Las Vegas, NV, USA, June 2016, 770–778.
Helber, P., Bischke, B., Dengel, A., and Borth, D. (2019). EuroSAT: A novel dataset and deep learning benchmark for land use and land cover classification. IEEE J. Sel. Top. Appl. Earth Obs. Remote Sens. 12, 2217–2226. doi:10.1109/JSTARS.2019.2918242
Hong, D., Hu, J., Yao, J., Chanussot, J., and Zhu, X. X. (2021). Multimodal remote sensing benchmark datasets for land cover classification with a shared and specific feature learning model. ISPRS J. Photogrammetry Remote Sens. 13, 68–80. doi:10.1016/j.isprsjprs.2021.05.011
Ioffe, S., and Szegedy, C. (2015). “Batch normalization: Accelerating deep network training by reducing internal covariate shift,” in Proceedings of the International Conference on Machine Learning, Guangzhou, China, July 2015.
Kang, Y., Cho, N., Yoon, J., Park, S., and Kim, J. (2021). Transfer learning of a deep learning model for exploring tourists’ urban image using geotagged photos. ISPRS Int. J. Geoinf. 10, 137. doi:10.3390/ijgi10030137
Kolars, J., and Haggett, P. (1967). Locational Analysis in human geography. Econ. Geogr. 43, 276. doi:10.2307/143300
Krizhevsky, A., Sutskever, I., and Hinton, G. E. (2012). “Imagenet classification with deep convolutional neural networks,” in Proceedings of the Advances in neural information processing systems, Lake Tahoe, NV, USA., December 2012, 1097–1105.
Li, H., Li, Y., Zhang, G., Liu, R., Huang, H., Zhu, Q., et al. (2022). Global and local contrastive self-supervised learning for semantic segmentation of HR remote sensing images. IEEE Trans. Geosci. Remote Sens. 60, 1–14. doi:10.1109/TGRS.2022.3147513
Liu, B. H., Deng, Y. B., Li, M., Yang, J., and Liu, T. (2021). Classification schemes and identification methods for urban functional zone: A review of recent papers. Appl. Sci. (Basel). 11, 9968. doi:10.3390/app11219968
Liu, H. M., Xu, Y. Y., Tang, J. B., Deng, M., Huang, J. C., Yang, W. T., et al. (2020). Recognizing urban functional zones by a hierarchical fusion method considering landscape features and human activities. Trans. Gis 24, 1359–1381. doi:10.1111/tgis.12642
Liu, Q., Hang, R., Song, H., and Li, Z. (2017). Learning multiscale deep features for high-resolution satellite image scene classification. IEEE Trans. Geosci. Remote Sens. 56, 117–126. doi:10.1109/tgrs.2017.2743243
Lu, W., Tao, C., Li, H., Qi, J., and Li, Y. (2022). A unified deep learning framework for urban functional zone extraction based on multi-source heterogeneous data. Remote Sens. Environ. 270, 112830. doi:10.1016/j.rse.2021.112830
Luo, B., Jiang, S., and Zhang, L. (2013). Indexing of remote sensing images with different resolutions by multiple features. IEEE J. Sel. Top. Appl. Earth Obs. Remote Sens. 6, 1899–1912. doi:10.1109/JSTARS.2012.2228254
Ma, L., Li, M., Ma, X., Cheng, L., Du, P., and Liu, Y. (2017). A review of supervised object-based land-cover image classification. ISPRS J. Photogramm. Remote Sens. 130, 277–293. doi:10.1016/j.isprsjprs.2017.06.001
Schmarje, L., Santarossa, M., Schröder, S. M., and Koch, R. (2021). A survey on semi-self- and unsupervised learning for image classification. IEEE Access 9, 82146–82168. doi:10.1109/ACCESS.2021.3084358
Stojnic, V., and Risojevic, V. (2021). “Self-supervised learning of remote sensing scene representations using contrastive multiview coding,” in Proceedings of the 2021 IEEE/CVF Conference on Computer Vision and Pattern Recognition Workshops (CVPRW), Nashville, TN, USA, June 2021 (IEEE), 1182–1191. doi:10.1109/cvprw53098.2021.00129
Szegedy, C., Vanhoucke, V., Ioffe, S., Shlens, J., and Wojna, Z. (2016). “Rethinking the inception architecture for computer vision,” in Proceedings of the IEEE conference on computer vision and pattern recognition, Las Vegas, NV, USA, June 2016, 2818–2826.
Tao, C., Qi, J., Lu, W., Wang, H., and Li, H. (2020). Remote sensing image scene classification with self-supervised paradigm under limited labeled samples. IEEE Geosci. Remote Sens. Lett. 1, 1–5. doi:10.1109/LGRS.2020.3038420
Tao, C., Qi, J., Lu, W., Wang, H., and Li, H. (2022). Remote sensing image scene classification with self-supervised paradigm under limited labeled samples. IEEE Geosci. Remote Sens. Lett. 19, 1–5. doi:10.1109/lgrs.2020.3038420
Tao, C., Yin, Z., Zhu, Q., and Li, H. (2021). Remote sensing image intelligent interpretation: From supervised learning to self-supervised learning. Acta Geod. Cartogr. Sinica 50, 1122–1134.
Wang, Q., Liu, S., Chanussot, J., and Li, X. (2018). Scene classification with recurrent attention of VHR remote sensing images. IEEE Trans. Geosci. Remote Sens. 57, 1155–1167. doi:10.1109/tgrs.2018.2864987
Wang, X., Zhang, S., Yu, Z., Feng, L., and Zhang, W. (2020). “Scale-equalizing pyramid convolution for object detection,” in Proceedings of the IEEE/CVF Conference on Computer Vision and Pattern Recognition, Seattle, WA, USA, June 2020, 13359–13368.
Xia, G. S., Hu, J. W., Hu, F., Shi, B. G., Bai, X., Zhong, Y. F., et al. (2017). Aid: A benchmark data set for performance evaluation of aerial scene classification. IEEE Trans. Geosci. Remote Sens. 55, 3965–3981. doi:10.1109/tgrs.2017.2685945
Xu, S., Qing, L., Han, L., Liu, M., Peng, Y., and Shen, L. (2020). A new remote sensing images and point-of-interest fused (RPF) model for sensing urban functional regions. Remote Sens. (Basel). 12, 1032. doi:10.3390/rs12061032
Yang, X., He, X., Liang, Y., Yang, Y., Zhang, S., and Xie, P. (2020). Transfer learning or self-supervised learning? A tale of two pretraining paradigms. arXiv:2007.04234 [cs, stat]. Available at: http://arxiv.org/abs/2007.04234 (Accessed September 19, 2021).
Yin, J., Dong, J., Hamm, N. A. S., Li, Z., Wang, J., Xing, H., et al. (2021a). Integrating remote sensing and geospatial big data for urban land use mapping: A review. Int. J. Appl. Earth Observation Geoinformation 103, 102514. doi:10.1016/j.jag.2021.102514
Yin, J., Fu, P., Hamm, N. A. S., Li, Z., You, N., He, Y., et al. (2021b). Decision-level and feature-level integration of remote sensing and geospatial big data for urban land use mapping. Remote Sens. 13, 1579. doi:10.3390/rs13081579
Yu, Y., Li, X., and Liu, F. (2020). Attention GANs: Unsupervised deep feature learning for aerial scene classification. IEEE Trans. Geosci. Remote Sens. 58, 519–531. doi:10.1109/tgrs.2019.2937830
Zhang, X., Du, S., and Wang, Q. (2017). Hierarchical semantic cognition for urban functional zones with VHR satellite images and POI data. ISPRS J. Photogramm. Remote Sens. 132, 170–184. doi:10.1016/j.isprsjprs.2017.09.007
Zhang, X., Du, S., and Wang, Q. (2018). Integrating bottom-up classification and top-down feedback for improving urban land-cover and functional-zone mapping. Remote Sens. Environ. 212, 231–248. doi:10.1016/j.rse.2018.05.006
Zhang, X., Du, S., and Zheng, Z. (2020). Heuristic sample learning for complex urban scenes: Application to urban functional-zone mapping with VHR images and POI data. ISPRS J. Photogramm. Remote Sens. 161, 1–12. doi:10.1016/j.isprsjprs.2020.01.005
Zhao, Z., Luo, Z., Li, J., Chen, C., and Piao, Y. (2020). When self-supervised learning meets scene classification: Remote sensing scene classification based on a multitask learning framework. Remote Sens. 12, 3276. doi:10.3390/rs12203276
Zhou, W., Ming, D., Lv, X., Zhou, K., Bao, H., and Hong, Z. (2020). SO–CNN based urban functional zone fine division with VHR remote sensing image. Remote Sens. Environ. 236, 111458. doi:10.1016/j.rse.2019.111458
Zhu, Q., Zhong, Y., and Zhang, L. (2014). “Multi-feature probability topic scene classifier for high spatial resolution remote sensing imagery,” in Proceedings of the IEEE International Geoscience and Remote Sensing Symposium (IGARSS), Quebec City, QC, Canada, July 2014, 1–4. doi:10.1109/IGARSS.2014.6947071
Keywords: self-supervised learning, urban functional zone, remote sensing, deep learning, image classification
Citation: Lu W, Qi J and Feng H (2022) Urban functional zone classification based on self-supervised learning: A case study in Beijing, China. Front. Environ. Sci. 10:1010630. doi: 10.3389/fenvs.2022.1010630
Received: 03 August 2022; Accepted: 07 November 2022;
Published: 17 November 2022.
Edited by:
Penghai Wu, Anhui University, ChinaReviewed by:
Junli Li, Anhui Agricultural University, ChinaGuojie Wang, Nanjing University of Information Science and Technology, China
Copyright © 2022 Lu, Qi and Feng. This is an open-access article distributed under the terms of the Creative Commons Attribution License (CC BY). The use, distribution or reproduction in other forums is permitted, provided the original author(s) and the copyright owner(s) are credited and that the original publication in this journal is cited, in accordance with accepted academic practice. No use, distribution or reproduction is permitted which does not comply with these terms.
*Correspondence: Huihui Feng, aGhmZW5nQGNzdS5lZHUuY24=