
95% of researchers rate our articles as excellent or good
Learn more about the work of our research integrity team to safeguard the quality of each article we publish.
Find out more
REVIEW article
Front. Environ. Sci. , 15 December 2022
Sec. Atmosphere and Climate
Volume 10 - 2022 | https://doi.org/10.3389/fenvs.2022.1007942
This article is part of the Research Topic Anthropogenic Trace Gases and their Linkages to Meteorology and Climate Change View all 8 articles
 Surat Dewan
 Anita Lakhani*
Climate change plus ozone pollution is a lethal combination that adversely affects human health, agriculture productivity, ecosystems, and the world economy. Currently, there is a growing concern that climate change may aggravate ozone pollution even after reducing anthropogenic precursor source activities. Part of it may be due to temperature-enhanced natural precursor emissions of ozone, increased stratospheric–tropospheric exchange of ozone, more frequent periods with meteorologically stagnant conditions favouring pollution build-up, changes in wetland methane emissions, and enhanced concentrations of atmospheric carbon dioxide. The quantification of climate change and ozone levels involves complex chemical, radiative, biogenic, and transport processes and feedback that are difficult to fully comprehend. Further, the fact that ozone is a short-lived climate forcer and a potent greenhouse gas provides a feedback loop and makes climate-ozone links even more multifaceted. This review examines the up-to-date understanding of the processes regulating tropospheric ozone from regional to global scales and the associated climate connections. We explore the recent findings in ozone precursor emissions from natural sources, ozone formation chemistry, its transport on hemispheric scales, future plausible ozone concentrations in different shared socioeconomic pathways, and changes in the radiative forcing of ozone. The review demonstrates the challenges and limitations associated with climate-ozone linkages and their incorporation in models, which are due to uncertainties in magnitude and signs of projected precursor emissions in response to future climate change and also due to the difference in models.
Climate and air quality are inseparably linked. Air pollutants like ozone and particulate matter interact with long-wave and short-wave radiations and disturb the energy balance of the Earth, contributing to climate change. Climate change in turn influences these pollutants by altering the frequency, severity, and duration of heat waves, air stagnation events, precipitation, anticyclonic conditions, air pollution meteorology (ventilation and dilution), and other removal processes (Fiore et al., 2015; Doherty et al., 2017). Climate change can induce magnifying responses in atmospheric chemistry, emissions from anthropogenic and natural sources of these pollutants, and also impacts their long-range transport. This paper focuses on how climate change impacts the emissions and dynamics of tropospheric O3 and its natural precursors.
Ozone is one of the most significant trace gases in the atmosphere. It is a strong oxidant, a short-lived climate forcer (SLCF), and an important greenhouse gas (IPCC Pörtner et al., 2022). In the stratosphere, ozone plays an important role in protecting us from harmful ultraviolet radiation. However, in the troposphere, ozone is a pollutant that is detrimental to human health, crops, and ecosystems (Monks et al., 2015).
Both short-term and long-term exposure to ozone is associated with increased mortality due to respiratory and cardiovascular diseases. Ozone-related deaths are assessed to be 5–20% of all those associated with air pollution (Anenberg et al., 2009; Silva et al., 2013; Lin et al., 2018). Moreover, tropospheric ozone (O3) is a well-known phytotoxin that has an adverse impact on natural vegetation and crops (Feng et al., 2020). Different crop yield metrics have been used extensively to evaluate global yield losses due to present-day O3 concentrations, which are estimated to be 2–16% for the four major staple crops (wheat, rice, maize, and soya bean; (Ainsworth, 2017). Associated economic losses due to ozone pollution are estimated to be 32 billion in China alone (Xu, 2021).
Ozone in the troposphere is formed by photochemical reactions involving sunlight and ozone precursor gases including nitrogen oxides (NOx) and methane, carbon monoxide (CO), and non-methane volatile organic compounds (NMVOC; (Kinney, 2018), (Jacob, 2000)). These precursors originate from natural sources including wetland methane emissions, wildfires, biogenic hydrocarbon emissions, lightning NOx, and NOx emitted from soils, but also anthropogenic activities like fossil fuel combustion in power plants, industrial activities, transportation, or crop burning. The Sustainable Development Goals are pressing nations to impose emission reductions and curb fossil fuel emissions. In such a scenario, the emission of natural ozone precursors will gain increasing importance in regulating future ozone concentrations (Cai et al., 2021).
The amount of O3 produced is dependent on precursor concentrations and can be categorized into photochemical regimes such as NOx-limited or VOC-limited. In NOx-limited regimes, ozone increases with increasing NOx and exhibits only slight sensitivity to VOC whereas in a VOC-limited regime reduction in VOC emissions can result in decreases in O3 levels, but NOx reduction has a weak effect or may even increase ozone levels (Sillman and He, 2002). O3 formation in polluted urban areas is usually reported as VOC-limited, while that in rural areas falls in NOx-limited. Besides these two regimes, a third regime is gaining importance in which the reactive uptake of hydroperoxyl radicals onto aerosol particles suppresses the surface ozone concentrations and inhibits its formation (Ivatt et al., 2022). Peroxyacetyl nitrate (PAN) is a significant reservoir of NOx, with a lifetime of almost a month in the free troposphere, and its transport at an intercontinental distance allows O3 production to occur far away from its source (Jiang et al., 2016).
Changes in meteorology and climate impact O3 levels by affecting natural emissions of its precursors like NOx from the soil, lightning, and biogenic volatile organic compounds (BVOCs). The rise in ambient temperature can accelerate the emission rate of BVOCs and soil NOx (Sha et al., 2021). The dominant mechanism of ozone formation in the upper troposphere is lightning-induced nitrogen oxides (NOx) which are affected by increasing temperatures (Verma et al., 2021). The growth in wetland methane emissions can be a major driver for increases in background ozone in the coming years. Wetland methane emissions are also sensitive to elevated temperatures and CO2 concentrations (Shindell et al., 2004).
In the troposphere, the lifetime of ozone ranges from a few hours in polluted urban areas to up to a few months in the upper troposphere. The global mean lifetime of ozone for the present day is estimated to be around 25 days, making its transfer possible not only on regional but also over intercontinental scales (IPCC Pörtner et al., 2022). Long-range and regional transport of ozone can also upsurge local O3 levels (Yang et al., 2022). Variations in stratosphere troposphere exchange (STE) and large-scale climate patterns such as the El Niño–Southern Oscillation (ENSO), North Atlantic Oscillation (NAO), and Arctic Oscillation (AO) have substantial impacts on present-day ozone distribution and ozone projections in emerging years (Albers et al., 2022; Yang et al., 2022). Planetary boundary layer (PBL) growth plays a critical role in the development of elevated O3 episodes. especially when there is no pollutant transport from a long distance. Studies report the downward transport of ozone from high ozone concentration layers with boundary layer development in the morning and afternoon and this has been found to aggravate near-surface ozone pollution (Dey, 2018; He et al., 2021).
High ozone concentrations are typically associated with hot, dry, stagnant conditions as the formation and persistence of O3 is favoured (Zhan and Xie, 2022). Studies have demonstrated ozone extremes frequently appear during drought besides heat waves and at times this coincidence is due to specific synoptic patterns. Heightened periods of air mass stagnation and rising temperatures in the future would lead to increased O3 concentrations (Li et al., 2020). Increased water vapour and precipitation in a changing climate are expected to decrease ozone concentrations (Sekiya and Sudo, 2012).
To combat ozone pollution efforts have been made to cut anthropogenic emissions of ozone precursors NOx and VOCs. However, the reductions at local and regional levels of the emissions of pollutants do not always imply a decrease in the concentrations of other pollutants as the processes linking emissions and air quality are interconnected and quite complex (Li et al., 2013). It has been reported that a 40% reduction in particulate matter concentrations was partially responsible for a 1–3 ppb increase in ozone levels in eastern China (Zhang et al., 2019).
Ozone interacts with long-wave and short-wave radiation and perturbs the earth’s radiative balance contributing to climate change. Climate change in turn affects natural sources, chemistry, and transport of ozone and its precursors. Short-term climate variability alters the long-range transport pathways that channel ozone plumes on a regional and intercontinental scale (Mann, 2021).
Stringent air quality improvement measures in various countries have resulted in the decrease of anthropogenic precursor emissions in many regions. In such a scenario role of biogenic precursors in regulating ozone levels may become more significant. Thus, it is important to examine the impact of climate change on natural emission sources of ozone along with the effect on photochemistry, transport, and changes in synoptic-scale meteorology. This has important consequences for future ozone projection in the context of climate change.
Ozone is found both in the stratosphere and troposphere. Around 90% of ozone is found in the stratosphere mainly in the ozone layer (∼between 8 and 15 km above the ground). There is a natural transport of ozone from the stratosphere to the troposphere that was earlier considered the primary source of tropospheric ozone (Archibald et al., 2020a). This transport contributes to background levels of ground-level ozone in the troposphere but ozone is also produced photochemically throughout the troposphere. Present-day estimates state that photochemistry is the main source of ozone in the troposphere, exceeding the flux from the stratosphere by factors of 7–15 (Cooper et al., 2014).
It is well known that the photolysis of NO2 is the fundamental reaction leading to the formation of tropospheric ozone (R1, R2). Once formed ozone reacts with NO present in the atmosphere to regenerate NO2 (R3).
NO2 + hν (λ< 424 nm) → NO + O (3P) R1 (Ivatt et al., 2022)
O(3P) + O2 + M → O3 R2 (Ivatt et al., 2022)
NO + O3 → NO2 + O2 R3 (Ivatt et al., 2022)
The net ozone production occurs due to the presence of VOCs viz CO, CH4, and other hydrocarbons, which are oxidized by OH radicals to produce hydroperoxyl and organic peroxy radicals (R4, R5). These radicals are the main intermediates in tropospheric ozone production as they provide an additional pathway to convert NO to NO2 without destroying ozone (Archibald et al., 2020a).
CO + OH(+O2) → CO2 + HO2 R4 (Ivatt et al., 2022)
RH + OH(+O2) → RO2 + HO2 R5 (Jacob, 2000)
HO2 + NO → NO2 + OH R6 (Ivatt et al., 2022)
The chain termination can occur either through the self-reaction of peroxyl radicals to form longer-lived species (such as peroxides, R7) or from the reaction of hydroxyl radicals with nitrogen dioxide (NO2) to form nitric acid (R8).
OH2 +OH2+ M → H2O2 + O2 R7 (Jacob, 2000)
OH +NO2+ M → HNO3 + M R8 (Jacob, 2000)
The controlling chain termination step differentiates regions into either “NOx limited” (peroxyl-radical self-reactions dominate) or ‘VOC limited’ (hydroxyl radical + nitrogen dioxide reaction dominates; (Thornton et al., 2002)). For reducing O3 pollution, the dominant termination step is frequently used to identify whether reductions in the emissions of NOx or VOCs should be preferentially employed. If peroxyl-radical self-reactions dominate (known as the ‘NOx limited’ regime), reductions in NOx emissions are most beneficial, whereas if the NO2+OH reaction dominates (known as the “VOC limited” regime) reductions in organic emissions are most effective (Figure 1).
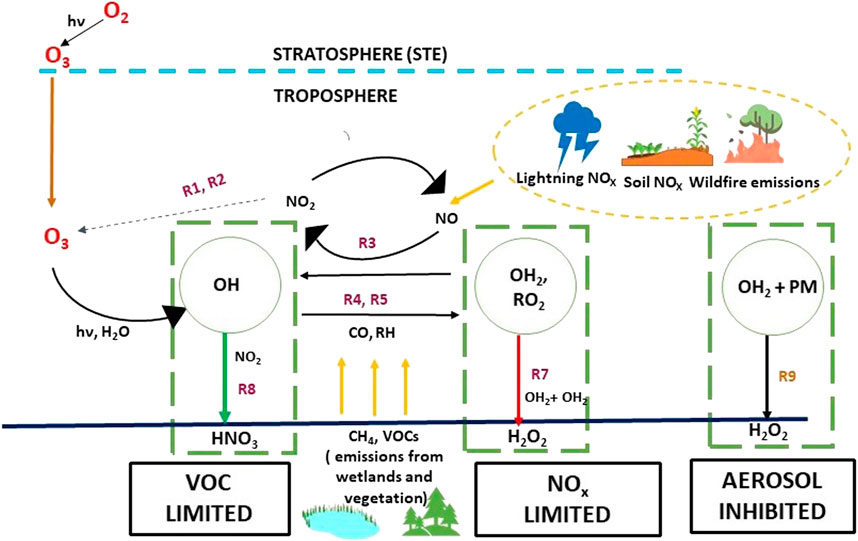
FIGURE 1. Shows a simplified view of the reactions occurring in the HOx-NOx cycle and the three possible regimes according to the dominant chain-terminating step.
Recent studies using the chemical transport model show that a third aerosol-inhibited regime exists especially in large regions of India and China where the presence of aerosols inhibits ozone formation on short photochemical timescales (Archibald et al., 2020a). In this regime reactive uptake of hydroperoxyl radicals onto aerosol particles dominates the chain termination step and the presence of aerosol inhibits ozone formation (Xu et al., 2012; Ivatt et al., 2022). Xu et al. reported that the HO2 heterogeneous reaction decreased O3 to 33 ppb in Beijing during summer.
HO2 + PM → 0.5H2O2 R9 (Xu et al., 2012)
The HO2 reaction with aerosols would terminate the HOx cycle limiting ozone formation via NOx. The uptake coefficient of hydroperoxyl radical on aerosol is affected by relative humidity and aerosol composition. The overall impact of change in aerosol concentration on ozone levels is complex as it depends on several other processes besides photochemical reactions. Li et al. report a decrease in PM2.5 was a chief factor driving the increase in ozone in China due to the role of PM2.5 as a scavenger of hydroperoxyl (HO2) radical (Li et al., 2020).
PAN is the principal reservoir species for NOx in the troposphere. The OH reaction with acetaldehyde is the most important way to form PAN globally (Archibald et al., 2020a). The peroxyacetyl radical, CH3C(O)OO, reacts with NO2 to form PAN. PAN is a thermally unstable compound; its lifetime depends on the temperature. At higher temperatures, the PAN lifetime becomes shorter and the decomposition of PAN into peroxy acetyl radicals (CH3C(O)O2) and NO2 is more rapid.
Therefore, at high temperatures, PAN becomes a source of NOx rather than a reservoir of NOx. This may then lead to an increase in the rate of ozone production (Archibald et al., 2020b; Zhang et al., 2021). Kotchenruther et al., and Liu et al. have shown that the thermal decomposition of PAN plays a crucial role in determining ozone concentrations (Kotchenruther et al., 2001; Liu et al., 2021). The lifetime of PAN against thermal decomposition is about 2 h at a typical NO2/NO ratio of ∼7 and ambient temperature of 25°C but it rises rapidly with the decrease of temperature, approximately five times every 10°C, extending it to over a month in the mid-troposphere (Liu et al., 2021). At the temperature of the upper troposphere, PAN acts as the main reservoir for short-lived NOx, and thus facilitates the transport and release of NOx to remote regions (Sun et al., 2021), with important implications for global O3 distribution.
Natural emissions of ozone precursors from the surface significantly impact ozone levels (Archibald et al., 2020a). Climate-related changes in lightning NOx emissions, soil NOx, wetland methane emissions, biogenic volatile organic compound emissions, and wildfire emissions content are significant drivers of future tropospheric ozone changes, affecting its chemical production and loss processes. In this section, we summarise the recent studies on the effect of climate change on these ozone precursor emissions by natural systems.
NOx is formed as a by-product of nitrification and denitrification, two microbial processes that occur in many natural and agricultural ecosystems. Nitrogen oxides emitted from soils contribute 10–15% of global NOx emissions (Weng et al., 2020). Weng et al. reported global total above-canopy soil NOx emissions to be 3.3–10 Tg N/yr in bottom-up studies and at 7.9–16.8 Tg N/yr for satellite-based top-down studies (Weng et al., 2020). Lu et al. suggest that moisture, soil texture, temperature, nutrient availability, fertilizer application time and method, type of vegetation, and ecosystem affect NOx emissions from soils (Lu et al., 2019; Lu et al., 2021). With control of anthropogenic emissions of NOx in the future, SNOx may play an important role in increasing ozone levels, particularly in a changing climate. Geddes et al. reported SNOx emissions to make up ∼25% of summertime NOx emissions in the United States in the “low” anthropogenic NOx emission scenario (Geddes et al., 2022).
Romer et al. reported the ozone enhancements on hotter days and evaluated that SNOx emissions are accountable for almost half of the 2.3 ppb/°C increase in O3 production rates with ambient temperatures in the southeast United States (Romer et al., 2018). This can be attributed to temperature-enhanced SNOx emissions most probably by soil microbes. Enzymatic activity increases with rising temperatures and a 40% increase in nitrogen fixation are expected in comparison to 2000 (IPCC Pörtner et al., 2022).
In ecosystems with broadly variable temperatures, NOx emissions may be affected by temperature mainly during periods of optimal soil moisture and high inorganic nitrogen concentrations. SNOx can increase by 38% on average as the soil temperature increase from 30–35°C to 35–40°C (Sha et al., 2021). SNOx emission perturbations lead to changes in O3 that are more regional.
Lu et al. reported presence of soil NOx emissions in China significantly reduced the sensitivity of ozone to anthropogenic emissions. The study reported that the control of all domestic anthropogenic air pollutants to achieve maximum improvement in air quality decreased by 30% due to the presence of SNOx (Lu et al., 2021). Sha et al. estimated that 40.1% of total NOx emissions in California were from soils, and SNOx significantly increased the monthly mean NO2 columns by 34.7% and surface NO2 concentrations by 176.5%, which led to an additional 23.0% of surface O3 concentration in California (Sha et al., 2021).
SNOx emissions are also likely to be controlled by changes in precipitation patterns and trans-evaporative fluxes (Lu et al., 2021; IPCC Pörtner et al., 2022). These SNOx emissions are usually estimated through non-linear parameterization which is sensitive to the horizontal resolutions of inputted meteorological and ancillary data. Weng et al. in a sensitivity test study estimated that a 1°C increase in temperature would lead to a 5.2% increase in the calculated global total SNOx emission, a 10% increase in soil moisture would lead to a 15.8% decrease in emission, and a 10% increase in leaf a would lead to 1% decrease in emission (Weng et al., 2020).
It is evident that SNOx emissions will increasingly contribute to high O3 episodes possibly changing with agricultural phenology, land management, precipitation or soil wetness, and temperature but suitable representations of SNOx and how it escapes from the canopy are still lacking in models to provide quantitative evaluations of climate-driven changes in SNOx (Lu et al., 2021).
Lightning contributes ∼10% of the total NOx emissions and is the key source of NOx in the middle to upper troposphere. Globally lightning generates NOx equivalent to 2–8 Tg N/yr (Kang et al., 2020). During lightning, high temperatures result in the dissociation of O2 to form O atoms. This initiates the production of NO through R10-R12.
O2 → O+ O R10 (Chameides, 1986)
O + N2 → NO + N R11 (Chameides, 1986)
N +O2 → NO + O R12 (Chameides, 1986)
During the interconversion of NO and NO2, ozone is formed in presence of hydroxy and peroxy radicals as discussed in the earlier section. Ozone can undergo photodissociation and react with water vapour to generate hydroxyl radicals (Bucsela et al., 2019). The OH radical formed is a strong oxidant that can decrease the lifetime of CH4 which can reduce ozone levels. It is estimated that LNOx is responsible for 35–45% of global free-tropospheric ozone production (Zhang et al., 2022a).
The impact of lightning is strong in the middle and upper part of the troposphere as in this region NOx has a lifetime of 5–10 times longer than the ∼1-day lifetime in the lower troposphere. Ozone production ensues at rates of up to 10 ppbv per day in the lightning-enhanced convective outflow plumes of ozone precursors. In the upper troposphere, the lightning source dominates, and estimates report LNOx accounts for 60–70% of free-tropospheric NOx (Bucsela et al., 2010). Ozone is the third most significant greenhouse gas, and ozone enhancements near the tropopause have the greatest effect on its radiative forcing. Therefore, additional ozone produced downwind of thunderstorm events is particularly effective in climate forcing (Bucsela et al., 2019).
The average value of LNOx produced was estimated to be 180 ± 100 mol per lightning flash (Bucsela et al., 2019). LNOx is thought to be the most important natural ozone precursor in the tropics because it is released in the middle to upper troposphere where the lifetime of ozone is long and its production efficiency per unit NOx is high. In the tropics contribution from biomass burning source of NOx (0.51 Tg N/yr) is greater than that from lightning 0.37 Tg N/yr), but lightning exerts a more significant role in interannual variability for tropospheric columns of ozone in the tropics as the ozone production efficiency is higher per unit NOx from lightning (Murray et al., 2013). Finney et al. reported the ozone production efficiency from LNOx to be 6.5 ± 4.7 times in comparison to surface NOx sources (Finney et al., 2016a).
Studies suggest that simulated responses of LNOx with temperature highly depend on lightning parameterization. Lightning flash densities can be simulated based on several parameterizations like the cloud top height approach, upward mass flux, and cloud ice flux. A 5–16% increase in lightning flashes per degree increase in global mean surface temperature has been estimated in recent studies (Finney et al., 2018) and LNOx emission climate response of +0.44 Tg N/K has been found using the cloud top height approach by Finney et al. (Finney et al., 2016a). Other models put estimates at +0.14 (using updraft mass flux within the cloud and cloud depth) and −0.55 Tg N/K (using updraft mass flux at 440 hPa; 49). The ice flux approach improves the simulation of lightning and the temporal correlations with ozone sonde measurements in the middle and upper troposphere. Studies using parameterizations based on the ice flux approach show a reduced amount of sensitivity or negative response to NOx emissions. In the tropical upper troposphere, a reduction in ozone concentration of around 5–10% has been estimated (Finney et al., 2016b; Verma et al., 2021).
LNOx plays a significant role in ozone chemistry and there is high confidence that LNOx is disturbed by climate change still there is little confidence in the sign of the change due to basic uncertainties in the parameterization of lightning in the models (Fu and Tian, 2019; Verma et al., 2021).
VOCs are important ozone precursors. Biogenic volatile organic compounds are released by vegetation with the main compounds being isoprene (2-methyl-1,3-butadiene) and monoterpenes but sesquiterpenes, alkenes, alcohols, aldehydes, and ketones are also present (Figure 2). These BVOCs undergo photooxidation and play a key role in atmospheric composition (Yáñez-Serrano et al., 2020; Weber et al., 2022). They influence the radiative forcing by controlling tropospheric ozone formation or by increasing the lifetime of methane by suppressing its major sink, the OH radical (Thornhill et al., 2021). Racherla et al. showed that higher isoprene levels account for 50–60% of the increased summertime ozone episodes in the future climate simulation in the eastern United States (Racherla and Adams, 2008). The production of secondary aerosols like sulphate and nitrate particles whose formation rates depend upon the availability of oxidants is influenced by BVOCs (Unger, 2014).
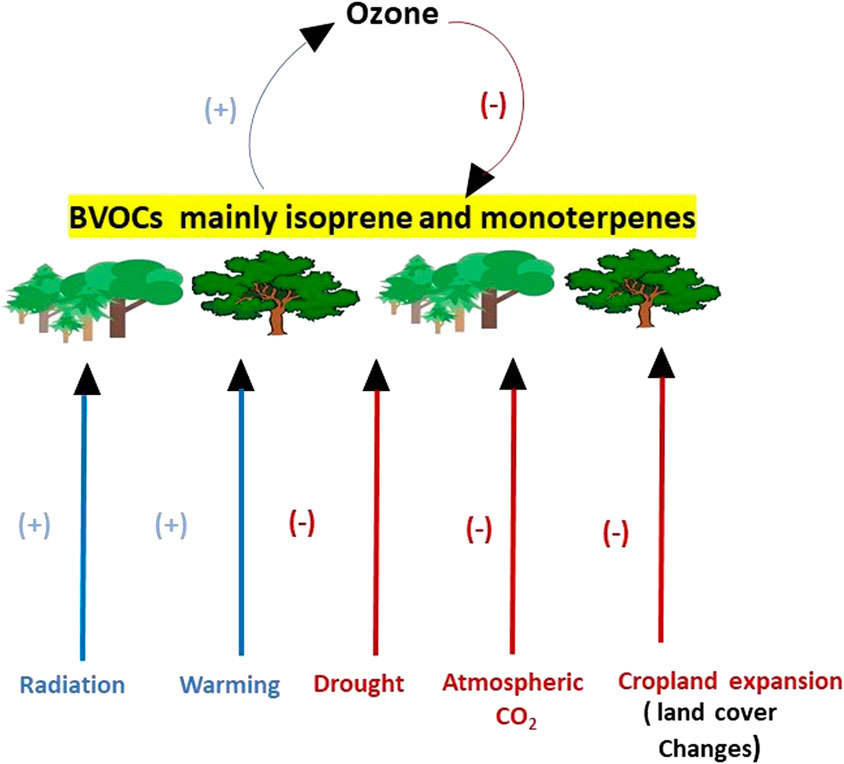
FIGURE 2. Shows BVOC emissions are sensitive to climate change, atmospheric CO2 concentrations, and land cover changes. Isoprene (the most widely emitted BVOC) responds negatively to elevated O3, drought, elevated CO2, and land cover changes and positively to global warming. The red + sign/line indicates an increase and the blue–sign/line indicates a decrease. An increase in isoprene emissions would enhance surface ozone levels. Elevated ozone decreases net photosynthesis in plants and therefore decreases isoprene However, the net response of BVOC emissions in the future is uncertain due to the complexity of the physical and chemical processes involved and their incorporation into models
The emission of BVOCs from plants is species-specific and non-linearly dependent on temperature, sunlight, soil moisture, leaf physiology, atmospheric CO2 mixing ratio, and additional environmental variables (Ainsworth et al., 2012; Calfapietra et al., 2013; Trowbridge et al., 2020). Several species of trees in urban environments like pine, conifer, oak, eucalyptus, poplar, acacia and others emit a range of BVOCs. Aydin et al. reported the normalized total BVOC emission rate for oriental plane and sweet chestnut to be 27.1 μg/g h and 14.9 μg/g h respectively (Aydin et al., 2014).
Temperature is an important factor controlling BVOC emissions (Fitzky et al., 2019; Yáñez-Serrano et al., 2020). Temperature changes directly affect the biochemical reactions in the metabolic pathways which produce BVOCs or have indirect effects like lengthening of the growing season (Peñuelas and Staudt, 2010; Yu et al., 2021). As temperatures increase, the enzymatic activities of synthesis are enhanced, BVOCs vapor pressure is increased and the resistance of the diffusion pathway is lowered. Exponential enhancements of biogenic isoprene and monoterpene emissions with increasing temperature have been reported in several studies (Peñuelas and Staudt, 2010). Zanis et al. observed ozone enhancement over regions close to anthropogenic pollution sources or close to enhanced natural biogenic volatile organic compounds emission sources with a rate ranging regionally from 0.2 to 2 ppbv/°C due to global warming (Zanis et al., 2022). At higher temperatures the rate of emissions of significant ozone precursors produced from vegetation, like isoprene, increases significantly, doubling from 20°C to 30°C for isoprene (Archibald et al., 2020b). In the northern mid-latitudes, a modeling study reported that a 3 K temperature rise in BVOC emissions would enhance biogenic isoprene emissions by 6–31% and surface ozone by > 2 ppbv (Doherty et al., 2013). Liu et al. reported that since 2013 an increase in temperature and biogenic emissions led to a rise in the Maximum Daily Average 8-hourly (MDA8) O3 mixing ratio by 1–2 ppbv (Liu and Wang, 2020). However, extreme temperatures and severe heat stress can cause cellular lesions and a drop in photosynthesis that may not improve upon return to cooler temperatures and reduce BVOCs emission (Yu et al., 2021).
As concentrations of CO2 and other air pollutants are expected to rise in the future studies have estimated their impact on BVOC emissions (Sporre et al., 2019; Thornhill et al., 2021). The factors affecting these emissions are complex and interrelated like the chemical composition of the compound(s), the exposure, the concentration of pollutants, and the plant species (Yáñez-Serrano et al., 2020). The earlier studies mostly incorporated leaf-level temperature and solar radiation sensitivities and predicted a 2–3°C rise in the mean global temperature leading to an increase in global BVOC emissions by an additional 30–45% increase as a result of climate warming (Peñuelas and Staudt, 2010; Jiang et al., 2018). New studies taking into account the complex interactions between climate and ozone concentrations are challenging this pattern of much higher BVOC emissions (Unger, 2014; Harper and Unger, 2018). There is a consensus that an increase in CO2 concentration will induce a reduction of isoprenoid emissions at least at the leaf level. On the contrary, a rise in O3 concentration can have opposite effects depending on the extent and level of exposure—with a general stimulation in the cases of acute exposures and a general inhibition under chronic exposures (Fitzky et al., 2019).
Feng et al. examined the effect of warming, drought, elevated CO2, and O3 on isoprene and monoterpenes emissions. Isoprene responded negatively to elevated O3 (−8%), drought (−15%) elevated CO2 (−23%) but positively to warming (+53%). Effects on monoterpene emissions were lesser in comparison, significantly caused by warming (+39%; Feng et al., 2019). Faubert et al. have reported doubled volatile organic compound emissions from subarctic tundra under simulated climate warming. The relatively low emissions of monoterpenes and sesquiterpenes were doubled in response to an air temperature increment of only 1.9–2.5°C (Faubert et al., 2010).
Drought situations also hinder isoprene emissions as declining water content reduces the photosynthetic rate and stomatal conductance. Jiang et al. in a study assessing the effect of drought stress on isoprene emissions estimated the reduction of biogenic isoprene emissions by 17% globally in comparison to the non-drought simulations (Jiang et al., 2018).
Land use and land-cover changes worldwide perturb the Earth’s system in numerous ways and affect BVOC emissions (Unger, 2014; Harper and Unger, 2018; Wang et al., 2021a). Squire et al. in a simulation study for the year 2095 projected a total 55% reduction in isoprene emissions in contrast with the year 2000 (Squire et al., 2014). The individual contributions from climate change, land use change (mainly cropland expansion), and CO2 inhibition were estimated to be +30%, −73%, and − 57% respectively.
Some recent modeling studies agree that global isoprene emissions have declined since the preindustrial times and present-day varying from 10–25% driven mostly by anthropogenic land use and land cover changes (Weber et al., 2021; IPCC Pörtner et al., 2022). Climate change with warming and resultant changes in precipitation may cause a shift of vegetational zones to the north. Consequently, the shifting of woody shrubs may occur in tundra ecosystems. Invasive insect herbivores may attack forests at higher rates increasing the local BVOC emissions (Yu et al., 2021).
The uncertainties associated with BVOC emissions are due to the complexity of physical and chemical processes mainly atmospheric CO2, foliage composition, cover changes in natural and managed land, and their inclusion in different models (Wang et al., 2021a; Weber et al., 2022). In summary BVOC emissions will be sensitive to future climate change, land use patterns, and other environmental stressors for vegetation.
To improve understanding of BVOC emissions observational approaches have been established including indirect methods such as the application of the variability in satellite formaldehyde (HCHO) concentrations. HCHO is strongly influenced by the photochemical oxidation of VOCs and is closely linked to ozone formation. Good consistencies between satellite-based observations and the calculated photochemical property parameters like ozone forming potential of VOCs suggest that satellite-based HCHO columns can infer the VOCs emissions over large spatial areas in the future (Hong et al., 2021). Therefore, HCHO has the feasibility of being a proxy for VOCs. Simulations of BVOC emissions can be conducted using inversion studies based on formaldehyde columns observed from space using an ozone monitoring instrument. HCHO observations offer useful insights into reactive hydrocarbon emissions and the chemistry and transport model can be used to evaluate the time-dependent HCHO yield from BVOCs such as isoprene, 2-methyl-1-butanol, and α- and β-pinenes (Cai et al., 2021).
CH4 besides being an important precursor of ozone in remote areas is a potent greenhouse gas. Global levels of methane have risen to 1866 ppb in 2019 from 1803 ppb in 2011, largely due to anthropogenic influence. CH4 is the second largest contributor to climate warming and has resulted in about 21% of the increased radiative forcing since pre-industrial times. Wetlands are the biggest natural source of CH4 which contribute between 30 and 40% to the total CH4 emissions and are a major area of concern concerning climate change (Gedney et al., 2019; Koffi et al., 2020; IPCC Pörtner et al., 2022).
Microbial methanogenesis is a process of anaerobic respiration that occurs in water-saturated soils with limited oxygen availability and produces methane. Under this environmental condition, methane production depends on temperature, water-table depth, and both the quality and quantity of organic matter. As temperatures increase worldwide due to global warming, they may reach the optimum range for methanogenesis in more regions of the world. A rise in precipitation is also expected to be about 7% per degree of warming (Trenberth et al., 2013). With the thawing of permafrost and local variations in the soil water content due to increased precipitation, an increase in wetland areas is expected. Annual global CH4 emissions, in the models, differ by ±40% of the all-model mean [190 Tg CH4/yr; 82)]. Koffi et al. have reported a rise in wetland CH4 emissions by 50–150% during the 21st century (Koffi et al., 2020).
Elevated CO2 will increase global, tropical, and extratropical CH4 emissions. Higher CO2 permits plants to increase stomatal closure which lessens water loss by the plant. This reduced water loss diminishes water demand from the soil, increasing soil moisture and thus growing wetland extent (Melton et al., 2013). Increased CO2 in the atmosphere leads to the CO2 fertilisation effect which finally results in enlarged methane emissions. Observations have shown more plant photosynthates are available to soil microbial communities which reduce carbon to CH4. For doubled CO2 an annual rise of 78% from 156 to 277 Tg/yr, in wetland methane emissions was estimated by Shindell et al. (Shindell et al., 2004).
Not only are wetland CH4 emissions climate-sensitive but they also may provide large feedback to climate change by radiative forcing. Zhang et al. reported in comparison to anthropogenic CH4 emissions, wetland emissions account for 14.6–25.1% of the total projected radiative forcing change which will result in added global mean radiative forcing of 0.04 W/m2 to 0.19 W/m2 by the end of the 21st century (Zhang et al., 2017). Gedney et al. estimated that over the 21st century wetland feedback resulted in an added temperature increase between 0.6% and 5.5% feedback on climate ranging from 0.01 to 0.11 W/m2/K (Gedney et al., 2019).
However large uncertainties are associated with wetland response to projected climate change due to limited knowledge and representation of wetland geochemistry, hydrology, and permafrost dynamics in different models. Considerable uncertainties are also associated with the assessment of natural sources and the ensuing climate feedback. Further work is required to better parameterize and evaluate the models.
Wildfires emit large quantities of ozone precursors CO, NOx, and numerous VOCs in the lower atmosphere. Jaffe et al. estimated global wildfire production of ozone to be around 170 Tg/yr, which is 3.5% of all global tropospheric O3 production (Jaffe and Wigder, 2012). Wildfires as well play an important role in numerous atmospheric chemistry-climate feedback mechanisms.
Climate change is a significant factor in explaining variations in fire incidence and intensity in recent decades and is likely to increase the global risk of wildfires in the future (Jaffe and Wigder, 2012; Mcclure and Jaffe, 2018). Wildfire occurrence depends on several factors like temperature, soil moisture, and the presence of trees, shrubs, and other possible fuels. Climate change is creating warmer, drier conditions. Increased drought and a lengthier fire season are enhancing these intensifications in wildfire risks (Lindaas et al., 2017; Dupuy et al., 2022).
Under the scenarios with the highest greenhouse gas emissions, Dupuy et al. in southern Europe estimated an increase in future fire, on average, from 2 to 4% (Dupuy et al., 2022). Hurteau et al. taking into consideration vegetation fire feedback and interactions of preceding fires and climate on fuel availability and flammability reported a projected increase in area burned by 14.3% (Hurteau et al., 2019).
Although O3 production requires both NOx and NMVOCs, wildfires tend to be NOx-limited. McClure et al. investigated the role of wildfire emissions on O3 production and reported MDA8 O3 mixing ratios to be 32% higher than on non-smoky days (Mcclure and Jaffe, 2018). Fire emissions of ozone precursors vary considerably among various types of ecosystems, biomass nitrogen loads, and combustion efficiency (Liu et al., 2022). Lu et al. reported in their study that around one-third of the summer days (1989–2010) with MDA8 ozone exceeding 70 ppbv would not arise in the absence of wildfires (Lu et al., 2016). It was reported by Lin et al. that monthly mean O3 levels could enhance by 2–8 ppb in summers due to wildfires (Lin et al., 2016). On the contrary Bourgeois et al. suggested stable biomass burning emissions since pre-industrial times (Bourgeois et al., 2021). Arora et al. showed a reduction in wildfire emissions and global areas burned due to deforestation and changes in land use (Arora and Melton, 2018).
Nevertheless, there are rising indications that wildfire emissions will play a significant role in the future composition of the atmosphere due to extended fire seasons, more intense fire activity, and a reduction of emissions from fossil fuel combustion (Burke et al., 2021). At present quantification of ozone production in wildfire plumes are difficult due to various uncertainties in measuring wildfire emissions, chemical reactions, fire vegetation feedback, and human-related factors (Dupuy et al., 2022). Accurate representation of emissions and related atmospheric chemistry in global models will be crucial to predicting future levels of surface O3 and its role in the radiative forcing of climate and air quality.
Ozone and its precursors are transported from their emission site to other downwind regions on regional, intercontinental and hemispheric scales. The pollution plumes (anthropogenic and biomass burning) can circle the globe and travel from East Asia to North America (Monks et al., 2015). Future climate change may influence the role of long-range transport downwind effects. Several of the crucial impacts of climate change include dynamic mechanisms of the climate system and their response to anthropogenic climate forcing.
The net stratospheric influx of ozone results from the stratospheric-tropospheric exchange (STE) and is comprised of troposphere-to-stratosphere transport (TST) and stratosphere-to-troposphere transport (STT). STE is impelled by the large-scale stratospheric meridional circulation known as Brewer-Dobson circulation (BDC; Archibald et al., 2020a). In the tropics air rises from the troposphere to the stratosphere, is transported to the extratropical stratosphere, and then descends from the stratosphere to the troposphere at high and middle latitudes. The role of STE in modulating tropospheric ozone is about 10% of the annual global tropospheric ozone chemical production. BDC is expected to intensify in a warming future and is estimated to lead to a 3% increase in surface ozone and a 6% increase in mid-tropospheric ozone (Hess et al., 2015). Muel et al. have projected a 53% increase in the global mean annual influx of stratospheric ozone into the troposphere between the years 2000 and 2,100 (Meul et al., 2018). Abalos et al. have reported a 10–16% increase in stratospheric ozone in the troposphere by the end of the 21st century due to the strengthening of the BDC (Abalos et al., 2020).
Tropopause folds are a key mechanism for stratospheric intrusions (SIs) in STT events. The air from SIs has high O3, low CO, and low water vapour, in comparison to their concentrations in the troposphere. This downward transport leads to changes in tropospheric ozone levels (Xiong et al., 2022). An increase in tropospheric O3 level is observed during the folding events, which have a stratospheric origin (Akritidis et al., 2022). Akriditis et al. identified changes in tropopause fold frequencies from 1970–1999 to 2070–2099 in both hemispheres, regionally exceeding 3%, and found links with the projected changes in the position and intensity of the subtropical jet streams (Akritidis et al., 2019). The strengthening of ozone STT in the future in both hemispheres has also been projected, with an induced surge in transported stratospheric ozone tracer through the complete troposphere, reaching up to 3 nmol/mol near the surface to 10 nmol/mol in the upper troposphere (Akritidis et al., 2019). Olsen et al. observed that ENSO-related STE related to tropopause folding in the subtropical westerly jet due to ENSO-driven STE leads to 15% of the ozone change in the NH middle troposphere near the jet in the Pacific. The variance described was more under the SH Pacific subtropical jet, with over 35% of the variance explained by ENSO in the middle to upper troposphere (Olsen et al., 2019).
Kumar et al. observed a two-time enhancement in the surface ozone levels due to tropospheric folding facilitating STE processes over the Himalayan region. The increase in surface ozone was linked with the breaking Rossby waves in the upper troposphere (Kumar et al., 2020). Kuchar et al. associated strong orographic gravity wave drag events with increased upward Rossby wave propagation in the stratosphere. They illustrated that the drag events had the potential to alter ozone variability through changes of mixing in the surf zone and advection from lower latitudes (Kuchar et al., 2022).
Studies also indicate tropical cyclones lead to intrusion of stratospheric air into the troposphere. The tropospheric stability is weakened due to overshooting convection associated with tropical cyclones and plays a key role in STE (Shen et al., 2015; Ratnam et al., 2016). Das et al. observed an increase in surface ozone levels by ∼ 10 ppbv in the daytime and 10–15 ppbv in the night-time during a cyclone. They also report the descent rate of the enhanced ozone layer during the passage of the tropical cyclone to be 0.8–1 km day−1, which is three times that of a clear-sky day. The increase in the upper-tropospheric (10–16 km) ozone was 20–50 ppbv, which stretched down to the middle (6–10 km) and lower troposphere (<6 km; (Shankar Das et al., 2016)).
Knowland et al. examined the influence of mid-latitude cyclones on European background surface ozone influence. They identified the importance of the passage of a cyclone’s cold front, the ability of cyclones to bring down high levels of O3 from the stratosphere, and associated surface high-pressure systems as the main drivers associated with cyclones that impact surface ozone (Emma Knowland et al., 2017).
Long-range transport of ozone is affected by ENSO, the Arctic Oscillation (AO), and the closely related North Atlantic Oscillation (NAO) which impact weather patterns in North America and Eurasia. It also includes the Asian summer monsoon upon which more than a billion people depend for their freshwater supply.
ENSO refers to the interaction between the atmosphere and ocean in the tropical Pacific and is a cause of large-scale climate variability in the coupled atmosphere-ocean system (Cagnazzo et al., 2009). It affects severe weather (impacting western United States drought and Atlantic hurricane activity), rainfall, river flow, and agricultural production over different parts of the world (Lin and Qian, 2019). It is a critical climate occurrence that can change atmospheric circulation across the globe and changes tropospheric ozone on an interannual timescale (Oman et al., 2013; Nowack et al., 2017). ENSO-related changes in circulation, thermal patterns, and composition drive tropical ozone variability (Oman et al., 2011). Oman et al. have reported the correlation of the measurement-derived Ozone ENSO Index with ENSO to be 0.84. Yang et al. reported a positive correlation with the ENSO index of summertime ozone concentrations in China in the years 1990–2019, with increases by 20% over southern China in El Niño relative to La Niña years (Yang et al., 2022).
Rowlinson et al. observed ENSO influence on fire incidence, wetland emission, and atmospheric circulation-affected sources and sinks of tropospheric O3. They reported greater fire emission of precursors like NOx and CO-enhanced O3 which led to an O3 radiative effect of 0.03 W/m2 (Rowlinson et al., 2019). Xue et al. observed that ENSO-modulated fires in Southeast Asia, dominate the interannual variability of springtime trans-Pacific transport of ozone across the entire North Pacific Ocean. During El Nino springs, the intensified fires from Indochinese Peninsula and Indonesia, together with large-scale circulation anomalies, resulted in enhanced ozone plumes stretching over 15000 km in both the lower-middle and upper troposphere (Xue et al., 2021). This enhancement is also observed in the in situ measurements of ozone concentration, with an almost 10% increase at Mauna Loa Observatory, Hawaii, the long-distance transport over the North Pacific (Xue et al., 2021). Peiro et al. described the significant impact of the El Niño event on the tropospheric column ozone, with 20% higher values in Indonesia with the Indian Ocean region and 10% lower in the Pacific Ocean center region (Peiro et al., 2018).
Warmer and drier weather conditions during El Niño also promote biomass burning there and may increase lightning activity both contributing to higher ozone (Zhang et al., 2011). It has been reported that both strong La Niña and strong El Niño events lead to the greater entry of water vapor (0.5 ppmv increase, about 70% of observed increase) and stratospheric moistening in the tropics (Garfinkel et al., 2018). This may lead to greater ozone loss through HOx chemistry. Shen et al. studied the effect of El Niño on MDA8 ozone concentrations in summer over the eastern United States from 1980 to 2016 and reported each standard deviation rise in the Niño 1 + 2 index was connected to an increase of 1-2 ppbv ozone in the Atlantic states and a decrease of 0.5-2 ppbv ozone in the south-central states (Shen and Mickley, 2017). Rowlinson et al. estimated El Niño-related variations in atmospheric transport and humidity diminished global tropospheric O3 concentrations which resulted in a −0.03 W/m2 change in the O3 radiative effect (Rowlinson et al., 2019).
Nowack et al. have highlighted the role of ozone feedback in the ENSO-ozone response under the scenario of global warming. Lapse rate changes due to ozone feedback may modify the Walker circulation and accordingly, tropical Pacific surface temperature gradients. Ozone feedback diminishes the slowing of the Walker circulation under CO2 forcing (Nowack et al., 2017). ENSO is also cognized to control the strength and frequency of STT of ozone over the Pacific-North American region (Albers et al., 2022). It has been reported that interannual variations in the strength of the ENSO of around 40% affect the STT flux causing variations in tropospheric ozone at northern midlatitudes of around 2% (Archibald et al., 2020a).
Yang et al., and Xue et al. found a positive correlation between ozone concentrations and the ENSO index. Shen et al., Oman et al. and Peiro et al. reported that ozone levels varied according to the phase of ENSO and had different effects in different regions. Hope et al. suggest that external forcing plays a role in the ENSO variance changes (Hope et al., 2017) while Maher et al. do not find external forcings to modulate ENSO over historical periods (Maher et al., 2018). Although there is high confidence that ozone is sensitive to the strength of ENSO forcings in the troposphere, there is low confidence that climate change influences the observed changes in ENSO.
AO and NAO are leading modes of climate variability in the northern hemisphere and influence weather patterns in North America and Eurasia (Mann, 2021). In the present climate, indices of the AO and NAO are highly correlated in time, due to a constant mechanism influencing both-the downward propagation of stratospheric anomalies into the troposphere.
Pollution transport pathways lead to the accumulation of ozone precursors in the northern hemisphere troposphere in winter and their release in lower latitudes in spring (Eckhardt et al., 2003). AO and NAO influence tropospheric ozone pollution at mid-latitudes. NAO is reported to cause prominent surface ozone anomalies in the lower troposphere in Northern Europe due to the increased flow of westerlies from the United States to Europe in the positive NAO phase (Russo et al., 2022). NAO affects surface ozone concentrations on a monthly timescale, over 10 ppbv in southwestern, central, and northern Europe during all seasons except fall (Pausata et al., 2012). It has been suggested that the vertical distribution of ozone in the stratosphere in the northern hemisphere can be affected by AO (Liu and Hu, 2021). A 72% of the variance in the total ozone column in the high northern latitudes was attributed to AO (Sekiya and Sudo, 2012). In North Atlantic, the variability of upper tropospheric ozone is very strongly influenced by the STE and tropical lightning NOx emissions which are in turn influenced by AO/NAO (Russo et al., 2022).
Studies state that tropospheric climate changes impact both the AO and NAO and the effects are spread throughout the troposphere. The results displayed by the experiments with tropospheric warming or stratospheric cooling produce give positive AO/NAO indices (Liu and Hu, 2021).
During high NAO phases, increased transport of pollutants to the Arctic was observed from NH, especially in winter and spring. A positive trend in NAO and enhanced transport of pollutants including ozone into the Arctic may be partly responsible for rapid climate change (Eckhardt et al., 2003).
The longitudinal response of ozone to the AO in the upper troposphere is controlled by the variations in tropopause height connected with the AO, such that lower (higher) heights imply increased (decreased) ozone. AO can modulate ozone by up to 5 ppbv (Hess and Lamarque, 2007). In Northern Canada and the Arctic, AO is correlated with ozone decreases as variations in stratospheric ozone dominates the ozone signal throughout the depth of the troposphere. In other locations, the local response to the AO is governed by changes in the transport of ozone produced in the troposphere. The local response to the AO is also dictated by fluctuations in the transport of ozone produced in the troposphere. This occurs at locations over the lower troposphere over the Atlantic basin where ozone is negatively correlated with the AO, and at locations over the lower troposphere over Europe and Eastern Siberia where ozone is positively correlated with the AO.
Most climate models project an increase in the winter NAO index most likely in response to climate change (Gillett et al., 2003; Rind et al., 2005). At the beginning and end of the 20th century, an increase in ozone over Greenland and/or its depletion over the Azores was accompanied by a positive NAO index. In contrast, the negative NAO phase, which was observed in the middle of the 20th century, was attributed to the O3 reduction at polar latitudes (Kilifarska et al., 2020).
Hamounda et al. reported a breakdown of the coupling between the AO and the NAO in the warm climate projections and projected changes in mean atmospheric circulation (Hamouda et al., 2021). It has also been reported that the inclusion of ozone photochemistry is necessary to capture key regional climate responses in models simulating AO/NAO patterns highlighting ozone-AO connections (Mann, 2021).
In polluted areas, high concentrations of tropospheric ozone have often been correlated with meteorological variables, like high temperature, strong solar radiation, low relative humidity, low precipitation, and poor meteorological transport and mixing on synoptic and seasonal timescales. Meteorological conditions play a vital role in controlling ozone concentrations, not only through transport but also by affecting natural emissions and chemical rates (Li et al., 2020). Yang et al. have reported that variations in meteorological conditions caused up to 15% variation in annual ozone concentrations in some regions in China (Yang et al., 2019). Cheng et al. suggest that the relative contribution of meteorological conditions to long-term variation in ozone in Beijing is only 2%–3%, but short-term ozone concentrations were affected significantly by variations in meteorological conditions (Cheng et al., 2019). The appropriate NOx/VOC reduction ratio may also differ significantly under variable meteorological conditions (Yang et al., 2019).
These associations suggest that changes in regional meteorology due to climate change will possibly incur changes in future tropospheric ozone. Several such synoptic and seasonal-scale weather patterns have been recognized as partial drivers for high tropospheric ozone, and the likely changes in some of those weather patterns in future climates have been explored.
O3 is strongly correlated with temperature due to associations of increased temperature with enhanced O3 photochemical reaction rates mostly driven by an increase in the rate coefficients for chemical processes, which results in the presence of positive activation energy barriers for chemical reactions (Jacob and Winner, 2009). Temperature also affects PAN decomposition, SNOx emissions, and BVOC emissions as discussed earlier. O3-temperature correlation also depends on its variation with other meteorological phenomena like stagnancy and humidity (Porter and Heald, 2019). An increase in temperature may also enable different pathways which may result in a greater tendency for producing ozone. For example, the rate constant for the reaction between OH and methane, is strongly temperature dependent and increases by a factor of 16 when the temperature rises from 200 to 300 K (Archibald et al., 2020b). This offers a globally important source of peroxy radicals (RO2) which mediate the formation of tropospheric ozone. Gu et al. observed O3 concentrations to increase faster with rising temperatures at mean rates of 6.65 and 13.68 ppb/°C at an urban and remote site in China respectively (Gu et al., 2020).
With the ongoing rise in greenhouse gases and corresponding increases in average temperature, heat waves are expected to become more intense over global land areas. High temperatures are frequently associated with higher surface ozone and its related negative impacts (Zhao et al., 2018; Li et al., 2020; Zhan et al., 2021). Meehl et al. reported that if ozone precursors emissions remain the same then, surface ozone concentrations increase on future heat wave days compared to non-heat wave days in most regions of north-eastern North America, western Europe, central and northern Asia but decreases in some regions like coastal and south-eastern North America, Eastern Europe, north-eastern Asia where there is ozone suppression likely due to isoprene emissions (Meehl et al., 2018). But emissions of ozone precursors will change in different emission scenarios and an increase in temperature will affect VOC emission and thus ozone concentrations (Orru et al., 2019). Therefore, temperature is not a key control of modeled ozone concentrations in future heat waves (Archibald et al., 2020b).
According to the sixth assessment report of the Intergovernmental Panel for Climate Change (IPCC), it is likely that human influence has contributed to moisture in the upper troposphere since 1979. Also, there is medium confidence that human influence contributed to a global increase in annual surface-specific humidity, and medium confidence that it contributed to a decrease in surface relative humidity over midlatitude NH continents during summertime. Regional O3 pollution episodes occurred frequently when humidity is low (Zhan and Xie, 2022) and an increase in water vapor can lead to a decrease in ozone concentrations in the lower troposphere (Liu and Wang, 2020). Zanis et al. report climate change benefits on surface ozone of −0.96 ± 0.07 ppbv/°C which is mainly linked to the dominating role of enhanced ozone destruction with higher water vapour abundances under a warmer climate (Zanis et al., 2022). In a study by Qu et al., it has been stated that reduced water vapour caused fewer clouds formation resulting in more sunlight reaching the surface, so the photolytic production of ozone increased. Due to the collective effect of the two meteorology feedback systems, the annual average ozone concentration in China declined by 2.01 ppb (6.2%; (Qu et al., 2021)).
Mid to high-latitude land precipitation has increased over the northern hemisphere, and the zonal mean wet tropics dry subtropics contrast has been strengthened due to human influence (IPCC Pörtner et al., 2022). Precipitation decreases the ozone concentration via the wet removal of ozone precursors (Liu and Wang, 2020). Wind fields can significantly affect ozone by transporting ozone and ozone precursors in and out of different regions (Liu and Wang, 2020). Distinct seasonal transitions in prevailing wind and rainfall associated with the monsoon circulation result in unique ozone variations in many regions of the world (Lu et al., 2018). Studies report that the onset of the summer monsoon caused ozone-unfavourable meteorological conditions and strong upward transport, which all led to large decreases in the lower tropospheric ozone burden in India. Rainfalls efficiently removed ozone, and weak solar radiation combined with low temperatures resulted in low ozone photochemical formation. In addition, the presence of water vapor from marine air resulted in the chemical loss of ozone at low NOx conditions along with negligible biomass burning and low anthropogenic emissions led to a reduction in monthly ozone chemical production by 4.2 Tg (from 11.8 Tg in May to 7.6 Tg in August) as integrated over the Indian terrestrial land (Lu et al., 2018).
Similar ozone-monsoon responses but with different seasonal variations were also found for near-surface ozone in China (Lu et al., 2019). Interannual ozone variability in monsoon regions shows strong correlations with monsoon strength. Sometimes due to varied reasons, a negative correlation between ozone levels and monsoon strength has been reported in different sites in the Asian continent due to stronger net chemical production (Wang et al., 2021b). Yang et al. reported changes in the East Asian summer monsoon strength caused variations in O3 concentrations over central-eastern China by 2%–5%, ascribed to the changing transboundary transport of O3, with high O3 levels appearing in strong monsoon years (Yang et al., 2014).
Climate variabilities of ENSO also affect Asian summer monsoon (ASM) anticyclone circulations and may influence tropospheric ozone through changes in monsoon on a longer timescale. Kunze et al. observed a weakening of the ASM during ENSO warm events (Kunze et al., 2016). The Asian summer monsoon (ASM) anticyclone plays a vital role in the efficient transport of Asian tropospheric air masses to the extratropical upper troposphere and lower stratosphere (UTLS). Park et al. observed minima in ozone within the anticyclone in the UTLS (Park et al., 2007). Randel et al. observed that ASM anticyclone linked to transient convective events was associated with the vertical transport of low ozone and high-water vapor into the UTLS region (Randel and Park, 2006). Fadnavis et al. assessed that eddy detached from the anticyclone resulted in the transport of Asian trace gases away from the Asian region to the western Pacific and western Africa and a 10% reduction of NMVOCs and NOx Asian emissions caused a decrease in peroxyacetyl nitrate (2%–10% near 200–80 hPa), ozone (1%–4.5% near ∼ 150 hPa) and ozone heating rates (0.001–0.004 K/day near 300–150 hPa) in the upper troposphere over western Africa and the western Pacific (Fadnavis et al., 2018). Li et al. reported ozone variations in over Lhasa to be associated with a combination of processes, namely the intrusion of ozone-rich stratospheric air, the upward transport of low ozone concentrations in the marine boundary layer by tropical cyclones, and the uplift of polluted air rich in ozone in South Asia (Li et al., 2018).
Extratropical jets are wind maxima in the upper troposphere, often accompanied by storms, blocking, and weather extremes. Blocking refers to long-lived, stationary high-pressure systems that are often linked with a poleward displacement of the jet, producing cold spells in winter and heat waves in summer. Das et al. have reported an increase in ozone concentration in the upper troposphere with the strength of the tropical easterly jet, which is a consequence of ASM circulation (Das et al., 2019). IPCC’s sixth assessment report states a likely increase in the total number of extratropical cyclones since the 1980s in the Northern Hemisphere (NH) but a reduction in deep cyclones in summer. The reduction in cyclone activity by about 4% per decade NH in summer is likely related to human-induced warming. Boreal winter witnessed the potential influence of the rapid Arctic warming on the observed intensification of NH storm track activity in the past few decades (IPCC Pörtner et al., 2022).
Recently some studies suggest that the oxidation of soot particles with ozone increases their ability to act as cloud condensation nuclei (CCN) and is an important pathway to be considered in future studies (Carnerero et al., 2019; Friebel and Mensah, 2019). Friebal et al. report an increase in the number of CCN due to O3 aging of soot can lead to an increase of the CCN burden on a global scale (+12.7%) and a significant enhancement of the cloud droplet number concentration in northern midlatitudes (up to +30.3%). Reaction temperature also has a pronounced effect on CCN activation of soot particles and combined with high ozone levels may have a significant impact on new particle formation.
What the future holds in terms of ozone concentrations will be decided by different factors including government policies and the choices that the world makes today. The Shared Socioeconomic Pathways (SSPs) furnish a framework for combining future climate scenarios with socioeconomic development and provide elaborate information about plausible future evolutions of society and natural systems (Nazarenko et al., 2022). In all SSP, global temperatures will continue to rise for at least a few decades (Figure 3).
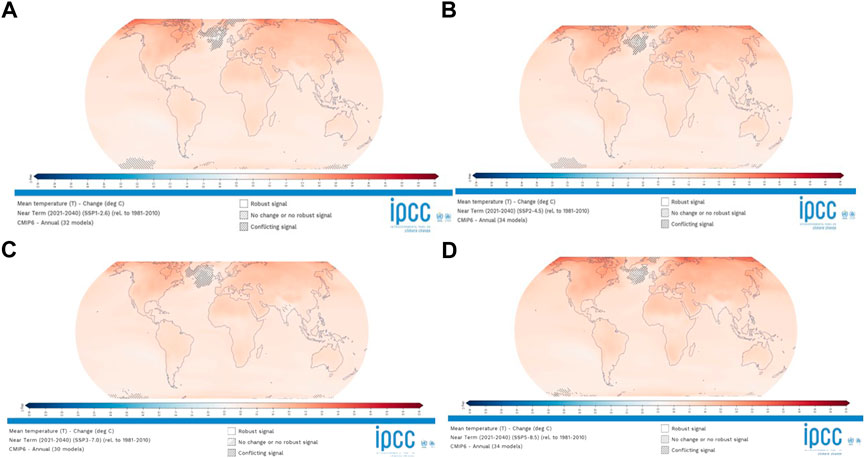
FIGURE 3. (A–D) show changes in mean temperature in different SSP scenarios in the near term (2021–2040) relative to 1981–2010 by Iturbide, M., Fernández, J., Gutiérrez, J.M., Bedia, J., Cimadevilla, E., Díez-Sierra, J., Manzanas, R., Casanueva, A., Baño-Medina, J., Milovac, J., Herrera, S., Cofiño, A.S., San Martín, D., García-Díez, M., Hauser, M., Huard, D., Yelekci, Ö. (2021) Repository supporting the implementation of FAIR principles in the IPCC-WG1 Atlas. Zenodo, DOI: 10.5281/zenodo.3691645. Available from: https://github.com/IPCC-WG1/Atlas
A warmer climate has the potential to increase surface ozone concentrations and this is referred to as the ozone climate penalty. This penalty effect will be most likely in polluted regions (Bloomer et al., 2009; Finney et al., 2016b; Nazarenko et al., 2022). Gong et al. have observed that different climate scenarios have penalty effects on summertime ozone concentrations of about 4–10 ppbv in the eastern United States, 1-5 ppbv in Southern Europe, and 3-6 ppbv in Northeastern Asia in the 2100s compared to the 2000s.
In the SSP1-2.6 scenario, surface ozone may decline in many parts of the world but in the SSP5-8.5 scenario, it is expected to significantly increase (Figures 4A–D; (Gong et al., 2022)). Gong et al. reported a reduction in O3 exceedance levels on hot days from 3.7 days (2030) to 3.0 (2050) in SSP 1–2.6 scenario. But under the SSP 5–8.5 scenario reported co-occurrences of O3-polluted days and hot days from 4.5 (2030) to 6.4 (2050). Shang et al. predict a significant rise in the tropospheric ozone concentrations in the middle and lower troposphere under the SSP3-7.0 and the SSP5-8.5 scenarios (Shang et al., 2021). Large regions in South and East Asia will witness enormously high levels of ozone in the future the SSP3-7.0 and the SSP5-8.5 scenarios (Zhang et al., 2022b; IPCC Pörtner et al., 2022). However, Wang et al. reported a decrease in O3 concentrations from 2015 to 2,100 under SSP1-2.6 and SSP2-4.5 (Wang et al., 2022). Zanis et al. predicted a reduction in surface ozone under the SSP3-7.0 scenario in unpolluted regions (from −0.2 to −2 ppbv/°C) and globally (−1 ppbv/°C) as a result of accelerated ozone chemical loss due to greater water but increase in surface ozone (up to 2 ppbv/°C) over polluted regions (Zanis et al., 2022).
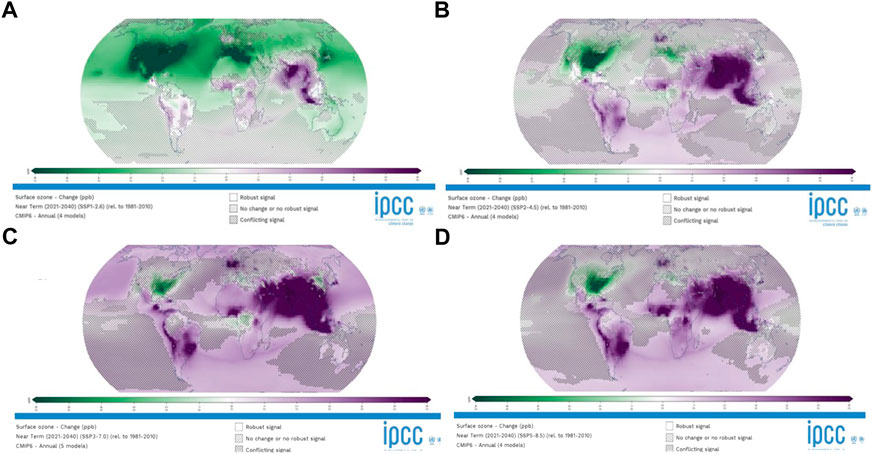
FIGURE 4. (A–D) show changes in ozone in different SSP scenarios in the near term (2021–2040) relative to 1981–2010 by Iturbide, M., Fernández, J., Gutiérrez, J.M., Bedia, J., Cimadevilla, E., Díez-Sierra, J., Manzanas, R., Casanueva, A., Baño-Medina, J., Milovac, J., Herrera, S., Cofiño, A.S., San Martín, D., García-Díez, M., Hauser, M., Huard, D., Yelekci, Ö. (2021) Repository supporting the implementation of FAIR principles in the IPCC-WG1 Atlas. Zenodo, DOI: 10.5281/zenodo.3691645. Available from: https://github.com/IPCC-WG1/Atlas
Ozone is the third strongest contributor to the total tropospheric radiative forcing (RF) since preindustrial times. Estimates of the pre-industrial to present-day tropospheric ozone radiative forcing are based entirely on models due to the absence of observed pre-industrial ozone measurements. Checha-Garcia et al. estimated the RF for tropospheric ozone and stratospheric ozone to be 0.33 W/m2 and −0.029 W/m2 respectively, giving a total ozone RF of 0.30 W/m2 in 2000–2014 relative to 1850–1860 (Checa-Garcia et al., 2018). Zhao et al. have also observed that an increase in tropospheric ozone and a decrease in stratospheric ozone led to contrasting forcings. They reported the global mean 1970–2010 effective RF to be 0.24 ± 0.01 W/m2 for tropospheric ozone with the largest value of 0.47 ± 0.31 W/m2 over the Arctic and effective RF due to stratospheric ozone depletion to be −0.07 ± 0.15 W/m2 (Zhao et al., 2019). Skeie et al. assessed the ozone RF to be 0.35 W/m2 in 2010 relative based on models with both tropospheric and stratospheric chemistry (Skeie et al., 2020).
Turnock et al. predicted a change in the global tropospheric O3 RF of +0.07 W/m2 from 2010 to 2050 based on changes in CH4 abundance and tropospheric O3 precursor emissions (Turnock et al., 2018). Estimates of historical and future changes in O3 and its RF over 300 years under different SSPs have been assessed (Turnock et al., 2019). Changes in surface O3, tropospheric O3 burden, and O3 radiative forcing has been predicted to be +8 ppbv, +76 Tg, and +0.3 W/m2 respectively from 1750 to 2014. Turnock et al. also projected reductions in global surface O3 concentrations of more than 3.5 ppbv and global O3 RF of less than—0.1 W/m2 in future scenarios from 2014 to 2050 in case of strong air pollution mitigation measures. An increase in O3 across all regions and O3 radiative forcing >+0.05 W/m2 was reported with weak air pollution mitigation measures (Turnock et al., 2019). Iglesias-Suarez et al. calculated net ozone forcing in the year 2,100 to be 430 ± 130 m W/m2 relative to the year 2000 and 760 ± 230 mW/m2 relative to the year 1750 (Iglesias-Suarez et al., 2018). The RFs due to climate change, ozone-depleting substances, and methane were estimated to be 33 ± 104 mW/m2, 163 ± 109 mW/m2, and 238 ± 113 mW/m2 respectively (Figure 5).
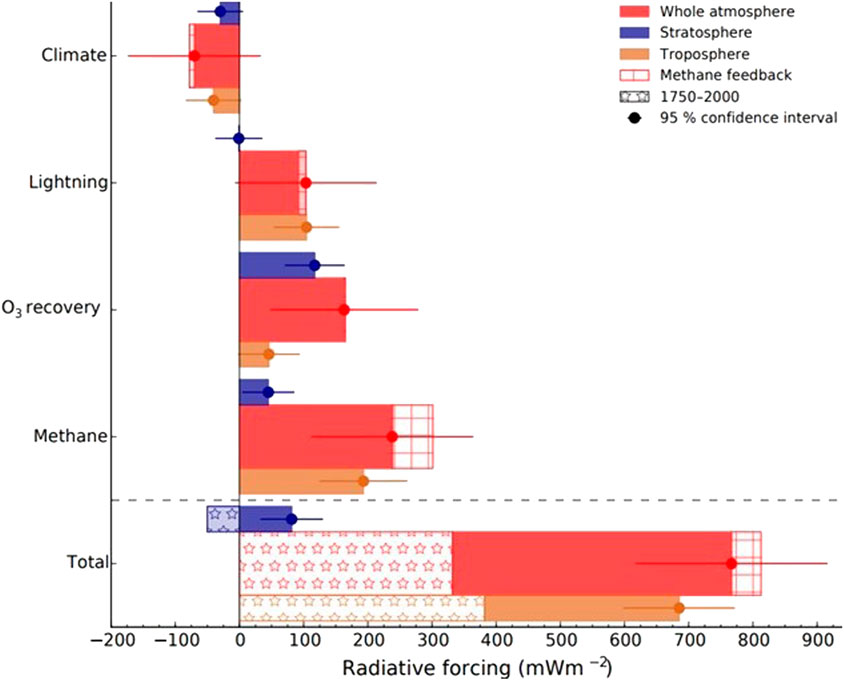
FIGURE 5. Ozone radiative forcings by drivers 2000–2,100 mW/m2 by Iglesias-Suarez et al. (2018) is licensed under CC BY-ND 4.0. Tropospheric (brown), stratospheric (blue), and net (whole atmosphere, red) forcings are shown. Associated ozone forcings with methane feedback (square hatched) are shown along with the net forcings. The overall ozone forcing (total) is the sum of the individual forcings (climate, lightning, O3 recovery, and methane scaled to 1750 (star hatched). Dots and error bars indicate the mean and the 95% confidence intervals of the forcings, respectively.
Ozone is a radiatively active gas, which interacts with both shortwave and longwave radiation. In the troposphere, O3 is an important secondary pollutant that regulates the oxidizing capacity of the atmosphere and is a source of OH radicals. Future changes in emissions of natural precursors of ozone will be a result of the complex interplay between its photochemistry, climate change, and transport mechanisms.
Precursors like SNOx, LNOx, biogenic VOCs, and wetland methane emissions are characterized by large year-to-year variations and have a strong potential of being influenced by large changes in their emissions ensuing from future climate change. SNOx differs non-linearly with region-specific agricultural management, soil conditions, and meteorology and in drylands may predominantly be emitted as a pulsed flux in response to irrigation/precipitation-drying cycles. SNOx is expected to increase in a warming climate but factors affecting it are not well constrained in models (Lu et al., 2021).
Lightning is a main natural source of nitrogen oxides in the troposphere with important consequences for atmospheric composition in the middle to the upper troposphere and the lower stratosphere. LNOx emission sensitivity to climate change is in the range of 4–60%/K (Verma et al., 2021). Current studies find LNOx emission climate sensitivity lying at the lower end of this estimate and uncertainty exists even in the sign of future projection responses due to different parameterizations (Finney et al., 2018).
BVOC emissions are affected by temperature, drought, solar radiation, humidity, availability of nutrients, CO2, O3, etc. Isoprene and monoterpenes are predominant VOCs released by plants. Although studies have observed a decline in isoprene emissions their impact in future years will depend on changes in land use patterns, changing climate, and atmospheric CO2 concentrations (Cai et al., 2021).
Wetlands are the largest contributors to CH4 emissions (Zhang et al., 2017). These emissions are highly sensitive to climate change and also provide positive feedback to climate change. However present-day estimations of their response to climate are highly uncertain (Archibald et al., 2020b).
STE is associated with synoptic-scale and mesoscale processes, such as tropopause folds, influenced by deep stratospheric intrusions, tropopause folds, gravity wave breaking, and deep convection and cyclones (Meul et al., 2018). STE is projected to increase due to climate and may lead to enhancement in surface ozone levels.
Tropospheric ozone levels are robustly correlated in a non-linear manner with temperatures, especially in highly polluted regions. It depends on temperature-dependent mechanisms related to O3 precursor emissions, lifetimes, and reaction rates. More water vapour and higher temperatures in a warmer climate would enhance ozone chemical destruction, leading to lower baseline surface ozone levels in unpolluted regions (Li et al., 2020; Zanis et al., 2022). In polluted regions surface temperatures will trigger regional feedbacks in chemistry and local emissions that will increase surface ozone and intensity of surface O3 peaks (Zanis et al., 2022).
Modes of climate variability like ENSO, NAO, and AO influence atmospheric circulations and weather conditions and will likely be influenced by climate change. Their impact on ozone levels differs from region to region depending on their phase of development and different indices.
Counteracting effects make the response of tropospheric ozone to climate-induced earth system changes complex (Kang et al., 2020; Zhan and Xie, 2022). Studies considering the individual effects of climate-driven changes in specific precursor emissions processes show increases in surface ozone under a warmer atmosphere for some processes. This is indeed the case for enhanced STE and SNOx. However, quantification of emissions from natural systems is difficult to quantify in isolation due to complexities in the understanding of chemical mechanisms and processes and their incorporation into models.
Looking forward it is clear that climate and ozone levels are deeply intertwined. Climate influences ozone concentrations through several processes and is affected by some of these which provide a feedback loop and perturb the climate even more. The review examined the new studies on the interactions of climate change on the chemistry and deposition, natural precursor emissions of ozone, and long-range transport of ozone. Fluctuations in climate, land use patterns, and increasing CO2 concentrations will influence BVOC emissions, SNOx, LNOx, wetland CH4, and wildfire emissions in a complex manner but there remains considerable uncertainty in how they will impact future ozone levels. The quantification of the effects is challenging since it involves complex interactions in the atmosphere as well as the biosphere. Emission controls on ozone precursors need to be inflicted irrespective of the climate policy and this becomes imperative due to unequivocal evidence of adverse health impacts associated with these pollutants.
AL- Conceptualization and review editing. SD- Writing original draft, visualization, reviewing, and editing.
The authors are grateful to Department of Science and Technology, Ministry of Science and Technology, Govt. of India, for financial support under the DST-FIST Programme SR/FST/CS-II/2017/38 (C) and also gratefully acknowledge ISRO—GBP for financial support under ATCTM project.
The authors are grateful to the Director, Dayalbagh Educational Institute, and Head, Department of Chemistry, Dayalbagh Educational Institute for their expertise and help. The also authors thank the reviewers whose comments helped to significantly improve the quality of the manuscript.
The authors declare that the research was conducted in the absence of any commercial or financial relationships that could be construed as a potential conflict of interest.
All claims expressed in this article are solely those of the authors and do not necessarily represent those of their affiliated organizations, or those of the publisher, the editors and the reviewers. Any product that may be evaluated in this article, or claim that may be made by its manufacturer, is not guaranteed or endorsed by the publisher.
Abalos, M., Orbe, C., Kinnison, D. E., and Plummer, D. (2020). Future trends in stratosphere-to-troposphere transport in CCMI models. Atmos. Chem. Phys. 20 (11), 6883–6901. doi:10.5194/acp-20-6883-2020
Ainsworth, E. A. (2017). Understanding and improving global crop response to ozone pollution. Plant J. 90 (5), 886–897. doi:10.1111/tpj.13298
Ainsworth, E. A., Yendrek, C. R., Sitch, S., Collins, W. J., and Emberson, L. D. (2012). The effects of tropospheric ozone on net primary productivity and implications for climate change. Annu. Rev. Plant Biol. 63, 637–661. doi:10.1146/annurev-arplant-042110-103829
Akritidis, D., Pozzer, A., and Zanis, P. (2019). On the impact of future climate change on tropopause folds and tropospheric ozone. Atmos. Chem. Phys. 19 (22), 14387–14401. doi:10.5194/acp-19-14387-2019
Akritidis, D., Pozzer, A., Flemming, J., Inness, A., Nédélec, P., and Zanis, P. (2022). A process-oriented evaluation of CAMS reanalysis ozone during tropopause folds over Europe for the period 2003-2018. Atmos. Chem. Phys. 22 (9), 6275–6289. doi:10.5194/acp-22-6275-2022
Albers, J. R., Butler, A. H., Langford, A. O., Elsbury, D., and Breeden, M. L. (2022). Dynamics of ENSO-driven stratosphere-to-troposphere transport of ozone over North America. Atmos. Chem. Phys. Discuss.. doi:10.5194/acp-2022-276
Anenberg, S. C., West, J. J., Fiore, A. M., Jaffe, D. A., Prather, M. J., Bergmann, D., et al. (2009). Intercontinental impacts of ozone pollution on human mortality. Environ. Sci. Technol. 43 (17), 6482–6487. doi:10.1021/es900518z
Archibald, A. T., Neu, J. L., Elshorbany, Y. F., Cooper, O. R., Young, P. J., Akiyoshi, H., et al. (2020a). Tropospheric ozone assessment report: A critical review of changes in the tropospheric ozone burden and budget from 1850 to 2100. Elementa 8.
Archibald, A. T., Turnock, S. T., Griffiths, P. T., Cox, T., Derwent, R. G., Knote, C., et al. (2020b). On the changes in surface ozone over the twenty-first century: Sensitivity to changes in surface temperature and chemical mechanisms. Phil. Trans. R. Soc. A 378, 20190329. doi:10.1098/rsta.2019.0329(2183)
Arora, V. K., and Melton, J. R. (2018). Reduction in global area burned and wildfire emissions since 1930s enhances carbon uptake by land. Nat. Commun. 9 (1), 1326. doi:10.1038/s41467-018-03838-0
Aydin, Y. M., Yaman, B., Koca, H., Dasdemir, O., Kara, M., Altiok, H., et al. (2014). Biogenic volatile organic compound (BVOC) emissions from forested areas in Turkey: Determination of specific emission rates for thirty-one tree species. Sci. Total Environ. 490, 239–253. doi:10.1016/j.scitotenv.2014.04.132
Bucsela, E. J., Pickering, K. E., Allen, D. J., Holzworth, R. H., and Krotkov, N. A. (2019). Midlatitude lightning NOx production efficiency inferred from OMI and WWLLN data. JGR. Atmos. 124 (23), 13475–13497. doi:10.1029/2019jd030561
Bloomer, B. J., Stehr, J. W., Piety, C. A., Salawitch, R. J., and Dickerson, R. R. (2009). Observed relationships of ozone air pollution with temperature and emissions. Geophys. Res. Lett. 36 (9), L09803. doi:10.1029/2009gl037308
Bourgeois, I., Peischl, J., Neuman, J. A., Brown, S. S., Thompson, C. R., Aikin, K. C., et al. (2021). Large contribution of biomass burning emissions to ozone throughout the global remote troposphere. Proc. Natl. Acad. Sci. U. S. A. 118, e2109628118. doi:10.1073/pnas.2109628118
Bucsela, E. J., Pickering, K. E., Huntemann, T. L., Cohen, R. C., Perring, A., Gleason, J. F., et al. (2010). Lightning-generated NO<i>x</i>seen by the ozone monitoring instrument during NASA's tropical composition, cloud and climate coupling experiment (TC4). J. Geophys. Res. 115, D00J10. doi:10.1029/2009jd013118
Burke, M., Driscoll, A., Heft-Neal, S., Xue, J., Burney, J., and Wara, M. (2021). The changing risk and burden of wildfire in the United States. Proc. Natl. Acad. Sci. U. S. A. 118, e2011048118. doi:10.1073/pnas.2011048118
Cagnazzo, C., Manzini, E., Calvo, N., Douglass, A., Akiyoshi, H., Bekki, S., et al. (2009). Northern winter stratospheric temperature and ozone responses to ENSO inferred from an ensemble of Chemistry Climate Models. Atmos. Chem. Phys. 9, 8935–8948. doi:10.5194/acp-9-8935-2009
Cai, M., An, C., and Guy, C. (2021). A scientometric analysis and review of biogenic volatile organic compound emissions: Research hotspots, new frontiers, and environmental implications. Renew. Sustain. Energy Rev. 149.
Calfapietra, C., Fares, S., Manes, F., Morani, A., Sgrigna, G., and Loreto, F. (2013). Role of biogenic volatile organic compounds (BVOC) emitted by urban trees on ozone concentration in cities: A review. Environ. Pollut. 183, 71–80. doi:10.1016/j.envpol.2013.03.012
Carnerero, C., Pérez, N., Petäjä, T., Laurila, T. M., Ahonen, L. R., Kontkanen, J., et al. (2019). Relating high ozone, ultrafine particles, and new particle formation episodes using cluster analysis. Atmos. Environ. X, 4.
Chameides, W. L. (1986). The role of lightning in the chemistry of the atmosphere. Earth’s Electr. Environ. 70, 80.
Checa-Garcia, R., Hegglin, M. I., Kinnison, D., Plummer, D. A., and Shine, K. P. (2018). Historical tropospheric and stratospheric ozone radiative forcing using the CMIP6 database. Geophys. Res. Lett. 45 (7), 3264–3273. doi:10.1002/2017gl076770
Cheng, N., Li, R., Xu, C., Chen, Z., Chen, D., Meng, F., et al. (2019). Ground ozone variations at an urban and a rural station in Beijing from 2006 to 2017: Trend, meteorological influences and formation regimes. J. Clean. Prod. 235, 11–20.
Cooper, O. R., Parrish, D. D., Ziemke, J., Balashov, N. v., Cupeiro, M., Galbally, I. E., et al. (2014). Global distribution and trends of tropospheric ozone: An observation-based review. Elem. BioOne 2.
Das, S. S., Suneeth, K. v., Ratnam, M. V., Girach, I. A., and Das, S. K. (2019). Upper tropospheric ozone transport from the sub-tropics to tropics over the Indian region during Asian summer monsoon. Clim. Dyn. 52 (7–8), 4567–4581. doi:10.1007/s00382-018-4418-6
Dey, S., Gupta, S., Chakraborty, A., and Sibanda, P. The Department of Environmental Science, The University of Burdwan (2018). Influences of boundary layer phenomena and meteorology on ambient air quality status of an urban area in eastern India. Atm. 31 (1), 69–86. doi:10.20937/atm.2018.31.01.05
Doherty, R. M., Heal, M. R., and O’Connor, F. M. (2017). Climate change impacts on human health over Europe through its effect on air quality. Environ. Health A Glob. Access Sci. Source 16.
Doherty, R. M., Wild, O., Shindell, D. T., Zeng, G., MacKenzie, I. A., Collins, W. J., et al. (2013). Impacts of climate change on surface ozone and intercontinental ozone pollution: A multi-model study. J. Geophys. Res. Atmos. 118 (9), 3744–3763. doi:10.1002/jgrd.50266
Dupuy, J. luc, Fargeon, H., Martin-StPaul, N., Pimont, F., Ruffault, J., Guijarro, M., et al. (2022). Climate change impact on future wildfire danger and activity in southern Europe: A review. Ann. For. Sci. 77, 35. doi:10.1007/s13595-020-00933-5
Eckhardt, S., Stohl, A., Beirle, S., Spichtinger, N., James, P., Forster, C., et al. (2003). The North Atlantic Oscillation controls air pollution transport to the Arctic. Atmos. Chem. Phys. 3, 1769–1778. Available from:. doi:10.5194/acp-3-1769-2003 www.atmos-chem-phys.org/acp/3/1769/
Emma Knowland, K., Doherty, R. M., Hodges, K. I., and Ott, L. E. (2017). The influence of mid-latitude cyclones on European background surface ozone. Atmos. Chem. Phys. 17 (20), 12421–12447. doi:10.5194/acp-17-12421-2017
Fadnavis, S., Roy, C., Chattopadhyay, R., Sioris, C. E., Rap, A., Müller, R., et al. (2018). Transport of trace gases via eddy shedding from the Asian summer monsoon anticyclone and associated impacts on ozone heating rates. Atmos. Chem. Phys. 18 (15), 11493–11506. doi:10.5194/acp-18-11493-2018
Faubert, P., Tiiva, P., Rinnan, Å., Michelsen, A., Holopainen, J. K., and Rinnan, R. (2010). Doubled volatile organic compound emissions from subarctic tundra under simulated climate warming. New Phytol. 187 (1), 199–208. doi:10.1111/j.1469-8137.2010.03270.x
Feng, Z., Hu, T., Tai, A. P. K., and Calatayud, V. (2020). Yield and economic losses in maize caused by ambient ozone in the North China Plain (2014–2017). Sci. Total Environ. 722, 137958. doi:10.1016/j.scitotenv.2020.137958
Feng, Z., Yuan, X., Fares, S., Loreto, F., Li, P., Hoshika, Y., et al. (2019). Isoprene is more affected by climate drivers than monoterpenes: A meta-analytic review on plant isoprenoid emissions. Plant Cell. Environ. 42 (6), 1939–1949. doi:10.1111/pce.13535
Finney, D. L., Doherty, R. M., Wild, O., and Abraham, N. L. (2016). The impact of lightning on tropospheric ozone chemistry using a new global lightning parametrisation.
Finney, D. L., Doherty, R. M., Wild, O., Stevenson, D. S., MacKenzie, I. A., and Blyth, A. M. (2018). A projected decrease in lightning under climate change. Nat. Clim. Change 8 (3), 210–213. doi:10.1038/s41558-018-0072-6
Finney, D. L., Doherty, R. M., Wild, O., Young, P. J., and Butler, A. (2016). Response of lightning NO <i>x</i> emissions and ozone production to climate change: Insights from the Atmospheric Chemistry and Climate Model Intercomparison Project. Geophys. Res. Lett. 43 (10), 5492–5500. doi:10.1002/2016gl068825
Fiore, A. M., Naik, V., and Leibensperger, E. M. (2015). Air quality and climate connections. J. Air Waste Manag. Assoc. 65, 645–685.
Fitzky, A. C., Sandén, H., Karl, T., Fares, S., Calfapietra, C., Grote, R., et al. (2019). The interplay between ozone and urban vegetation—BVOC emissions, ozone deposition, and tree ecophysiology. Front. For. Glob. Change 2.
Friebel, F., and Mensah, A. A. (2019). Ozone concentration versus temperature: Atmospheric aging of soot particles. Langmuir 35 (45), 14437–14450. doi:10.1021/acs.langmuir.9b02372
Fu, T. M., and Tian, H. (2019). Climate change penalty to ozone air quality: Review of current understandings and knowledge gaps. Curr. Pollut. Rep. 5, 159–171.
Garfinkel, C. I., Gordon, A., Oman, L. D., Li, F., Davis, S., and Pawson, S. (2018). Nonlinear response of tropical lower-stratospheric temperature and water vapor to ENSO. Atmos. Chem. Phys. 18 (7), 4597–4615. doi:10.5194/acp-18-4597-2018
Geddes, J. A., Pusede, S. E., and Wong, A. Y. H. (2022). Changes in the relative importance of biogenic isoprene and soil NOx emissions on ozone concentrations in nonattainment areas of the United States. JGR. Atmos. 127 (13). doi:10.1029/2021jd036361
Gedney, N., Huntingford, C., Comyn-Platt, E., and Wiltshire, A. (2019). Significant feedbacks of wetland methane release on climate change and the causes of their uncertainty. Environ. Res. Lett. 14 (8), 084027. doi:10.1088/1748-9326/ab2726
Gillett, N. P., Graf, H. F., and Osborn, T. J. (2003). “Climate change and the North atlantic oscillation,” in Geophysical monograph series (New Jersey: Blackwell Publishing Ltd), 193–209.
Gong, C., Wang, Y., Liao, H., Wang, P., Jin, J., and Han, Z. (2022). Future Co-occurrences of hot days and ozone-polluted days over China under scenarios of shared socioeconomic pathways predicted through a machine-learning approach. Earth's. Future 10 (6). doi:10.1029/2022ef002671
Gu, Y., Li, K., Xu, J., Liao, H., and Zhou, G. (2020). Observed dependence of surface ozone on increasing temperature in Shanghai, China. Atmos. Environ., 221.
Hamouda, M. E., Pasquero, C., and Tziperman, E. (2021). Decoupling of the arctic oscillation and North Atlantic oscillation in a warmer climate. Nat. Clim. Chang. 11 (2), 137–142. doi:10.1038/s41558-020-00966-8
Harper, K. L., and Unger, N. (2018). Global climate forcing driven by altered BVOC fluxes from 1990 to 2010 land cover change in maritime Southeast Asia. Atmos. Chem. Phys. 18 (23), 16931–16952. doi:10.5194/acp-18-16931-2018
He, G., Deng, T., Wu, D., Wu, C., Huang, X., Li, Z., et al. (2021). Characteristics of boundary layer ozone and its effect on surface ozone concentration in shenzhen, China: A case study. Sci. Total Environ. 791, 148044. doi:10.1016/j.scitotenv.2021.148044
Hess, P., Kinnison, D., and Tang, Q. (2015). Ensemble simulations of the role of the stratosphere in the attribution of northern extratropical tropospheric ozone variability. Atmos. Chem. Phys. 15 (5), 2341–2365. doi:10.5194/acp-15-2341-2015
Hess, P. G., and Lamarque, J. F. (2007). Ozone source attribution and its modulation by the Arctic oscillation during the spring months. J. Geophys. Res. 112 (11), D11303. doi:10.1029/2006jd007557
Hong, Q., Liu, C., Hu, Q., Zhang, Y., Xing, C., Su, W., et al. (2021). Evaluating the feasibility of formaldehyde derived from hyperspectral remote sensing as a proxy for volatile organic compounds. Atmos. Res., 264.
Hope, P., Henley, B. J., Gergis, J., Brown, J., and Ye, H. (2017). Time-varying spectral characteristics of ENSO over the last millennium. Clim. Dyn. 49 (5–6), 1705–1727. doi:10.1007/s00382-016-3393-z
Hurteau, M. D., Liang, S., Westerling, A. L. R., and Wiedinmyer, C. (2019). Vegetation-fire feedback reduces projected area burned under climate change. Sci. Rep. 9 (1), 2838. doi:10.1038/s41598-019-39284-1
Iglesias-Suarez, F., Kinnison, D. E., Rap, A., Maycock, A. C., Wild, O., and Young, P. J. (2018). Key drivers of ozone change and its radiative forcing over the 21st century. Atmos. Chem. Phys. 18, 6121–6139.
Ivatt, P. D., Evans, M. J., and Lewis, A. C. (2022). Suppression of surface ozone by an aerosol-inhibited photochemical ozone regime. Nat. Geosci. 15 (7), 536–540. doi:10.1038/s41561-022-00972-9
Jacob, D. J., and Winner, D. A. (2009). Effect of climate change on air quality. Atmos. Environ. 43 (1), 51–63. doi:10.1016/j.atmosenv.2008.09.051
Jaffe, D. A., and Wigder, N. L. (2012). Ozone production from wildfires: A critical review. Atmos. Environ. 51, 1–10.
Jiang, X., Guenther, A., Potosnak, M., Geron, C., Seco, R., Karl, T., et al. (2018). Isoprene emission response to drought and the impact on global atmospheric chemistry TITLE RUNNING HEAD: Drought-induced changes in biogenic isoprene emissions. Available from: http://www.elsevier.com/open-access/userlicense/1.0/.
Jiang, Z., Worden, J. R., Payne, V. H., Zhu, L., Fischer, E., Walker, T., et al. (2016). Ozone export from East Asia: The role of PAN. JGR. Atmos. 121 (11), 6555–6563. doi:10.1002/2016jd024952
Kang, D., Mathur, R., Pouliot, G. A., Gilliam, R. C., and Wong, D. C. (2020). Significant ground-level ozone attributed to lightning-induced nitrogen oxides during summertime over the Mountain West States. npj Clim. Atmos. Sci. 3 (1), 6. doi:10.1038/s41612-020-0108-2
Kilifarska, N. A., Bakhmutov, V. G., and Melnyk, G. v. (2020). “Geomagnetic field and internal climate modes,” in The hidden link between earth’s magnetic field and climate (Elsevier), 199–210.
Kinney, P. L. (2018). Interactions of climate change, air pollution, and human health. Curr. Environ. health Rep. 5, 179–186.
Koffi, E. N., Bergamaschi, P., Alkama, R., and Cescatti, A. (2020). An observation-constrained assessment of the climate sensitivity and future trajectories of wetland methane emissions. Available from: https://www.science.org.
Kotchenruther, R. A., Jaffe, D. A., and Jaeglé, L. (2001). Ozone photochemistry and the role of peroxyacetyl nitrate in the springtime northeastern pacific troposphere: Results from the photochemical ozone budget of the eastern North Pacific atmosphere (PHOBEA) campaign. J. Geophys. Res. 106 (D22), 28731–28742. doi:10.1029/2000jd000060
Kuchar, A., Sacha, P., Eichinger, R., Jacobi, C., Pisoft, P., and Rieder, H. E. (2022). On the impact of Himalaya-induced gravity waves on the polar vortex, Rossby wave activity and ozone. EGU Interact. community Platf. doi:10.5194/egusphere-2022-474
Kumar, K. N., Sharma, S. K., Naja, M., and Phanikumar, D. v. (2020). A Rossby wave breaking-induced enhancement in the tropospheric ozone over the Central Himalayan region. Atmos. Environ., 224.
Kunze, M., Braesicke, P., Langematz, U., and Stiller, G. (2016). Interannual variability of the boreal summer tropical UTLS in observations and CCMVal-2 simulations. Atmos. Chem. Phys. 16 (13), 8695–8714. doi:10.5194/acp-16-8695-2016
Li, D., Vogel, B., Müller, R., Bian, J., Günther, G., Li, Q., et al. (2018). High tropospheric ozone in Lhasa within the Asian summer monsoon anticyclone in 2013: Influence of convective transport and stratospheric intrusions. Atmos. Chem. Phys. 18 (24), 17979–17994. doi:10.5194/acp-18-17979-2018
Li, K., Jacob, D. J., Shen, L., Lu, X., de Smedt, I., and Liao, H. (2020). Increases in surface ozone pollution in China from 2013 to 2019: Anthropogenic and meteorological influences. Atmos. Chem. Phys. 20 (19), 11423–11433. doi:10.5194/acp-20-11423-2020
Li, Y., Lau, A. K. H., Fung, J. C. H., Zheng, J., and Liu, S. (2013). Importance of NOx control for peak ozone reduction in the Pearl River Delta region. J. Geophys. Res. Atmos. 118 (16), 9428–9443. doi:10.1002/jgrd.50659
Lin, J., and Qian, T. (2019). Impacts of the ENSO lifecycle on stratospheric ozone and temperature. Geophys. Res. Lett. 46 (17–18), 10646–10658. doi:10.1029/2019gl083697
Lin, M., Horowitz, L. W., Payton, R., Fiore, A. M., and Tonnesen, G. (2016). US surface ozone trends and extremes from 1980 to 2014: Quantifying the roles of rising asian emissions, domestic controls, wildfires, and climate. Atmos. Chem. Phys. 17, 2943–2970. doi:10.5194/acp-17-2943-2017
Lin, Y., Jiang, F., Zhao, J., Zhu, G., He, X., Ma, X., et al. (2018). Impacts of O3 on premature mortality and crop yield loss across China. Atmos. Environ. 194, 41–47. doi:10.1016/j.atmosenv.2018.09.024
Lindaas, J., Farmer, D. K., Pollack, I. B., Abeleira, A., Flocke, F., Roscioli, R., et al. (2017). Changes in ozone and precursors during two aged wildfire smoke events in the Colorado Front Range in summer 2015. Atmos. Chem. Phys. 17 (17), 10691–10707. doi:10.5194/acp-17-10691-2017
Liu, M., and Hu, D. (2021). Different relationships between arctic oscillation and ozone in the stratosphere over the arctic in january and february. Atmos. (Basel) 12 (2), 129–142. doi:10.3390/atmos12020129
Liu, Y., Liu, Y., Fu, J., Yang, C. E., Dong, X., Tian, H., et al. (2022). Projection of future wildfire emissions in Western USA under climate change: Contributions from changes in wildfire, fuel loading and fuel moisture. Int. J. Wildland Fire, 1–13.
Liu, Y., Shen, H., Mu, J., Li, H., Chen, T., Yang, J., et al. (2021). Formation of peroxyacetyl nitrate (PAN) and its impact on ozone production in the coastal atmosphere of Qingdao, North China. Sci. Total Environ. 778, 146265. doi:10.1016/j.scitotenv.2021.146265
Liu, Y., and Wang, T. (2020). Worsening urban ozone pollution in China from 2013 to 2017 - Part 1: The complex and varying roles of meteorology. Atmos. Chem. Phys. 20 (11), 6305–6321. doi:10.5194/acp-20-6305-2020
Lu, X., Ye, X., Zhou, M., Zhao, Y., Weng, H., Kong, H., et al. (2021). The underappreciated role of agricultural soil nitrogen oxide emissions in ozone pollution regulation in North China. Nat. Commun. 12 (1), 5021. doi:10.1038/s41467-021-25147-9
Lu, X., Zhang, L., Liu, X., Gao, M., Zhao, Y., and Shao, J. (2018). Lower tropospheric ozone over India and its linkage to the South Asian monsoon. Atmos. Chem. Phys. 18 (5), 3101–3118. doi:10.5194/acp-18-3101-2018
Lu, X., Zhang, L., and Shen, L. (2019). Meteorology and climate influences on tropospheric ozone: A review of natural sources, chemistry, and transport patterns. Curr. Pollut. Rep. 5, 238–260.
Lu, X., Zhang, L., Yue, X., Zhang, J., Jaffe, D. A., Stohl, A., et al. (2016). Wildfire influences on the variability and trend of summer surface ozone in the mountainous Western United States. Atmos. Chem. Phys. 16 (22), 14687–14702. doi:10.5194/acp-16-14687-2016
Maher, N., Matei, D., Milinski, S., and Marotzke, J. (2018). ENSO change in climate projections: Forced response or internal variability? Geophys Res. Lett. (2011), 11390–11398.
Mann, M. E. (2021). Beyond the hockey stick: Climate lessons from the Common Era. Proc. Natl. Acad. Sci. U. S. A. 118 (39), e2112797118. doi:10.1073/pnas.2112797118
Matson, P., and Meixner, F. (1996). NOx EMISSIONS FROM SOIL: Implications for Air Quality Modeling in Agricultural Regions Cite this paper Related papers Soil-air exchange of nit ric oxide: An overview of processes, environment al fact ors, and modeli.
Mcclure, C. D., and Jaffe, D. A. (2018). Investigation of high ozone events due to wildfire smoke in an urban area 2 3. Atmos. Environ. 194, 146–157.
Meehl, G. A., Tebaldi, C., Tilmes, S., Lamarque, J. F., Bates, S., Pendergrass, A., et al. (2018). Future heat waves and surface ozone. Environ. Res. Lett. 13 (6), 064004. doi:10.1088/1748-9326/aabcdc
Melton, J. R., Wania, R., Hodson, E. L., Poulter, B., Ringeval, B., Spahni, R., et al. (2013). Present state of global wetland extent and wetland methane modelling: Conclusions from a model inter-comparison project (WETCHIMP). Biogeosciences 10 (2), 753–788. doi:10.5194/bg-10-753-2013
Meul, S., Langematz, U., Kröger, P., Oberländer-Hayn, S., and Jöckel, P. (2018). Future changes in the stratosphere-to-troposphere ozone mass flux and the contribution from climate change and ozone recovery. Atmos. Chem. Phys. 18 (10), 7721–7738. doi:10.5194/acp-18-7721-2018
Monks, P. S., Archibald, A. T., Colette, A., Cooper, O., Coyle, M., Derwent, R., et al. (2015). Tropospheric ozone and its precursors from the urban to the global scale from air quality to short-lived climate forcer. Atmos. Chem. Phys. 15, 8889–8973.
Murray, L. T., Logan, J. A., and Jacob, D. J. (2013). Interannual variability in tropical tropospheric ozone and OH: The role of lightning. J. Geophys. Res. Atmos. 118 (19), 468480–480. doi:10.1002/jgrd.50857
Nazarenko, L. S., Tausnev, N., Russell, G. L., Rind, D., Miller, R. L., Schmidt, G. A., et al. (2022). Future climate change under RCP emission scenarios with GISS ModelE2. J. Adv. Model. Earth Syst. 14 (7), 244–267. doi:10.1002/2014ms000403
Nowack, P. J., Braesicke, P., Luke Abraham, N., and Pyle, J. A. (2017). On the role of ozone feedback in the ENSO amplitude response under global warming. Geophys. Res. Lett. 44 (8), 3858–3866. doi:10.1002/2016gl072418
Olsen, M. A., Manney, G. L., and Liu, J. (2019). The ENSO and QBO impact on ozone variability and stratosphere-troposphere exchange relative to the subtropical jets. JGR. Atmos. 124 (13), 7379–7392. doi:10.1029/2019jd030435
Oman, L. D., Douglass, A. R., Ziemke, J. R., Rodriguez, J. M., Waugh, D. W., and Nielsen, J. E. (2013). The ozone response to enso in aura satellite measurements and a chemistry-climate simulation. J. Geophys. Res. Atmos. 118 (2), 965–976. doi:10.1029/2012jd018546
Oman, L. D., Ziemke, J. R., Douglass, A. R., Waugh, D. W., Lang, C., Rodriguez, J. M., et al. (2011). The response of tropical tropospheric ozone to ENSO. Geophys. Res. Lett. 38 (13). doi:10.1029/2011gl047865
Orru, H., Åström, C., Andersson, C., Tamm, T., Ebi, K. L., and Forsberg, B. (2019). Ozone and heat-related mortality in Europe in 2050 significantly affected by changes in climate, population and greenhouse gas emission. Environ. Res. Lett. 14 (7), 074013. doi:10.1088/1748-9326/ab1cd9
Park, M., Randel, W. J., Gettelman, A., Massie, S. T., and Jiang, J. H. (2007). Transport above the asian summer monsoon anticyclone inferred from aura microwave limb sounder tracers. J. Geophys. Res. 112 (16), D16309. doi:10.1029/2006jd008294
Pausata, F. S. R., Pozzoli, L., Vignati, E., and Dentener, F. J. (2012). North Atlantic Oscillation and tropospheric ozone variability in Europe: Model analysis and measurements intercomparison. Atmos. Chem. Phys. 12 (14), 6357–6376. doi:10.5194/acp-12-6357-2012
Peiro, H., Emili, E., Cariolle, D., Barret, B., and le Flochmoën, E. (2018). Multi-year assimilation of IASI and MLS ozone retrievals: Variability of tropospheric ozone over the tropics in response to ENSO. Atmos. Chem. Phys. 18 (9), 6939–6958. doi:10.5194/acp-18-6939-2018
Peñuelas, J., and Staudt, M. (2010). BVOCs and global change. Trends Plant Sci. 15, 133–144. doi:10.1016/j.tplants.2009.12.005
Porter, W. C., and Heald, C. L. (2019). The mechanisms and meteorological drivers of the summertime ozone–temperature relationship. Atmos. Chem. Phys. 19 (21), 13367–13381. doi:10.5194/acp-19-13367-2019
IPCC (2022). “Climate change 2022: Impacts, adaptation, and vulnerability,” in Contribution of working group II to the sixth assessment report of the intergovernmental Panel on climate change. Editors Pörtner, H.-O., Roberts, D. C., Tignor, M., Poloczanska, E. S., Mintenbeck, K., Alegría, A., et al. (Cambridge, UK: Cambridge University Press), 3056. doi:10.1017/9781009325844
Qu, Y., Voulgarakis, A., Wang, T., Kasoar, M., Wells, C., Yuan, C., et al. (2021). A study of the effect of aerosols on surface ozone through meteorology feedbacks over China. Atmos. Chem. Phys. 21 (7), 5705–5718. doi:10.5194/acp-21-5705-2021
Racherla, P. N., and Adams, P. J. (2008). The response of surface ozone to climate change over the Eastern United States. Atmos. Chem. Phys. 8, 871–885. doi:10.5194/acp-8-871-2008
Randel, W. J., and Park, M. (2006). Deep convective influence on the Asian summer monsoon anticyclone and associated tracer variability observed with Atmospheric Infrared Sounder (AIRS). J. Geophys. Res. 111 (12), D12314. doi:10.1029/2005jd006490
Ratnam, M. V., Ravindra Babu, S., Das, S. S., Basha, G., Krishnamurthy, B. v., and Venkateswararao, B. (2016). Effect of tropical cyclones on the Stratosphere-Troposphere Exchange 6 observed using satellite observations over north Indian Ocean. Atmos. Chem. Phys..
Rind, D., Perlwitz, J., and Lonergan, P. (2005). AO/NAO response to climate change: 1. Respective influences of stratospheric and tropospheric climate changes. J. Geophys. Res. 110 (12), D12107–D12115. doi:10.1029/2004jd005103
Romer, P. S., Duffey, K. C., Wooldridge, P. J., Edgerton, E., Baumann, K., Feiner, P. A., et al. (2018). Effects of temperature-dependent NO&lt;sub&gt;<i&gt;x&lt;/i&gt;</sub&gt; emissions on continental ozone production. Atmos. Chem. Phys. 18 (4), 2601–2614. doi:10.5194/acp-18-2601-2018
Rowlinson, M. J., Rap, A., Arnold, S. R., Pope, R. J., Chipperfield, M. P., Mcnorton, J., et al. (2019). Impact of El Niño-Southern Oscillation on the interannual variability of methane and tropospheric ozone. Atmos. Chem. Phys. 19 (13), 8669–8686. doi:10.5194/acp-19-8669-2019
Russo, M. R., Kerridge, B. J., Abraham, N. L., Keeble, J., Latter, B. G., Siddans, R., et al. (2022). Seasonal, interannual and decal variability of Tropospheric Ozone in the North Atlantic: Comparison of UM-UKCA and remote sensing observations for 2005-2018. Available from. doi:10.5194/acp-2022-99
Shankar Das, S., Venkat Ratnam, M., Narasimhan Uma, K., Venkata Subrahmanyam, K., Asatar Girach, I., Kumar Patra, A., et al. (2016). Influence of tropical cyclones on tropospheric ozone: Possible implications. Atmos. Chem. Phys. 16 (8), 4837–4847. doi:10.5194/acp-16-4837-2016
Sekiya, T., and Sudo, K. (2012). Role of meteorological variability in global tropospheric ozone during 1970-2008. J. Geophys. Res. Atmos. 117.
Sha, T., Ma, X., Zhang, H., Janechek, N., Wang, Y., Wang, Y., et al. (2021). Impacts of soil NO<i>x</i> emission on O3 air quality in rural California. Environ. Sci. Technol. 55 (10), 7113–7122. doi:10.1021/acs.est.0c06834
Shang, L., Luo, J., and Wang, C. (2021). Ozone variation trends under different CMIP6 scenarios. Atmos. (Basel) 12 (1), 112. doi:10.3390/atmos12010112
Shen, L., and Mickley, L. J. (2017). Effects of El Niño on summertime ozone air quality in the eastern United States. Geophys. Res. Lett. 44 (24), 12543–12550. doi:10.1002/2017gl076150
Shen, L., Mickley, L. J., and Tai, A. P. K. (2015). Influence of synoptic patterns on surface ozone variability over the eastern United States from 1980 to 2012. Atmos. Chem. Phys. 15 (19), 10925–10938. doi:10.5194/acp-15-10925-2015
Shindell, D. T., Walter, B. P., and Faluvegi, G. (2004). Impacts of climate change on methane emissions from wetlands. Geophys. Res. Lett. 31 (21), 31. doi:10.1029/2004gl021009
Sillman, S., and He, D. (2002). Some theoretical results concerning O3-NO<i>x</i>-VOC chemistry and NO<i>x</i>-VOC indicators. J. Geophys. Res. 107 (22), 4659. doi:10.1029/2001jd001123
Silva, R. A., West, J. J., Zhang, Y., Anenberg, S. C., Lamarque, J. F., Shindell, D. T., et al. (2013). Global premature mortality due to anthropogenic outdoor air pollution and the contribution of past climate change. Environ. Res. Lett. 8 (3), 034005. doi:10.1088/1748-9326/8/3/034005
Skeie, R. B., Myhre, G., Hodnebrog, O., Cameron-Smith, P. J., Deushi, M., Hegglin, M. I., et al. (2020). Historical total ozone radiative forcing derived from CMIP6 simulations. npj Clim. Atmos. Sci. 3 (1), 32. doi:10.1038/s41612-020-00131-0
Sporre, M. K., Blichner, S. M., Karset, I. H. H., Makkonen, R., and Berntsen, T. K. (2019). BVOC-aerosol-climate feedbacks investigated using NorESM. Atmos. Chem. Phys. 19 (7), 4763–4782. doi:10.5194/acp-19-4763-2019
Squire, O. J., Archibald, A. T., Abraham, N. L., Beerling, D. J., Hewitt, C. N., Lathière, J., et al. (2014). Influence of future climate and cropland expansion on isoprene emissions and tropospheric ozone. Atmos. Chem. Phys. 14 (2), 1011–1024. doi:10.5194/acp-14-1011-2014
Sun, M., Zhou, Y., Wang, Y., Zheng, X., Cui, J., Zhang, D., et al. (2021). Seasonal discrepancies in peroxyacetyl nitrate (PAN) and its correlation with ozone and PM2.5: Effects of regional transport from circumjacent industrial cities. Sci. Total Environ. 785, 147303. doi:10.1016/j.scitotenv.2021.147303
Thornhill, G., Collins, W., Olivié, D., Skeie R, B., Archibald, A., Bauer, S., et al. (2021). Climate-driven chemistry and aerosol feedbacks in CMIP6 Earth system models. Atmos. Chem. Phys. 21 (2), 1105–1126. doi:10.5194/acp-21-1105-2021
Thornton, J. A., Wooldridge, P. J., Cohen, R. C., Martinez, M., Harder, H., Brune, W. H., et al. (2002). Ozone production rates as a function of NOx abundances and HOx production rates in the Nashville urban plume. J. Geophys. Res. 107 (12), 4146. doi:10.1029/2001jd000932
Trenberth, K. E., Dai, A., Rasmussen, R. M., and Parsons, D. B. (2013). The changing character of precipitation. Bull. Am. Meteorological Soc. 84, 1205–1217. doi:10.1175/BAMS-84-9-1205
Trowbridge, A. M., Stoy, P. C., and Phillips, R. P. (2020). Soil biogenic volatile organic compound flux in a mixed hardwood forest: Net uptake at warmer temperatures and the importance of mycorrhizal associations. J. Geophys. Res. Biogeosci. 125 (4). doi:10.1029/2019jg005479
Turnock, S. T., Wild, O., Dentener, F. J., Davila, Y., Emmons, L. K., Flemming, J., et al. (2018). The impact of future emission policies on tropospheric ozone using a parameterised approach. Atmos. Chem. Phys. 18 (12), 8953–8978. doi:10.5194/acp-18-8953-2018
Turnock, S. T., Wild, O., Sellar, A., and O’Connor, F. M. (2019). 300 years of tropospheric ozone changes using CMIP6 scenarios with a parameterised approach. Atmos. Environ. 213, 686–698. doi:10.1016/j.atmosenv.2019.07.001
Unger, N. (2014). On the role of plant volatiles in anthropogenic global climate change. Geophys. Res. Lett. 41 (23), 8563–8569. doi:10.1002/2014gl061616
Verma, S., Yadava, P. K., Lal, D. M., Mall, R. K., Kumar, H., and Payra, S. (2021). Role of lightning NOx in ozone formation: A review. Pure Appl. Geophys. 178 (4), 1425–1443. doi:10.1007/s00024-021-02710-5
Wang, H., Wu, Q., Guenther, A. B., Yang, X., Wang, L., Xiao, T., et al. (2021). A long-term estimation of biogenic volatile organic compound (BVOC) emission in China from 2001-2016: The roles of land cover change and climate variability. Atmos. Chem. Phys. 21 (6), 4825–4848. doi:10.5194/acp-21-4825-2021
Wang, Y., Hu, J., Huang, L., Li, T., Yue, X., Xie, X., et al. (2022). Projecting future health burden associated with exposure to ambient PM2.5 and Ozone in China under different climate scenarios. Environ. Int. 169, 107542. doi:10.1016/j.envint.2022.107542
Wang, Y., Shen, J., Wang, H., Wu, G., Chen, Y., Liu, T., et al. (2021). Unexpected seasonal variations and high levels of ozone observed at the summit of Nanling Mountains: Impact of Asian monsoon on southern China. Atmos. Environ., 253.
Weber, J., Archer-Nicholls, S., Abraham, L., Shin, Y. M., Griiths, P., Grosvenor, D., et al. (2022). Chemistry-driven changes strongly innuence climate forcing from vegetation emissions. doi:10.21203/rs.3.rs-1646168/v1
Weber, J., Archer-Nicholls, S., Abraham, N. L., Shin, Y. M., Bannan, T. J., Percival, C. J., et al. (2021). Improvements to the representation of BVOC chemistry-climate interactions in UKCA (v11.5) with the CRI-Strat 2 mechanism: Incorporation and evaluation. Geosci. Model Dev. 14 (8), 5239–5268. doi:10.5194/gmd-14-5239-2021
Weng, H., Lin, J., Martin, R., Millet, D. B., Jaeglé, L., Ridley, D., et al. (2020). Global high-resolution emissions of soil NOx, sea salt aerosols, and biogenic volatile organic compounds. Sci. Data 7 (1), 148. doi:10.1038/s41597-020-0488-5
Xiong, X., Liu, X., Wu, W., Knowland, K. E., Yang, Q., Welsh, J., et al. (2022). Satellite observation of stratospheric intrusions and ozone transport using CrIS on SNPP. Atmos. Environ., 273.
Xu, J., Zhang, Y., Zheng, S., and He, Y. (2012). Aerosol effects on ozone concentrations in Beijing: A model sensitivity study. J. Environ. Sci. 24 (4), 645–656. doi:10.1016/s1001-0742(11)60811-5
Xu, X. (2021). Recent advances in studies of ozone pollution and impacts in China: A short review. Curr. Opin. Environ. Sci. Health 19.
Xue, L., Ding, A., Cooper, O., Huang, X., Wang, W., Zhou, D., et al. (2021). ENSO and Southeast Asian biomass burning modulate subtropical trans-Pacific ozone transport. Natl. Sci. Rev. 8 (6), nwaa132. doi:10.1093/nsr/nwaa132
Yáñez-Serrano, A. M., Bourtsoukidis, E., Alves, E. G., Bauwens, M., Stavrakou, T., Llusià, J., et al. (2020). Amazonian biogenic volatile organic compounds under global change. Glob. Change Biol. 26, 4722–4751.
Yang, L., Luo, H., Yuan, Z., Zheng, J., Huang, Z., Li, C., et al. (2019). Quantitative impacts of meteorology and precursor emission changes on the long-term trend of ambient ozone over the Pearl River Delta, China, and implications for ozone control strategy. Atmos. Chem. Phys. 19 (20), 12901–12916. doi:10.5194/acp-19-12901-2019
Yang, Y., Li, M., Wang, H., Li, H., Wang, P., Li, K., et al. (2022). ENSO modulation of summertime tropospheric ozone over China. Environ. Res. Lett. 17 (3), 034020. doi:10.1088/1748-9326/ac54cd
Yang, Y., Liao, H., and Li, J. (2014). Impacts of the East Asian summer monsoon on interannual variations of summertime surface-layer ozone concentrations over China. Atmospheric Chem. Phys. 14 (3), 6867–6879.
Yu, H., Holopainen, J. K., Kivimäenpää, M., Virtanen, A., and Blande, J. D. (2021). Potential of climate change and herbivory to affect the release and atmospheric reactions of bvocs from boreal and subarctic forests. Molecules 26.
Zanis, P., Akritidis, D., Turnock, S., Naik, V., Szopa, S., Georgoulias, A. K., et al. (2022). Climate change penalty and benefit on surface ozone: A global perspective based on cmip6 Earth system models. Environ. Res. Lett. 17 (2), 024014. doi:10.1088/1748-9326/ac4a34
Zhan, C., and Xie, M. (2022). Land use and anthropogenic heat modulate ozone by meteorology: A perspective from the yangtze river delta region. Atmos. Chem. Phys. 22 (2), 1351–1371. doi:10.5194/acp-22-1351-2022
Zhan, J., Feng, Z., Liu, P., He, X., He, Z., Chen, T., et al. (2021). Ozone and SOA formation potential based on photochemical loss of VOCs during the Beijing summer. Environ. Pollut. 285, 117444. doi:10.1016/j.envpol.2021.117444
Zhang, G., Jing, S., Xu, W., Gao, Y., Yan, C., Liang, L., et al. (2021). Simultaneous observation of atmospheric peroxyacetyl nitrate and ozone in the megacity of Shanghai, China: Regional transport and thermal decomposition. Environ. Pollut. 274, 116570. doi:10.1016/j.envpol.2021.116570
Zhang, J. J., Wei, Y., and Fang, Z. (2019). Ozone pollution: A major health hazard worldwide. Front. Immunol. 10.
Zhang, L., Li, Q. B., Jin, J., Liu, H., Livesey, N., Jiang, J. H., et al. (2011). Impacts of 2006 Indonesian fires and dynamics on tropical upper tropospheric carbon monoxide and ozone. Atmos. Chem. Phys. 11, 10929–10946.
Zhang, X., Xiao, X., Wang, F., Brasseur, G., Chen, S., Wang, J., et al. (2022). Observed sensitivities of PM2.5 and O3 extremes to meteorological conditions in China and implications for the future. Environ. Int., 168.
Zhang, X., Yin, Y., van der A, R., Eskes, H., van Geffen, J., Li, Y., et al. (2022). Influence of convection on the upper-tropospheric O&lt;sub&gt;3&lt;/sub&gt; and NO&lt;sub&gt;<i&gt;x&lt;/i&gt;</sub&gt; budget in southeastern China. Atmos. Chem. Phys. 22 (9), 5925–5942. doi:10.5194/acp-22-5925-2022
Zhang, Z., Zimmermann, N. E., Stenke, A., Li, X., Hodson, E. L., Zhu, G., et al. (2017). Emerging role of wetland methane emissions in driving 21st century climate change. Proc. Natl. Acad. Sci. U. S. A. 114 (36), 9647–9652. doi:10.1073/pnas.1618765114
Zhao, A., Stevenson, D. S., and Bollasina, M. A. (2019). Climate forcing and response to greenhouse gases, aerosols, and ozone in CESM1. J. Geophys. Res. Atmos. 124 (24), 13876–13894. doi:10.1029/2019jd030769
Keywords: tropospheric ozone, ozone precursors, climate change, long-range transport, BVOCs, ENSO, LNOx
Citation: Dewan S and Lakhani A (2022) Tropospheric ozone and its natural precursors impacted by climatic changes in emission and dynamics. Front. Environ. Sci. 10:1007942. doi: 10.3389/fenvs.2022.1007942
Received: 31 July 2022; Accepted: 25 November 2022;
Published: 15 December 2022.
Edited by:
Ravi Kumar Kunchala, Indian Institute of Technology Delhi, IndiaReviewed by:
Chaitri Roy, Indian Institute of Tropical Meteorology (IITM), IndiaCopyright © 2022 Dewan and Lakhani. This is an open-access article distributed under the terms of the Creative Commons Attribution License (CC BY). The use, distribution or reproduction in other forums is permitted, provided the original author(s) and the copyright owner(s) are credited and that the original publication in this journal is cited, in accordance with accepted academic practice. No use, distribution or reproduction is permitted which does not comply with these terms.
*Correspondence: Anita Lakhani, YW5pdGEubGFraGFuaTAxQGdtYWlsLmNvbQ==
Disclaimer: All claims expressed in this article are solely those of the authors and do not necessarily represent those of their affiliated organizations, or those of the publisher, the editors and the reviewers. Any product that may be evaluated in this article or claim that may be made by its manufacturer is not guaranteed or endorsed by the publisher.
Research integrity at Frontiers
Learn more about the work of our research integrity team to safeguard the quality of each article we publish.