 Huabing Ke
 Sunling Gong2*
 Jianjun He
95% of researchers rate our articles as excellent or good
Learn more about the work of our research integrity team to safeguard the quality of each article we publish.
Find out more
ORIGINAL RESEARCH article
Front. Environ. Sci. , 23 September 2022
Sec. Atmosphere and Climate
Volume 10 - 2022 | https://doi.org/10.3389/fenvs.2022.1007530
This article is part of the Research Topic Machine-Learning in Studies of Atmospheric Environment and Climate Change View all 6 articles
As a main technical tool, the air quality numerical model is widely used in the forecasts of atmospheric pollutants, and its development is of great significance to the atmospheric environment and human health. In this study, a hybrid XGBoost-SMOTE model has been developed and applied for the optimization of forecasted PM2.5 and O3 concentrations from the Chinese operational air quality forecasting model - CMA Unified Atmospheric Chemistry Environment model (CUACE), which automatically finds the optimal hyperparameters and features without human intervention. Supported by a knowledge base including the ground-observed, CUACE-forecasted pollutants and meteorological data as well as some auxiliary variables, and based on the evaluation analysis of 46 selected key national cities, it was found that the XGBoost-SMOTE model can achieve satisfactory optimization effects for the operational model, especially the significant improvement of the pollutant extreme values on high-pollution days. The results show that after optimization, the 5-day average correlation coefficient (R), mean error (ME) and root mean square error (RMSE) values can reach 0.87, 10.34 µg/m3 and 16.53 µg/m3 for PM25, and 0.89, 14.53 µg/m3 and 18.83 µg/m3 for O3, far better than those from original CUACE model and XGBoost model. Furthermore, the optimization of the spatial distribution of pollutants from the CUACE model and the impact analysis of the input features by the SHAP method were also explored. The developed hybrid model unveils a good application prospect in the field of environmental meteorology forecasts.
With the continuous development of China’s economy and the acceleration of industrialization and urbanization in the past 40 years, a large number of anthropogenic gases and aerosol particles have been mitted, making the problem of air pollution increasingly serious. Especially in recent years, the frequent occurrence of haze and photochemical pollution incidents in various regions of China has made air quality a major national strategic issue and received extensive attention from the government and the public (He et al., 2017; Zhong et al., 2019). At present, among the six common air pollutants, PM2.5 and O3 are the most concerned, which have important impacts not only on the atmospheric environment but also on human health, the earth’s radiation balance and ecosystems (Forouzanfar et al., 2016). Studies have shown that chronic exposure to high levels of PM2.5 and O3 in humans can lead to respiratory diseases, diabetes, asthma, myocardial infarction, and cardiovascular disease (Goldberg et al., 2013; Cohen et al., 2017; Requia et al., 2017). In addition, the global climate can also be affected by PM2.5 and O3 by altering the Earth’s radiative energy balance (Fu et al., 2019). Moreover, high concentrations of O3 can inhibit vegetation growth and reduce crop yields (Sitch et al., 2007).
At present, through government action plans such as the Air Pollution Prevention and Control Action Plan and the Three-Year Plan on Defending the Blue Sky, China’s air pollution control has achieved remarkable results. Data from the Ministry of Ecology and Environment (MEEC) (available at http://www.mep.gov.cn) shows that the PM2.5 concentration and the number of heavy pollution days have been significantly reduced, and ambient air quality has been significantly improved (Zheng et al., 2018; Fu et al., 2019; Zhai et al., 2019). However, the concentration of PM2.5 has not yet reached the transition target-I standard of 35 µg/m3 proposed by the World Health Organization (WHO). At the same time, the concentration of O3 showed a trend of rapid increase and spread (Zheng et al., 2018; Gong et al., 2022). The combined air pollution represented by high concentrations of PM2.5 and O3 is becoming one of the bottlenecks restricting the continuous improvement of the atmospheric environment, which has attracted widespread attention from scientists. Therefore, accurate forecasting of atmospheric pollutant concentrations is of great significance for atmospheric environment monitoring and human health protection.
As a mainstream tool to study air quality, numerical models use meteorological principles and mathematical methods to simulate various physical and chemical processes such as emission, diffusion, transport, transformation, and deposition in the actual atmosphere to analyze the temporal and spatial evolution of air pollution and internal mechanism (Gong et al., 2003; Grell et al., 2005; Werner et al., 2016). However, the current numerical models also have some limitations. For example, uncertain factors such as initial meteorological fields, boundary conditions, emission inventories, and physical and chemical parameterization schemes will affect the simulation results of the model, resulting in certain errors (Ritter et al., 2012; Li et al., 2013; Gavidia-Calderón et al., 2018; Bao et al., 2019; Peng et al., 2021).
In order to overcome the above limitations and uncertainties of numerical models, and with the development of information science and artificial intelligence technology, a large number of studies have begun to utilize machine learning or deep learning methods to optimize model output products. Currently, many surveys employ multi-source data fusion techniques, based on air quality numerical models and more datasets, such as satellite aerosol optical depth (AOD) data and other auxiliary data with long-term records and high resolution, to improve pollutant concentrations or spatiotemporal distributions by using machine learning models of random forests, neural networks or extreme gradient boosting model (Fang et al., 2016; Ma et al., 2016; Lin et al., 2018; Xiao et al., 2018; Xue et al., 2019; Geng et al., 2021; Huang et al., 2021; Wei et al., 2021; Zhong et al., 2021). However, due to the timeliness of datasets, these studies can only address the optimization of historical or near real-time model simulations, making them infeasible in operational air quality numerical models. In addition, previous studies usually have significant underestimation of extreme PM2.5 concentrations on high-pollution days due to the small number of high-pollution samples, leading to their associations being masked by normal samples (Xue et al., 2019; Wei et al., 2020).
In this study, a hybrid XGBoost-SMOTE model was developed, which can achieve the goal of automatically selecting the optimal hyperparameter and features without human intervention, combined with ground-observed pollutant data, CUACE-forecasted meteorological data, CUACE-forecasted pollutant data and some auxiliary variables to optimize PM2.5 and O3 concentrations of the Chinese operational CUACE model forecasts. Additionally, the XGBoost-SMOTE model can balance the uneven proportion of high-pollution and normal samples, significantly improving the optimization performance of the numerical model at high concentration levels.
The structure of the paper is organized as follows: Section 2 shows the framework of the proposed XGBoost-SMOTE model and briefly introduces the knowledge base, CUACE model, XGBoost algorithm, and SMOTE algorithm. The results and discussion, which include performance evaluation of XGBoost-SMOTE model optimization, spatial distribution optimization of CUACE model, and feature analysis are illustrated in Section 3. Finally, the conclusion are presented in Section 5.
This study is based on the developed hybrid XGBoost-SMOTE model to optimize PM2.5 and O3 concentrations from the operational CUACE model forecasts. The framework of the XGBoost-SMOTE model is shown in Figure 1 and consists of three main components.
(1) The knowledge base: The core basis of the machine learning system, in this study ground-observed pollutant data, CUACE-forecasted meteorological data, CUACE-forecasted pollutant data, and some auxiliary variables are included.
(2) The data preprocessing: The data from the knowledge base is combined by date, and then goes through data cleaning, normalization, and data division of training and test sets. In addition, the SMOTE technique is used here to reconstruct samples based on a high-pollution indicator to improve the forecasting performance of pollutants concentration on high-pollution days.
(3) The XGBoost algorithm: The processed sample data will enter this component, which includes the modules of feature selection, hyperparameter selection, performance evaluation, feature importance analysis and system memory, achieving the function of automatically finding the best “hyperparameter + features” without manual intervention for different pollutants and cities.
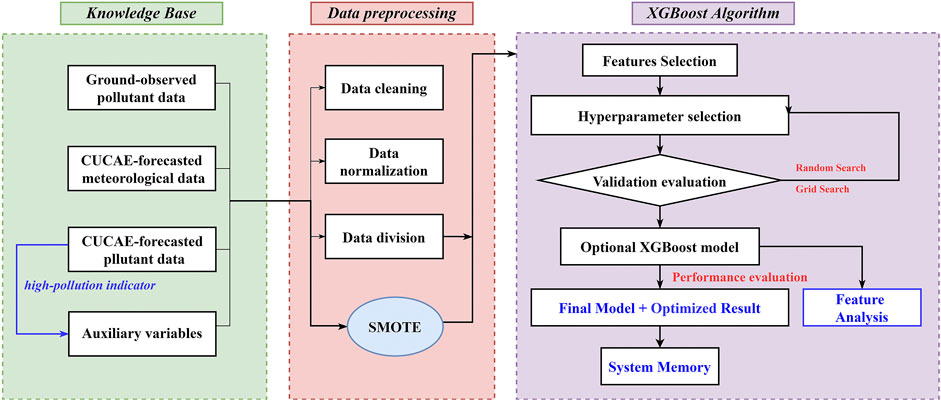
FIGURE 1. The framework of the hybrid XGBoost-SMOTE model.
CMA Unified Atmospheric Chemistry Environment model (CUACE), a national haze numerical forecast operation system, which couples chemical weather models online based on Mesoscale Model version 5 (MM5), and has been applied to the national environmental meteorology operation (Gong and Zhang, 2008; Zhou et al., 2012). CUACE contains four main functional subsystems, namely emissions, gas phase chemistry, aerosol microphysics and data assimilation (Niu et al., 2008). In the aerosol module, seven aerosol components, i.e., sulfate, nitrate, ammonium salts, sea salt, black carbon, organic carbon, and sand/dust, are divided into 12 size bins, where an internal mixture is assumed for all aerosol components and the external mix is adopted between different bins for the particle number density. The major aerosol processes in the atmosphere of production, transport, moisture absorption growth, collision, nucleation, condensation, dry and wet deposition, removal in and under clouds, and aerosol-cloud interaction are involved in the aerosol module (Gong et al., 2003; Wang et al., 2010).
The gas chemistry module is based on the Regional Acid Deposition Model (RADM II) mechanism with 63 gaseous species through 121 photochemical reactions and 121 gas-phase reactions applicable under a wide variety of environmental conditions, especially for smog (Stockwell et al., 1990). In addition, CUACE adopts the thermodynamic equilibrium ISSOROPIA (Nenes et al., 1999; Yu et al., 2005) to calculate nitrate and ammonium aerosols.
The simulation domain uses the Lambert projection to cover the entire territory of China, with a horizontal resolution of 15 km, and the number of east-west and north-south grids are 360 and 320, respectively. The vertical direction is divided into 23 layers from the ground to the height of 100 hpa at unequal intervals, of which approximately eight layers are within the boundary layer. The operational Global Forecast System (GFS) data from the National Centers for Environmental Prediction (NCEP) is utilized for providing the initial and lateral meteorological conditions to CUACE, with temporal and spatial resolutions of 3 h and 0.5° × 0.5°. Anthropogenic emissions are used from the Multi-resolution Emission Inventory for China version 1.3 (MEIC v1.3, http://www.meicmodel.org/, last access: 31 June 2022) with the base year of 2017, developed by Tsinghua University. The operational CUACE model starts running at 08:00 and 20:00 BJT every day, with a forecast time of 5 days. In this study, only the model forecast outputs from 08:00 BJT were used for optimization experiments with a time interval of 3 h. Since each model running produces output of 5 days, the entire dataset sample is divided into five subset samples corresponding to the first–fifth forecast day. For each forecast day, the independent XGBoost-SMOTE model is built, and then the best “hyperparameters + features” are automatically found through training without manual intervention, to obtain the best optimization results.
Table 1 summarizes all the input data in the knowledge base, consisting of ground-observed pollutant data, CUACE-forecasted meteorological data, CUACE-forecasted pollutant data, and some auxiliary variables from 1 January 2021 to 31 December 2021. The hourly ground-observed pollutant concentration data used in this study were obtained from the China National Environmental Monitoring Center (CNEMC, http://www.cnemc.cn). Regarding the National Air Quality Forecast Information Release System (https://air.cnemc.cn:18014), 46 key national cities were selected in this study, namely Baoding, Beijing, Cangzhou, Changchun, Chengde, Chengdu, Chongqing, Dalian, Fuzhou, Guangzhou, Guiyang, Haikou, Handan, Hangzhou, Harbin, Hefei, Hengshui, Hohhot, Jinan, Kunming, Langfang, Lanzhou, Lhasa, Nanchang, Nanjing, Nanning, Ningbo, Qinhuangdao, Qingdao, Shanghai, Shenyang, Shenzhen, Shijiazhuang, Taiyuan, Tangshan, Tianjin, Urumqi, Wuhan, Xiamen, Xi’an, Xingtai, Xining, Yinchuan, Zhangjiakou and Zhengzhou (Figure 2).
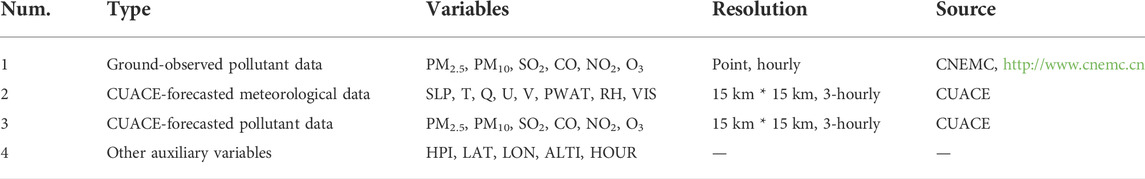
TABLE 1. Summary of the knowledge base.
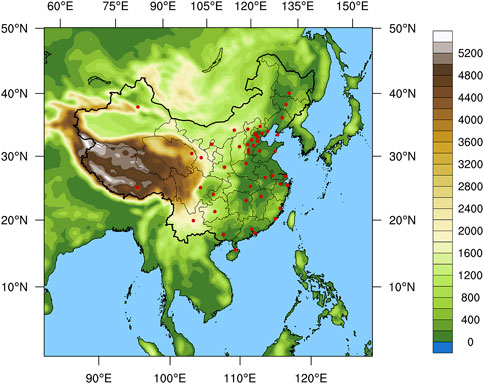
FIGURE 2. The locations of 46 selected key national cities in China.
The CUACE-forecasted meteorological data includes sea level pressure (SLP), 2-m temperature (T), 2-m mixing ratio (Q), 10-m u-component wind (U), 10-m v-component wind (V), precipitable water (PWAT), 2-m humidity (RH) and visibility (VIS), and the model-forecasted pollutant data includes PM2.5, PM10, SO2, CO, NO2, and O3, taking advantage of the data available in model forecasting results. Moreover, a high-pollution indicator (HPI) is defined to improve the pollutants forecasting performance on highly polluted days, when PM2.5 or O3 are usually underestimated in statistical and machine learning models (Huang et al., 2021; Wei et al., 2021). This high-pollution indicator is calculated based on CUACE-forecasted pollutant data and describes whether the pollutant concentration at each city exceeds the yearly mean by two standard deviations:
where
In summary, nineteen input features are used in the study, including the CUACE-forecasted meteorological variables of SLP, T, Q, U, V, PWAT, RH, and VIS, the CUACE-forecasted pollutants of PM2.5, PM10, SO2, CO, NO2, and O3, and the auxiliary variables of HPI, LAT, LON, ALTI, HOUR. The output is the optimized pollutant concentration of the operational CUACE model. All the input data are combined through the link of date and the sample with missing values will be removed. In the data preprocessing, the extreme values are not deleted but remain for more realistic optimized performance based on the hybrid SMOTE-XGBoost model. The processed data are then normalized and scaled to (−1, 1) to improve the accuracy of the algorithm and speed up the algorithm’s convergence. The whole year of data (2021) is randomly assigned as training and test sets with a ratio of 3:1, where 5-fold cross-validation (CV) is used during the training process. The assigned test set is finally used to evaluate the performance of the well-trained model.
XGBoost (Extreme Gradient Boosted Decision Tree) is an algorithm or engineering implementation based on Gradient Boosted Decision Tree (GBDT). The basic idea of XGBoost is the same as GBDT, but some optimizations have been made, such as the second derivative to make the loss function more accurate, the regular term to avoid tree overfitting, and the block storage can be calculated in parallel (Chen and Guestrin, 2016). XGBoost is efficient, flexible and lightweight, and has been widely used in data mining, recommendation systems and other fields. The principle of the algorithm is as follows:
Assuming that
where
where the first term
SMOTE (Synthetic Minority Oversampling Technique) is an improved algorithm for the random oversampling method. The random oversampling method directly re-uses the minority class, which will cause many duplicate samples in the training set, and may easily lead to the problem of model overfitting. While the basic idea of the SMOTE algorithm is to randomly select a sample
1) For each sample
2) A sampling rate N, which depends on the number of majority and minority class samples, is used to resample the dataset to equalize the number of samples in different classes. For each minority class sample
3) For each randomly selected nearest neighbor
In the study, as high-pollution days only accounted for about 4.0% of our training data set, which hinders the model’s ability to characterize the relationship between high-pollution events and selected input features, the SMOTE technique is adopted to oversample our data set and strike a balance between high-pollution and normal samples.
The assigned test set of 46 key national cities from the knowledge base is used to study the effectiveness of the proposed hybrid XGBoost-SMOTE model in optimizing the forecasting results from the operational CUECE model. To reflect the advantages of the XGBoost-SMOTE model, especially on high-pollution days, the results of the separate XGBoost model are also compared.
Figures 3, 4 show the performance comparison of the first-day PM2.5 forecasting results for the original CUACE, XGBoost, and XGBoost-SMOTE model. It can be seen that after the optimization of the XGBoost or XGBoost-SMOTE model, the PM2.5 forecasting performance of the CUACE model has been greatly improved, with the average R values increasing from 0.51 to 0.75 and 0.88, the average ME values decreasing from 20.71 µg/m3 to 11.69 µg/m3 and 9.85 µg/m3, and the RMSE values dropping from 35.80 µg/m3 to 22.54 µg/m3 and 16.21 µg/m3, respectively for XGBoost and XGBoost-SMOTE model. In the original CUACE model, the forecasting performance of North China and Central China is generally better, with the R values basically above 0.6, followed by the southeast coast and Northeast China, with the R values of 0.4–0.5, and Northwest China and Qinghai-Tibet Plateau are the worst, with R values of many cities even lower than 0.3. From the perspective of ME and RMSE values, Northwest China and some cities of Central China performed poorly, possibly due to the influence of northwest dust weather and regional pollutant transport. Overall, the values in southern China are significantly lower than those in northern China, which is also in line with the current pollution situation. After the optimization of the XGBoost model, the forecasting performance of the operational CUACE model for various cities has significantly improved, with the R values increasing by more than 0.2, the ME values decreasing by about 9.0 µg/m3, and the RMSE values decreasing by about 12.0 µg/m3. However, in Northwest China and Southwest China, the forecasting effect is still somewhat unsatisfactory, and a considerable gap is remained compared with eastern China. The XGBoost-SMOTE model adopts the high-pollution indicator and SMOTE technology, so it can better capture the relationship between the pollutant concentration and the input features, whether in normal events or high-pollution events, thus further improving the forecasting ability of the CUACE model and achieving excellent forecasting results, and the details are shown in Figure 5. Test samples from four central cities (Beijing, Xi’an, Guangzhou, and Harbin) in different regions were selected to compare the performance of XGBoost and XGBoost-SMOTE models in optimizing PM2.5 concentration from the operational CUACE model, especially in high-pollution samples. It can be seen from the figure that for different cities, compared with the XGBoost model, the forecasting improvement of the XGBoost-SMOTE model for high-pollution samples is extremely significant, with the PM2.5 concentration bias being reduced by tens to hundreds of µg/m3.
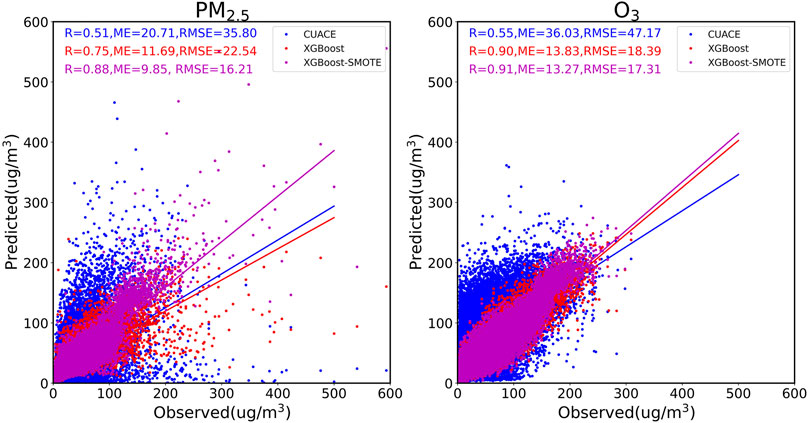
FIGURE 3. Scatter plots of performance comparison on the 1st-day PM2.5 and O3 forecasting results for the original CUACE, XGBoost, and XGBoost-SMOTE model.

FIGURE 4. Performance comparison of the 1st-day PM2.5 forecasting results for the original CUACE, XGBoost, and XGBoost-SMOTE model.

FIGURE 5. Results of PM2.5 concentration for OBS (observation), XGBoost, and XGBoost-SMOTE model.
Figures 3, 6 show the performance comparison of the first-day O3 forecasting results for the original CUACE, XGBoost and XGBoost-SMOTE model. It can be also seen that after the optimization of the XGBoost or XGBoost-SMOTE model, the O3 forecasting performance of the CUACE model has also been greatly improved, with the average R values increasing from 0.55 to 0.90 and 0.91, the average ME values decreasing from 36.03 µg/m3 to 13.83 µg/m3 and 13.27 µg/m3, and the RMSE values dropping from 47.17 µg/m3 to 18.39 µg/m3 and 17.31 µg/m3, respectively for XGBoost and XGBoost-SMOTE model. In the original CUACE model, the forecasting performance of North China is generally better, with the R values basically above 0.7, followed by Northwest China, Central China, and East China, with the R values of 0.4–0.6, and Northwest China and Southwest China are the worst, with R values of many cities even lower than 0.3. From the perspective of ME and RMSE values, North China and Northeast China performed the best, while Central China and Southwest China performed poorly. After the optimization of the XGBoost model or XGBoost-SMOTE model, O3 forecasting results are all satisfactory, where XGBoost-SMOTE shows a little advantage over XGBoost, which is obviously different from the optimization of PM2.5. This may be due to the better periodicity of O3 concentrations, leading to the fact that the single XGBoost model combined with the input features selected in this study can already fit their associations well, also including high-pollution events, which can be verified from Figure 7.
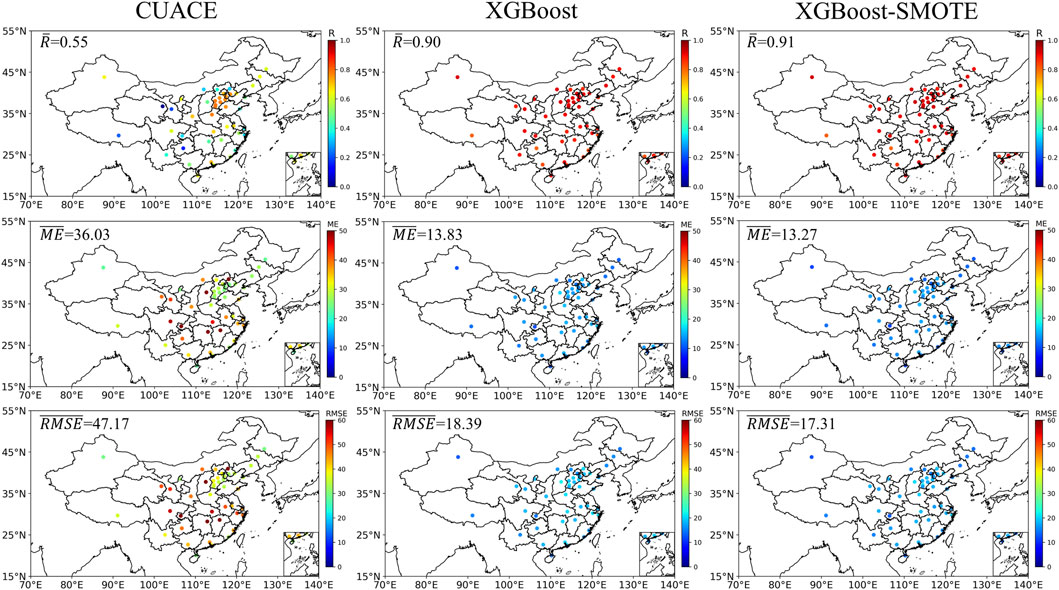
FIGURE 6. Comparison of the 1st-day O3 forecasting results for the original CUACE, XGBoost, and XGBoost-SMOTE model.

FIGURE 7. Results of O3 concentration for OBS (observation), XGBoost, and XGBoost-SMOTE model.
Statistics of three evaluation criteria (R, ME, and RMSE) for different forecast days are depicted in Table 2. It is easy to find that as the increase of forecast days (from first day to fifth day), the PM2.5 and O3 forecasting performance of CUACE gradually deteriorates, the same as that for the XGBoost or XGBoost-SMOTE model, which is in line with our cognition due to the inevitably increasing error of the input meteorological field. For different forecast days, the optimization performance of XGBoost-SMOTE for CUACE forecast is always better than that of XGBoost, especially for PM2.5. For example, the 5-day average R, ME, RMSE values for XGBoost-SMOTE are 0.87, 10.34 µg/m3 and 16.53 µg/m3, respectively, better than those of 0.73, 12.34 µg/m3and 22.79 µg/m3 for XGBoost. In addition, to further demonstrate the advantages of the hybrid XGBoost-SMOTE model, the evaluation criteria of the XGBoost-SMOTE model and other machine learning models are shown in Table 3. The results show that the hybrid XGBoost-SMOTE model consistently outperforms the Multiple Linear Regression (MLR), Multilayer Perceptron (MLP), Random Forest (RF), and Gradient Boosted Decision Tree (GBDT) for different pollutants and forecast days. In general, combined with the evaluation criteria, it can be found that the built hybrid XGBoost-SMOTE model can achieve satisfactory forecasting performance in optimizing the forecasting results of multiple pollutants and cities with different climate and pollution characteristics from the operational CUACE model.
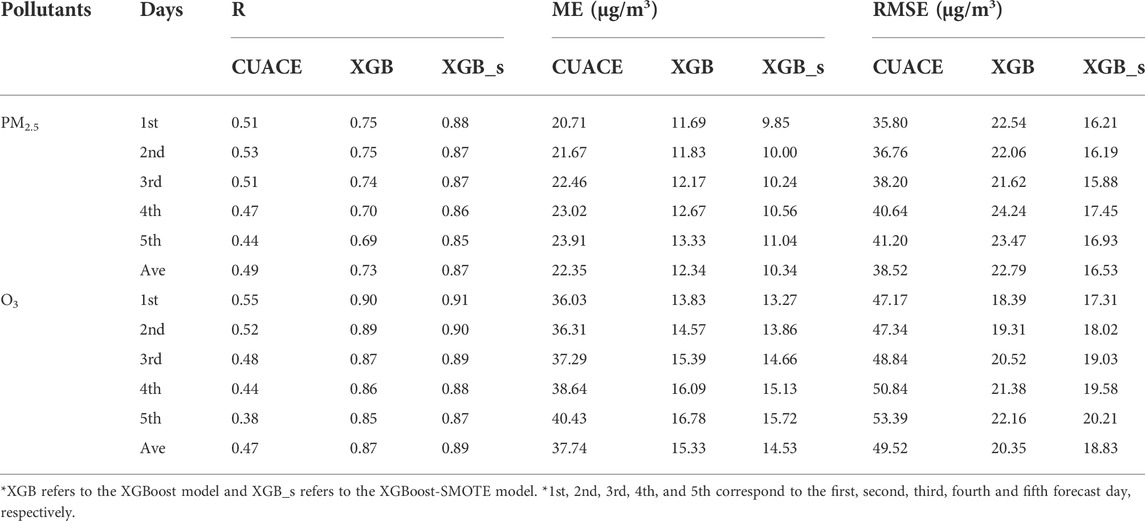
TABLE 2. Statistics of evaluation criteria for different pollutants and forecast days.
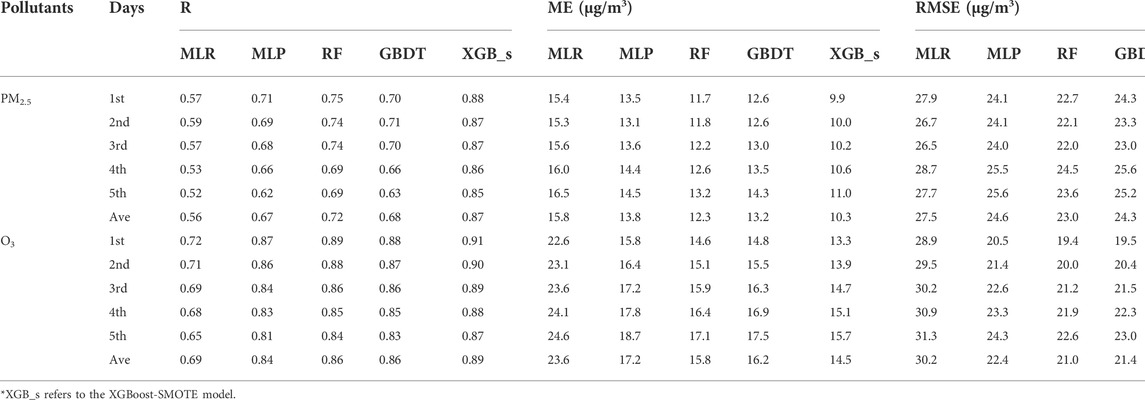
TABLE 3. Statistics of evaluation criteria between XGBoost-SMOTE model and other machine learning models.
In order to obtain the grid-optimized pollutant concentration distributions in other regions of the CUACE model, this study adopts the well-trained XGBoost-SMOTE hybrid algorithm based on the selected 46 cities and applies it to the optimization of model grid points. To increase the optimization efficiency, cyclic optimization is carried out with every four grid points as a group, and the optimized data set corresponding to the grid point data of the CUACE model in the simulation area is obtained.
Figure 8 show the spatial distribution of PM2.5 and O3 concentrations at the high pollution event on CUACE forecast and XGBoost-SMOTE algorithm optimization, respectively. Observation values for all cities in the model domain from the China National Environmental Monitoring Center are represented by colored dots. To make it easier to compare observations with CUACE forecast and XGBoost-SMOTE optimization, the same color bar is shared for all data. It can be seen from the figure that the spatial distribution of pollutant concentrations optimized by the XGBoost-SMOTE algorithm is closer to the observed results. The operational CUACE model has a poor forecasting effect on pollutant concentrations during the study period, with significantly overestimated PM2.5 concentrations in central and southern Hebei Province, southern Henan Province, central Shaanxi Province, and southern Hubei Province, and general overestimated O3 concentrations in northern China. The spatial distribution of pollutants shows that the built XGBoost-SMOTE hybrid algorithm can well calibrate the simulation results of the CUACE model, making the pollutant concentrations closer to the actual observed values. Compared with the tens of thousands of model grid points, the number of 46 cities selected in this study is small, which leads to certain errors in the pollutant concentrations optimized by the XGBoost-SMOTE algorithm. For example, in some cities in central Hebei Province and Shaanxi Province, the optimization effect of PM2.5 concentration is poor, showing a relatively underestimation.

FIGURE 8. PM2.5 and O3 observed (spot), CAUCE forecasted and XGBoost-SMOTE optimized concentration spatial distribution map.
To explore the effect of input features on the optimization of pollutant concentrations, a unified framework called Shapley Additive Interpretation (SHAP), a post-interpretation model with three desirable properties of local accuracy, consistency, and absence, was used to explain some sophisticated machine learning models (Roth, 1988; Lundberg and Lee, 2017). SHAP simulates feature contribution to individual predictions by calculating the Shapley value for each feature per sample (Lundberg et al., 2020).
Figure 9A shows the SHAP summary plot for the optimization of the first-day PM2.5 forecasting, which is used to demonstrate feature importance and feature impact. Each point on the summary plot is the Shapley value of each feature per sample, and the larger the Shapley value is, the more influence of feature has on the model output. The y-axis represents the input features, sorted by feature importance from top to bottom, and the x-axis represents the Shapley value of the corresponding point. The color (from red to blue) represents the values of the input features (from high to low), and the overlapping points are jittered in the y-axis direction, showing the distribution of Shapley values for each feature. It can be seen from the feature importance ranking in the figure that the feature of the high-pollution indicator ranks first, which means the greatest impact on the model optimization of PM2.5 concentration, with the positive and negative contribution of Shapely value reaching tens to hundreds of micrograms per cubic meter. When the sample is a high-pollution sample with the feature value of INDICATOR marked as 1, the SHAP value is higher, indicating that the feature has a positive contribution to the optimization of PM2.5. When the sample is a normal sample with the feature value of INDICATOR marked as 0, the feature has a negative contribution to the optimization of PM2.5. This also explains why high-pollution indicators combined with SMOTE technology can significantly improve the advantages of the XGBoost model in high-pollution events. In addition, auxiliary geographic features such as LAT and ALTI significantly affect the optimized PM2.5 concentration with positive correlation, i.e., higher values of LAT and ALTI tend to increase the optimized value (Figures 9B,C). In fact, LAT and ALTI represent not only the longitude and altitude in the geographical sense but also the local topographic conditions and industrial structure data behind them, which are temporarily not included in the knowledge base in this study. The higher LAT values tend to increase the optimized values, which is the rule learned by the XGBoost-SMOTE model from 46 central cities, i.e., the concentration of pollutants in the relatively northern region is higher, basically conforming to the current pollution situation in China. Higher ALTI values are associated with higher Shapley values, mainly due to the generally higher PM2.5 concentrations in central and western cities with higher terrain, which are caused by sparse vegetation coverage and strong secondary industries. Furthermore, the features of PM2.5, PM10, RH, and HOUR also affect the optimized PM2.5 concentration basely with positive correlation, while physical features of Q, PWAT, T, SLP, U, and V are negatively correlated with the optimized PM2.5 concentration.
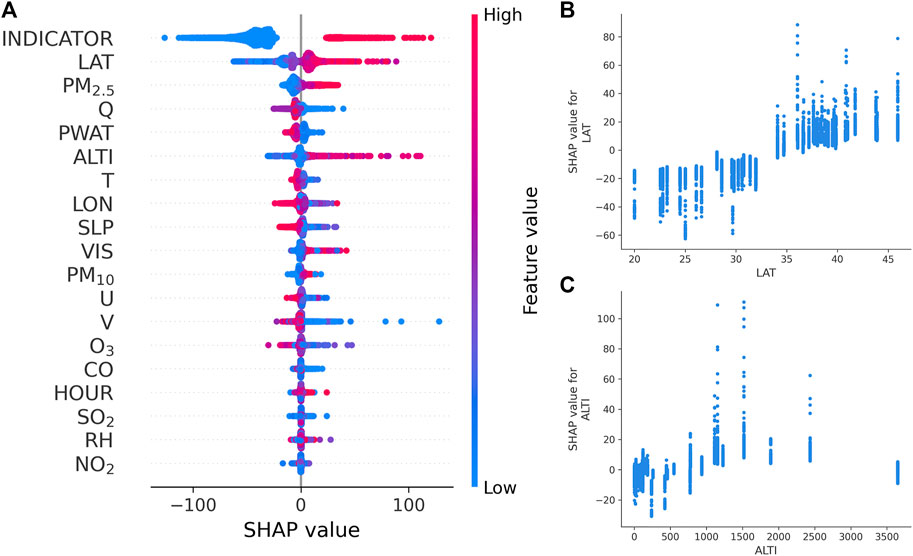
FIGURE 9. SHAP summary plot (A), partial dependence plot of LAT (B) and partial dependence plot of ALTI (C) for the optimization of the 1st-day PM2.5 forecasting.
Additionally, Figure 10A shows the SHAP summary plot for the optimization of the first-day O3 forecasting. Based on the feature importance ranking, it is observed that the feature of the high-pollution indicator also ranks first, which means the greatest impact on the model optimization of O3 concentration, with the positive and negative contribution of Shapely value reaching 20 µg/m3–50 µg/m3. Compared with the optimization process of PM25, the contribution of high-pollution indicators to the O3 concentration is greatly reduced, which also indirectly verifies that the improvement of O3 optimization by XGBoost-SMOTE is far less than that of PM25 optimization. In addition, the features of temperature T significantly affect the optimized O3 concentration with a positive correlation, i.e., the optimized value increases with the high values of T. The main reason for this phenomenon is that solar radiation is strongly correlated with surface temperature, and solar radiation can directly affect the production of O3, resulting in T can significantly affecting the surface O3 concentration, which is consistent with the conclusion of other studies (Chen et al., 2020; Jodzis and Baran, 2022). Figure 10B shows more details about the effect of T on the SHAP values. When T is low, the SHAP value is negative with the extreme T value around 270K, reducing the optimized O3 concentration. As T exceeds around 290 K, the temperature starts to make a positive contribution to SHAP values and gradually increases as T increases. Figure 10C shows details about the effect of the feature HOUR on the SHAP values. It can be seen that HOUR has a significant periodic contribution to the generation of O3 with the largest positive contribution to the SHAP values at about 14:00–17:00 and the largest negative contribution to the SHAP values at about 7:00–8:00 each day. Furthermore, the features of O3, LAT, V, and VIS also affect the optimized O3 concentration basely with a positive correlation, while the features of RH, SLP, PWAT, NO2 and U are negatively correlated with the optimized O3 concentration, which may be mainly related to photochemical reaction and ozone production (He et al., 2017; Chen et al., 2019; Chen et al., 2020; Ma et al., 2021; Mousavinezhad et al., 2021).
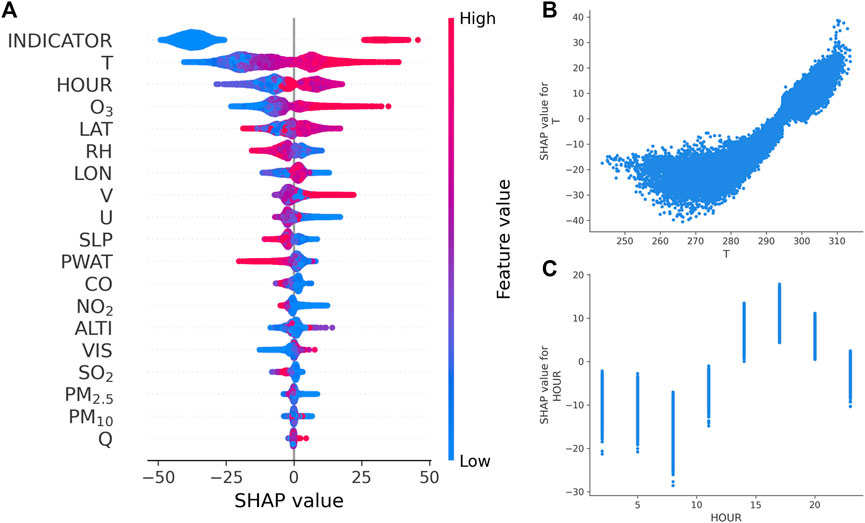
FIGURE 10. SHAP summary plot (A), partial dependence plot of T (B) and partial dependence plot of HOUR (C) for the optimization of the 1st-day O3 forecasting.
It is worth noting that since only 46 cities are used in this study to train the XGBoost-SMOTE model, leading its performance in optimizing the spatial distribution of pollutants from the CUACE model somewhat unsatisfactory, which is understandable based on the fact that the pollution mechanism learned from the 46 cities is hard to apply to the whole country, especially the vast border areas with no or only individual training cities. In our subsequent work, more cities will add to better capture the pollution mechanisms of various regions across China with different climatic and topographical characteristics. In addition, the knowledge base needs to be supplemented with more auxiliary data, such as emission source inventory, vegetation cover data, etc., so that the XGBoost-SMOTE model can better analyze the dominant physicochemical processes or dominant factors of the pollutant generation, transport, and dissipation in different regions.
A hybrid XGBoost-SMOTE model was established in this study and applied for the optimization of PM2.5 and O3 concentrations from the operational CUACE model. Ground-observed pollutant data, CUACE-forecasted meteorological data, CUACE-forecasted pollutant data and some auxiliary variables form the basis of the model application. The XGBoost-SMOTE model can achieve the goal of automatically selecting the optimal hyperparameter and features without human intervention, and significantly improving the pollutant forecasting performance from the numerical model on high polluted days combined with a self-defined high-pollution indicator.
Results showed that after the optimization of the XGBoost-SMOTE model, the PM2.5 forecasting performance of the CUACE model has been greatly improved, with the 5-day average R, ME, RMSE values changing from 0.49 to 0.87, 22.35 µg/m3 to 10.34 µg/m3, and 38.52 µg/m3 to 16.53 µg/m3, respectively, which are far better than those of 0.73, 12.34 µg/m3, and 22.79 µg/m3 by using XGBoost model. For the optimization of O3 forecasting performance, the 5-day average R, ME, RMSE values have changed from 0.47 to 0.89, 37.74 µg/m3 to 14.53 µg/m3, and 49.52 µg/m3 to 18.83 µg/m3, respectively, which are also better than those of 0.87, 15.33 µg/m3, and 20.35 µg/m3 by using XGBoost model. And through the comparison of the time series diagrams of the four central cities (Beijing, Xi’an, Guangzhou, and Harbin), it can be verified that the XGBoost-SMOTE model has a great improvement in the extreme values of forecasted pollutant concentrations from the CUACE model in high-pollution days, thereby achieving excellent forecasting results, especially for PM2.5. In addition, the application of the optimization for other model grid points showed that the spatial distribution of pollutant concentrations optimized by the XGBoost-SMOTE algorithm was closer to the observed results. Furthermore, through the impact analysis of the input features by SHAP, it was found that the high-pollution indicator ranked first in feature importance. For PM2.5 optimization, the features of LAT, ALTI, PM2.5, PM10, RH, and HOUR display positive correlation, while physical features of Q, PWAT, T, SLP, U, and V display negative correlation. For O3 optimization, the features of T, HOUR, O3, LAT, V, and VIS display positive correlation, while the features of RH, SLP, PWAT, NO2 and U display negative correlation. To summarize, the built hybrid XGBoost-SMOTE model can achieve reliable optimization results of the operational CUACE model and implies a good application prospect in the field of atmospheric environmental forecasting.
The original contributions presented in the study are included in the article/supplementary material, further inquiries can be directed to the corresponding author.
SG put forward the ideas and formulated overarching research goals. HK carried them out and wrote the manuscript with suggestions from all authors. JH and LZ participated in the scientific interpretation and discussion. JM assisted with data acquisition and processing. All authors contributed to the discussion and improvement of the manuscript.
This work was supported by the National Natural Science Foundation of China (Nos 42090030, 91744209), the National Key Foundation Study Developing Programs (Nos 2019YFC0214601 and 2019YFC0214801), and CAMS Basic Research Project (Grant No. 2019Z009 and No. 2020Y001).
The authors would like to thank the National Meteorological Centre for providing historical operational CUACE data.
The authors declare that the research was conducted in the absence of any commercial or financial relationships that could be construed as a potential conflict of interest.
All claims expressed in this article are solely those of the authors and do not necessarily represent those of their affiliated organizations, or those of the publisher, the editors and the reviewers. Any product that may be evaluated in this article, or claim that may be made by its manufacturer, is not guaranteed or endorsed by the publisher.
Bao, Y., Zhu, L., Guan, Q., Guan, Y., Lu, Q., Petropoulos, G. P., et al. (2019). Assessing the impact of Chinese FY-3/MERSI AOD data assimilation on air quality forecasts: Sand dust events in northeast China. Atmos. Environ. 205, 78–89. doi:10.1016/j.atmosenv.2019.02.026
Chen, T., and Guestrin, C. (2016). XGBoost: A scalable tree boosting system. Proceedings of the 22nd ACM SIGKDD international conference on knowledge discovery and data mining. San Francisco, California, USA: Association for Computing Machinery, 785–794.
Chen, Z., Li, R., Chen, D., Zhuang, Y., Gao, B., Yang, L., et al. (2020). Understanding the causal influence of major meteorological factors on ground ozone concentrations across China. J. Clean. Prod. 242, 118498. doi:10.1016/j.jclepro.2019.118498
Chen, Z., Zhuang, Y., Xie, X., Chen, D., Cheng, N., Yang, L., et al. (2019). Understanding long-term variations of meteorological influences on ground ozone concentrations in Beijing during 2006-2016. Environ. Pollut. 245, 29–37. doi:10.1016/j.envpol.2018.10.117
Cohen, A. J., Brauer, M., Burnett, R., Anderson, H. R., Frostad, J., Estep, K., et al. (2017). Estimates and 25-year trends of the global burden of disease attributable to ambient air pollution: An analysis of data from the global burden of diseases study 2015. Lancet 389, 1907–1918. doi:10.1016/S0140-6736(17)30505-6
Fang, X., Zou, B., Liu, X., Sternberg, T., and Zhai, L. (2016). Satellite-based ground PM2.5 estimation using timely structure adaptive modeling. Remote Sens. Environ. 186, 152–163. doi:10.1016/j.rse.2016.08.027
Forouzanfar, M. H., Afshin, A., Alexander, L. T., Anderson, H. R., Bhutta, Z. A., Biryukov, S., et al. (2016). Global, regional, and national comparative risk assessment of 79 behavioural, environmental and occupational, and metabolic risks or clusters of risks, 1990–2015: A systematic analysis for the global burden of disease study 2015. Lancet 388, 1659–1724. doi:10.1016/S0140-6736(16)31679-8
Fu, Y., Liao, H., and Yang, Y. (2019). Interannual and decadal changes in tropospheric ozone in China and the associated chemistry-climate interactions: A review. Adv. Atmos. Sci. 36, 975–993. doi:10.1007/s00376-019-8216-9
Gavidia-Calderón, M., Vara-Vela, A., Crespo, N. M., and Andrade, M. F. (2018). Impact of time-dependent chemical boundary conditions on tropospheric ozone simulation with WRF-Chem: An experiment over the Metropolitan Area of São Paulo. Atmos. Environ. 195, 112–124. doi:10.1016/j.atmosenv.2018.09.026
Geng, G., Xiao, Q., Liu, S., Liu, X., Cheng, J., Zheng, Y., et al. (2021). Tracking air pollution in China: Near real-time PM2.5 retrievals from multisource data fusion. Environ. Sci. Technol. 55, 12106–12115. doi:10.1021/acs.est.1c01863
Goldberg, M. S., Burnett, R. T., Stieb, D. M., Brophy, J. M., Daskalopoulou, S. S., Valois, M-F., et al. (2013). Associations between ambient air pollution and daily mortality among elderly persons in Montreal, Quebec. Sci. Total Environ. 463-464, 931–942. doi:10.1016/j.scitotenv.2013.06.095
Gong, S., Barrie, L., Blanchet, J. P., Von Salzen, K., Lohmann, U., Lesins, G., et al. (2003). Canadian aerosol module: A size-segregated simulation of atmospheric aerosol processes for climate and air quality models 1. Module development. J. Geophys. Res. 108, 4007. doi:10.1029/2001JD002002
Gong, S., Zhang, L., Liu, C., Lu, S., Pan, W., and Zhang, Y. (2022). Multi-scale analysis of the impacts of meteorology and emissions on PM2.5 and O3 trends at various regions in China from 2013 to 2020 2. Key weather elements and emissions. Sci. Total Environ. 824, 153847. doi:10.1016/j.scitotenv.2022.153847
Gong, S. L., and Zhang, X. Y. (2008). CUACE/Dust - an integrated system of observation and modeling systems for operational dust forecasting in Asia. Atmos. Chem. Phys. 8, 2333–2340. doi:10.5194/acp-8-2333-2008
Grell, G. A., Peckham, S. E., Schmitz, R., McKeen, S. A., Frost, G., Skamarock, W. C., et al. (2005). Fully coupled “online” chemistry within the WRF model. Atmos. Environ. 39, 6957–6975. doi:10.1016/j.atmosenv.2005.04.027
He, J., Gong, S., Yu, Y., Yu, L., Wu, L., Mao, H., et al. (2017). Air pollution characteristics and their relation to meteorological conditions during 2014-2015 in major Chinese cities. Environ. Pollut. 223, 484–496. doi:10.1016/j.envpol.2017.01.050
Huang, C., Hu, J., Xue, T., Xu, H., and Wang, M. (2021). High-resolution spatiotemporal modeling for ambient PM2.5 exposure assessment in China from 2013 to 2019. Environ. Sci. Technol. 55, 2152–2162. doi:10.1021/acs.est.0c05815
Jodzis, S., and Baran, K. (2022). The influence of gas temperature on ozone generation and decomposition in ozone generator. How is ozone decomposed? Vacuum 195, 110647. doi:10.1016/j.vacuum.2021.110647
Li, Z., Zang, Z., Li, Q. B., Chao, Y., Chen, D., Ye, Z., et al. (2013). A three-dimensional variational data assimilation system for multiple aerosol species with WRF/Chem and an application to PM<sub>2.5</sub> prediction. Atmos. Chem. Phys. 13, 4265–4278. doi:10.5194/acp-13-4265-2013
Lin, C. Q., Liu, G., Lau, A. K. H., Li, Y., Li, C. C., Fung, J. C. H., et al. (2018). High-resolution satellite remote sensing of provincial PM2.5 trends in China from 2001 to 2015. Atmos. Environ. 180, 110–116. doi:10.1016/j.atmosenv.2018.02.045
Lundberg, S. M., Erion, G., Chen, H., DeGrave, A., Prutkin, J. M., Nair, B., et al. (2020). From local explanations to global understanding with explainable AI for trees. Nat. Mach. Intell. 2, 56–67. doi:10.1038/s42256-019-0138-9
Lundberg, S. M., and Lee, S-I. (2017). A unified approach to interpreting model predictions. Proceedings of the 31st international conference on neural information processing systems. Long Beach, California, USA: Curran Associates Inc., 4768–4777.
Ma, X., Huang, J., Zhao, T., Liu, C., Zhao, K., Xing, J., et al. (2021). Rapid increase in summer surface ozone over the north China plain during 2013-2019: A side effect of particulate matter reduction control? Atmos. Chem. Phys. 21, 1–16. doi:10.5194/acp-21-1-2021
Ma, Z., Hu, X., Sayer, M., Levy, R., Zhang, Q., Xue, Y., et al. (2016). Satellite-based spatiotemporal trends in PM 2.5 concentrations: China, 2004-2013. Environ. Health Perspect. 124, 184–192. doi:10.1289/ehp.1409481
Mousavinezhad, S., Choi, Y., Pouyaei, A., Ghahremanloo, M., and Nelson, D. L. (2021). A comprehensive investigation of surface ozone pollution in China, 2015-2019: Separating the contributions from meteorology and precursor emissions. Atmos. Res. 257, 105599. doi:10.1016/j.atmosres.2021.105599
Nenes, A., Pandis, S. N., and Pilinis, C. (1999). Continued development and testing of a new thermodynamic aerosol module for urban and regional air quality models. Atmos. Environ. 33, 1553–1560. doi:10.1016/S1352-2310(98)00352-5
Niu, T., Gong, S. L., Zhu, G. F., Liu, H. L., Hu, X. Q., Zhou, C. H., et al. (2008). Data assimilation of dust aerosol observations for the CUACE/dust forecasting system. Atmos. Chem. Phys. 8, 3473–3482. doi:10.5194/acp-8-3473-2008
Peng, Y., Wang, H., Zhang, X., Zhao, T., Jiang, T., Che, H., et al. (2021). Impacts of PBL schemes on PM2.5 simulation and their responses to aerosol-radiation feedback in GRAPES_CUACE model during severe haze episodes in Jing-Jin-Ji, China. Atmos. Res. 248, 105268. doi:10.1016/j.atmosres.2020.105268
Requia, W. J., Adams, M. D., and Koutrakis, P. (2017). Association of PM2.5 with diabetes, asthma, and high blood pressure incidence in Canada: A spatiotemporal analysis of the impacts of the energy generation and fuel sales. Sci. Total Environ. 584-585, 1077–1083. doi:10.1016/j.scitotenv.2017.01.166
Ritter, M., Müller, M. D., Jorba, O., Parlow, E., and Liu, L. J. S. (2012). Impact of chemical and meteorological boundary and initial conditions on air quality modeling: WRF-chem sensitivity evaluation for a European domain. Meteorol. Atmos. Phys. 119, 59–70. doi:10.1007/s00703-012-0222-8
Roth, A. E. (1988). The Shapley value: Essays in honor of lloyd S. Shapley. Cambridge University Press.
Sitch, S., Cox, P. M., Collins, W. J., and Huntingford, C. (2007). Indirect radiative forcing of climate change through ozone effects on the land-carbon sink. Nature 448, 791–794. doi:10.1038/nature06059
Stockwell, W. R., Middleton, P., Chang, J. S., and Tang, X. (1990). The second generation regional acid deposition model chemical mechanism for regional air quality modeling. J. Geophys. Res. 95, 16343–16367. doi:10.1029/JD095iD10p16343
Wang, H., Gong, S., Zhang, H., Chen, Y., Shen, X., Chen, D., et al. (2010). A new-generation sand and dust storm forecasting system GRAPES_CUACE/Dust: Model development, verification and numerical simulation. Chin. Sci. Bull. 55, 635–649. doi:10.1007/s11434-009-0481-z
Wei, J., Li, Z., Cribb, M., Huang, W., Xue, W., Sun, L., et al. (2020). Improved 1 km resolution PM2.5 estimates across China using enhanced space–time extremely randomized trees. Atmos. Chem. Phys. 20, 3273–3289. doi:10.5194/acp-20-3273-2020
Wei, J., Li, Z., Lyapustin, A., Sun, L., Peng, Y., Xue, W., et al. (2021). Reconstructing 1-km-resolution high-quality PM2.5 data records from 2000 to 2018 in China: Spatiotemporal variations and policy implications. Remote Sens. Environ. 252, 112136. doi:10.1016/j.rse.2020.112136
Werner, M., Kryza, M., Skjøth, C. A., Ojrzyńska, H., and Dore, A. J. (2016). Application of the WRF-chem model for air pollution forecasting in Poland. Springer International Publishing.
Xiao, Q., Chang, H. H., Geng, G., and Liu, Y. (2018). An ensemble machine-learning model to predict historical PM2.5 concentrations in China from satellite data. Environ. Sci. Technol. 52, 13260–13269. doi:10.1021/acs.est.8b02917
Xue, T., Zheng, Y., Tong, D., Zheng, B., Li, X., Zhu, T., et al. (2019). Spatiotemporal continuous estimates of PM2.5 concentrations in China, 2000-2016: A machine learning method with inputs from satellites, chemical transport model, and ground observations. Environ. Int. 123, 345–357. doi:10.1016/j.envint.2018.11.075
Yu, S., Dennis, R., Roselle, S., Nenes, A., Walker, J., Eder, B., et al. (2005). An assessment of the ability of three-dimensional air quality models with current thermodynamic equilibrium models to predict aerosol NO3−. J. Geophys. Res. 110, D07S13. doi:10.1029/2004JD004718
Zhai, S., Jacob, D. J., Wang, X., Shen, L., Li, K., Zhang, Y., et al. (2019). Fine particulate matter (PM<sub>2.5</sub>) trends in China, 2013-2018: Separating contributions from anthropogenic emissions and meteorology. Atmos. Chem. Phys. 19, 11031–11041. doi:10.5194/acp-19-11031-2019
Zheng, B., Tong, D., Li, M., Liu, F., Hong, C., Geng, G., et al. (2018). Trends in China's anthropogenic emissions since 2010 as the consequence of clean air actions. Atmos. Chem. Phys. 18, 14095–14111. doi:10.5194/acp-18-14095-2018
Zhong, J., Zhang, X., Gui, K., Wang, Y., Che, H., Shen, X., et al. (2021). Robust prediction of hourly PM2.5 from meteorological data using LightGBM. Natl. Sci. Rev. 8, nwaa307. doi:10.1093/nsr/nwaa307
Zhong, J., Zhang, X., and Wang, Y. (2019). Reflections on the threshold for PM2.5 explosive growth in the cumulative stage of winter heavy aerosol pollution episodes (HPEs) in Beijing. Tellus B Chem. Phys. Meteorology 71, 1528134. doi:10.1080/16000889.2018.1528134
Keywords: hybrid XGBoost-SMOTE model, operational CUACE model, optimization, high-pollution days, 5-days
Citation: Ke H, Gong S, He J, Zhang L and Mo J (2022) A hybrid XGBoost-SMOTE model for optimization of operational air quality numerical model forecasts. Front. Environ. Sci. 10:1007530. doi: 10.3389/fenvs.2022.1007530
Received: 30 July 2022; Accepted: 06 September 2022;
Published: 23 September 2022.
Edited by:
Yang Gao, Ocean University of China, ChinaCopyright © 2022 Ke, Gong, He, Zhang and Mo. This is an open-access article distributed under the terms of the Creative Commons Attribution License (CC BY). The use, distribution or reproduction in other forums is permitted, provided the original author(s) and the copyright owner(s) are credited and that the original publication in this journal is cited, in accordance with accepted academic practice. No use, distribution or reproduction is permitted which does not comply with these terms.
*Correspondence: Sunling Gong, Z29uZ3NsQGNtYS5nb3YuY24=
Disclaimer: All claims expressed in this article are solely those of the authors and do not necessarily represent those of their affiliated organizations, or those of the publisher, the editors and the reviewers. Any product that may be evaluated in this article or claim that may be made by its manufacturer is not guaranteed or endorsed by the publisher.
Research integrity at Frontiers
Learn more about the work of our research integrity team to safeguard the quality of each article we publish.