 Yuanjian Deng1
 Xu Yang
94% of researchers rate our articles as excellent or good
Learn more about the work of our research integrity team to safeguard the quality of each article we publish.
Find out more
ORIGINAL RESEARCH article
Front. Environ. Sci., 12 September 2022
Sec. Environmental Economics and Management
Volume 10 - 2022 | https://doi.org/10.3389/fenvs.2022.1007231
This article is part of the Research TopicThe Role of Energy Efficiency and Transition Towards Clean Energy in Achieving the COP26 CommitmentsView all 22 articles
Based on the panel data of 30 provinces (autonomous regions and municipalities) in China from 2004 to 2017, this paper used the three-stage super-efficiency SBM-DEA model to calculate the ecological well-being performance (EWP) of provincial capital cities and analyzed its temporal and spatial evolution. The results show that: (①) the improvement of China’s technological level and opening-up level can promote the improvement of ecological well-being performance, while the improvement of environmental regulation, urbanization level, and economic development level can inhibit the improvement of ecological well-being performance (②). After excluding the influence of external environment and random interference, the ecological health performance of the whole country and the eastern, central and western regions has been improved, with the eastern region having the greatest improvement and the central region having the smallest improvement. The performance level of national ecological well-being presents a spatial pattern of “strong in the eastern region, secondary in the central region and weak in the western region” (③). The ecological well-being performance levels of Beijing, Hainan, and Shanghai had always been at the forefront of the country, while those of Ningxia, Inner Mongolia, and Liaoning had been in the bottom three for a long time. The gap between provinces is obvious, but the gap between provinces within the same region is smaller.
In the past 40 years of reform and opening up, China’s urbanization rate has increased from 17.92% in 1978 to 63.89% in 2020 (National, 2021), and it has become the second largest economy in the world. Although people’s living standard has been greatly improved, by 2020, China’s human development index ranked only 85th among 189 countries. At the same time, China has also paid a heavy ecological price, and problems such as resource shortage and environmental pollution have become increasingly apparent (Ameen et al., 2015; Bian et al., 2020).
To alleviate these problems, the Chinese government has taken various measures to protect the environment and improve the well-being of urban residents. For example, as early as 2003, the Chinese government put forward the concept of “people-oriented, comprehensive, coordinated and sustainable development.” In 2006, it proposed building a resource-conserving and environment-friendly society. At the 18th National Congress of the Communist Party of China in 2012, “ecological civilization” was put in a more prominent position. In 2019, the fourth Plenary Session of the 19th CPC National Congress called for “upholding and improving the system of ecological civilization and promoting harmonious coexistence between man and nature” as a higher requirement for sustainable development.
At present, exploring the minimum ecological input to obtain the maximum social well-being output, that is, to improve the performance level of ecological well-being, has become an urgent task for China to achieve high-quality economic development. However, China has a vast territory, and the environment for economic and social development is quite different. The natural capital stocks and service functions of different provinces are different. How do they perform in ecological well-being performance? What factors affect the performance of ecological well-being? And how is the impact measured? What are the evolvement rules of ecological well-being performance in time and space? This paper will study the above issues, aiming to explore the current status and basic characteristics of ecological well-being performance in China and capture the evolution trend of the spatial distribution of ecological well-being performance.
Ecological well-being performance (EWP) was first proposed by Daly (1974), Daly (1990) to measure the level of sustainable development in various countries. It has been stated that urban sustainability can be evaluated by measuring the social well-being level generated by the unit consumption of natural resources. Some research states that human society has already transferred from the “empty world” with relatively rich natural capital to the “full world” with increasingly tight ecological environment constraints (Daly, 2005). In a “full world,” artificial capital has become relatively rich, and natural capital has become the main factor restricting the improvement of human well-being level. Whether the improvement of human well-being can be realized with its constraints has become the fundamental challenge of sustainable development (Zhu, 2008). In recent years, the research on ecological environment mainly focuses on the methods of ecological environment assessment and the selection of ecological environment indicators.
There are two main methods to measure the EWP. One is the single ratio index method, which uses the ratio of well-being level to ecological consumption for measuring the EWP (Ng, 2007; Jorgenson et al., 2014). For example, Common (2007) measured ecological well-being performance by establishing a formula of the ratio of well-being output to environmental input. Using resident satisfaction as a proxy for well-being, the paper finds that richer countries are less good at translating environmental impact into satisfaction; Zhu et al. (2014) defined ecological well-being performance as the efficiency of transforming ecological resource consumption into social well-being level, quantified it by the ratio of human development index (HDI) to ecological footprint, and obtained the inverted U-shaped relationship between ecological well-being performance and economic growth by using data from 124 countries and regions in 2007. Similarly, Dietz et al. (2012) evaluated the EWP of 58 countries and proposed that the relationship between PER capita GDP and environmental intensity of human well-being presents a U-shaped opposite to the Kuznets curve. With the deepening of research, the application of the single ratio method has gradually decreased because of the small number of indicators.
The other method is composite index methods, such as the Data Envelopment Analysis model (DEA) and the Stochastic Frontier Production model. In terms of the evaluation of environmental pollution by the DEA method, the following two methods are generally adopted: one is to treat environmental pollution as an input variable. For example, Long and Wang (2017) used the Super-SBM model to make an overall assessment of the EWP in Shanghai from 2006 to 2014; Xiao and Zhang (2019) also analyzed the spatial evolution pattern of ecological well-being performance during the 2004–2016 period based on the super-SBM model and took 30 provinces of China as the research area. The second is to treat environmental pollution as an undesirable output. For example, Fang and Xiao (2019) utilized the super-SBM model to measure the level of ecological well-being and then studied the spatial effect. On the other hand, Dietz et al. (2009) assessed effective well-being in 135 countries using a Stochastic Frontier Production model. Xiao and Zhang (2019) estimated the EWP of 30 Provinces in China from 2004 to 2015 using an improved Stochastic Frontier Production model. Compared with SFA method, DEA method does not need to set the function form, and can bring the unexpected output into the analysis framework. It has been gradually adopted by many scholars, and has become an ideal method to measure EWP.
A key issue during indicator selection is the measurement of well-being indicators. Some studies (Bjornskov, 2010) stated that the evaluation of subjective well-being was superior to that of objective well-being indicators. The reason is that the objective well-being evaluation is only an input indicator for people to achieve high well-being or quality of life, while the subjective well-being evaluation better reflects people’s real well-being feelings. In terms of the relationship between ecological well-being performance and economic growth, Rice (2008) adopted Pearson correlation analysis and found that the marginal well-being effect of natural consumption decreased successively in backward countries, middle-income countries, and high-income countries. Jorgenson et al. (2014) studied the data of 106 countries in the past 40 years and found that economic growth does not necessarily lead to a decrease in Ecological well-being performance. In Asia and Central and South America, the impact of economic development on ecological well-being performance is positive and increasing. In North America, Europe, and Oceania, the impact of economic development on ecological well-being performance is relatively stable.
The above literature has laid the foundation for the research of this study. Through the literature review found that the more academic literature to measure ecological benefits performance level with traditional Super—SBM model, this model does not eliminate the provincial (city, area) the external environment factors and the influence of random disturbance on the ecological benefits performance level, so the measured result cannot objectively reflect the actual status of the ecological benefits performance level. Fried et al. (2002) proposed the three-stage DEA method based on the traditional DEA model, which can effectively exclude the effects of external environmental factors and random interference on the efficiency of production units and place all production units in a fair external environment, making the efficiency level more objective and real. At the same time, the three-stage DEA method can compare the Ecological well-being performance indexes at the provincial level from horizontal and vertical dimensions, and accurately measure the level of ecological consumption at the provincial level from the input end and output end.
This study combines the three-stage DEA model with the super-SBM model, namely, the three-stage super-efficiency SBM-DEA model. This method was used to measure the level of ecological well-being performance of 30 provinces (municipalities and autonomous regions) in China from 2004 to 2017 and analyze its spatio-temporal evolution. This study aims to enrich the measurement methods of ecological well-being performance through this research on the one hand; On the other hand, it can clarify the evolution characteristics of China’s ecological well-being performance level and provide a reference for relevant policymaking.
Considering the overall data characteristics, random errors, and environmental factors, this paper combines the DEA model with the super-efficiency SBM model to establish a three-stage super-efficiency SBM-DEA model for efficiency evaluation. In this way, the dimension problem can be avoided to a greater extent, and the efficiency value is more consistent with the fact and close to the reality. The construction of the model includes the following three stages:
In the traditional three-stage DEA model, the first stage is based on the radial measurement method, such as the CCR or BCC model, which does not take into account the relaxation of input-output, and the measurement results are not completely consistent with the actual situation. The advantage of the non-radial SBM model proposed by Tone (2001) is that the efficiency value changes strictly with the change of the slack degree of input and output. However, the efficiency value obtained by the SBM model will be one at the same time, leading to the problem that decision-making units cannot be sorted. Therefore, Tone (2002) further proposed the super-SBM model and solved the relaxation problem of input-output variables and the ordering problem of decision-making units at the same time. Therefore, this study uses the input-oriented super-SBM model to measure the performance level of ecological well-being. The model is as follows:
Where δ is the DEA super-efficiency value, λj is the weight vector,
In the first stage, the performance level of ecological well-being based on the super-SBM model is affected by environmental factors, random interference, and management efficiency. To further distinguish the influence degree of each factor, the SFA model is needed in the second stage to eliminate environmental factors and random interference factors, so that the input redundancy of DMU is only caused by management inefficiency. The stochastic frontier regression formula is as follows:
Where
The purpose of SFA regression is to eliminate the influence of environmental factors and random interference on performance measurement so that all decision-making units can be adjusted to the same external environment. The adjustment formula is as follows:
Where
Based on the super-SBM model of the first stage, the adjusted input and output variables are used to measure the Ecological well-being performance of each province again. At this time, the performance value has eliminated the influence of environmental factors and random interference, which is a more real and accurate result obtained by placing all provinces under the same external environment and luck level.
The efficiency evaluation index system constructed in this study consists of input variables, output variables, and external environment variables. Refer to the Long’s findings (Long and Wang, 2017) , specific input and output indicators are shown in Table 1. Environmental variables refer to the variables that can affect the ecological well-being performance and cannot be subjectively changed or controlled within a short period. According to the existing research results (Fang and Xiao, 2019), the corresponding indicators in Table 2 are selected for measurement.
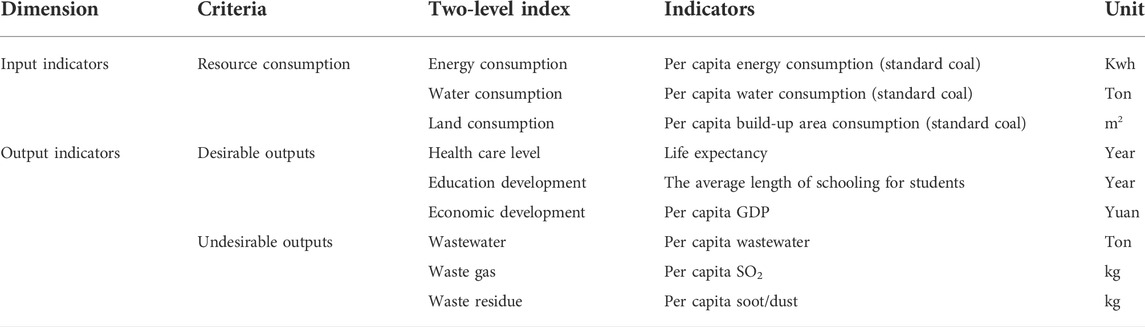
TABLE 1. The input and output indexes.
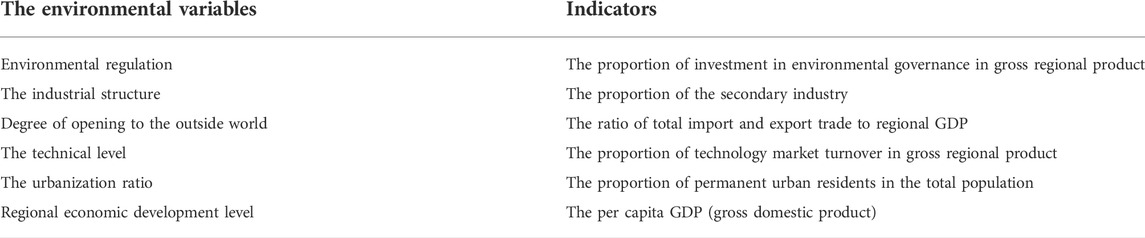
TABLE 2. Environment variables and descriptions.
Due to data acquisition reasons, this paper selected 30 provinces (autonomous regions and municipalities) in China as research objects, excluding Hong Kong, Macao, Taiwan, and Tibet, which are different from the statistical caliber of mainland China that will lead to biased results, with a period from 2004 to 2017. Tibet is not within the research area of this study due to a lack of data. The original data of various indicators for measuring the performance level of ecological well-being and environmental variables come from China Statistical Yearbook, China Environmental Statistical Yearbook, China Education Statistical Yearbook, and China Energy Statistical Yearbook. The per capita index of resource consumption and environmental pollution is calculated by the permanent population at the end of the year. The data of per capita GDP were subtracted based on 2004; The average life expectancy of each province only has the data of 1990, 2000, and 2010. The missing data of each province are supplemented by referring to the method of Xu et al. (2017). The calculation of the average length of schooling for students (ALS) is shown in formula (Daly, 1974), P represents the population of each educational level.
At this stage, based on the obtained data, the input-oriented super-efficiency SBM model can be used to calculate the ecological well-being performance level of 30 provinces (cities and districts) in China from 2004 to 2017, without excluding with the influence of environmental factors and random disturbances. The results are shown in Table 3.
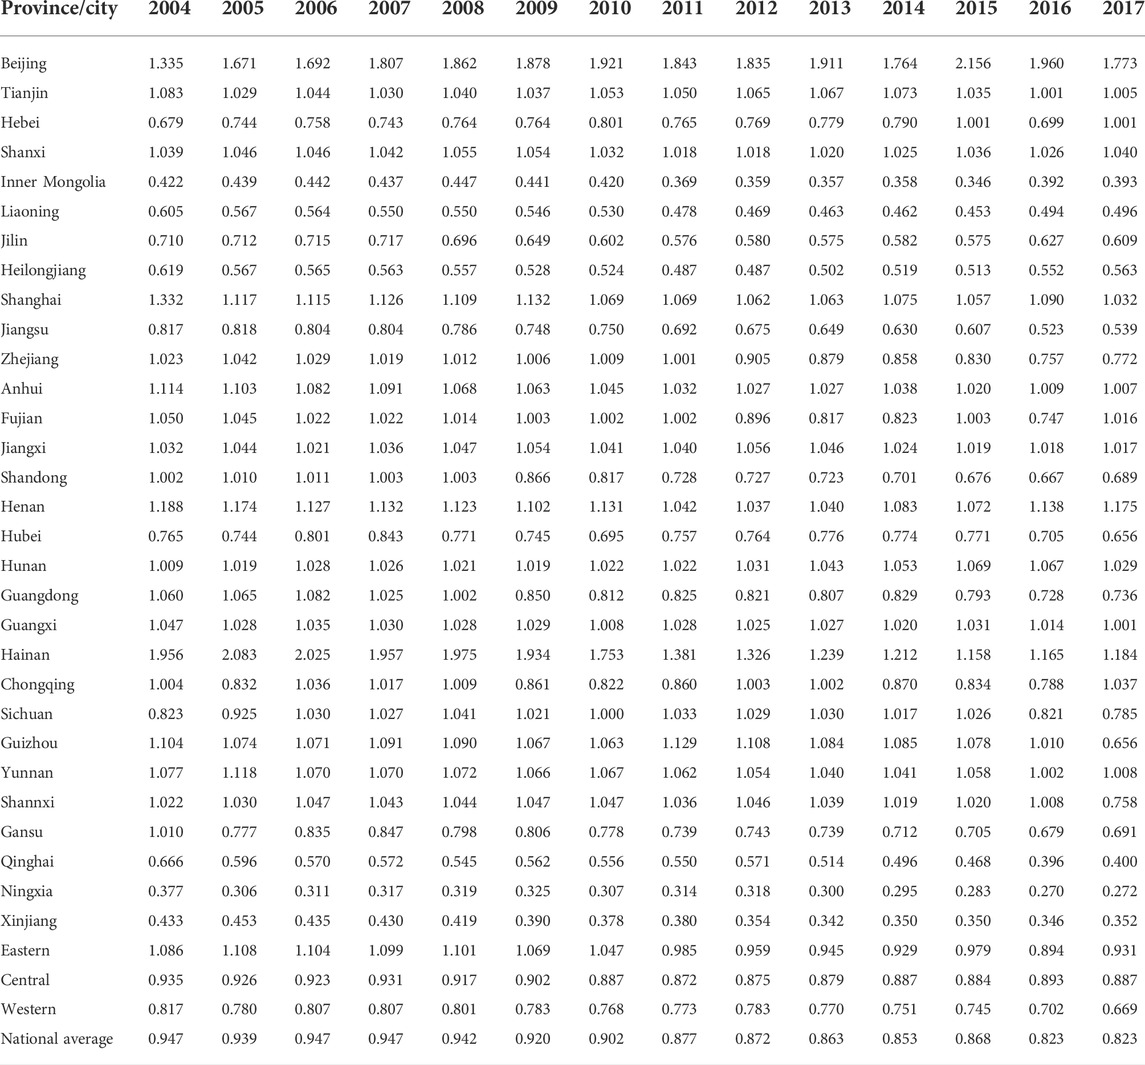
TABLE 3. Stage 1 results of ecological well-being performance of 30 provinces (autonomous regions and municipalities) in China from 2004 to 2017.
At the national level, the average ecological well-being performance in China from 2004 to 2017 was 0.895, which did not reach the production frontier, indicating that there is still a large room for improvement.
China’s ecological well-being performance dropped from 0.947 in 2004 to 0.823 in 2017, with a drop of 13.1% and an annual decline rate of about 1.1%, indicating that China’s economic growth has not been accompanied by a corresponding improvement in ecological well-being performance. This is consistent with the theoretical hypothesis of Manfred (2005) on the “well-being threshold.” They believe that the relationship between economic growth and social well-being level is not always positive, and when the economic development crosses a certain threshold, continued economic growth will inhibit the quality improvement of human life.
At the regional level, China’s ecological well-being performance has always been the highest in the eastern region, followed by the central region, and the lowest in the western region. This is consistent with the spatial pattern of “east-central-west” decreasing in China’s economic development level. In terms of the changing trend, the ecological well-being level in the eastern, central, and western regions all showed a downward trend, with an average annual decline of 1.1%, 0.4%, and 1.5%, respectively. It can be seen that the eastern and western regions showed the most obvious decline.
From the provincial level, Figure 1 visually shows the ecological well-being performance level of 30 provinces (autonomous regions and municipalities) in China from 2004 to 2017. Hainan, Beijing, and Henan ranked the top three in terms of ecological well-being performance, but their causes were different. Hainan benefits from the unique “natural endowment” and has a comparative advantage in developing tourism, so its economic growth is less dependent on resources, energy, and other factors input. Beijing is China’s most developed city, but the ecological benefits performance levels are not affected by the “threshold,” thanks to Beijing’s “city status,” in the vicinity of the capital, technology, and talent with strong “siphon effect,” while polluting enterprises affected by “depression effect” to spread to the surrounding area. Henan province is located in the central region of China. Its economic development level is not outstanding, but it is in the dynamic balance between factor input and social well-being output. From 2004 to 2017, Inner Mongolia, Xinjiang, and Ningxia ranked the bottom three in ecological well-being performance. The ecological environment of the above three places is relatively fragile, and the development model of exchanging natural resource consumption for economic growth has not changed fundamentally, resulting in a low level of ecological well-being performance. From the above analysis, it can be seen that the provinces affected by the “well-being threshold” are concentrated in the eastern regions, such as Guangdong, Jiangsu, Shandong, and Zhejiang, which are experiencing rapid economic growth in China, but their ecological well-being performance continues to decline.
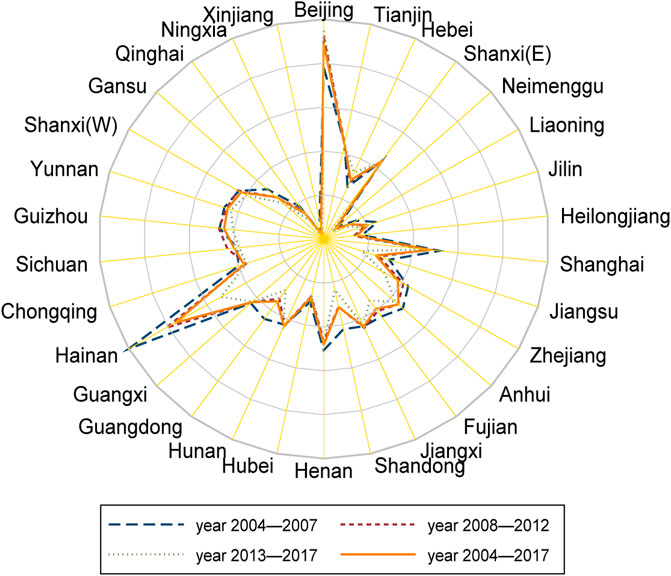
FIGURE 1. The average EWP values of provincial capital cities in China from 2004 to 2017.
The second stage is stochastic frontier analysis. Based on Stage 1 results, slack of energy inputs, water resource inputs and land resource inputs are used as the explained variables of the regression model. Environmental regulation, industrial structure, level of opening up, technological level, urbanization level and economic development level are taken as environmental variables. In this paper, Frontier 4.1 software is used to conduct SFA regression, and the results are shown in Table 4.
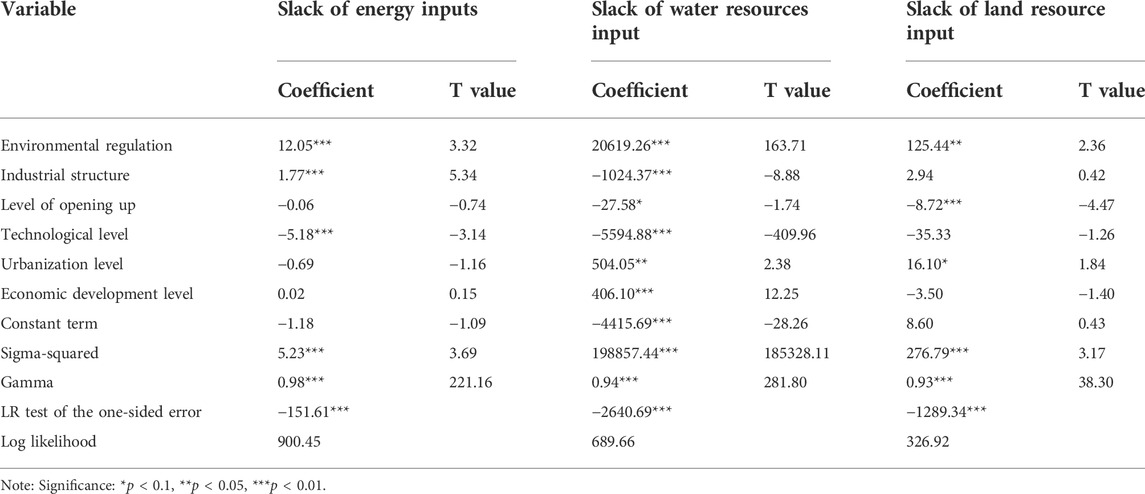
TABLE 4. Results of SFA regression in the second stage.
As can be seen from Table 4,
The estimated coefficients of environmental variables indicate that they have different effects on corresponding input redundancy. When the regression coefficient is positive, there is a positive correlation between environmental variables and input slacks, that is, the increase of environmental variables will lead to the increase of input redundancy, which will adversely affect the level of ecological well-being performance. When the regression coefficient is negative, the increase of environmental variables is conducive to the reduction of input redundancy, and promotes the level of ecological well-being performance. The specific analysis is as follows:
(1) The regression coefficients of energy, water, and land resource slack inputs redundancy of environmental regulation are significantly positive, indicating that the enhancement of environmental regulation aggravates is correlated to the waste of energy, water, and land resource utilization. A possible reason is that the Chinese government has a strong willingness to change the present situation of the environmental pollution, resource waste, but the existing environmental governance “passive governance” phenomenon, namely when pollution is aggravating, shortage of resources to strengthen governance, although relieves the problem such as environmental pollution, that did not fundamentally improve the utilization efficiency of inputs.
(2) The regression coefficient of industrial structure to slack of energy inputs is significantly positive, and the regression coefficient to water resource input redundancy is significantly negative. This shows that at the present stage, the increase of the proportion of the secondary industry causes the most obvious waste of energy input, because the development model of China’s secondary industry is still relatively extensive, and the energy efficiency needs to be improved. However, with the promotion of China’s ecological civilization construction and innovation-driven development strategy, the development of the secondary industry has played a certain role in promoting the conservation and utilization of water resources.
(3) The regression coefficients of the level of opening-up on the input of energy, water resources, and land resources are all negative, and the redundancy of the input of water resources and land resources passes the significance test at the level of 10% and 1%. This shows that the improvement of the level of opening to the outside world will produce a saving phenomenon on the utilization of water resources and land resources. The reason lies in that trade is an effective way to spread knowledge and spillover technology, and the increase of opening-up is conducive to China’s introduction of foreign advanced technology and learning from the development model, thus promoting intensive development.
(4) The regression coefficients of technology level on energy and water resource input redundancy are significantly negative. This shows that the improvement of technological level will produce a saving phenomenon on the utilization of energy and water resources. This is consistent with the reality that the application of new technologies can significantly reduce the waste of energy and water by eliminating outdated production facilities and processes. The redundancy of technology level to land resource input is negative, but not significant. This is because the utilization of land resources is affected by policies, population, and other factors at the same time, and the promotion effect of technology is relatively limited.
(5) The regression coefficients of urbanization level on water resources and land resources input redundancy are positive. This shows that the improvement of urbanization level increases the waste of water and land resources. The reason is that China’s urbanization has a certain degree of “spread out” blind expansion. The regression coefficient of urbanization level to energy input redundancy is negative, but not significant. The possible reason is that the improvement of urbanization level drives the development of tertiary industry, improves energy utilization efficiency, and saves energy utilization, but this effect is still relatively weak.
(6) The regression coefficient of economic development level to water resources input redundancy is significantly positive. This shows that the higher the level of economic development, the more serious the phenomenon of water resources waste, which is mainly affected by the “well-being threshold,” that is, when the level of economic development exceeds a certain threshold, continued economic growth does not necessarily bring a higher level of social well-being. However, the continued economic growth still requires the input of water resources, so the water resources that have not been converted into the level of social well-being will be converted into input redundancy. However, the economic development level has no significant impact on energy and land resource input redundancy, which is similar to Guo’s findings (Guo et al., 2018).
Based on the regression results of the second stage, the original input variables were adjusted, and the provinces (cities and districts) were adjusted to the same external environment. The super-efficiency SBM model was used to obtain the Ecological well-being performance levels of 30 provinces (cities and districts) in China from 2004 to 2017, and the results were compared with those of the first stage, as shown in Table 5.
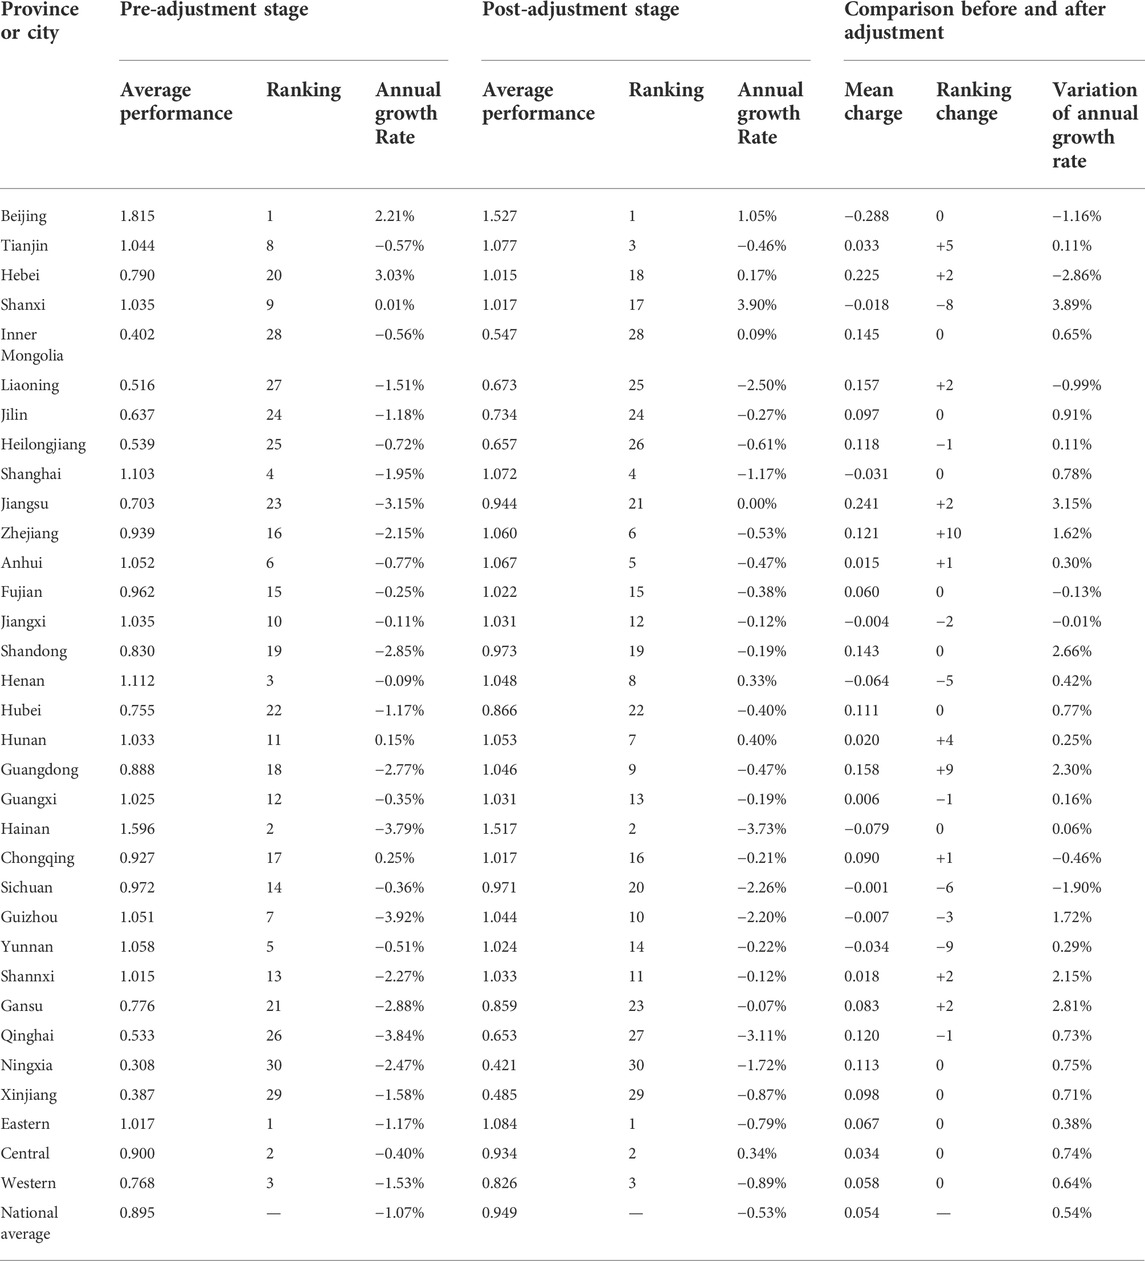
TABLE 5. Comparison of the results of the first stage and the third stage.
As shown in Table 5, the performance level of ecological well-being at the national, regional, or provincial level are all significantly different from that of the first stage.
At the national level, the ecological well-being performance level after adjustment was 0.949, which is 0.054 higher than 0.895 before the adjustment; After adjustment, the average annual decline rate was −0.53%, 0.54% lower than −1.07% before adjustment, namely, the ecological well-being performance level was improved after adjustment, and the decline rate was reduced. This indicates that environmental factors and random disturbances have a restraining effect on the improvement of ecological well-being performance in the whole country, which leads to the underestimation of ecological well-being performance in the first stage. Therefore, changing the external environment of ecological well-being performance level, such as rational use of environmental regulation tools, the transformation of economic development mode, implementation of innovation-driven development, implementation of human-centered urbanization, etc., are feasible ways to improve the performance level of ecological well-being.
At the regional level, the mean value of Ecological well-being performance in the eastern region increased from 1.017 to 1.084, in the central region from 0.900 to 0.934, and in the western region from 0.768 to 0.826. The pattern of “decreasing from East to West” of Ecological well-being performance did not change. In terms of the range of change, the eastern region has the largest increase, followed by the western region and the central region. This shows that compared with the eastern and western regions, excluding environmental factors and random interference has the least impact on the central region, that is, the external development environment itself in the central region is relatively good. In addition, an increasing gap between the eastern and central, western and eastern, central and east-west ecological benefits performance level by adjusting the average gap before rose to 0.150, 0.258, 0.117, 0.249, suggesting that the East high and is not dependent on the performance of a good external environment and the good results of random disturbance, but the eastern region for energy and do have higher utilization of resources and management level.
At the provincial level, after removing the influence of environmental factors and random disturbance, the ecological well-being performance of most provinces increased, but only Beijing, Shanxi, Shanghai, Jiangxi, Henan, Hainan, Sichuan, and Yunnan showed a decline. As stated earlier, Beijing, Shanghai, “city level” make them enjoy more policy tilt, Hainan has advantaged advantage “endowment,” Shanxi, Jiangxi, Henan, Sichuan, and Yunnan are due to its “development stage,” eliminating environmental factors lead to the area lack of good external environment, thus there is an obvious ecological benefits performance decline. After adjusting the ecological benefits of performance levels ranking among the top three, Zhejiang, Guangdong, and Tianjin, respectively up nine and five, ten, the above areas are in the eastern region, influenced by “well-being threshold” is stronger, thus eliminating environmental factors and random disturbance, the resulting ecological benefits performance reflects the actual management of energy, resources and utilization level.
To explore the evolution of the ecological well-being performance of 30 provinces (municipalities and autonomous regions) in China from 2004 to 2017, this study uses the super-SBM model to conduct in-depth analysis from temporal and spatial perspectives.
Based on the results of the third-stage Super-SBM model, the average evolution trend of ecological well-being performance levels in China and the three regions of eastern, central, and western China was drawn (Figure 2).
(1) Nationally, the average performance level of ecological well-being in each year is above 0.90, indicating that there is still room for improvement after excluding the influence of environmental factors and random interference. From 2004 to 2017, the national ecological well-being performance showed a trend of decline in fluctuation, and maintained a stable state from 2004 to 2011, with a large decline from 2012 to 2017.
(2) By region, the eastern region has always had the highest level of Ecological well-being performance, while the western region has always had the lowest level, and the central region is closest to the national average. From 2004 to 2014, the eastern region maintained a declining state in fluctuations and recovered from 2015 to 2017. The possible reason is that the eastern region was the first to be affected by the “well-being threshold” and at the same time took the first regulatory measures, so the Ecological well-being performance level recovered first among the three regions. The central region keeps rising in fluctuation, which indicates that the central region is in a dynamic balance between the consumption of natural resources and the generation of social well-being. Western region ecological benefits performance levels held steady from 2004 to 2011, the basic state, there is an obvious decline in 2012–2017, the possible reason is accepted in the east part of the “high pollution, high energy consumption and high emissions” enterprise after the transfer, the western region for energy and resource management efficiency is not high seriously affected the ecological benefits performance levels, then lower the average national ecological benefits performance.
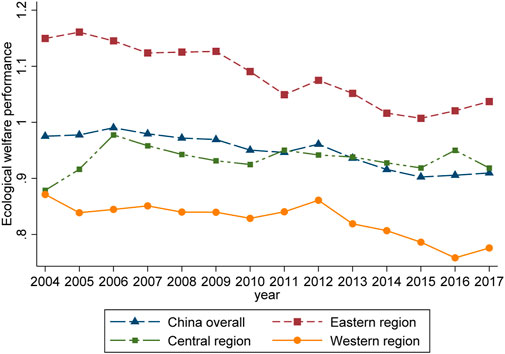
FIGURE 2. The evolution of the average value of Ecological well-being performance in China and the three major regions.
To more clearly display the temporal evolution of Ecological well-being performance of provinces (cities and districts), the non-parametric Kernel density function with Gaussian normal distribution was adopted. The years 2004, 2008, 2013, and 2017 were selected as observation points for Kernel density estimation, and the distribution conditions at different time points were obtained (see Figure 3). As can be seen from the figure, the center of the distribution curve of the overall Ecological well-being performance level in China remained around 1.1, indicating that most provinces reached a relatively effective state in the observed years. Main peak height over time down after rising first, and the curve width increasing, especially the curve on the left side of the widening trend obviously, this shows that the whole observation period, the national ecological well-being performance levels showed a trend of decline, the absolute difference between provincial exists a certain degree of increase, part of the province’s performance obvious downward trend. At the same time, it is not difficult to see that the distribution curve of the national overall ecological well-being performance level has an obvious right trailing phenomenon during the observation period, and its distribution ductility shows a shrinking trend, indicating that provinces with high ecological performance level have decreased during the observation period. In terms of the number of peaks, the level curve of ecological well-being performance presented a bimodal distribution of “low left and high right.” The bimodal distribution was not obvious in 2004, but gradually became obvious and the side peak height kept rising. This is because, over time, provinces have different management levels of energy and resources, leading to the “polarization” trend of ecological well-being performance.
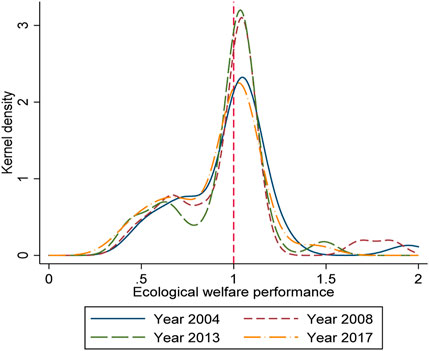
FIGURE 3. Kernel nuclear density estimation of China’s Ecological well-being performance.
To analyze the spatial correlation of ecological well-being performance level, Moran’s I index of each year can be calculated according to the ecological well-being performance level of 30 provincial cities in China from 2004 to 2017 by using a 0–1 adjacency weight matrix and geographical distance weight matrix respectively, as shown in Table 6.
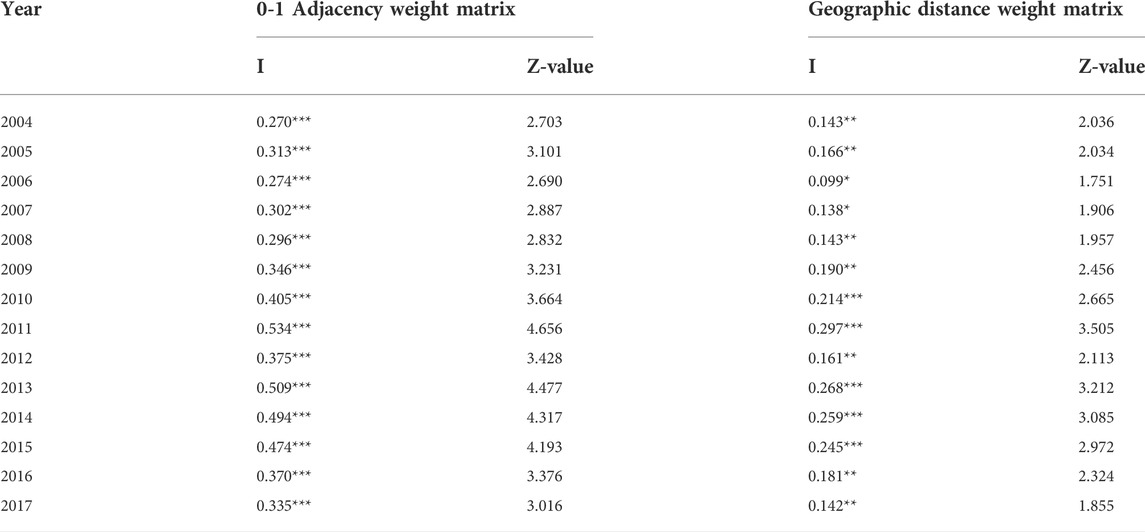
TABLE 6. Global spatial autocorrelation test results of China’s Ecological well-being performance levels from 2004 to 2017.
As can be seen from Table 6, both in 0–1 adjacency weight matrix and geographical distance weight matrix, the Moran’s ⅰ index of China’s ecological well-being performance from 2004 to 2017 was positive, and both passed the significance test at the level of 10%. This shows that there is a significant positive correlation between China’s ecological well-being performance. In other words, the distribution of ecological well-being performance value in China is not random distribution, but spatial distribution has a certain agglomeration phenomenon. Provinces with higher ecological well-being performance value tend to cluster together, and vice versa. From the perspective of spatial correlation intensity, China’s ecological well-being performance experienced a “weak-strong-weak” fluctuation state, and the Moran’s ⅰ index in both spatial weight matrices reached the highest value in 2011. The possible reason is that with the closer communication among regions, the spatial correlation of ecological well-being performance level gradually increased from 2004 to 2011. From 2012 to 2017, China’s industrial transformation accelerated, gradually shifting from factor and investment-driven development to innovation-driven development, and there was a certain differentiation of ecological well-being performance among provinces, resulting in a certain decline in spatial correlation.
ArcGIS software was used to analyze the spatial differences of ecological well-being performance of 30 provinces (cities and districts) in China from 2004 to 2017, and the natural breakpoint method was used to classify ecological well-being performance into five levels from high to low. We selected 2004, 2008, 2013, and 2017 as observation points at intervals of 4 or 5 years, which clearly showed the changing trend of the spatial distribution pattern of EWP (Figure 4). As can be seen from Figure 4, there are significant spatial differences in China’s ecological well-being performance:
(1) In 2004, EWP in Xinjiang, Inner Mongolia, Gansu, and Shanxi provinces was at a low level. EWP in Heilongjiang, Jilin, Liaoning, Qinghai, and Hubei was in the middle and low level. The EWP of Beijing, Shanghai, Anhui, Zhejiang, Fujian, Guangdong, and Guizhou were in the middle and high level, and these provinces mainly concentrated in the southeast coastal area. Finally, only Hainan province has a high level of EWP.
(2) In 2008, EWP decreased significantly in almost all provinces. Heilongjiang, Liaoning, Qinghai, Gansu, Jiangsu, Fujian, Guangdong, and Guizhou all dropped by one level. However, only Beijing jumped from medium to high level, while Henan jumped from medium to high level.
(3) In 2013, EWP in Jilin, Henan, Zhejiang, and Hainan provinces dropped by one level. On the other hand, EWP in Jiangsu, Tianjin, Hunan, and Guizhou rose by one level each. In this year, a total of seven provincial capital cities were at low level, distributed in the northeast and western regions, and the eastern coastal areas, except Liaoning, were at medium or medium-high level, with the gap between them decreasing.
(4) In 2017, Sichuan, Guizhou, Hunan, Tianjin, and Anhui experienced a decline in ecological well-being performance. However, the level of ecological well-being performance in Heilongjiang, Jilin, Gansu, and Henan has risen. The declining regions are generally medium or high level provinces, while the rising regions are mostly low level or medium and low level provinces, which reflects the “catch-up” phenomenon of backward regions, indicating that there is a certain convergence trend of ecological well-being performance.
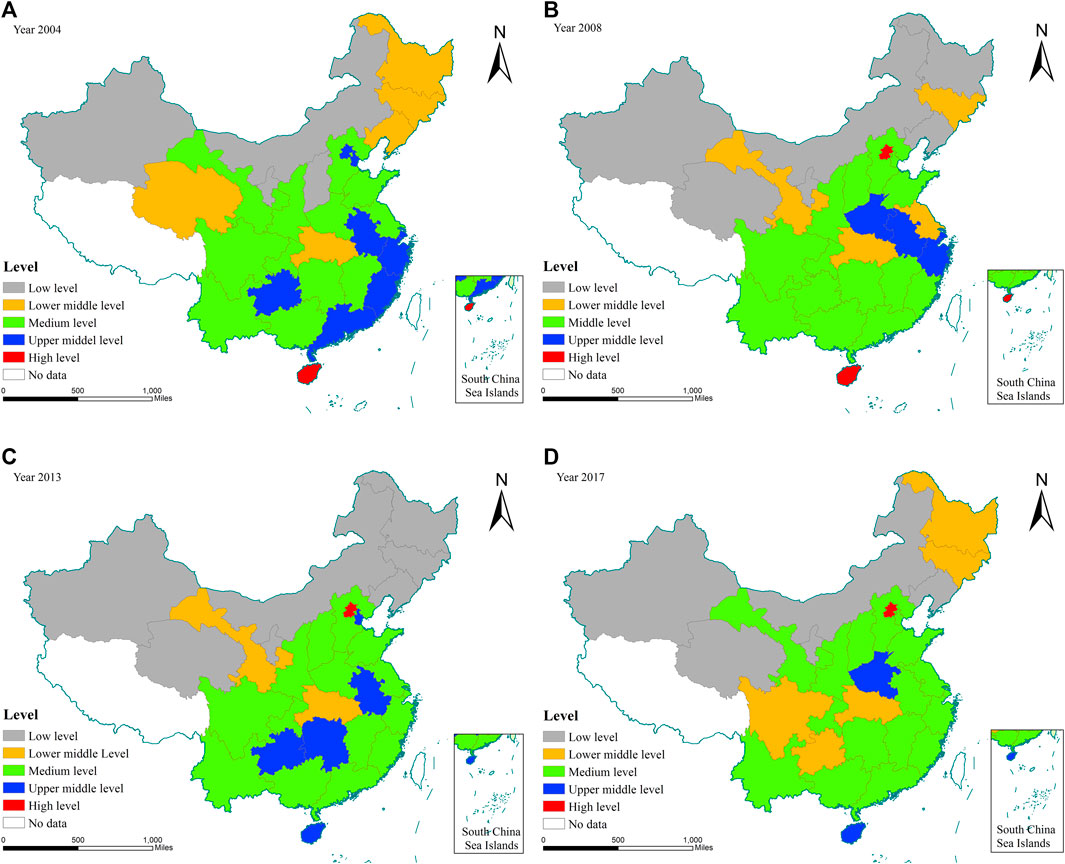
FIGURE 4. Spatial differences in China’s Ecological well-being performance levels from 2004 to 2017.
In general, the leading provinces of ecological well-being performance in 2004 were mainly concentrated in the southeast coastal areas, and then gradually moved to the central region, leading to the gradual “convex” distribution characteristics, that is, the number of leading provinces of Ecological well-being performance in the central region was more than that in the East and West regions. From the region, it can be seen that the gap within the western region is the largest, followed by the eastern region, and the smallest gap within the central region.
This study measures the ecological well-being performance of 30 provinces (municipalities and autonomous regions) in China from 2004 to 2017 by using the three stage super-efficient SBM-DEA model and analyzes the temporal and spatial evolution of the ecological well-being performance. Our results draw the following thoughts/conclusions on EWP.
First, the overall ecological well-being performance in China has a downward trend from 2004 to 2017; The distribution pattern was highest in the East, second in the middle, and lowest in the West. EWP is the latest index to measure the level of economic and social development. It can further bring the level of social welfare into the analysis framework on the basis of production efficiency and ecological efficiency. The downward trend of EWP means that policy makers should pay attention to the relationship among economic growth, ecological protection and improvement of people’s livelihood and well-being.
Secondly, the improvement of environmental regulation, urbanization level, and economic development level has a positive effect on factor input redundancy, and then hurts the improvement of Ecological well-being performance; The level of openness to the outside world and the level of technology hurt factor input redundancy, which is conducive to the improvement of Ecological well-being performance. The industrial structure has different effects on the redundancy of different factor inputs.
Third, after excluding the influence of environmental factors and random interference, the overall performance level of ecological well-being in China has been improved, and the gap between East-central and East-West regions has been widened. Few provinces have seen a decline in the performance level of ecological well-being, while the most obvious increase is concentrated in the eastern region.
Fourthly, from the perspective of time series, the Ecological well-being performance of the three regions showed a downward trend from 2004 to 2017, especially after 2012, the regional differentiation became more obvious and the “bipolar” differentiation trend of the provincial Ecological well-being performance was strengthened.
Fifth, the level of ecological well-being performance has an obvious positive spatial correlation, showing a “weak-strong-weak” fluctuation state in intensity; At the same time, the provinces with higher ecological well-being performance shifted from the southeast coast to the inland, resulting in a certain “convex” spatial layout.
The original contributions presented in the study are included in the article/supplementary material, further inquiries can be directed to the corresponding author.
YD organized study, prepared datasets, performed the statistical analysis, and drafted the manuscript. YM designed the study, organized study, and translated the manuscript. XY contributed to organize study, prepare datasets, and draft the manuscript.
This study was financially supported by the National Natural Science Foundation of China (No. 71673302), the Fundamental Research Funds for the Central Universities (No. 2722021BX018).
The authors declare that the research was conducted in the absence of any commercial or financial relationships that could be construed as a potential conflict of interest.
All claims expressed in this article are solely those of the authors and do not necessarily represent those of their affiliated organizations, or those of the publisher, the editors and the reviewers. Any product that may be evaluated in this article, or claim that may be made by its manufacturer, is not guaranteed or endorsed by the publisher.
Ameen, R. F. M., Mourshed, M., and Li, H. (2015). A critical review of environmental assessment tools for sustainable urban design. Environ. Impact Assess. Rev. 55, 110–125. doi:10.1016/j.eiar.2015.07.006
Bian, J., Ren, H., and Liu, P. (2020). Evaluation of urban ecological well-being performance in China: A case study of 30 provincial capital cities. J. Clean. Prod. 254, 120109–9. doi:10.1016/j.jclepro.2020.120109
Bjornskov, C. (2010). How comparable are the Gallup world poll life satisfaction data. J. Happiness Stud. 11, 41–60. doi:10.1007/s10902-008-9121-6
Common, M. (2007). Measuring national economic performance without using prices. Ecol. Econ. 64, 92–102. doi:10.1016/j.ecolecon.2007.07.017
Daly, H. E. (2005). Economics in a full world. IEEE Eng. Manag. Rev. 293, 21–107. doi:10.1109/EMR.2005.27010
Daly, H. E. (1990). Sustainable development: From concept and theory to operational principles. Popul. Dev. Rev. 16, 25–43. doi:10.2307/2808061
Daly, H. E. (1974). The world dynamics of economic growth: The economics of the steady state. Am. Econ. Rev. 64, 15
Dietz, T., Rosa, E. A., and York, R. (2012). Environmentally efficient well-being: Is there a Kuznets curve? Appl. Geogr. 32, 21–28. doi:10.1016/j.apgeog.2010.10.011
Dietz, T., Rosa, E. A., and York, R. (2009). Environmentally efficient well-being: Rethinking sustainability as the relationship between human well-being and environmental impacts. Hum. Ecol. Rev. 16, 114. doi:10.1016/j.apgeog.2020.10.011
Fang, S., and Xiao, Q. (2019). Research on regional ecological well-being performance and spatial effect in China. China Popul. Resour. Environ. 29, 1. doi:10.12062/cpre.20181011
Fried, H. O., Lovell, C. A. K., Schmidt, S. S., and Yaisawarng, S. (2002). Accounting for environmental effects and statistical noise in data envelopment analysis. J. Product. Anal. 17, 157–174. doi:10.1023/a:1013548723393
Guo, S., Tong, M., Guo, J., et al. (2018). Measurement and influencing factors of inter-provincial real environmental efficiency based on three-stage DEA model. China Popul. Resour. Environ. 28 (03), 106. doi:10.12062/cpre.20170917
Jorgenson, A. K., Alekseyko, A., and Giedraitis, V. (2014). Energy consumption, human well-being and economic development in central and eastern European nations: A cautionary tale of sustainability. Energy Policy 66, 419–427. doi:10.1016/j.enpol.2013.11.020
Long, L.-j., and Wang, X. (2017). A study on Shanghai’s ecological well-being performance. China. Popul. Resour. Environ. 27, 84–92. doi:10.3969/j.issn.1002-2104.2017.02.013
Manfred, M. N. (2005). Economic growth and quality of life: A threshold hypothesis. Ecol. Econ. 2, 115–118. doi:10.1016/0921-8009(95)00064-X
National, N. B. S. (2021). Bureau of statistics of the people’s Republic of China. NBS. Available at: http://www.stats.gov.cn/tjsj/ndsj/2021/indexch.htm.
Ng, Y. K. (2007). Environmentally responsible happy nation index: Towards an internationally acceptable national success indicator. Soc. Indic. Res. 85, 425–446. doi:10.1007/s11205-007-9135-1
Rice, J. (2008). Material consumption and social well-being within the periphery of the world economy: An ecological analysis of maternal mortality:an ecological analysis of maternal mortality. Soc. Sci. Res. 37, 1292–1309doi. doi:10.1016/j.ssresearch.2008.05.006
Tone, K. (2001). A slacks-based measure of efficiency in data envelopment analysis. Eur. J. Oper. Res. 130, 498–509. doi:10.1016/S0377-2217(99)00407-5
Tone, K. (2002). A slacks-based measure of super-efficiency in data envelopment analysis. Eur. J. Oper. Res. 143, 32–41. doi:10.1016/S0377-2217(01)00324-1
Xiao, L., and Zhang, X. (2019). Spatio-temporal characteristics of coupling coordination between green innovation efficiency and ecological welfare performance under the concept of strong sustainability. Sci Tech Manag Res 34, 312–324. doi:10.31497/zrzyxb.20190208
Xu, Y., Qi, P., and Tong, L. (2017). Spatial-temporal differentiation of Chinese provincial ecological well-being performance. Reg. Econ. Rev. 04, 123–131. doi:10.14017/j.cnki.2095-5766.2017.0134
Zhu, D. (2008). Ecological economics:economics and management of sustainable development [J]. Bull. Chin. Acad. Sci 23 (6), 520–531. doi:10.16418/j.issn.1000-3045.2008.06.010
Keywords: ecological well-being performance, level measurement, spatiotemporal evolution, three-stage super-efficiency SBM-DEA model, Chinese provinces
Citation: Deng Y, Ma Y and Yang X (2022) Provincial ecological well-being performance level measurement and its spatial-temporal evolution analysis in China. Front. Environ. Sci. 10:1007231. doi: 10.3389/fenvs.2022.1007231
Received: 30 July 2022; Accepted: 18 August 2022;
Published: 12 September 2022.
Edited by:
Atif Jahanger, Hainan University, ChinaReviewed by:
Joshua Chukwuma Onwe, Federal Polytechnic Ohodo, NigeriaCopyright © 2022 Deng, Ma and Yang. This is an open-access article distributed under the terms of the Creative Commons Attribution License (CC BY). The use, distribution or reproduction in other forums is permitted, provided the original author(s) and the copyright owner(s) are credited and that the original publication in this journal is cited, in accordance with accepted academic practice. No use, distribution or reproduction is permitted which does not comply with these terms.
*Correspondence: Xu Yang, MjAxODExMDgwMjI5QHN0dS56dWVsLmVkdS5jbg==
Disclaimer: All claims expressed in this article are solely those of the authors and do not necessarily represent those of their affiliated organizations, or those of the publisher, the editors and the reviewers. Any product that may be evaluated in this article or claim that may be made by its manufacturer is not guaranteed or endorsed by the publisher.
Research integrity at Frontiers
Learn more about the work of our research integrity team to safeguard the quality of each article we publish.