
94% of researchers rate our articles as excellent or good
Learn more about the work of our research integrity team to safeguard the quality of each article we publish.
Find out more
ORIGINAL RESEARCH article
Front. Environ. Sci., 07 December 2022
Sec. Drylands
Volume 10 - 2022 | https://doi.org/10.3389/fenvs.2022.1005114
This article is part of the Research TopicDryland Agriculture: Crop Adaptations, Increasing Yield and Soil FertilityView all 5 articles
 Upendra M. Sainju1*
 Daniel Liptzin2
Soil chemical properties have often been related to some other soil properties and crop yields, but extensive evaluation of the relationships of soil chemical properties with other properties and long-term crop yields under dryland cropping systems is lacking. We related six soil chemical properties (pH, electrical conductivity [EC], cation exchange capacity [CEC], and inorganic P [IP], K, and Al concentrations) with 62 other soil physical, chemical, biological, and biochemical properties and crop yields at two long-term (14- and 36-year old) dryland farming sites in the northern Great Plain, United States. Treatments were rotations of no-tillage and conventional tillage spring wheat (Triticum aestivum L.), barley (Hordeum vulgare L.), pea (Pisum sativum L.), and fallow with or without N fertilization. Soil samples collected to a depth of 0–15 cm in April 2019 were analyzed for soil properties and long-term crop yields were determined. Soil chemical properties were mostly correlated to each other at the short-term than at the long-term site. Based on the principal component analysis, EC, CEC, and IP, and K concentrations were associated with most of the physical, chemical, biological, and biochemical properties at both sites. The CEC, IP, and K concentrations were related to mean crop yields across years at individual or combined sites, but other chemical properties were not related to yields. We conclude that CEC, IP, and K concentrations may be used as potential chemical indicators of soil health that were related to most soil properties and crop yields under dryland cropping systems in the semiarid region.
Soil chemistry involves chemical constituents and properties as well as reaction of soils and plays a pivotal role in crop production and human health (Ohno and Hettiarichchi, 2018). The chemical reactions among nutrients, contaminants, toxic elements, soil organic matter (SOM), and composition of soil solution affect soil, water, air, and food quality (Ohno and Hettiarichchi, 2018). Soil chemical properties are mostly used to measure soil fertility and health compared to physical and biological properties due to their rapid measurement, applicability to field conditions, accessible to producers, dynamic nature, and ability to capture a wide range of soil functions (Brejda et al., 2000; Veum et al., 2021). Differences in inherent characteristics of soils can result in variations in soil health that influence crop yields and environmental quality (Veum et al., 2021).
Chemical soil health indicators used for nutrient availability to crop production and environmental protection are typically represented by pH, electrical conductivity (EC), cation exchange capacity (CEC), and extractable P, K, and Al concentrations (Maddonni et al., 1999; Veum et al., 2021). Soil pH can affect nutrient availability to plants due to dissolution of nutrients at various pH levels (Maddonni et al., 1999; Veum et al., 2021). While acidic cations, such Al, Fe, and NH4, are available mostly at low pH to crops, basic cations, such as Ca, Mg, K, and Na, are available primarily at high pH. As a result, most of the nutrients are available at neutral pH (6.5–7.0) where there are no toxic effects of elements to plants (Maddonni et al., 1999; Veum et al., 2021). The EC indicates soil salinity level that also affects crop production, as some crops are tolerant to high salinity level, but others are not (Jung et al., 2005). For long-term sustainability of cropping systems, soils need to adequately supply nutrients, such as P and K, to crops through CEC and mineralization of soil organic matter (SOM) (Karlen et al., 1997). Fertilizers can be applied to correct nutrient deficiencies in plants and enhance yields, but excessive application can degrade soil and environmental quality by enhancing soil acidification, leaching, and greenhouse gas emissions (Liebig et al., 2002; Herrero et al., 2010). As a result, fertilizer rates should be adjusted according to soil test and crop demand so that crop yields and environmental quality can be sustained (Karlen et al., 1997; Liebig et al., 2002; Sainju et al., 2016). High concentration of Al is usually toxic to plants and can reduce yields (Burleigh et al., 1999).
For evaluating soil chemical properties as potential soil health indictors, it is necessary to examine if these properties are related to other soil properties and crop yields (Maddonni et al., 1999; Ohno and Hettiarichchi, 2018; Veum et al., 2021). Soil chemical properties can be related to each other and to other soil properties. Some researchers (Manrique et al., 1991; Johnson et al., 2001; Jung et al., 2005) reported that CEC was related to soil pH and EC. Several researchers (Manrique et al., 1991; Olorunfemi et al., 2016) showed that CEC can be predicted from pH, SOM, and clay concentration. The EC was related to extractable P (Johnson et al., 2001; Jung et al., 2005), soil total C (STC), clay concentration (Grigera et al., 2006), bulk density (BD), and clay and silt concentrations (Jung et al., 2005). Soil pH was related to potential N mineralization (PNM) (Dessucault-Rompree et al., 2010) and phosphomoneesterase (PME) activity (Acosta-Martinez and Tabatabai, 2011). Xu et al. (2022) found that soil pH was correlated to SOM, KMnO4-extractable C (POXC), autoclaved citrate-extractable protein (ACEP), soil total N (STN) and water holding capacity. Van Es and Karlen, (2019) observed that soil pH, P, and K concentrations were positively related to potential C mineralization (PCM). The pH was negatively related to soil inorganic C (SIC), but positively related to Ca and Mg concentrations (Mikhailova and Post, 2006; Sainju et al., 2020).
Soil chemical properties can also be related to crop yields. Anthony et al. (2012) reported that soil P and Zn concentrations were positively correlated, but pH was negatively correlated to soybean (Glycine max L.) yield. Bulrleigh et al. (1999) found that soil Al concentration was negatively related to winter wheat yield. Varvel et al. (1981) observed that extractable P was correlated to sugarbeet (Beta vulgaris L.) yield at individual site but not to combined sites. Jung et al. (2005) showed that EC and CEC were positively related to corn (Zea mays L.) and soybean yields during years with above-average precipitation, but negatively related during years with below-average precipitation, citing to variations in nutrient availability due to dissolution with water. Maddonni et al. (1999) proposed that chemical indicators of soil health can be obtained from response to crop yield, as crop yields vary with changes in soil chemical properties.
Although soil chemical properties have been largely used as soil quality indicators to relate with crop yields and environmental quality, they have not been related to extensive soil properties and long-term crop yields, especially in dryland cropping systems. Crop yields in dryland farming depend largely on growing season precipitation, but yields are also affected by nutrient limitations (Reardon et al., 2019; Liang et al., 2021). Because of their effects on nutrient availability and crop growth and production (nutrition, salinity, and toxicity), we concentrated our study on six major soil chemical properties (pH, EC, CEC, and inorganic P [IP], K, and Al concentrations) that affect nutrient availability and crop yields and related them to 62 other soil physical, chemical, biological, and biochemical properties and mean crop yields across years in two long-term (14- and 36-year-old) dryland farming sites in eastern Montana, United States. The 62 soil properties affect soil compaction, water availability and infiltration capacity, aggregation, nutrient availability, and soil microbial community structure, abundance, and activity influencing nutrient cycling, that have major impact on crop production and environmental quality. We hypothesized that some soil chemical properties would be better related to most other soil properties and crop yields and therefore would be used as potential soil health indicators. Our objectives were to: 1) examine how soil pH, EC, CEC, and IP, K, and Al concentrations relate to 62 other soil properties and mean long-term crop yields across years under dryland cropping systems in the semiarid region of United States northern Great Plains, and 2) determine which soil chemical properties can be considered as potential soil health indicators.
Two field experiments were conducted at dryland sites (Froid and Sidney) in eastern Montana, United States. The site at Froid is 36-year old and had mean annual air temperature (30-year average) of 8°C and average annual precipitation of 357 mm. The soil is Dooley sandy loam (fine loamy, mixed, frigid, Typic Argiboroll) with 645 g kg−1 sand, 185 g kg−1 silt, 170 g kg−1 clay, 14.9 g kg−1 soil organic C (SOC), and 6.2 pH at the 0–15 cm depth at the beginning of the experiment in 1983. The site at Sidney is 14-year old and had mean annual air temperature of 8°C and average annual precipitation of 340 mm. The soil is Williams loam (fine-loamy, mixed, superactive, frigid, Typic Argiustolls) with sand, silt, and clay concentrations of 350, 325, and 325 g kg−1 respectively, pH 7.2, and SOC 13.2 g kg−1 at the 0–20 cm depth at the initiation of the experiment in 2006.
The treatments at Froid were described in detail by Aase and Pikul (1995). In brief, treatments were fall and spring till continuous spring wheat (FSTCW), no-till continuous spring wheat (NTCWA), no-till spring wheat-barley (1984–1999) replaced by no-till spring wheat-pea (2000–2019) (NTWPA), and spring till spring wheat-fallow (STWF), each replicated for four times in a randomized block design. In each cropping system, each phase of the crop appeared in every year. Tillage in FSTCW occurred with a tandem disc in the fall and a field cultivator in the spring to a depth of 8 cm to prepare the seedbed. Similarly, tillage in STWF occurred with a field cultivator to a depth of 8 cm in the spring and during the fallow period as needed to control weeds. In other treatments, tillage was not applied. The control treatment was STWF which is a conventional cropping in the region. The size of the plot was 12 × 30 m.
At Sidney, Sainju and Alasinrin, (2020) described treatments in detail. In short, treatments were cropping system as the main plot and N fertilization as the split-plot factor arranged in a split-plot design in randomized block with three replications. Cropping systems included conventional till barley/spring wheat-fallow (CTWF, traditional system), no-till barley/spring wheat-fallow (NTWF), no-till continuous barley/spring wheat (NTCWB), and no-till barley/spring wheat-pea (NTWPB). In each treatment, barley was grown from 2006 to 2011, which was replaced by spring wheat from 2012 to 2019. All phases of crops in the rotations occurred in each year. Tillage in CTWF was performed with a field cultivator to a depth of 8 cm to prepare seedbeds in the spring and during the fallow period to control weeds. Tillage was not applied to other treatments. Nitrogen fertilizer was broadcast to barley at 0 (N0) and 80 kg N ha−1 (N1) from 2006 to 2011 and to spring wheat at 0 (N0) and 100 kg N ha−1 (N1) from 2012 to 2019. The size of the split plot was 12.0 × 6.0 m.
At both sites, spring wheat, barley, and pea were seeded at recommended seed rates with a no-till drill at a row spacing of 20 cm. A banded application of P and K fertilizers at 11 kg P ha−1 and 27 kg K ha−1, respectively, was done to each crop at seeding. Herbicides and pesticides were applied to each crop as needed. In mid-July to early August, crops were harvested with a combine from a swath of 11.0 m × 1.5 m and grain yield was determined after oven drying subsamples at 65°C for 7 days. After grain harvest, crop residues were returned to the soil. Because tillage was conducted to a depth of 8 cm, our studies showed that tillage had no effect on soil properties at both sites even if the duration of the experiment was different. This was in contrast to those observed by Li et al. (2019).
Detailed description of soil sample collection and analysis of physical, chemical, biological, and biochemical properties at both sites were provided by Sainju et al. (2021). The methods used to determine soil properties and their abbreviations are shown in Table 1. For this study, only measurements of selected soil chemical properties will be described. Soil pH was measured by using a pH meter in a soil solution of 1:2 soil/water ratio (Thomas, 1996). The EC was measured by using a conductivity meter with a different probe in soil solution of 1:2 soil/water ratio (Thomas, 1996). Soil IP concentration was determined by extracting the soil with H3A solution (a combination of maleic, oxalic, and citric acids) and quantifying by Inductive Coupled Plasma-Atomic Emission Spectroscopy (ICP-AES) (Haney et al., 2010). Soil K and Al concentrations were determined by extracting the soil with the Mehlich 3 solution and quantifying by using ICP-AES. The CEC was determined as the sum of milliequivalent weights of basic (Ca, Mg, K, and Na) and acidic (Al and NH4) cations as shown by Culman et al. (2019). The process involves dividing the atomic weight of the element by valence to calculate gram equivalent weight and multiplied by its concentration to obtain values in meq 100 g−1 soil. The final CEC is calculated as the sum of all basic and acidic cations.
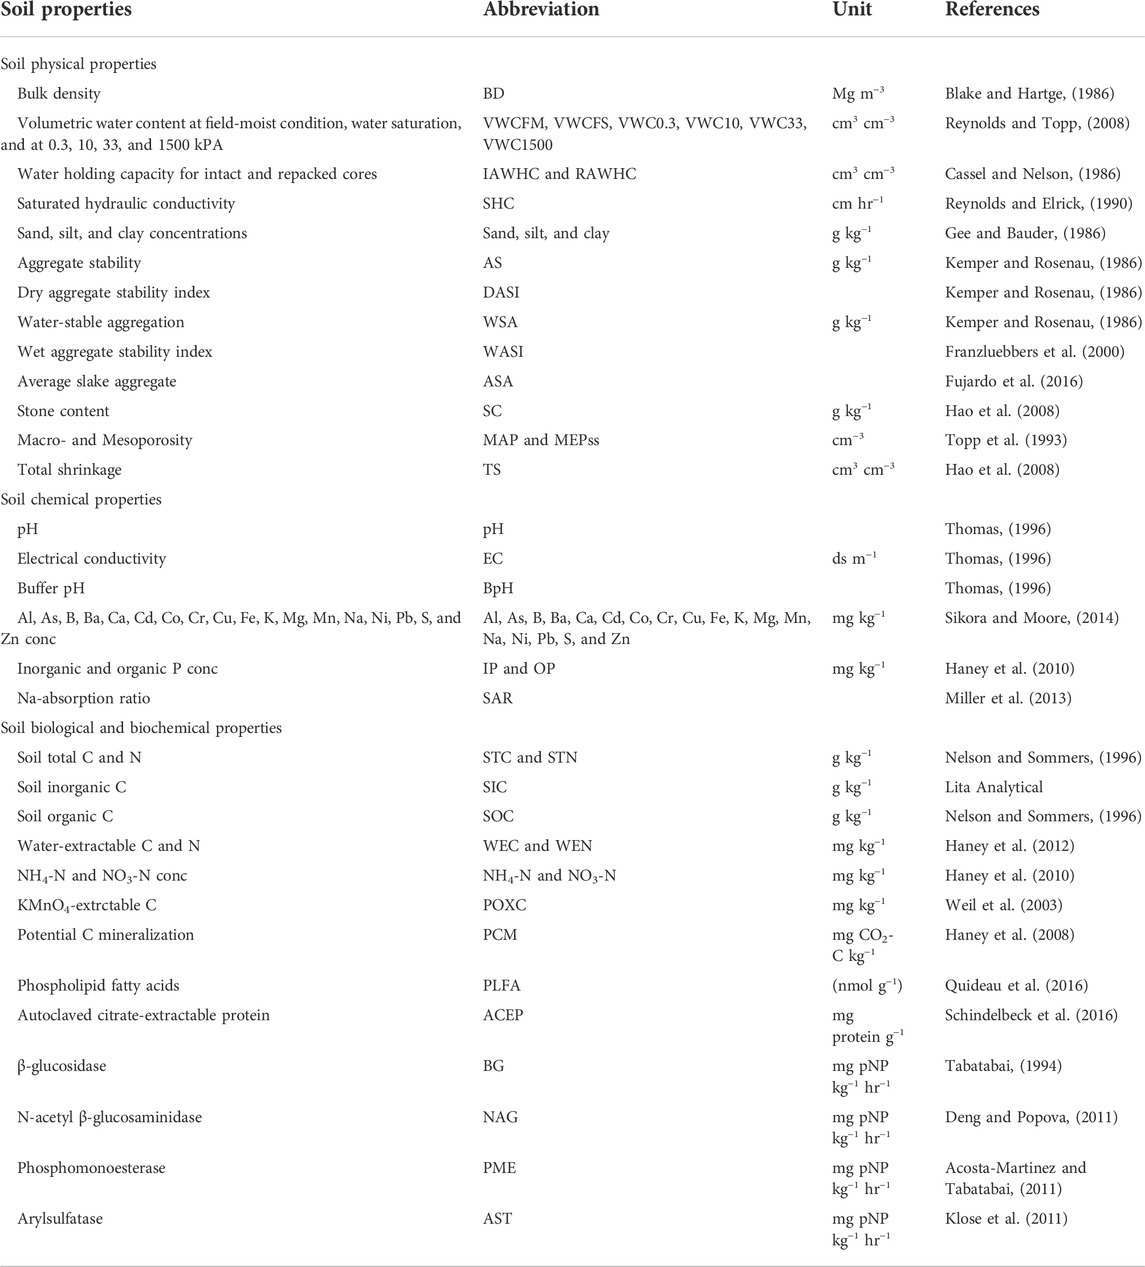
TABLE 1. Determination of soil physical, chemical, biological, and biochemical properties.
Data were analyzed by using the multivariate regression analysis to determine the associations of soil chemical properties with other soil properties after checking for normal distribution of data. For this, soil data were subjected to a principal component analysis (PCA) using the PROC FACTOR procedure of Statical Analytical System, (2020). Data were loaded into two principal components (PC1 and PC2) that explained most of the variations by soil properties (r ≥ 0.3). Parameters were considered positively associated to each other when they are at acute angles, negatively associated when at right angle, and not associated when at obtuse angle. The Pearson’s correlation analysis was used to correlate among selected soil chemical properties (pH, EC, CEC, and IP, K, and Al concentrations). Because these properties were chosen for possible soil health indicators, regression analysis was used to determine the relationships between these properties and mean crop yields across years for individual and combined sites to evaluate if crop yields can be predicted by these parameters. For these, chemical properties were used as independent variables and crop yields as dependent variables. Because data for crop yields were absent during the fallow periods of alternate years and also for the latest year in the crop-fallow treatment and yields can be affected by long-term management, it was decided to use mean crop yield across years for each treatment rather than yield for the latest year to relate with soil chemical properties. Mean crop yield was determined by dividing total yield by the number of years. Yield during the fallow period was considered zero for data analysis. Data were considered statistically significant at p ≤ 0.05, unless mentioned otherwise.
Soil pH was positively correlated to EC, but negatively correlated to Al concentration at Froid (Table 2). The EC was positively and strongly correlated to K concentration. The IP concentration and CEC were not correlated to any soil chemical properties. At Sidney, pH was positively and very strongly correlated to EC and CEC, but negatively correlated to Al and IP concentrations. The EC was positively correlated to CEC, but negatively correlated to Al and IP concentrations. The Al concentration was negatively correlated to CEC. The K concentration was positively correlated to IP concentration, which was negatively correlated to CEC. Greater and stronger correlations among soil chemical properties occurred at Sidney than at Froid.
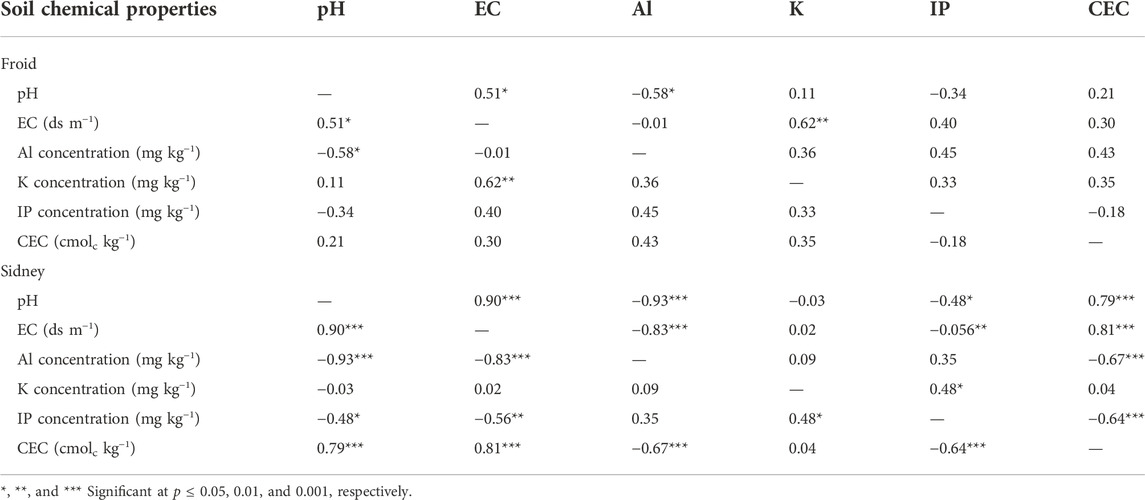
TABLE 2. Correlation (r) among soil pH, electrical conductivity (EC), cation exchange capacity (CEC), and Al, K, and inorganic P (IP) concentrations at Froid (n = 16) and Sidney (n = 24), Montana, United States.
At Froid, the PCA analysis indicated that soil chemical properties that explained 29.7% of the total variation in the first principal component (PC1) were pH, EC, CEC, buffer pH (BpH), and Ca, K, As, B, Ba, Cd, Co, Cu, Mg, Mn, Ni, organic P (OP), Pb, S, and Zn concentrations (Figure 1). Chemical properties that explained 23.8% of the total variation in the second principal component (PC2) were pH, BpH, and Al, Ca, K, IP, Cd, Fe, Mg, Mn, Na, Pb, S, and Zn concentrations. The pH was positively associated with BpH and Ca and Mg concentrations, but negatively associated with S and Fe concentrations. The EC and CEC were positively associated with Ba, Ni, As, B, Co, and Cu concentrations, but negatively associated with OP concentration. The K concentration was positively associated with Mn, Pb, and Ni concentrations, but negatively associated with Na-absorption ratio (SAR). The IP concentration was positively associated with Fe and S concentrations, but negatively to BpH. The Al concentration was positively associated with Fe and Cd concentrations. Chemical properties that were not associated with pH, EC, CEC, IP, K, and Al concentrations were Cd concentration and SAR.
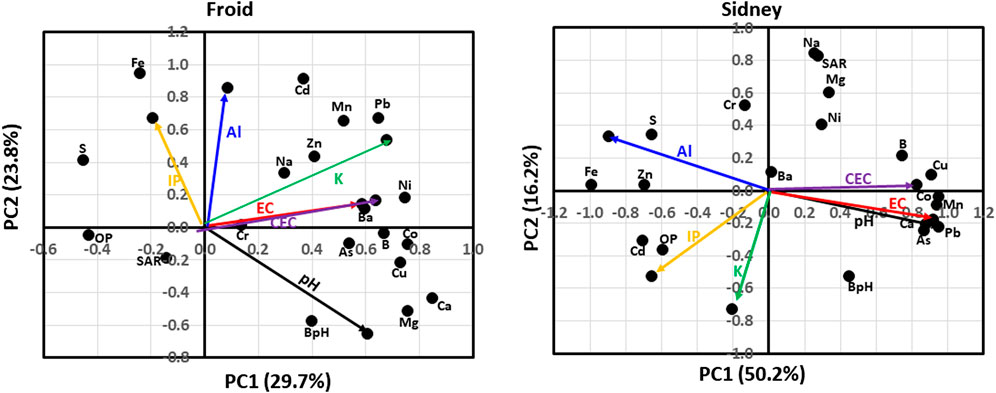
FIGURE 1. Principal component analysis for associations among soil chemical properties at Froid and Sidney, Montana, United States. At Froid, soil chemical properties explained 29.7% of the total variation in the first principal component (PC1) and 23.8% in the second principal component (PC2). At Sidney, chemical properties explained 50.2% of total variation in PC1 and 16.2% in PC2. BpH denotes buffer pH; EC, electrical conductivity; CEC, cation exchange capacity; IP, inorganic P concentration; OP, organic P concentration; and SAR, Na-absorption ratio.
At Sidney, chemical properties that explained 50.2% of the total variability in PC1 were pH. EC, BpH, CEC, and Al, Ca, IP, As, B, Cd, Co, Cu, Fe, Mg, Mn, Ni, OP, Pb. S, and Zn concentrations (Figure 1). Chemical properties that explained 16.2% of the total variability in PC2 were Al, K, IP, BpH, SAR, and Cd, Cr, Mg, Na, Ni, and S concentrations. The pH and EC were positively associated with As, Pb, Ca, Mn, and Co concentrations and negatively associated with Fe and Zn concentrations. The CEC was positively associated with B, Cu, Co, and Mn concentrations, but negatively associated with Fe and Zn concentrations. The IP concentration was positively associated with Cd and OP concentrations, but negatively associated with Ni concentration. The K concentration was negatively associated with Ba and Na concentrations. The Al concentration was positively associated with S, Fe, and Zn concentrations, but negatively associated with As and Pb concentrations. Chemical properties that were not associated with pH, EC, CEC, IP, K, and Al concentrations were BpH and Cr concentration.
Soil properties that contributed 32.5% of the total variation in PC1 at Froid were EC, CEC, Al, K, sand, silt, and clay concentrations, aggregate stability (AS), water-stable aggregation (WSA), wet aggregate stability index (WASI), average slate aggregate (ASA), bulk density (BD), macroporosity (MAP), total shrinkage (TS), volumetric water content at water saturation (VWCFS) and at 0.3, 33, and 1500 kPa, (VWC0.3, VWC33, and VWC1500, respectively) and intact core available water holding capacity (IAWHC) (Figure 2). Properties that contributed 18.5% of the total variation in PC2 were pH, Al, IP, sand and silt concentrations, AS, WSA, WASI, ASA, stone content (SC), mesoporosity (MEP), volumetric water content at field-moist condition (VWCFM) and at 10 kPa (VWC10), VWC1500, repacked core available water holding capacity (RAWHC), IAWHC, and soil hydraulic conductivity (SHC). The pH was positively associated with SC and MEP. The EC and CEC were positively associated with silt and clay concentrations, VWCFS, VWC0.3, MAP, and VWC33. The K concentration was positively associated with VWC33 and VWC0.3, but negatively associated with BD. The Al concentration was positively associated with IAWHC, WSA, WASI, ASA, and AS. The IP concentration was positively associated with VWCFM, but negatively associated with SC. Soil physical properties that were not associated with chemical properties were sand concentration, RAWHC, VWC10, VWC1500, and dry aggregate stability index (DASI).
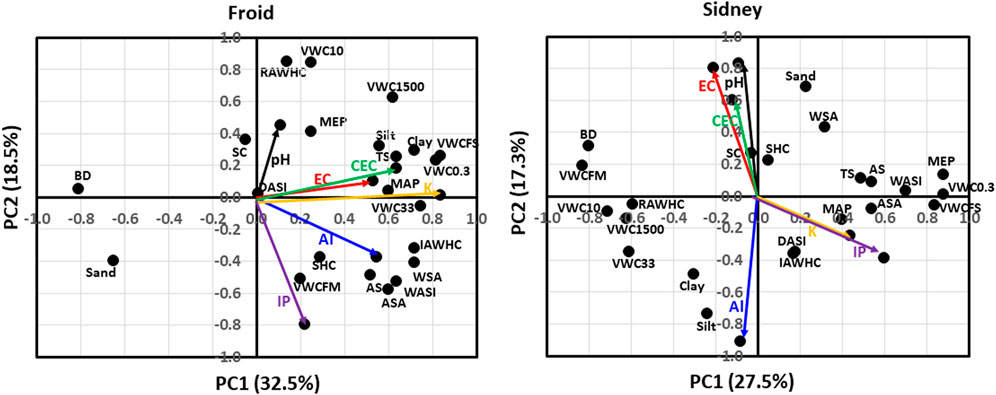
FIGURE 2. Principal component analysis for associations among soil pH, electrical conductivity (EC), cation exchange capacity (CEC), inorganic P (IP), K, and Al concentrations with soil physical properties at Froid and Sidney, Montana, United States. At Froid, soil properties explained 32.5% of the total variation in the first principal component (PC1) and 18.5% in the second principal component (PC2). At Sidney, soil properties explained 27.5% of total variation in PC1 and 17.3% of the total variability in PC2. AS denotes aggregate stability; ASA, average slake aggregate; BD, bulk density; DASI, dry aggregate stability index; IAWHC, intact core available water capacity; MAP, macro-porosity; MEP, meso-porosity; RAWHC, repacked core available water capacity; SC, stone content; SHC, saturated hydraulic conductivity; TS, total shrinkage; VWC0.3, volumetric water content at 0.3 kPa; VWC10, volumetric water content at 10 kPa; VWC33, volumetric water content at 33 kPa; VWC1500, volumetric water content at 1500 kPa; VWCFM, volumetric water content in the field-moist soil; VWCFS; volumetric water content at water saturation; WASI, wet aggregate stability index; and WSA, water-stable aggregation.
At Sidney, soil properties that contributed 27.5% of the total variation in PC1 were K and IP concentrations, AS, WSA, WASI, ASA, BD, TS, VWCFM, VWCFS, VWC0.3, VWC10, VWC33, VWC1500, and RAWHC (Figure 2). Soil properties that contributed 17.3% of the total variation in PC2 were pH, EC, CEC, Al, sand, silt, and clay concentrations, WSA, DASI, BD, VWC33, and IAWHC. The EC and CEC were negatively associated with DASI and IAWHC. The K and IP concentrations were positively associated with DASI, IAWHC, MAP, and ASA, but negatively associated with BD and VWCFM. The Al concentration was positively associated with silt concentration, but negatively associated with SHC and sand concentration. Physical properties that were not associated with chemical properties were sand and clay concentrations, WSA, TS, AS, WASI, MEP, VWC0.3, VWCFS, ASA, VWC33, VWC1500, RAWHC, VWCFM, and VWC10.
At Froid, soil properties that accounted for 50.8% of the total variation in PC1 were EC, CEC, Al, K, and IP concentrations, STC, SOM, water-extractable C (WEC), POXC, CO2 flush at 1 day incubation (CO2-1d), CO2 flush at 4 days incubation (CO2-4d), microbially active C (MAC), STN, water-extractable total N (WETN), water-extractable organic N (WEON), PNM, NH4-N, NO3-N, ACEP, β-glucosidase (BG), N-acetyle-β-glucosaminidase (NAG), and phosphomonoesterase (PME) (Figure 3). Soil properties that accounted for 16.4% of the total variation in PC2 were pH, EC, Al, STC, CO2-1d, MAC. STN, WETN, PNM, NH4-N, NO3-N, ACEP, NAG, and arylsulfatase (AST). The pH was positively associated with AST. The EC was positively associated with STN, PNM, CO2-1d, WETN, BG, and MAC. The K concentration was positively associated with WEC, CO2-4d, POXC, and SOM. The IP concentration was positively associated with PME and NAG. The CEC was positively associated with NH4-N. The STC, NO3-N, and ACEP did not associate with any other chemical properties.
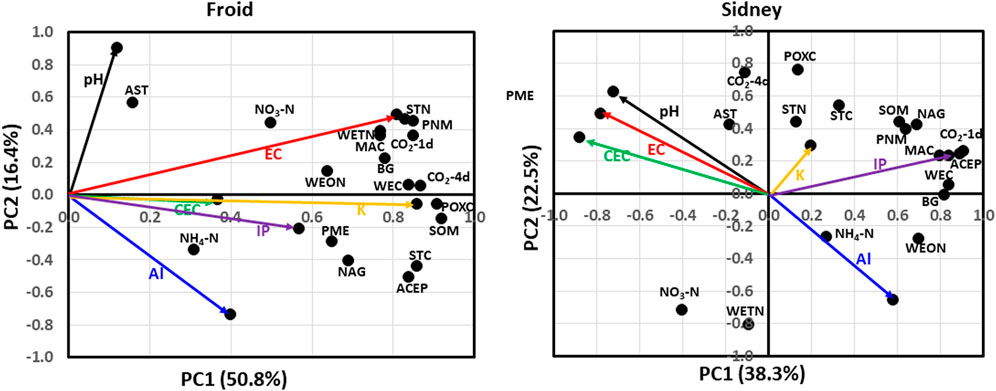
FIGURE 3. Principal component analysis for associations among soil pH, electrical conductivity (EC), cation exchange capacity (CEC), inorganic P (IP), K, and Al concentrations and soil biological and biochemical properties at Froid and Sidney, Montana, United States. At Froid, soil properties explained 50.8% of the total variation in the first principal component (PC1) and 16.4% in the second principal component (PC2). At Sidney, soil properties explained 38.3% of the total variation in PC1 and 22.5% in PC2. ACEP denotes autoclaved citrate-extractable protein; AST, arylsulfatase; BG, β-glucosidase; CO2-1d, CO2 flush at 1 d incubation; CO2-4d, CO2 flush at 4 d incubation; MAC, microbially active C; NAG, N-acetyl β-glucosaminidase; PLFA, phospholipid-derived fatty acid; PME, phosphomonoesterase; PNM, potentially N mineralization; POXC, KMnO4-extractable C; SOM, soil organic matter; STC, soil total C; STN, soil total N; WEC, water-extractable C; WEON, water-extractable organic N; and WETN, water-extractable total N.
At Sidney, soil properties that accounted for 38.3% of the total variation in PC1 were pH, EC, CEC, Al and IP concentrations, STC, SOM, WEC, CO2-1d, MAC, WEON, PNM, NO3, ACEP, BG, and NAG (Figure 3). Soil properties that accounted for 22.5% of the total variation in PC2 were pH, EC, CEC, Al concentration, STC, SOM, POXC, CO2-4d, STN, WETN, PNM, NO3-N, NAG, and AST. The pH, EC, and CEC were negatively associated with NH4-N and WEON. The K concentration was positively associated with STN and STC, but negatively associated with NO3-N. The IP concentration was positively associated with PNM, SOM, NAG, MAC, CO2-1d, ACEP, WEC, and BG. The Al concentration was negatively associated with AST. Soil biological and biochemical properties that did not associate with any chemical properties were CO2-4d, POXC, WEON, and WETN.
Soil pH did not relate to mean crop yield across years at Froid and Sidney sites. In contrast, pH was non-linearly related to yield from the combination of both sites, accounting for 14% of the total variation in yield (Figure 4) (p ≤ 0.06). The EC was non-linearly related to crop yield at Froid, accounting for 20% of the variation in yield. However, EC was not related to yield at Sidney and or yields from combination of both sites. The Al concentration was related to crop yield at Froid, accounting for 33% of the variation in crop yield, but was not related to yield at Sidney or yields from combination of both sites.
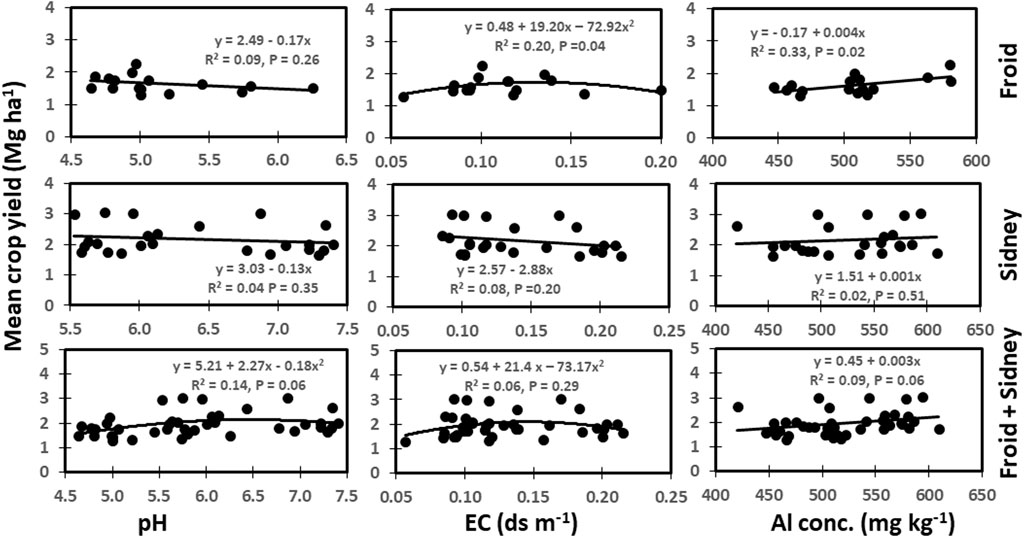
FIGURE 4. Relationships among soil pH, electrical conductivity (EC), Al concentration, and mean crop yield across years at Froid, Sidney, and the combined data from Froid and Sidney, Montana, United States.
The CEC was not related to crop yield at Froid and Sidney (Figure 5). However, CEC was strongly and non-linearly related to yield from a combination of both sites, accounting for 31% of the total variation in yield. The IP was non-linearly related to crop yield at Sidney (p = 0.08), accounting for 22% of the variation in yield. The IP was also linearly and negatively related to yield from the combination of both sites. The K concentration was linearly related to crop yield at Froid and from a combination of Froid and Sidney, accounting for 22–27% of the total variation in yield. An increase in K concentration by 1 mg K kg−1 increased yield by 0.003 Mg ha−1 at Froid and by 0.004 Mg ha−1 from the combination of Froid and Sidney.
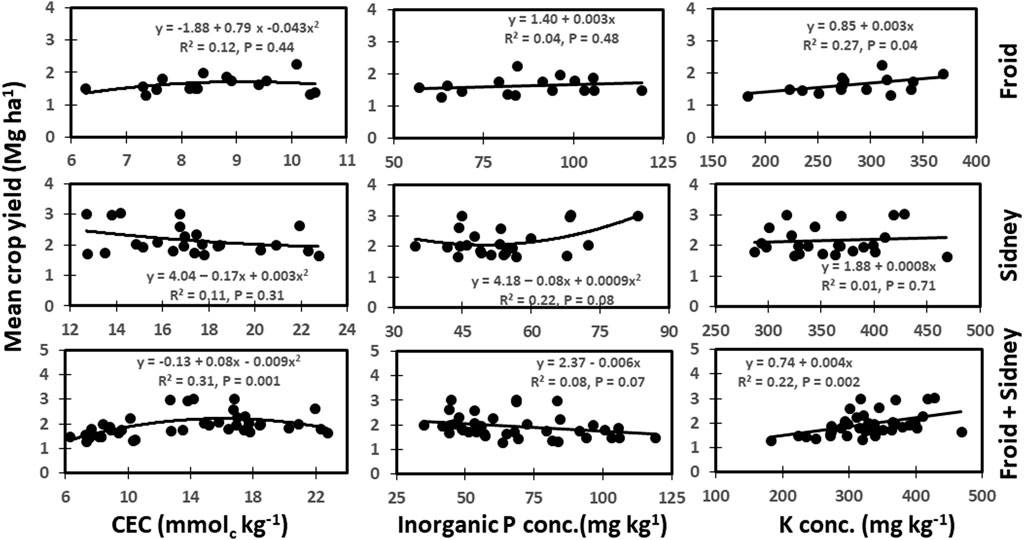
FIGURE 5. Relationships among cation exchange capacity (CEC), inorganic P (IP), and K concentration, and mean crop yield across years at Froid, Sidney, and the combined data from Froid and Sidney, Montana, United States.
The positive correlation between pH and EC at both Froid and Sidney (Table 2) suggests that pH increases as the concentration of soluble salts increases. Because soluble salts contain mostly basic cations, such as Ca, Mg, Na, and K, increased concentrations of these nutrients can increase pH (Manrique et al., 1991; Johnson et al., 2001). In contrast, the negative correlation between pH and Al concentration shows that pH decreases as Al concentration increases. At low pH, Al becomes more soluble that can be toxic to plants (Burleigh et al., 1999). The negative correlation between pH and IP at Sidney suggests that P can be unavailable to plants at low pH. However, the positive correlation between pH and CEC indicates that nutrient availability through cation exchange can be increased at high pH. The pH was found to be related to CEC (Manrique et al., 1991; Olorunfemi et al., 2016) and EC (Johnson et al., 2001).
The positive correlation between EC and K concentration at Froid suggests that soluble salts increase as the concentration of basic cation, such as K, is increased. However, the negative correlation between EC and Al and IP concentrations indicates that increased concentration of soluble salts can reduce the availability of Al and P. The strong correlation between EC and CEC at Sidney is an indication of dominance of basic cations, such as Ca, Mg, Na, and K, which increases EC, compared to acidic cations, such as Al and NH4, in CEC. Several researchers (Johnson et al., 2001; Jung et al., 2005) reported that EC was positively correlated to CEC. The positive correlation between K and IP concentrations at Sidney indicates that availability of K can also enhance the availability of P. However, the negative correlations of Al and IP concentrations with CEC shows that increased concentration of these nutrients can reduce CEC.
The stronger and greater correlations among soil chemical properties at Sidney than at Froid can be related to variations in soil texture, duration of the experiment, and the nature of treatments. It is possible that the medium-textured soil with the presence of N fertilization treatment produced more correlations among soil chemical properties at Sidney compared to coarse-textured soil with the absence of N fertilization treatment at Froid. Medium-textured soils have higher CEC than coarse-textured soils (Manrique et al., 1991; Olorufemi et al., 2016), and long-term N fertilization can reduce soil pH and availability of nutrients, such as P and K, compared to no N fertilization (Sainju and Alasinrin, 2020).
The positive associations among EC, CEC, and most nutrients at Froid and Sidney (Figure 1) suggest that increases in soluble salt concentrations and cation exchange can increase the availability of nutrients for plant uptake or losses due to leaching and surface runoff. Soil pH, Al and IP concentrations were more associated with nutrients at Sidney than at Froid, which also affect nutrient availability. In contrast, K concentration was more associated with nutrients at Froid than at Sidney. Increased stability due to longer duration of experiment likely resulted in greater associations of K with other nutrients at Froid than at Sidney. In contrast, presence of N fertilization treatment likely increased greater association of pH, Al, and IP concentrations with nutrients at Sidney. Our results of positive associations among pH and Ca and Mg concentrations at Froid are similar to those reported by several researchers (Mikhailova and Post, 2006; Sainju et al., 2020).
Greater stability of the experiment also likely resulted in positive associations among EC, CEC, silt and clay concentrations, VWCFS, VEW0.3, and VWC33 at Froid than at Sidney (Figure 2). Fine particles possess negative charges that can attract cations, enhancing EC and CEC, as both are dominated by the presence of basic cations. Presence of soil water facilitates chemical reactions, enhancing EC and CEC, as most nutrients need to be dissolved in water during the reaction. Fine particles also swell and shrink more than coarse particles during which cation exchange may have enhanced, resulting in positive associations among EC, CEC, TS and MAP. Some researchers (Johnson et al., 2001; Jung et al., 2005; Grigera et al., 2006) reported that EC was correlated to clay concentration. Similarly, others (Yerima et al., 1989; Manrique et al., 1991; Olorunfemi et al., 2016) observed good relationships between CEC and clay concentration. Gill and Reaves (1957) found that CEC was related to soil shrinkage. The positive associations among Al concentration and AS, ASA, WSA, and WASI at Froid indicate that increased Al concentration increased soil aggregate stability, probably by increasing chelation with SOM. Increased stability of experiment also likely resulted in more associations of chemical properties with physical properties at Froid than at Sidney.
Carbon serving as the source of energy and nutrients as substrate availability for microbes may have resulted in positive associations of EC, CEC, IP and K concentrations at Froid and of IP and K at Sidney with most biological and biochemical properties (Figure 3). On the other hand, microbes secrete enzymes that help to mineralize SOM into inorganic nutrients which become available for crop growth and production. The positive associations among EC, STN, PNM, and WETN at Froid suggest that N may play a significant role in maintaining the level of soluble salts. Similarly, the positive associations among K, IP, WEC, CO2-1day, POXC, SOM, MAC, and ACEP at Froid and Sidney suggest that K and IP are essential nutrients required by microbes for their enhanced activity which may increase C sequestration. Van Es and Karlen (2019) observed that soil P and K concentrations were positively correlated to potential C mineralization (PCM). Several researchers (Manrique et al., 1991; Olorunfemi et al., 2016) reported that CEC was positively related to SOM and STC. Xu et al. (2022) found that CEC was positively related to SOM, STN, and ACEP. The SOM acts as a negatively charge site which attracts cations, resulting in a strong correlation between CEC and SOM. Others (Grigera et al., 2006; Veum et al., 2021) showed that EC was also related to SOM. Soil pH and Al concentration, relating negatively to each other, had limited associations with soil biological and biochemical properties.
The non-significant relationship between soil pH and mean crop yield across years at Froid and Sidney (Figure 4) indicates that buffering capacity of soil resisted changes in pH, as our results (not shown) showed that long-term (14–36 years) management practices did not alter soil pH, but altered mean crop yields in dryland cropping systems. In contrast, the non-linear relationship between EC and crop yield at Froid indicates that yield was maximized at EC of 0.12 ds m−1. Presence of soluble salts above this EC value probably create toxicity to plants and reduce yield. Jung et al. (2005) reported that EC was correlated positively to corn and soybean yields during years with above-average precipitation, but correlated negatively during years with below-average precipitation, because growing-season precipitation affects crop yield more than nutrient availability in dryland cropping systems. The positive relationship between Al concentration and crop yield at Froid was a surprise, but it could be related to the presence of fallow treatment in the cropping sequence. Both Al concentration and crop yield were greater in the continuous cropping than crop-fallow. Absence of crop during the fallow period reduced annualized yield, although Al concentration was lower in the crop-fallow treatment. Burleigh et al. (1999) reported that high concentration of Al can result in plant toxicity and reduce crop yield.
Although CEC did not relate to mean crop yield at individual sites, CEC was very strongly related to yield when data from both sites were combined (Figure 5). High CEC favors nutrient exchange and availability, thereby enhancing crop yields. Jung et al. (2005) observed positive correlation between CEC and corn and soybean yields. Similarly, significant correlation between IP concentration and crop yield at Sidney and between K concentration and yield at Froid or a combination of Froid and Sidney sites suggest that both P and K are essential major nutrients that affect crop yield. Several researchers (Varvel et al., 1981; Anthony et al., 2012) found that IP was correlated to soybean and sugarbeet yields. Because of the significant relationships between soil properties and crop yields, performance of crop growth and yield along with soil properties can be used as important indicators of soil health (Maddonni et al., 1999). Because of the lack of crop yields during the fallow period in the crop-fallow treatments and also during the last year (2019) of the experiment, mean crop yields across years instead of yields from the latest year were used to related between soil chemical properties and crop yields.
As selection of soil chemical properties for soil health indicators depends on the relationship with other soil properties and crop yields (Maddonnni et al., 1999; Van Es and Karlen, 2019; Veum et al., 2021), we evaluated the relationships of pH, EC, CEC, and IP, K, and Al concentrations with soil physical, chemical, biological and biochemical properties and long-term crop yields at two dryland sites. Based on our results, we conclude that CEC, IP, and K concentrations can be regarded as potential chemical indicators of soil health because these parameters are related to most soil parameters and also to mean crop yield across years for individual or combined sites. Our results are similar to those reported by some researchers (Maddonni et al., 1999; Moebius-Clune, 2016; Veum et al., 2021). We also evaluated relationships among CEC, IP, and K concentrations and crop yields for the last two to 4 years, assuming that these soil parameters might provide better relationships with the latest crop yield data. These relationships also showed similar results. Absence of crop yield in the fallow treatment prevented us to determine the accurate relationship between soil parameters and 2019 yield data. While EC also related to most soil properties, it did not relate to crop yields. Soil pH was related to fewer soil properties, but not related to crop yield. Soil Al concentration also had fewer relationships with soil properties, although it was related to yield at Froid. Our results showed that availability of nutrients, such as P and K concentrations, and their retentions through improved CEC can influence soil health by affecting soil fertility and crop and yields.
Selected soil chemical properties (pH, EC, CEC, IP, K, and Al concentrations) related differently to other soil properties and long-term crop yields in dryland cropping systems of the northern Great Plains, United States. The EC, CEC, IP, and K concentrations were related to most soil physical, chemical, biological, and biochemical properties, but pH and Al concentration were related to limited soil properties. The CEC, IP, and K concentrations were also related mean crop yields across years at Froid, Sidney, and a combination of Froid and Sidney sites. The EC, however, did not relate to crop yield. Similarly, pH and Al concentration did not relate to crop yields. Lack of crop yields in the fallow treatments resulted in the use of mean crop yields across instead of present year’s yield to determine the relationship between soil properties and crop yields. Because of significant relationships with most soil properties and crop yields, CEC, IP, and K concentrations may be used as potential chemical indicators of soil health in dryland cropping systems in arid and semiarid regions. However, more research may be needed to evaluate these parameters as soil health indicators, as they always do not relate to crop yields because growing season precipitation is a major factor for dryland crop production.
The original contributions presented in the study are included in the article/Supplementary Material, further inquiries can be directed to the corresponding author.
US: Conceptualization, experiment setup, and management, data analysis, original paper writing, final manuscript revision. DL: Funding acquisition, methodology, data curation, final manuscript editing.
The authors declare this study received funding from the Foundation for Food and Agricultural Research (Grant no. 423926).
This is a collaborative study between USDA-ARS, Sidney, Montana, USA and Soil Health Institute. We sincerely thank Chloe Turner-Messervy and Rob Schlothauer for their help in collecting soil samples and data in the field and sample preparation for analysis and Rene France and Michael Johnson for farm operations and plot management.
The authors declare that the research was conducted in the absence of any commercial or financial relationships that could be construed as a potential conflict of interest.
All claims expressed in this article are solely those of the authors and do not necessarily represent those of their affiliated organizations, or those of the publisher, the editors and the reviewers. Any product that may be evaluated in this article, or claim that may be made by its manufacturer, is not guaranteed or endorsed by the publisher.
The content of this publication is solely the responsibility of the authors and does not necessarily represent the official views of the Foundation for Food and Agriculture Research. Mention of trade names or commercial products in this publication is solely for the purpose of providing specific information and does not imply recommendation or endorsement by USDA. The USDA is an equal opportunity employer.
The Supplementary material for this article can be found online at: https://www.frontiersin.org/articles/10.3389/fenvs.2022.1005114/full#supplementary-material
Aase, J. K., and Pikul, J. L. (1995). Crop and soil response to long-term tillage practices in the northern Great Plains. Agron. J. 87, 652–656. doi:10.2134/agronj1995.00021962008700040008x
Acosta-Martinez, V., and Tabatabai, M. A. (2011). “Phosphorus cycle enzymes,” in Methods of soil enzymology. Editor R. P. Dick (Madison, WI: Soil Science Society of America), 161–183.
Anthony, P., Malzer, G., Sparrow, S., and Zhang, M. (2012). Soybean yield and quality in relation to soil properties. Agron. J. 104, 1443–1458. doi:10.2134/agronj2012.0095
Blake, G. R., and Hartge, K. H. (1986). “Bulk density,” in Methods of soil analysis. Part. 1. Physical and mineralogical methods. Editor A. Klute. 2nd ed. (Madison, WI: American Society of Agronomy and Soil Science Society of America), 363–382.
Brejda, J. J., Karlen, D. L., Smith, I. L., and Allan, D. L. (2000). Identification of regional soil quality factors and indicators. II. Mississippi loess hills and Palouse prairies. Soil Sci. Soc. Am. J. 65, 1829–1837.
Burleigh, J. R., Yarmoah, C. F., Regas, J. L., and Eylands, V. J. (1999). Analysis of factors related to wheat yield on farm fields in the Buberuka Highlands of Rwanda. Agron. J. 83, 625–631. doi:10.2134/agronj1991.00021962008300030025x
Cassel, D. K., and Nielsen, D. R. (1986). “Field capacity and available water capacity,” in Methods of soil analysis. Part. 1. Physical and mineralogical methods. Editor A. Klute. 2nd ed. (Madison, WI: American Society of Agronomy and Soil Science Society of America), 901–926.
Culman, S., Mann, M., and Brown, S. (2019), Calculating cation exchange capacity, base saturation, and calcium saturation Bulletin ANR-81, Agriculture and natural resources. Ohio State University Extension, columbus ohio.
Deng, S., and Popova, I. (2011). “Carbohydrate hydrolases,” in Methods of soil enzymology. Editor R. P. Dick (Madison, WI: Soil Science Society of America), 185–209.
Dessureault-Rompre, J., Zebarth, B., Burton, D. L., Sharifi, M., Cooper, J., Grant, C. A., et al. (2010). Relationships among mineralizable soil nitrogen, soil properties, and climatic indices. Soil Sci. Soc. Am. J. 74, 1218–1227. doi:10.2136/sssaj2009.0213
Franzluebbers, A. J., Wright, S. F., and Studemann, J. A. (2000). Soil aggregation and glomalin under pastures in the southern Piedmont, USA. Soil Sci. Soc. Am. J. 64, 1018–1026. doi:10.2136/sssaj2000.6431018x
Fujardo, M., McBratney, A. B., Field, D. J., and Minasty, B. (2016). Soil slaking assessment using image recognition. Soil Tillage Res. 163, 119–129. doi:10.1016/j.still.2016.05.018
Gee, G. W., and Bauder, J. W. (1986). “Particle-size analysis,” in Methods of soil analysis. Part. 1. Physical and mineralogical methods. Editor A. Klute. 2nd ed. (Madison, WI: American Society of Agronomy and Soil Science Society of America), 383–411.
Gill, W. R., and Reaves, C. A. (1957). Relationships of atterberg limits and cation-exchange capacity to some physical properties of soil. Soil Sci. Soc. Am. J. 21, 491–494. doi:10.2136/sssaj1957.03615995002100050008x
Grigera, M. S., Dribjer, R. A., Eskridge, K. M., and Weinhold, B. J. (2006). Soil microbial biomass relationships with organic matter fractions in a Nebraska corn field mapped using apparent electrical conductivity. Soil Sci. Soc. Am. J. 70, 1480–1488. doi:10.2136/sssaj2005.0331
Haney, R. L., Brinton, W. F., and Evans, E. (2008). Soil CO2 respiration: Comparison of chemical titration, CO2 IRGA analysis, and Solvitta gel system. Renew. Agric. Food Syst. 23, 171–176. doi:10.1017/s174217050800224x
Haney, R. L., Franzluebbers, A. J., Jin, V. L., Johnson, M. V., Haney, E. B., White, M. J., et al. (2012). Soil organic C:N vs. Water-extractable organic C:N. Open J. Soil Sci. 2, 269–274. doi:10.4236/ojss.2012.23032
Haney, R. L., Haney, E., Hossner, L., and Arnold, J. (2010). Modifications to the new soil extractant H3A-1: A multinutrient extractant. Commun. Soil Sci. Plant Anal. 4, 1513–1523. doi:10.1080/00103624.2010.482173
Hao, X., Ball, B. C., Culley, J. L. B., Carter, M. R., and Parkin, G. W. (2008). “Soil density and porosity,” in Soil sampling and methods of analysis. Editors M. R. Carter, and E. G. Gregorich. 2nd ed. (Boca Raton, FL: Canadian Society of Soil Science. Taylor and Francis), 743–759.
Herrero, M., Thorton, P. K., Notenbaert, A. M., Wood, S., Msangi, S., Freeman, H. A., et al. (2010). Smart investments in sustainable food production: Revisiting mixed crop-livestock systems. Science 327, 822–825. doi:10.1126/science.1183725
Johnson, C. K., Doran, J. W., Duke, H. R., Wienhold, B. J., Eskridge, K. M., and Shanahan, J. F. (2001). Field-scale electrical conductivity mapping for delineating soil condition. Soil Sci. Soc. Am. J. 65, 1829–1837. doi:10.2136/sssaj2001.1829
Jung, W. K., Kitchen, N. R., Sudidth, K. A., Krewer, R. J., and Motavalli, P. P. (2005). Relationship of apparent soil electrical conductivity to claypan soil properties. Soil Sci. Soc. Am. J. 69, 883–892. doi:10.2136/sssaj2004.0202
Karlen, D. L., Mausbach, M. J., Doran, J. W., Cline, R. G., Harris, R. F., and Schuman, G. E. (1997). Soil quality: A concept, definition, and framework for evaluation (A guest editorial). Soil Sci. Soc. Am. J. 61, 4–10. doi:10.2136/sssaj1997.03615995006100010001x
Kemper, W. D., and Rosenau, R. C. (1986). “Aggregate stability and size distribution,” in Methods of soil analysis. Part. 1. Physical and mineralogical methods. Editor A. Klute. 2nd ed. (Madison, WI: American Society of Agronomy and Soil Science Society of America), 425–442.
Klose, S., Bilen, S., Tabatabai, M. A., and Dick, W. A. (2011). “Sulfur cycle enzymes,” in Methods of soil enzymology. Editor R. P. Dick (Madison, WI): Soil Science Society of America), 125–151.
Li, Y., Zhou, L., Cui, S., Jagadamma, S., and Zhang, Q. (2019). Residue retention and minimum tillage improve physical environment of the soil in croplands. A global meta-analysis. Soil Tillage Res. 194, 104292. doi:10.1016/j.still.2019.06.009
Liang, G., Wu, X., Cai, A., Dai, H., Zhou, L., Cai, D., et al. (2021). Correlations among soil biochemical parameters, crop yield, and soil respiration vary with growth stage and soil depth under fertilization. Agron. J. 113, 2450–2462. doi:10.1002/agj2.20699
Liebig, M. A., Varvel, G. E., Doran, J. W., and Wienhold, B. J. (2002). Crop sequence and nitrogen fertilization effects on soil properties in the Western Corn Belt. Soil Sci. Soc. Am. J. 66, 596–601. doi:10.2136/sssaj2002.0596
Maddonni, G. A., Urricariet, S., Ghersa, C. M., and Lavado, R. S. (1999). Assessing soil quality in the Rolling Pampa using soil properties and maize characteristics. Agron. J. 91, 280–287. doi:10.2134/agronj1999.00021962009100020017x
Manrique, L. A., Jones, C. A., and Dyke, P. T. (1991). Predicting cation exchange capacity from soil physical and chemical properties. Soil Sci. Soc. Am. J. 55, 787–794. doi:10.2136/sssaj1991.03615995005500030026x
Mikhailova, E. A., and Post, J. C. (2006). Effects of land use on soil inorganic carbon stocks in the Russian Chernozem. J. Environ. Qual. 35, 1384–1388. doi:10.2134/jeq2005.0151
Miller, R. O., Gavlak, R., and Horneck, D. (2013). “Saturated paste extract for calcium, magnesium, sodium, and SAR Soil, plant, and water methods for the Western region,” in Western coordinating committee on nutrient management. Ft. 4th ed. (Collins, CO: Colorado State University), 21–22.
Moebius-Clune, B. N. (2016). Comprehensive assessment of soil health. Ithaca, NY: The Cornell University framework. Cornell University.
Nelson, D. W., and Sommers, L. E. (1996). “Total carbon, organic carbon, and organic matter,” in Methods of soil analysis. Part 3. Chemical methods. Editor D. L. Sparks. 2nd ed. (Madison WI: American Society of Agronomy and Soil Science Society of America), 961–1010.
Ohno, T., and Hettiarachchi, G. (2018). Soil chemistry and the one health initiative: Introduction to the special section. J. Environ. Qual. 47, 1305–1309. doi:10.2134/jeq2018.08.0290
Olorunfemi, I., Fasinmirin, J., and Ojo, A. (2016). Modeling cation exchange capacity and soil water holding capacity from basic soil properties. J. Soil Sci. 5, 266–274. doi:10.18393/ejss.2016.4.266-274
Quideau, S. A., McIntosh, A. C., Norris, C. E., Lloret, E., Swallow, M., and Hannam, K. (2016). Extraction and analysis of microbial phospholipid fatty acids in soils. J. Vis. Exp. 114, e54360. doi:10.3791/54360
Reardon, C. L., Wuest, S. B., Melle, C. J., Klein, A. M., Williams, J. D., Barrodo, J., et al. (2019). Soil microbial and chemical properties of a minimum and conventionally-tilled wheat-fallow system. Soil Sci. Soc. Am. J. 83, 1100–1110. doi:10.2136/sssaj2018.09.0344
Reynolds, W. D., and Elrick, D. E. (1990). Ponded infiltration from a single ring: I. Analysis of steady flow. Soil Sci. Soc. Am. J. 54, 1233–1241. doi:10.2136/sssaj1990.03615995005400050006x
Reynolds, W. D., and Topp, G. C. (2008). “Soil water desorption and imbibition: Tension and pressure techniques,” in Soil sampling and methods of analysis. Editors M. R. Carter, and E. G. 2nd Gregorich (Boca Raton, FL: Canadian Society of Soil Science. Taylorand Francis), 981–987.
Sainju, U. M., and Alasinrin, S. Y. (2020). Changes in soil chemical properties and crop yields with long-term cropping system and nitrogen fertilization. Agrosyst. Geosci. Environ. 3. doi:10.1002/agg2.20019
Sainju, U. M., Allen, B. L., Jabro, J. D., and Stevens, W. B. (2020). Soil inorganic carbon under no-till dryland crop rotations. Agrosyst. Geosci. Environ. 3, e20073. doi:10.1002/agg2.20073
Sainju, U. M., Lenssen, A. W., Allen, W. L., Stevens, W. B., and Jabro, J. D. (2016). Soil residual nitrogen under various crop rotations and cultural practices. J. Plant Nutr. Soil Sci. 180, 187–198. doi:10.1002/jpln.201600496
Sainju, U. M., Liptzin, D., and Dangi, S. (2021). Carbon dioxide flush as a soil health indicator related to soil properties and crop yields. Soil Sci. Soc. Am. J. 85, 1679–1697. doi:10.1002/saj2.20288
Schindelbeck, R. R., Moebius-Clune, B. N., Moebius-Clune, D. J., Kuntz, K. S., and van Es, H. M. (2016). Cornell University comprehensive soil health laboratory standard operating procedure. Ithaca, NY): Cornell University.
Sikora, F. S., and Moore, K. (2014). Soil test methods from the southeastern United States southern cooperative series, 419. Clemson, SC): Clemson University.Bulletin
Statistical Analytical System (SAS) (2020). SAS/SHARE 9.4. User’s guide. 2nd edition. Cary, NC: SAS.
Tabatabai, M. A. (1994). “Soil enzymes,” in Methods of soil analysis. Part 2. Microbiological and biochemical properties. Editors R. W. Weaver, S. Angle, P. Bottomley, D. Bezdicek, D. Smith, A. Tabatabaiet al. (Madison WI): Soil Science Society of America), 775–833.
Thomas, G. W. (1996). “Soil pH and soil acidity,” in Methods of soil analysis. Part 3. Chemical methods. Editor D. L. Sparks. 2nd ed. (Madison WI: American Society of Agronomy and Soil Science Society of America), 474–490.
Topp, G. C., Galganev, Y. T., Ball, B. C., and Carter, M. R. (1993). “Soil water desorption curves,” in Soil sampling and methods of analysis. Editor M. E. Carter (Boca Raton, FL: Lewis Publishers), 1–46.
van Es, H. M., and Karlen, D. L. (2019). Reanalysis validates soil health indicator sensitivity and correlation with long-term crop yields. Soil Sci. Soc. Am. J. 83, 721–732. doi:10.2136/sssaj2018.09.0338
Varvel, G. E., Anderson, F. N., and Peterson, G. A. (1981). Soil test correlation problems with two phosphorus methods on similar soils. Agron. J. 73, 516–520. doi:10.2134/agronj1981.00021962007300030027x
Veum, K. S., Nunes, M. R., and Sudduth, K. A. (2021). “The future of soil health assessments: Tools and strategies,” in Soil health series, Vol 1. Approaches to soil health analysis. Editors D. L. Karlen, D. E. Stott, and M. Mikha (United States: John Wiley & Sons), 169–198.
Weil, R., Islam, K. R., Stine, M. A., Gruver, J. V., and andSamson-Liebig, S. E. (2003). Estimating active carbon for soil quality assessment: A simplified method for laboratory and field use. Am. J. Altern. Agric. 18, 3–17. doi:10.1079/ajaa2003003
Xu, N., Amgain, N. R., Rubbany, A., Capasso, J., Korus, K., Swanson, S., et al. (2022). Interpretation of soil health indicators to different regenerative farming practices on mineral soils. Agrosyst. Geosci. Environ. 5, e20243. doi:10.1002/agg2.20243
Keywords: chemical chracteristics, soil health, soil characteristics, crop yield, dryland cropping system
Citation: Sainju UM and Liptzin D (2022) Relating soil chemical properties to other soil properties and dryland crop production. Front. Environ. Sci. 10:1005114. doi: 10.3389/fenvs.2022.1005114
Received: 27 July 2022; Accepted: 28 November 2022;
Published: 07 December 2022.
Edited by:
Reza Mohammadi, Agricultural Research, Education and Extension Organization, IranReviewed by:
Nirmalendu Basak, Central Soil Salinity Research Institute (ICAR), IndiaCopyright © 2022 Sainju and Liptzin. This is an open-access article distributed under the terms of the Creative Commons Attribution License (CC BY). The use, distribution or reproduction in other forums is permitted, provided the original author(s) and the copyright owner(s) are credited and that the original publication in this journal is cited, in accordance with accepted academic practice. No use, distribution or reproduction is permitted which does not comply with these terms.
*Correspondence: Upendra M. Sainju, dXBlbmRyYS5zYWluanVAdXNkYS5nb3Y=
Disclaimer: All claims expressed in this article are solely those of the authors and do not necessarily represent those of their affiliated organizations, or those of the publisher, the editors and the reviewers. Any product that may be evaluated in this article or claim that may be made by its manufacturer is not guaranteed or endorsed by the publisher.
Research integrity at Frontiers
Learn more about the work of our research integrity team to safeguard the quality of each article we publish.