 Xiaojing Liu
 Yan Pan1
- 1School of Economics and Management, Fuzhou University, Fuzhou, Fujian, China
- 2School of Business, Shaoxing University, Shaoxing, China
- 3School of Management, Wenzhou Business College, Wenzhou, China
Advanced geographic technologies provide an opportunity to understand the urban forest landscape and guide the governance of the urban ecosystem. However, only few studies stressed the importance of data techniques in understanding urban sustainability, especially urban forest landscape. Therefore, this study makes an analysis of urban forest resources in a city of Yangtze River Delta with the help of multi-source data techniques and further data analysis of different forest landscape pattern indices in the study area with the help of SPSS (Statistical Product and Service Solutions). The following conclusions are drawn: 1) According to the visual analysis, the spatial distribution of forest patches in the study area has a great difference. 2) All the seven landscape pattern indices are positively correlated with the distribution density of POI (Point of Interest), which represents the urban economic vitality. The correlation coefficients are NP (R2 = 0.3063), PD (R2 = 0.0079), ED (R2 = 0.3955), AREA (R2 = 0.5408), CONTIG (R2 = 0.0323), PAFRAC (R2 = 0.3662) and AI (R2 = 0.2014), respectively. This indicates that the higher the economic vitality is, the more fragmented and complex the urban forest patches are. 3) According to the geographically weighted regression model, the goodness of fit between the spatial distribution density of POI and NP, PD, ED, and AI reaches 0.804, 0.771, 0.634, and 0.619, respectively, and the explanatory power of the model is more than twice that of the corresponding linear regression model. The data illustrates that the correlation between economic vitality and urban forest landscape pattern indices has significant spatial heterogeneity.
Introduction
Urbanization promotes the development of regional economy, and the improvement of regional economic level promotes the development of cities, as well as promotes changes of production mode, settlement form, lifestyle, values, etc (Bertinelli & Black, 2004; Berry, 2008; Gao et al., 2021). With the continuous improvement of urban residents’ material conditions, the public’s requirements for life quality are constantly enhanced, and the requirements for the surrounding ecological environment will also be boosted (Seto et al., 2010; Dodman, 2016; Chou et al., 2020; Zhang et al., 2022). The urban forest, as an important part of the urban ecological system, has an irreplaceable role in maintaining the balance of the urban ecosystem, improving the urban environment, and maintaining ecological security (Endreny, 2018; Song et al., 2018). Compared with the urban land like buildings and roads, the urban forest has higher surface albedo, absorbs less solar radiation, and can significantly increase urban surface latent heat flux and enhance atmospheric convective intensity near the urban surface through evapotranspiration (Gunawardena et al., 2017; Manoli et al., 2019), which may lead to the phenomenon called cold island effect: low temperature is formed around the distribution area and its vicinity (Weng & Lu, 2008). However, with the continuous development of urbanization, land transformation outside the city is accelerated, and satellite towns with short urbanization processes are formed around the city center (Merrilees et al., 2013). Therefore, with the advancement of urbanization, the distribution of urban infrastructure design gets more complex, and the study of urban forest landscape patterns and their influencing factors will help to optimize the design of urban green infrastructure (Guan et al., 2018; Sorensen, 2018).
In recent years, many studies on urbanization and urban forest generally showed that the urbanization process would lead to the fragmentation of urban forests. For example, Magura et al. (2010) and Gong et al. (2011) found that with the increase of urbanization intensity, the patch area of urban forest decreased, and the patch density in the city center decreased significantly over time. The patch density in the suburban area showed a similar trend but at a relatively small rate. However, the patch area in the outer suburb changed slowly, which showed that the urban forest was separated and scattered from the suburbs to the city center. By analyzing the relationship between urban expansion intensity and urban landscape pattern in Yang et al. (2019) found that urbanization changes agricultural land and forest land into construction land, resulting in a prominent and fragmented landscape in these areas. Lv et al. (2019) studied the relationship between ISA (Impervious Surface Area) and urban forest landscape pattern and structural classification attributes through the influence of urbanization intensity (low, medium, and severe urbanization) in Harbin city. It stated that ISA significantly affected the relationship between the structural characteristics of urban forest and forest landscape pattern, resulting in smaller and even separated patches of the urban forest. Through comparative analysis of forest changes in six metropolitan areas in China (Zhou et al., 2017), found that urban expansion was the main cause of forest reduction and fragmentation, especially in Changsha-Zhuzhou-Xiangtan, Pearl River Delta, and Chengdu-Chongqing metropolitan areas. The fragmentation of urban forests would affect the aesthetics of urban landscape and forest ecosystem services, such as leisure services, biodiversity conservation, and carbon sequestration (Liu et al., 2022). Therefore, studying the spatial distribution pattern of urban forests under the background of urbanization had a guiding role in improving the ecological benefits of urban forests. However, due to the problem of remote sensing image resolution and the limitation of urban forest scale, most studies only analyzed the large forest patches in the city but denied the role of small patches in the urban forest ecosystem. Urban forests are highly fragmented, more than 60% of green patches are less than 0.1 hm2. Therefore, it is urgent to use fine-scale urban forest patches for a more accurate analysis of urban forest landscape patterns.
POI (points of interest) refers to specific points that people are interested in or consider useful. POI, belonging to the category of geographic information system, refers to the geographical objects that can be abstracted as points, especially some geographical entities closely related to people’s lives, such as schools, banks, restaurants, hospitals, supermarkets, and bus stations, etc. (Mummidi & Krumm, 2008; Ye et al., 2011). With the advent of big data, multi-source data techniques have been widely used in land use classification, population density analysis, tourism, and bike-sharing research, which is highly correlated with urban land use attributes, population mobility, and economic activities of urban residents (Gao, Janowicz & Couclelis 2017; Bai et al., 2021). However, in sustainability studies, multi-source data techniques are lacking. There are few studies regarding the relationship between POI density and urban forest landscape patterns currently (Wang et al., 2021; Yang et al., 2021). Most of the areas for urban residents’ daily activities are concentrated in the vicinity of the POI, where forest ecological services such as dust capture, landscaping, and health care are most relevant to the population in these regions. The study on the relationship between POI density and urban forest landscape patterns can provide a new perspective for the maximization benefit of the urban forest. The present study therefore takes Lianyungang City as the research area to conduct a pilot study. With the support of the ArcGIS geographic information technology platform, the POI data of Lianyungang City are visualized to establish a kilometer grid, as well as analyze the relationship between landscape pater index (the number of patches, the average patch area, shape index, aggregation index) and urbanization intensity in kilometer grid. This study also establishes the stepwise regression model and geographically weighted regression model to quantitatively analyze the impact of urbanization intensity on urban forest landscape pattern and spatial heterogeneity.
Methods
Data description
In this paper, the POI data of the study area on 30 September 2021 is downloaded from AMAP using API (Application Programming Interface), and a total of 13,284 POI points of the 117 categories are obtained. Then, the kernel density analysis method in ArcGIS software is used to calculate the spatial distribution density maps of all POI points, and the km grid of the study area is established. Finally, the POI point density of each grid is calculated. The spatial relationship between the landscape pattern index of fine urban forest patches and the spatial density of POI is statistically analyzed. The implementation steps include extraction of fine urban forest patches, calculation of landscape pattern index in kilometer grid cells, calculation of POI spatial distribution density and spatial correlation analysis, etc.
Extraction of urban forest patches
The 1 m resolution remote sensing image of the study area is downloaded from Google Earth. The images are taken from May to October 2017 and from May to October 2021. Urban forest patches are classified and extracted by object-oriented and artificial visual interpretation. To study the elaborate features of urban forest patches, the minimum area of patches extracted is set as 0.001 hm2.
Calculation of landscape pattern index
Fragstats software is used to calculate the forest patch landscape pattern index of each grid. According to the results of previous studies, seven commonly used indexes are screened, namely, the Number of Patches, Patch Density, Edge Density, Mean Patch Area, Mean Contiguity Index, Perimeter Area Fractal Dimension, and Aggregate (see Table 1).
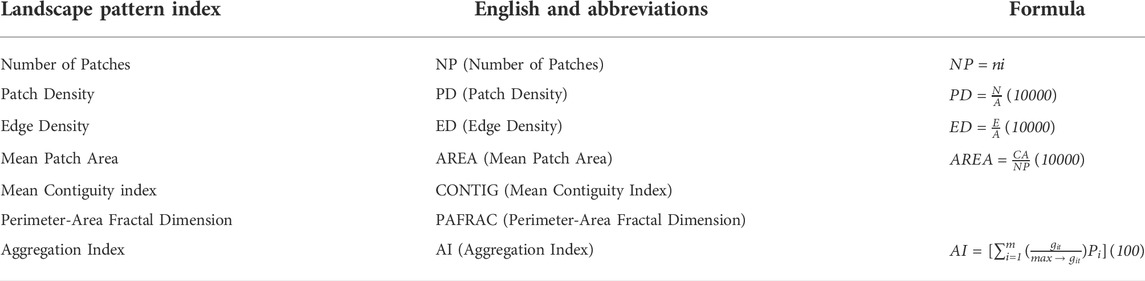
TABLE 1. Selected calculation formulas of landscape pattern indices.
Statistical analysis
Taking the kilometer grid as the basic unit, Pearson correlation analysis and single variable stepwise regression analysis are conducted on the POI density and urban forest landscape pattern index with the use of SPSS (Yang et al., 2021). The relationship between POI spatial density and urban forest landscape spatial configuration is studied.
Geographically weighted regression (GWR)
To analyze the spatial heterogeneity of the relationship between the POI space density and the urban forest landscape pattern, POI density and the landscape pattern index is established based on the ArcGIS geographically weighted regression model. Based on linear regression analysis, spatial data analysis is added to the geographically weighted regression model (Wang et al., 2021). This model is used to study the heterogeneity of spatial relationships, and the mathematical model is:
Where, yi is the dependent variable of point i; εi is residual; k is the total sample size; i is the sample point count; xik is the value of the kth independent variable at the point i; (ui,vi) is the spatial coordinate of the ith sample point; ak (ui,vi) is the value of the continuous function ak (ui,vi) at i. Due to random samplings and different spaces in different geographical and natural environments, the observed data has certain errors. Geographically weighted regression is used to reduce the influence of the original analysis model on spatial nonstationarity. It can easily process data and make a global quantification of spatial nonstationarity of data analyzed by the geographic information system.
Results
Spatial distribution of urban forests in Lianyungang City
Urban forests in the study area have obvious characteristics of aggregation distribution, for example, the area of forest patches in the central Haizhou District is larger, and the forest patches in other districts of the city are more fragmented (Figure 1A). The forest patches in Lianyungang city are mainly distributed from east to west along the Lianyungang Expressway, including Liandao Scenic area, Yuntaishan National Forest Park, Huaguoshan Scenic area, and Taohujian Scenic area. The number of forest patches greater than 0.001 hm2 is 41,922, with a total area of 1,195.73 hm2 (taking up 24.05% of the research area), among which, 16,385 patches are greater than 0.1 hm2 (taking up 0.66% of the total number of patches), with a total area of 162.95 hm2 (taking up 4.82% of the total patch area).
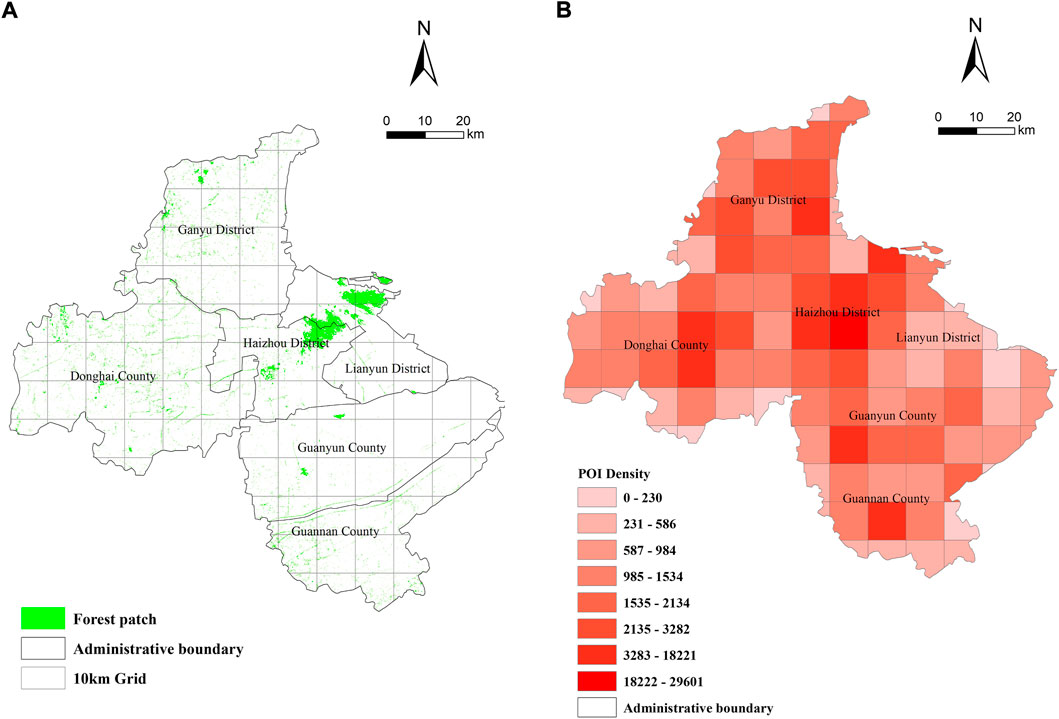
FIGURE 1. Spatial distribution of urban forests and POI. (A) Urban Forests, (B) POI.
POI spatial distribution density
The regional differences of POI spatial distribution density are small, and the overall distribution is relatively average. Within the total area, the density of middle regions is relatively larger, with the maximum density reaching 18,222 points/km2, and the western and eastern regions are of low density (Figure 1B).
Correlation between POI density and urban forest landscape pattern index
Among the seven landscape pattern indexes, the statistical results show that all the seven landscape pattern indexes are positively correlated with POI distribution density. The correlation between mean patch area (AREA) and POI density is the most significant (0.5408). The correlation between patch density (PD) and POI density is 0.0079. In addition, except for mean contiguity index (CONTIG) and aggregation index (AI), the other three landscape indices (NP: number of patches, ED: edge density, and PAFRAC: perimeter-area fractal dimension) show a significant positive correlation with POI distribution density, with correlation coefficients of 0.3063, 0.3955 and 0.3662, respectively (Figure 2).
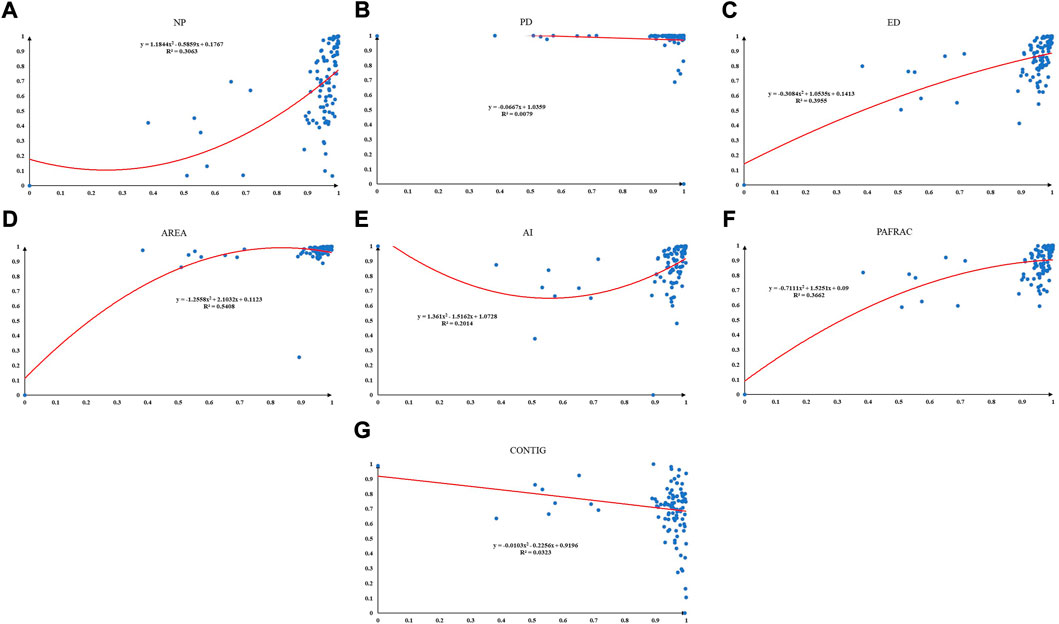
FIGURE 2. (A-G) Correlation coefficients.
Functional relationship between POI density and urban forest landscape pattern index
In the stepwise regression analysis of POI distribution density and urban forest landscape pattern index, proximity index (CONTIG) and patch density (PD) are excluded. POI distribution density has an overall strong ability to explain landscape pattern index (the value of adjusted R2 is small), especially for the number of urban forest patches, mean patch area, edge density, and perimeter integral dimension ratio (all greater than 0.2), and the explanatory ability of other landscape pattern indexes is in the range of 0.1–0.2. According to the established linear model, the number of patches, mean patch area, edge density, and perimeter integral dimension ratio increases by 0.1016, 0.221, 0.141, and 0.132 respectively when POI increases by one point per square kilometer, but the forest patch density (PD), mean contiguity index (CONTIG) and aggregation index (AI) remain unchanged basically.
Spatial heterogeneity of the relationship between POI density and urban forest landscape pattern
The goodness of fit (adjusted R2) of the GWR regression model between POI distribution density and urban forest landscape pattern index is higher. The goodness of fit between the POI spatial distribution density and the number of the patch (NP) of forests, patch density (PD), edge density (ED), and aggregation index (AI) is 0.804, 0.771, 0.634, and 0.619, respectively. Meanwhile, the explanatory power of the model is more than two times that of the corresponding linear regression model. The results of the GWR regression model coefficient spatial distribution analysis (Figure 3) show that the correlation between POI spatial distribution density and urban forest landscape pattern index has significant spatial heterogeneity.
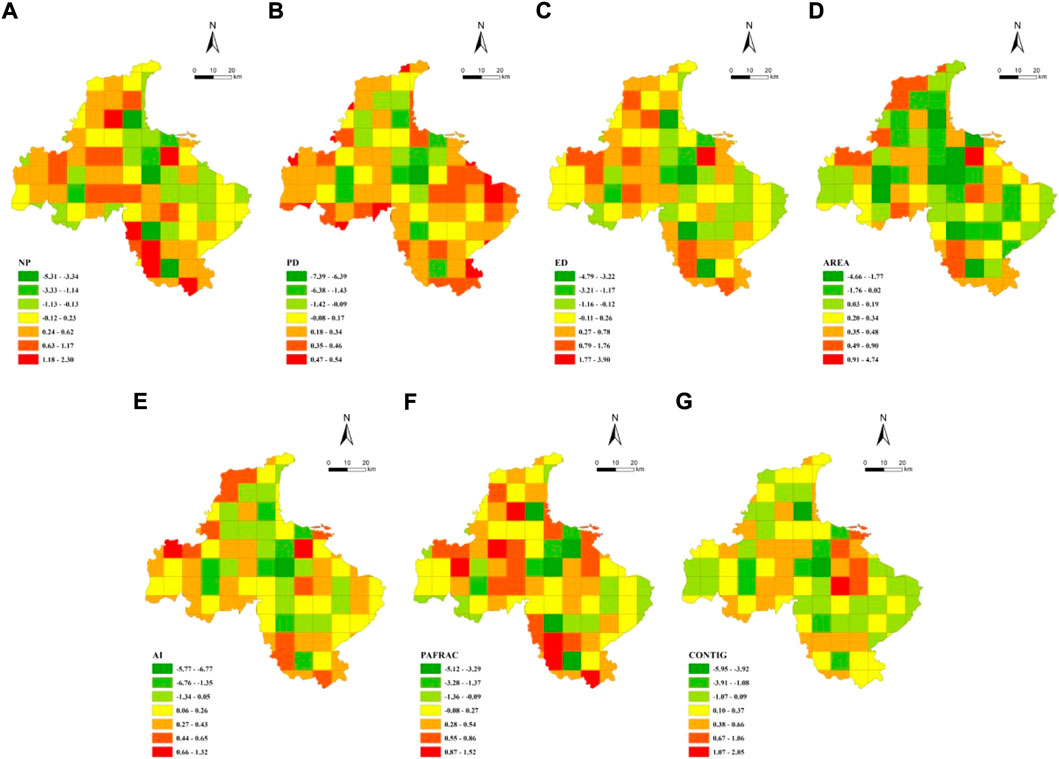
FIGURE 3. (A-G) Spatial distribution of POI density and GWR model coefficient of urban forest landscape pattern index.
Conclusion
In this study, visual analysis of urban forest patches is carried out with the help of the ArcGIS geographic information technology platform and further data analysis of different forest landscape pattern indices in the study area is carried out with the help of SPSS. The results show that:
1) The number of forest patches greater than 0.001 hm2 in the research area is 41,922, and the total area is 1,195.73hm2. Among them, the number of forest patches greater than 0.1 hm2 is 16,385, and the total area is 162.95 hm2. From the perspective of spatial distribution, forest patches in Lianyungang city are mainly distributed in the Haizhou area from east to west along the Lianyungang Expressway, while the patches in other areas are relatively scattered.
2) All the seven landscape pattern indices are positively correlated with the distribution density of POI. The correlation coefficients are NP (R2 = 0.3063), PD (R2 = 0.0079), ED (R2 = 0.3955), AREA (R2 = 0.5408), CONTIG (R2 = 0.0323), PAFRAC (R2 = 0.3662) and AI (R2 = 0.2014), respectively. This shows that the more POI is, the more fragmented and complex the urban forest patches are.
3) According to the geographically weighted regression model, the goodness of fit between the spatial distribution density of POI and NP, PD, ED, and AI reaches 0.804, 0.771, 0.634, and 0.619, respectively, and the explanatory power of the model is more than two times that of the corresponding linear regression model. This indicates that the correlation between POI spatial distribution density and urban forest landscape pattern index has significant spatial heterogeneity.
In summary, the results of the analysis indicate that the urbanization development process in the current study area has a great influence on the size of urban forest patches and the landscape pattern of the urban forests. Under the effect of the interference of human activities, more and more urban construction land has been used, and the forest patches have been gradually divided and seriously fragmented. The coherence and area patches of urban forests are insufficient, which will affect the effective development of ecological benefits of urban forests, bring great challenges to the urban ecological environment and species diversity, and significantly affect the coordinated development level of urban ecological construction and economy.
On account of the differentiation of forest ecosystem services and their value, the following countermeasures should be adopted in the management of forest ecosystem in Lianyungang City to improve the supply level of forest ecosystem services:
(1) Strengthen monitoring of changes in forest ecosystem structure and function. The level of forest ecosystem service supply and the ecosystem service value should be monitored as the core content of forest detection, and as a key basis for forest ecosystem management. Meanwhile, a forest ecosystem monitoring and evaluation system with pioneering demonstration significance should be formed as soon as possible to provide an effective supporting platform and demonstration system for the green development of the coastal economic belt.
(2) The forest ecosystem in Lianyungang city shows structural and functional differentiation, along with forest degradation and forest expansion. High-quality forests mainly distributed in the Liandao Scenic Spot, the Yuntaishan National Forest Park, the Huaguoshan Scenic Spot, the Taohuajian Scenic Spot, etc, are faced with greater pressure of forest tourism, while other low-quality forests are scattered throughout the city. In the follow-up management, differentiated management strategies should be formulated for the level of forest ecosystem service supply and forest quality, priority should be given to the protection of high-quality forest ecosystems, continuous improvement of sensitive forest ecosystems, and systematic conservation plans should be formed.
(3) Optimize forest landscape pattern. To solve the problem of forest landscape fragmentation in Lianyungang city, it is necessary to combine needs like biodiversity protection, thermal environment improvement, water and soil erosion control, recreation, etc, based on respecting the law of urban development. Then, combining key ecological construction projects like ring road forest belt, green wedge, wetland ecological restoration, and the green-way, it is important to take city development targets and land use planning schemes into overall consideration, as well as adjust and optimize the forest layout structure of Lianyungang city from multiple scales to construct a forest ecological network structure with coordinated structure and function, which will help meet the needs of biodiversity conservation, heat island effect, air pollution prevention and control, and recreation system construction.
(4) Utilize the regional advantage of Lianyungang. Lianyungang is a port city, therefore, it is more appropriate to implement multi-objective operations and comprehensively improve the level of ecological service supply. On the premise of maintaining the dominant function of the forest, it is necessary to develop the under-forest economy and promote the economic development vitality of the port city through improving the forest structure and increasing the forest management model. The spatial distribution and composing characters of the ecosystem is the integration of forest, sea, and city, which strengthens the research on the interaction between forest and marine ecosystem, along with the relationship between forest structure and function and city. Exploring the comprehensive management mode of port city forest provides a scientific basis for the overall improvement of ecosystem service function in Lianyungang city.
Data availability statement
The raw data supporting the conclusion of this article will be made available by the authors, without undue reservation.
Author contributions
All authors contributed to the study conception and design. Material preparation, data collection, and analysis were performed by XL and YP. The first draft of the manuscript was written by XL and HZ, and all authors commented on previous versions of the manuscript. The revised manuscript was drafted and edited by HZ. All authors read and approved the final manuscript.
Funding
This work was supported by the National Social Science Foundation in China (19BJY033).
Acknowledgments
This research thanks for the comments from reviewers.
Conflict of interest
The authors declare that the research was conducted in the absence of any commercial or financial relationships that could be construed as a potential conflict of interest.
Publisher’s note
All claims expressed in this article are solely those of the authors and do not necessarily represent those of their affiliated organizations, or those of the publisher, the editors and the reviewers. Any product that may be evaluated in this article, or claim that may be made by its manufacturer, is not guaranteed or endorsed by the publisher.
References
Bai, Y., Chou, L., and Zhang, W. (2021). Industrial innovation characteristics and spatial differentiation of smart grid technology in China based on patent mining. J. Energy Storage 43, 103289.
Bertinelli, L., and Black, D. (2004). Urbanization and growth. J. Urban Econ. 56 (1), 80–96. doi:10.1016/j.jue.2004.03.003
Dodman, D. (2016). Environment and urbanization. International encyclopedia of geography: People, the earth, environment and technology: People, the earth. Environ. Technol., 1–9. doi:10.1002/9781118786352.wbieg0623
Endreny, T. A. (2018). Strategically growing the urban forest will improve our world. Nat. Commun. 9 (1), 1160–1163. doi:10.1038/s41467-018-03622-0
Gao, D., Li, G., and Li, Y. (2021). Government cooperation, market integration, and energy efficiency in urban agglomerations—Based on the quasi-natural experiment of the Yangtze River Delta urban economic coordination committee. Energy & Environ. doi:10.1177/0958305X211047480
Gao, S., Janowicz, K., and Couclelis, H. (2017). Extracting urban functional regions from points of interest and human activities on location‐based social networks. Trans. GIS 21 (3), 446–467. doi:10.1111/tgis.12289
Gong, C., Chen, J., and Yu, S. (2011). Spatiotemporal dynamics of urban forest conversion through model urbanization in Shenzhen, China. Int. J. Remote Sens. 32 (24), 9071–9092. doi:10.1080/01431161.2010.549848
Guan, X., Wei, H., Lu, S., Dai, Q., and Su, H. (2018). Assessment on the urbanization strategy in China: Achievements, challenges and reflections. Habitat Int. 71, 97–109. doi:10.1016/j.habitatint.2017.11.009
Gunawardena, K. R., Wells, M. J., and Kershaw, T. (2017). Utilising green and bluespace to mitigate urban heat island intensity. Sci. Total Environ. 584, 1040–1055. doi:10.1016/j.scitotenv.2017.01.158
Liu, C., Sun, W., and Li, P. (2022). Characteristics of spatiotemporal variations in coupling coordination between integrated carbon emission and sequestration index: A case study of the Yangtze River Delta, China. Ecol. Indic. 135, 108520. doi:10.1016/j.ecolind.2021.108520
Lv, H., Yang, Y., Zhang, D., Du, H., Zhang, J., Wang, W., et al. (2019). Perimeter-area ratio effects of urbanization intensity on forest characteristics, landscape patterns and their associations in Harbin City, Northeast China. Urban Ecosyst. 22 (4), 631–642. doi:10.1007/s11252-019-00850-0
Magura, T., Lövei, G. L., and Tóthmérész, B. (2010). Does urbanization decrease diversity in ground beetle (Carabidae) assemblages? Glob. Ecol. Biogeogr. 19 (1), 16–26. doi:10.1111/j.1466-8238.2009.00499.x
Manoli, G., Fatichi, S., Schläpfer, M., Yu, K., Crowther, T. W., Meili, N., et al. (2019). Magnitude of urban heat islands largely explained by climate and population. Nature 573 (7772), 55–60. doi:10.1038/s41586-019-1512-9
Merrilees, B., Miller, D., and Herington, C. (2013). City branding: A facilitating framework for stressed satellite cities. J. Bus. Res. 66 (1), 37–44. doi:10.1016/j.jbusres.2011.07.021
Mummidi, L. N., and Krumm, J. (2008). Discovering points of interest from users’ map annotations. GeoJournal 72 (3), 215–227. doi:10.1007/s10708-008-9181-5
Seto, K. C., Sánchez-Rodríguez, R., and Fragkias, M. (2010). The new geography of contemporary urbanization and the environment. Annu. Rev. Environ. Resour. 35, 167–194. doi:10.1146/annurev-environ-100809-125336
Song, X. P., Tan, P. Y., Edwards, P., and Richards, D. (2018). The economic benefits and costs of trees in urban forest stewardship: A systematic review. Urban For. Urban Green. 29, 162–170. doi:10.1016/j.ufug.2017.11.017
Sorensen, A. (2018). Institutions and urban space: Land, infrastructure, and governance in the production of urban property. Plan. Theory & Pract. 19 (1), 21–38. doi:10.1080/14649357.2017.1408136
Chou, L. C., Zhang, W. H., Wang, M. Y., and Yang, F. M. (2020). The influence of democracy on emissions and energy efficiency in America: New evidence from quantile regression analysis. Energy Environ. 31 (8), 1318–1334.
Wang, Y. N., Zhou, Z. G., Zhu, W. H., Li, C. Z., and Yang, J. M. (2021). Effects of urbanization intensity on urban forest landscape pattern. Shandong For. Sci. Technol. 51 (05), 29–35.
Weng, Q., and Lu, D. (2008). A sub-pixel analysis of urbanization effect on land surface temperature and its interplay with impervious surface and vegetation coverage in Indianapolis, United States. Int. J. Appl. earth observation geoinformation 10 (1), 68–83. doi:10.1016/j.jag.2007.05.002
Xu, S., Li, S. L., Zhong, J., and Li, C. (2020). Spatial scale effects of the variable relationships between landscape pattern and water quality: Example from an agricultural karst river basin, Southwestern China. Agric. Ecosyst. Environ. 300, 106999. doi:10.1016/j.agee.2020.106999
Yang, J., Li, S., and Lu, H. (2019). Quantitative influence of land-use changes and urban expansion intensity on landscape pattern in Qingdao, China: Implications for urban sustainability. Sustainability 11 (21), 6174. doi:10.3390/su11216174
Yang, J. M., Zhou, Z. G., and Liu, Z. F. (2021). The relationship between POI spatial density and urban forest landscape patterns. J. Chin. Urban For. 19, 1672–4925.
Ye, M., Yin, P., Lee, W. C., and Lee, D. L. (2011). Exploiting geographical influence for collaborative point-of-interest recommendation. In Proceedings of the 34th international ACM SIGIR conference on Research and development in Information Retrieval, July 24-28, 2011, Beijing, China (pp. 325–334).
Zhang, W. H., Chou, L. C., and Chen, M. (2022). Consumer perception and use intention for household distributed photovoltaic systems. Sustain. Energy Technol. Assess. 51. 101895.
Keywords: urban forest, landscape indices, urban ecosystem, economic vitality, GWR, geographic technologies
Citation: Liu X, Pan Y and Zhou H (2022) Indexing coordination of ecosystem and urban economic vitality in coastal cities: An observation in yangtze river delta. Front. Environ. Sci. 10:1004648. doi: 10.3389/fenvs.2022.1004648
Received: 27 July 2022; Accepted: 23 August 2022;
Published: 19 September 2022.
Edited by:
Magdalena Radulescu, University of Pitesti, RomaniaReviewed by:
Ying Zhang, National University of Singapore, SingaporeAmandeep Kaur, Sri Guru Granth Sahib World University, India
Copyright © 2022 Liu, Pan and Zhou. This is an open-access article distributed under the terms of the Creative Commons Attribution License (CC BY). The use, distribution or reproduction in other forums is permitted, provided the original author(s) and the copyright owner(s) are credited and that the original publication in this journal is cited, in accordance with accepted academic practice. No use, distribution or reproduction is permitted which does not comply with these terms.
*Correspondence: Haiyan Zhou, bXJzLnpob3VoYWl5YW5Ab3V0bG9vay5jb20=