 Yangying Tang
 Zhishan Yang
 Jian Yao
95% of researchers rate our articles as excellent or good
Learn more about the work of our research integrity team to safeguard the quality of each article we publish.
Find out more
ORIGINAL RESEARCH article
Front. Environ. Sci. , 17 October 2022
Sec. Environmental Economics and Management
Volume 10 - 2022 | https://doi.org/10.3389/fenvs.2022.1004463
This paper uses the EBM model to measure the carbon emission efficiency of the logistics industry in 30 provinces in China from 2010 to 2019 and analyzes its spatial and temporal evolution characteristics using ARCGIS visualization. On this basis, the structural characteristics of the spatial correlation network of carbon emission efficiency of the logistics industry in China and its influencing factors are explored and analyzed by using the social network analysis method and the quadratic distribution method (QAP). The study shows that: 1) The national average logistics industry carbon emission efficiency increased from 2010 to 2019, and the spatial logistics industry carbon emission efficiency shows the characteristics of East > Central > Northeast > West, and most of the provinces in China are still in the middle and low logistics industry carbon emission efficiency zone. 2) The carbon emission efficiency of logistics industry in 30 provinces in China has formed a stable spatial correlation network, and there is an obvious spatial spillover relationship. However, the structure of the spatial association network is loose, and there are obvious gaps in the status of each province in the spatial association network. The provinces in the eastern region are at the core of the spatial correlation network, while the provinces in the northeast and west are at the periphery of the spatial correlation network. 3) The reduction of geographical distance between provinces, the greater the differences in logistics development level, logistics energy intensity and logistics environmental protection level, and the higher the similarity of logistics informatization level, the more it can promote the formation of spatial correlation network.
With the deepening of global attention to climate issues, “low-carbon development” has become the goal pursued in today’s era (Sheng et al., 2021). Logistics industry is one of the industries with high energy consumption and high carbon emission in China. According to the China Energy Statistical Yearbook of energy consumption data by industry, the total energy consumption of China’s logistics industry in 2019 was as high as 439.09 million tons of standard coal, accounting for 9% of the total energy consumption, ranking third in the ranking of energy consumption data by industry. High energy consumption is inevitably accompanied by high carbon emissions, and carbon emissions data published by the China Carbon Accounting Database (CEADs) show that China’s logistics industry emitted 732.5 million tons of carbon dioxide in 2019, accounting for 7.48% of the country’s total carbon dioxide emissions. Carbon emission efficiency is the ratio between the minimum carbon emission and actual emission that can theoretically be achieved under the conditions of given input factors and economic output (Wang et al., 2010; Zhou et al., 2010). Some scholars believe that carbon emission efficiency is the unity of economic and environmental benefits. Use as little carbon emission as possible to obtain more economic output (Xu, 2021). The essence of these two statements is to regard carbon emission as an undesired output, and consider the input-output relationship of the logistics industry under the constraint of carbon emission. The higher the carbon emission efficiency of the logistics industry, the higher the economic value or the less carbon emissions produced under the same logistics industry input, which is more conducive to the low-carbon development of the regional logistics industry. Improving the carbon emission efficiency of logistics industry and fostering a modern low-carbon green logistics industry have an important role in promoting the construction of a modernized green economic system (Chen et al., 2019).
At present scholars’ research on carbon emission efficiency in logistics industry mainly focuses on the following three aspects: 1) Carbon emission efficiency indicators measured by data envelopment analysis (DEA) are used for carbon emission efficiency determination in logistics industry, and the commonly used models are radial three-stage DEA model (Wang and Ma, 2012), DEA-BCC model (Zheng et al., 2020; Ma et al., 2021; Du, 2022), non-radial SBM model (Hou and Zhu, 2019; Tao et al., 2021), and super-efficient SBM model (He et al., 2021; Xu et al., 2022a). The radial three-stage DEA model and DEA-BCC model are inaccurate in efficiency determination when there are non-expected outputs; when there are non-zero relaxation variables, the efficiency values derived from the non-radial SBM model and the super-efficient SBM model are usually lower than the actual efficiency values. The EBM model considers all radial and non-radial relaxation variables (Yin and Zhu, 2020), which can compensate for their deficiencies in efficiency determination. 2) Exploratory spatial analysis (EDSA) was used to conduct spatial autocorrelation analysis by calculating Moran’s I index, so as to determine the agglomeration of carbon emission efficiency of logistics industry in each province and its spatial correlation. Research (Chen and Pan, 2016) uses the global spatial autocorrelation and local spatial autocorrelation methods to analyze the spatial agglomeration of the carbon emission efficiency of the logistics industry in 30 provinces of China from 2005 to 2014. The results show that the spatial autocorrelation of the carbon emission efficiency of China’s logistics industry as a whole has been enhanced during the research period, while most provinces have positive spatial autocorrelation, that is, the regions with high carbon emission efficiency of the logistics industry are surrounded by other regions with high carbon emission efficiency, On the contrary, low and low provinces surround. At the same time, the provinces with low carbon emission efficiency in China’s logistics industry have the trend of further gathering. The study (Liu and Guan, 2017) also uses spatial autocorrelation method to analyze the spatial agglomeration of carbon emission efficiency of logistics industry in 30 provinces of China from 2003 to 2014. The results show that the overall distribution of logistics industry efficiency shows weak agglomeration, and tends to converge in the unbalanced development. The spatial linkage between North China and Central China has been strengthened, while the development of logistics industry in Guangdong, Fujian and other provinces has not played a strong role in driving the surrounding areas. Recent scholars have explored the spatial pattern of carbon emission efficiency of inter-provincial logistics industry in China by using Gini coefficient and gravity-standard deviation ellipse analysis (Liu et al., 2021). The results show that the distribution center of carbon emission efficiency of China’s logistics industry tends to shift from inland to coastal areas, and the distribution pattern has a tendency to concentrate in the east. 3) Tobit regression model was used to quantitatively analyze the influencing factors of logistics carbon emission efficiency from the perspectives of economic development level, industry scale, energy consumption structure and informationization level (Liu and Guan, 2017; Cao and Deng, 2019).
Driven by the national and regional coordinated development strategy, today’s social and economic level, logistics and transportation level, information exchange level, scientific and technological development level and other multi-level integrated development, carbon emissions as a product of social and economic activities, its spatial relationship has broken through the traditional relationship. The linear mode gradually presents a nonlinear spatial structure with complex network structure characteristics (Sun et al., 2016; Wang et al., 2020a). At the same time, the spatial correlation of the carbon emission efficiency of the logistics industry in various provinces has also been strengthened. However, the existing research on the carbon emission efficiency of the logistics industry lacks integrity. It only analyzes the spatial relationship of the carbon emission efficiency of the logistics industry based on the geographical adjacency relationship between provinces, and does not consider the possible impact of “non-adjacent” areas on the carbon emission efficiency of the logistics industry. Characterize the spatial correlation network formed by the carbon emission efficiency of the logistics industry among provinces. Moreover, the existing research on the carbon emission efficiency of the logistics industry only pays attention to the attribute data of the province itself. Few articles explore the carbon emission efficiency of the logistics industry from the relationship data between provinces, which makes the spatial correlation research of the carbon emission efficiency of the logistics industry still blank. This restricts the coordinated emission reduction of regional logistics. Social network analysis (SNA) explores the spatial relationship of each node based on the “relationship data” between nodes, which can systematically reflect the spatial correlation network and attribute characteristics (Liu and Song, 2018). This contributes to the construction and visual analysis of spatial correlation networks (Wang et al., 2018). Social network analysis method is widely used in social science, ecological governance, energy and environment (Zhang et al., 2022a), and the latest scholars also apply it to power (Wei et al., 2020), tourism (Wang et al., 2020b), agriculture (He et al., 2020), transportation (Ma et al., 2019), architecture (Huo et al., 2022) and other related carbon emission fields.
Therefore, in view of the shortcomings of the existing research, this paper applies the social network analysis method to the research on the carbon emission efficiency of the logistics industry for the first time. From the perspective of spatial relationship and network, this paper systematically reveals the spatial correlation network formed by the carbon emission efficiency of the logistics industry in 30 provinces (cities and autonomous regions, hereinafter referred to as “provinces,” excluding Tibet Autonomous Region, Hong Kong, Macao and Taiwan), determines the status and role of each province in the spatial correlation network, and then analyzes the influencing factors of the formation of the spatial correlation network using the quadratic assignment procedure (QAP). Different from the existing spatial autocorrelation method, which uses the province’s own attribute data and simple geographic adjacent data to analyze the spatial relationship of carbon emission efficiency in the logistics industry, this paper uses the social network analysis method to accurately depict the spatial correlation network of carbon emission efficiency in China’s logistics industry from the relationship data between provinces. This study found that the spatial relationship of carbon emission efficiency of logistics industry in 30 provinces of China is no longer a simple geographical spatial aggregation relationship presented by existing research, but a complex, multi flow spatial association network. This research accurately depicts the spatial correlation network and systematically analyzes the structural characteristics of the spatial correlation network, which is helpful to comprehensively understand the spatial correlation and network structural characteristics of the carbon emission efficiency of the logistics industry, and promote the transformation of emission reduction policies from “local” to “whole.” At the same time, the study found that the central provinces of the logistics industry’s carbon emission efficiency spatial correlation network are concentrated in the eastern region, such as Hebei, Shanghai, Guangdong, etc., taking the central provinces of the spatial correlation network as the starting point, relying on its strong radiation and driving effect on other provinces, using the inter provincial system connection network to enhance the spatial linkage effect of the logistics industry’s carbon emission efficiency, and innovating the concept of collaborative emission reduction, Provide scientific basis for coordinated emission reduction of regional logistics, promote the sustainable development of China’s logistics industry, and achieve the goal of carbon emission reduction and carbon neutralization as soon as possible.
This paper first uses the EBM model to measure the carbon emission efficiency of the logistics industry in 30 provinces from 2010 to 2019, and analyzes the spatial and temporal evolution characteristics of the carbon emission efficiency of the logistics industry in 30 Chinese provinces through ARCGIS visualization; then introduces the modified gravity model to construct the spatial correlation binary matrix of the carbon emission efficiency of the logistics industry in China, and uses Ucinet 6.0 software to draw the spatial correlation network structure from 2010 to 2019 and characterize the structure of the spatial association network using social network analysis. Then the QAP method was used to analyze the factors influencing the formation of the spatial correlation network, and finally, based on the conclusions obtained, corresponding policy suggestions were made to further strengthen the tightness of the spatial correlation network and improve the carbon emission efficiency of China’s logistics industry. The concrete technology roadmap of the paper is as follows (Figure 1):
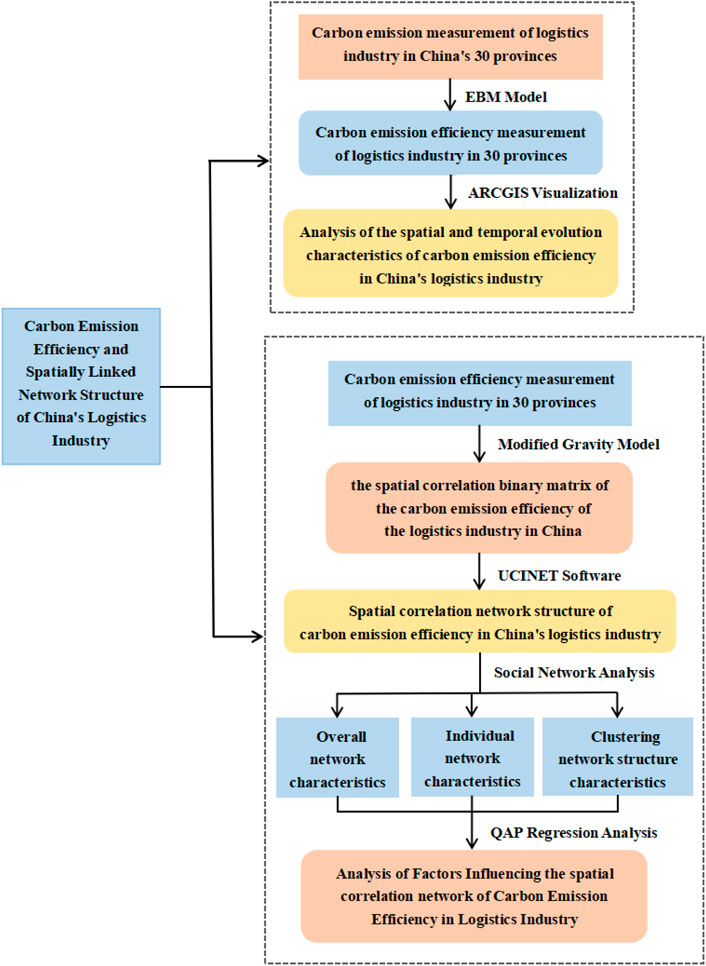
FIGURE 1. Technology roadmap of this paper.
The transportation, warehousing and postal industries account for more than 85% of the total output value of the logistics industry (Ma and Wang, 2013), which can largely reflect the development of the entire logistics industry. Therefore, this paper uses the terminal energy consumption of transportation, warehousing and postal industries in each province in the regional energy balance table of the China Energy Statistical Yearbook to replace the terminal energy consumption of the logistics industry, CO2 emissions of the logistics industry are calculated based on the requirements of the IPCC coefficient method in the 2006 IPCC Guidelines for National Greenhouse Gas Inventories (IPCC, 2006; Jiang et al., 2020). The existing researches (Zhang and Cai, 2014; Zhang, 2016; Zhao and Yang, 2019; Long et al., 2020; Quan et al., 2020; Xu and Ning, 2020; Wang, 2021; Li et al., 2022a; Xu et al., 2022b) all use this method to calculate the CO2 emissions of the logistics industry. The specific calculation formula is as follows:
In Eq. 1, C is the CO2 emissions of the logistics industry from 2010 to 2019, in units of 104 tons; Ci is the carbon emission of the ith energy, in units of 10,000 tons; Ei is the consumption of the ith energy, in units of 104 tons; ηi is the coefficient of converting the ith energy into standard coal, in units of kg/kg or kg/m3;αi is the carbon emission coefficient of the ith energy, in units of t/t or t/103 m3;
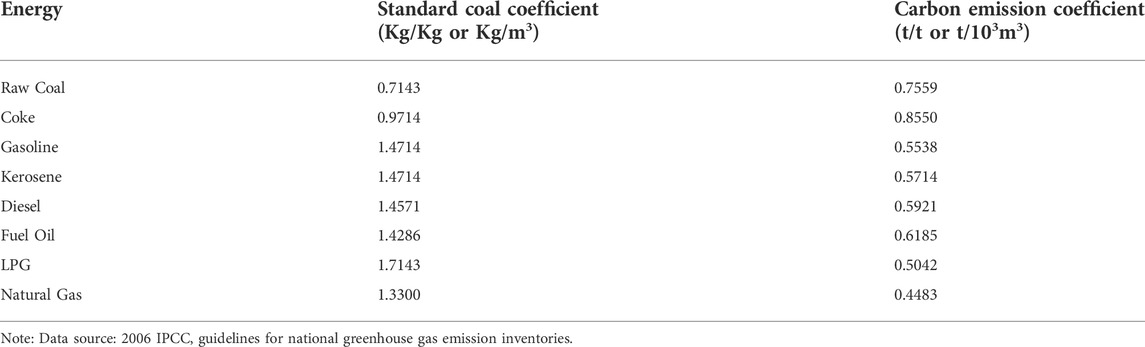
TABLE 1. Coefficient of the eight energy sources.
In this paper, a non-oriented, non-expected output-based EBM model is used to determine the carbon emission efficiency of the logistics industry in 30 Chinese provinces from 2010 to 2019, and the model formula is given in reference (Ren et al., 2020). This paper selects the evaluation index of carbon emission efficiency of logistics industry from the aspects of input and output. Combining the existing studies (Cao and Deng, 2019; He et al., 2021) to establish the carbon emission efficiency index system of logistics industry in 30 provinces from 2010 to 2019 (Table 2). Descriptive statistics of sample data are shown in Table 3.
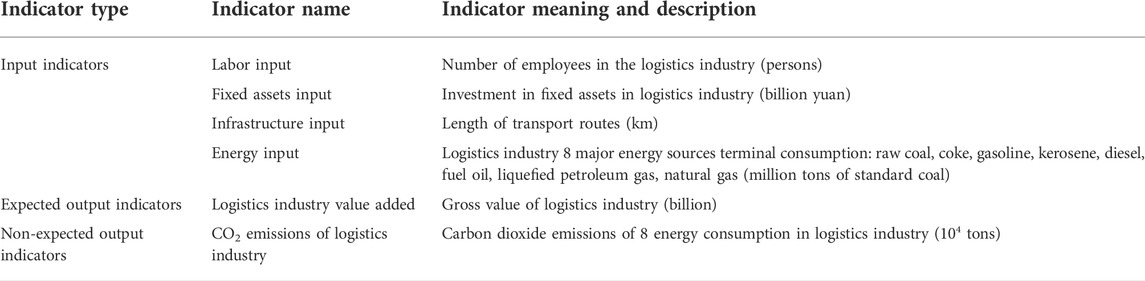
TABLE 2. Carbon emission efficiency index system of China’s logistics industry.
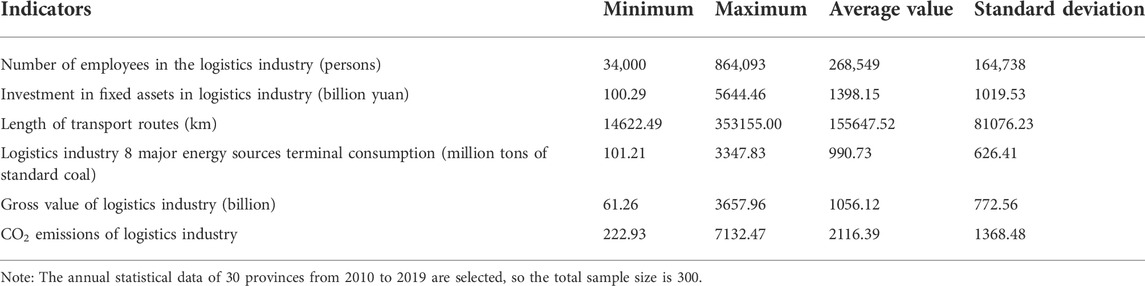
TABLE 3. Descriptive statistics of sample data.
Drawing on the method of existing studies (Wang et al., 2019; Zhang et al., 2022b), a modified gravity model was introduced to measure the spatial correlation intensity of carbon emission efficiency in the logistics industry among 30 provinces in China. The calculation formula is as follows.
In Eq. 2, Fij denotes the spatial correlation strength of carbon emission efficiency of logistics industry between provinces i and j; Ai, Aj, Gi, Gj, ai, and aj denote the gross value of logistics industry, carbon emission efficiency of logistics industry and gross value per employee of logistics industry in provinces i and j, respectively; Dij denotes the distance of provincial capital between provinces i and j. According to the spatial correlation strength of carbon emission efficiency of logistics industry between provinces, the threshold value is set to the mean value of each row, and if F is greater than this mean value, it is recorded as 1, indicating that there is a correlation between the carbon emission efficiency of logistics industry between provinces; otherwise, it is recorded as 0, indicating that there is no correlation between provinces (Liang, 2019; Yu et al., 2022), which results in the binary matrix of spatial correlation of carbon emission efficiency of logistics industry in China.
This paper analyzes the structure of the spatially linked network of carbon emission efficiency in China’s logistics industry from three aspects: overall characteristics, individual characteristics and clustering characteristics using social network analysis (Cheng et al., 2020; Rong et al., 2022). In terms of overall characteristics, five indicators are selected to analyze the overall robustness, closeness of network relationships and differences in network hierarchy of spatially linked networks (Shao and Wang, 2021; Shang et al., 2022; Sun et al., 2022): network relatedness, network efficiency, network number, network density and network hierarchy. In terms of individual characteristics, three indicators (Song et al., 2019; Wei and Chen, 2021; Zheng and Ye, 2022a), degree centrality, closeness centrality and betweenness centrality, were selected to quantitatively analyze the roles and positions played by each province in the spatially linked network. In terms of clustering characteristics, the spatial association network was divided into four major plates of net benefit, broker, two-way spillover, and net spillover using block model analysis, drawing on existing studies based on the number of incoming and outgoing relationships in the plate and the difference between the expected internal relationship ratio of the plate and the actual internal relationship ratio of the plate (Zhao et al., 2021; Zheng and Ye, 2022b), and the interactions within the plate and between the plate and the plate were studied and analyzed.
This paper takes relational data as the research object, so there must be correlations between variables. qap regression analysis method has no strict requirements for independence between variables, and the regression results are more robust than using conventional methods (Doreian and Conti, 2012). Therefore, the QAP regression analysis method is chosen in this paper to study the factors influencing the spatial correlation network of carbon emission efficiency in China’s logistics industry. Using 2019 data as a representative, the following model was constructed by combining existing studies (Wang et al., 2020b; Zheng and Ye, 2022b; Shang et al., 2022).
where T denotes the spatial correlation dichotomous matrix of carbon emission efficiency of China’s logistics industry; L denotes the spatial adjacency matrix, with the adjacency of two provinces recorded as 1, otherwise recorded as 0; J denotes the logistics development level difference matrix, expressed by the difference of GDP of logistics industry in each province; R denotes the logistics industry structure difference matrix, expressed by the difference of GDP of logistics industry in each province to the total GDP of each province; N denotes the logistics energy utilization difference matrix, expressed by N denotes the matrix of differences in logistics energy utilization, expressed as the difference in the ratio of logistics integrated turnover to energy consumption by province, and logistics integrated turnover is expressed as the difference in road, rail, and water transportation turnover of freight and passengers by province, respectively, calculated in the literature (Li and Li, 2019). Y denotes the difference matrix of logistics transportation intensity, expressed by the difference in the ratio of turnover volume to GDP of logistics industry in each province; X denotes the difference matrix of logistics informatization level, expressed by the difference in total postal and telecommunications business income in each province; Z denotes the difference matrix of logistics investment intensity, expressed by the difference in fixed asset investment in logistics industry in each province.
In this paper, the statistical data of transportation, storage and postal industry in 30 provinces of China from 2010 to 2019 are used instead of logistics industry, and the data are obtained from each province’s Statistical Yearbook, National Statistical Yearbook, China Energy Statistical Yearbook, China Fixed Assets Investment Statistical Yearbook and China Fixed Assets Investment Statistical Annual Report, and the missing data are complemented by linear interpolation method.
This paper uses the EBM model to calculate the carbon emission efficiency of logistics industry in 30 provinces of China from 2010 to 2019. At the same time, Li’s (Li et al., 2022b) classification of aviation carbon emission efficiency can be used for reference, the carbon emission efficiency of logistics industry is divided into four ranks: very low efficiency (0 < ρ ≤ 0.3), low efficiency (0.3 < ρ ≤ 0.6), medium efficiency (0.6 < ρ ≤ 0.9), and High efficiency (ρ > 0.9), and the distribution of carbon emission efficiency of logistics industry in 30 provinces in China is obtained.
The carbon emission efficiency of logistics industry in 30 provinces of China from 2010 to 2019 is shown in Table 4. From the average carbon emission efficiency of the logistics industry in 30 provinces, 13 provinces, including Hebei, Tianjin, Shanghai, Jiangsu, Shandong, Liaoning, Fujian, Inner Mongolia and Henan, have carbon emission efficiency of more than 0.6, which belongs to the medium carbon emission efficiency level. However, the carbon emission efficiency of logistics industry in Qinghai, Heilongjiang, Sichuan and other three provinces is lower than 0.3, which belongs to the very low carbon emission efficiency level. From the perspective of the change rate of carbon emission efficiency of the logistics industry in 30 provinces, from 2010 to 2019, except that the carbon emission efficiency of the logistics industry in four provinces, Jiangsu, Qinghai, Chongqing and Gansu, decreased slightly, the carbon emission efficiency of the logistics industry in the remaining 26 provinces increased. For the four provinces where the carbon emission efficiency of the logistics industry has decreased, among them, the carbon emission efficiency of the logistics industry in Jiangsu Province has decreased from 0.815 in 2010 to 0.801 in 2019, with a drop rate of 1.718%. The carbon emission efficiency of the logistics industry has fluctuated between 0.7–1. Although the carbon emission efficiency of the logistics industry is relatively high, efforts have been made to improve the growth rate of the carbon emission of the logistics industry and reverse the decline in the carbon emission efficiency of the logistics industry. The carbon emission efficiency of the logistics industry in Gansu, Qinghai and Chongqing has decreased by 12.752%, 6.375%, and 4.966% respectively. During the study period, Gansu and Qinghai have been at a very low carbon emission efficiency level, while Chongqing has been at a low carbon emission efficiency level. Due to the geographical location limitations of these three provinces, the carbon emission efficiency of the logistics industry is not high and has a downward trend, so it is necessary to further strengthen the development of low-carbon logistics industry. For the 26 provinces where the carbon emission efficiency of the logistics industry has increased, according to their different growth rates, the natural breakpoint method is used to divide them into five types. Among them, Yunnan Province belongs to the rapid growth type. The carbon emission efficiency of its logistics industry increased from 0.213 in 2010 to 0.568 in 2019, with a growth rate of 166.667%. The reason is that, due to the implementation of the Western Development Strategy and the Bridgehead Project, Yunnan has become an important bridge to communicate materials, technology, information and other information in Southeast Asia. In addition, the relevant national policy support for Yunnan Province has provided a good political environment for the development of modern logistics industry in Yunnan Province, which has led to the rapid growth of carbon emission efficiency of its logistics industry. Liaoning, Xinjiang, Sichuan, Shanxi, Hainan and other five provinces are of fast growth type. Guizhou, Inner Mongolia, Hubei, Guangxi, Beijing, Shanghai, Jiangxi and other seven provinces are of medium growth type. Anhui, Fujian, Henan, Guangdong, Zhejiang, Shaanxi, Hunan, Tianjin, Hebei, Heilongjiang and other 10 provinces are slow growing. Jilin, Ningxia, Shandong and other three provinces belong to the extremely slow growth type. It can be seen that the regions with slow growth in carbon emission efficiency of China’s logistics industry are mainly concentrated in the economically underdeveloped regions such as the northwest and northeast, as well as Shandong, Hebei, Tianjin and other provinces with high levels of low-carbon logistics.
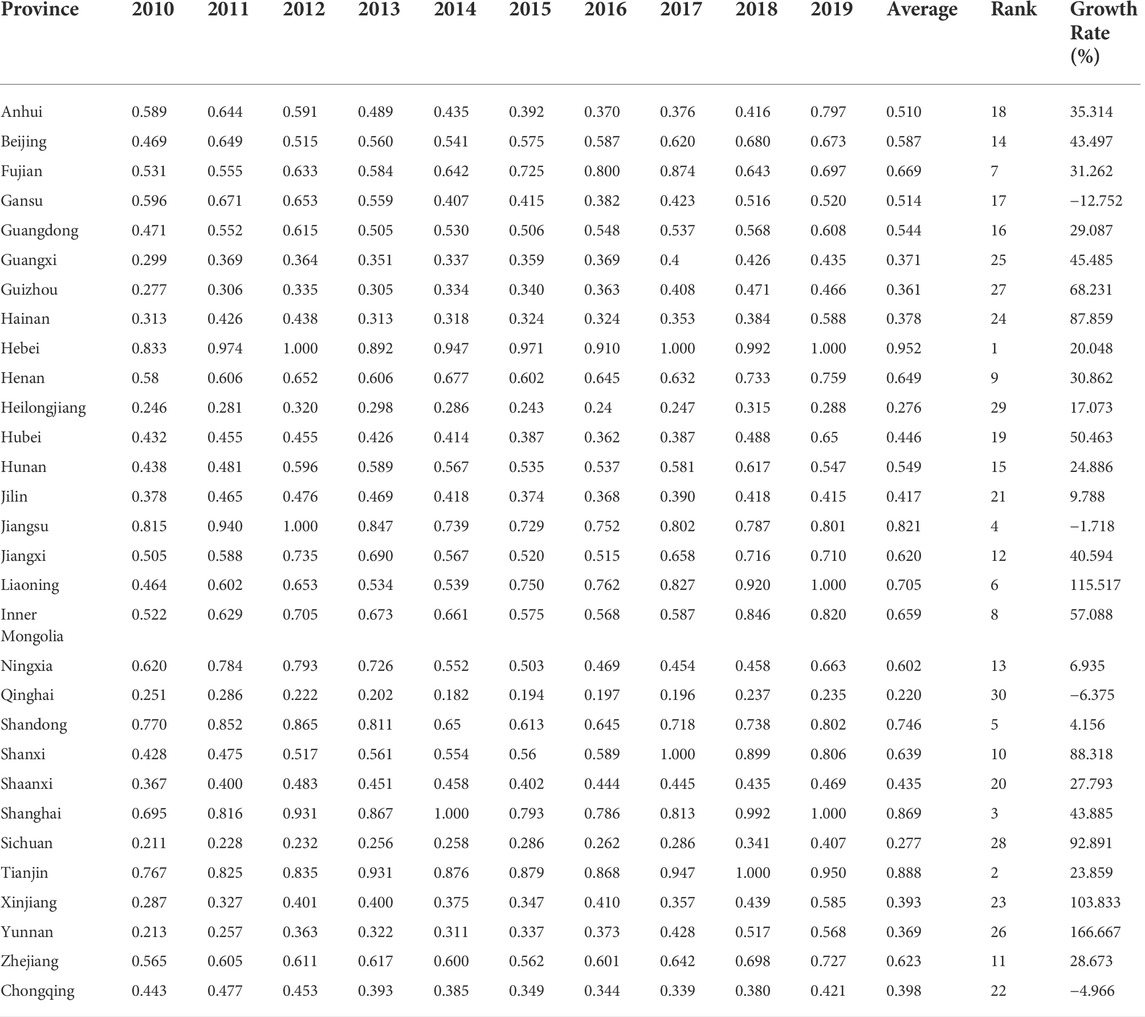
TABLE 4. Carbon emission efficiency of logistics industry in 30 provinces of China from 2010 to 2019.
The changes of the average carbon emission efficiency of the logistics industry in the whole country and the four regions from 2010 to 2019 is shown in Figure 2.
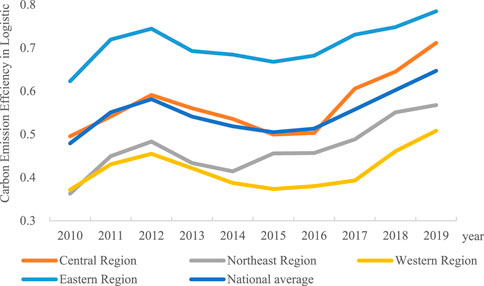
FIGURE 2. Trend of carbon emission efficiency in China’s logistics industry, 2010–2019.
On the whole, from 2010 to 2019, the national average carbon emission efficiency of the logistics industry in China showed a trend of “first rising—then falling - then rising.” The reason is that, with the implementation of the first national plan of China’s logistics industry in 2009: the Plan for the Adjustment and Revitalization of the Logistics Industry, and from 2010 to 2012, the industrial structure of China’s logistics industry was adjusted to modernize and efficient logistics, which increased the carbon emission efficiency of the logistics industry during this period. However, with the rapid development of the logistics industry and the innovation of the business model, China’s logistics industry is unable to coordinate as a whole due to the lack of a unified logistics management department, forming a unified, open, fair and orderly modern logistics market system, resulting in the logistics industry has a great barrier in the optimization of the allocation of resource elements, and the carbon emission efficiency of the logistics industry has also shown a short-term downward trend. After 2015, with the introduction of the medium and long-term plan for the development of the logistics industry (2014–2020), the goal of establishing a modern logistics service system with reasonable layout, advanced technology, convenience, efficiency, green environment, safety and order was proposed. The level of socialization and specialization of logistics has been further improved, and the carbon emission efficiency of the national logistics industry has been rapidly improved. Under the same carbon emission conditions, the economic output of China’s logistics industry has increased, and the industrial efficiency of the logistics industry has improved. In general, from 2010 to 2019, the average carbon emission efficiency of China’s logistics industry increased from 0.479 to 0.647, realizing the transformation from low carbon emission efficiency to medium carbon emission efficiency, and the low-carbon development of the logistics industry achieved significant results.
From the perspective of the four regions, the overall carbon emission efficiency of the logistics industry in the four regions also showed a fluctuating upward trend from 2010 to 2019. The carbon emission efficiency in the eastern region increased from 0.623 to 0.786, which was stable at the medium carbon emission efficiency level. The reason is that the eastern region of China has developed economy, advanced low-carbon logistics development technology, abundant resources and strict restrictions on environmental pollution, so its logistics industry has high carbon emission efficiency. The carbon emission efficiency of the logistics industry in the central region increased from 0.495 to 0.711, with the largest growth rate. It was transformed from a low carbon emission efficiency area to a medium carbon emission efficiency area. This is mainly due to the country’s strong support for the development of the central region. With the introduction of the 13th Five Year Plan for Promoting the Rise of the Central Region and other relevant policies, the logistics industry in the central region, as a comprehensive transportation hub, has developed vigorously. At the same time, the emphasis on ecological civilization has been deepened, the logistics industry structure has been adjusted, and low-carbon logistics has developed rapidly. The carbon emission efficiency of logistics industry in northeast region rose from 0.363 to 0.568, and that in western region rose from 0.371 to 0.508, indicating that the development of low-carbon logistics in the four regions has achieved certain results. However, during the study period, the carbon emission efficiency of the logistics industry in the four regions still has obvious regional differences. The carbon emission efficiency of the logistics industry in the eastern region is always higher than the national average, while the carbon emission efficiency of the logistics industry in the central region is not much different from the national average. Although the carbon emission efficiency of the logistics industry in the northeast and western regions has improved, due to their geographical location, the transportation and logistics infrastructure is backward, the lack of corresponding resources and technical support, and the constraints on environmental pollution are relatively loose, Therefore, it has been lower than the national average and is at the low carbon emission efficiency level.
Based on the grade changes of carbon emission efficiency in the logistics industry in 30 provinces of China, ARCGIS visualization analysis was used to show the spatial evolution of carbon emission efficiency grade differences in the logistics industry in 30 provinces of China from 2010 to 2019, using 2010, 2013, 2016, and 2019 as representative years (Figure 3).
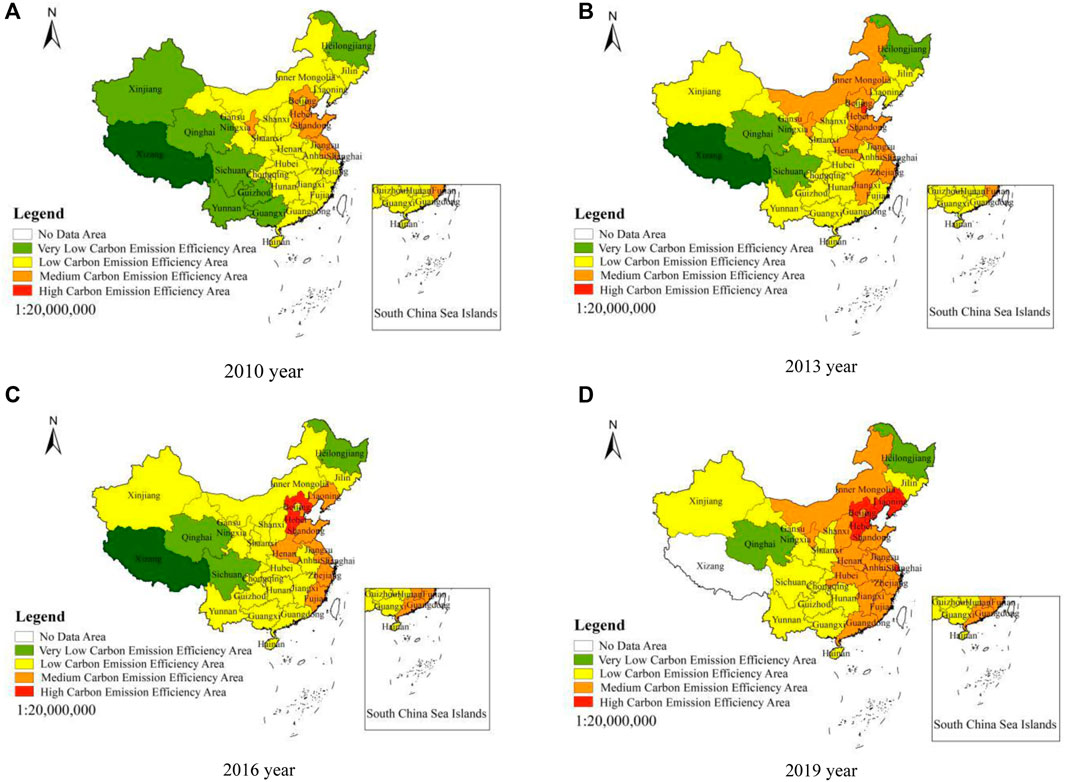
FIGURE 3. Distribution of carbon emission efficiency rating differences of logistics industry in 30 provinces in China, 2010–2019.
Note: The above four maps are based on the standard map with the review number GS (2019) 1822 downloaded from the standard map service website of the National Bureau of Surveying, Mapping and Geographic Information.
As can be seen from Figure 2, in 2010, the overall level of carbon emission efficiency of China’s logistics industry was low, there was no high logistics industry carbon emission efficiency zone, and only five places, such as Hebei, Shandong, Tianjin, Jiangsu and Ningxia, were medium carbon emission efficiency zones, 18 low carbon emission efficiency zones, such as Beijing, Hunan, Shanxi, Hubei and Jilin, and seven very low carbon emission efficiency zones, such as Guangxi, Guizhou, Sichuan and Xinjiang. In 2013, the Tianjin in the eastern region became a high carbon emission efficiency zone, and Shanghai and Zhejiang were transformed from low carbon emission efficiency zones to medium carbon emission efficiency zones. The carbon emission efficiency of the logistics industry in the central and western regions improved significantly, with four places in Xinjiang, Yunnan, Guangxi, and Guizhou transforming from very low carbon emission efficiency zones to low carbon emission efficiency zones, three places in Henan, Jiangxi, and Inner Mongolia transforming from low carbon emission efficiency zones to medium carbon emission efficiency zones, and only three places in Qinghai, Sichuan, and Heilongjiang being very low carbon emission efficiency zones. In 2016, four places in Tianjin, Inner Mongolia, Ningxia, and Jiangxi had their logistics industry carbon emission efficiency all decreased, Liaoning, Fujian, and Hebei three logistics industry carbon emission efficiency increased, Liaoning and Fujian transformed from low carbon emission efficiency zones to medium carbon emission efficiency zones, Hebei became the only high carbon emission efficiency zone, and the remaining provinces had little change in logistics industry carbon emission efficiency. 2019, high carbon emission efficiency zones increased to Hebei, Liaoning, Shanghai, and Tianjin 4, most provinces in the central region logistics industry carbon emission efficiency increases, with 13 medium carbon emission efficiency zones in Shanxi, Hubei, Anhui, etc., 11 low carbon emission efficiency zones in Sichuan and Xinjiang, and only two very low carbon emission efficiency zones in Qinghai and Heilongjiang.
Overall, from 2010 to 2019, the carbon emission efficiency of the logistics industry in 30 provinces in China has improved to varying degrees. High carbon emission efficiency zones increased from 0 to 4, all in the eastern coastal provinces; medium carbon emission efficiency zones increased significantly, from 5 to 13, mainly concentrated in the central region of China; low carbon emission efficiency zones decreased from 18 to 11, mostly in the western region provinces; very low carbon emission efficiency zones decreased from seven to 2. The overall carbon emission efficiency of China’s logistics industry shows the trend of East > Central > Northeast > West. Although the carbon emission efficiency of logistics industry in each province has improved significantly, most of the provinces are still in the middle and low carbon emission efficiency zones, and there is more room for improving the carbon emission efficiency of logistics industry.
Based on the spatially correlated binary matrix of carbon emission efficiency in the logistics industry obtained above, the visualization tool Netdraw in Ucinet 6.0 software was used to draw the spatially correlated network structure of carbon emission efficiency in China’s logistics industry using 2010, 2013, 2016, and 2019 as representative years (Figure 4). The spatial correlation of carbon emission efficiency of China’s logistics industry has gone beyond the simple geographical adjacency, forming a crisscross and multi flow spatial correlation network. Hebei, Shandong, Beijing and other economically developed eastern provinces have always been in the center of this spatial correlation network, which has a great impact on other provinces and has a strong radiation and leading role. Xinjiang, Shanxi, Shaanxi and other relatively backward western provinces are at the edge of the network, and their carbon emission efficiency radiation ability is weak.
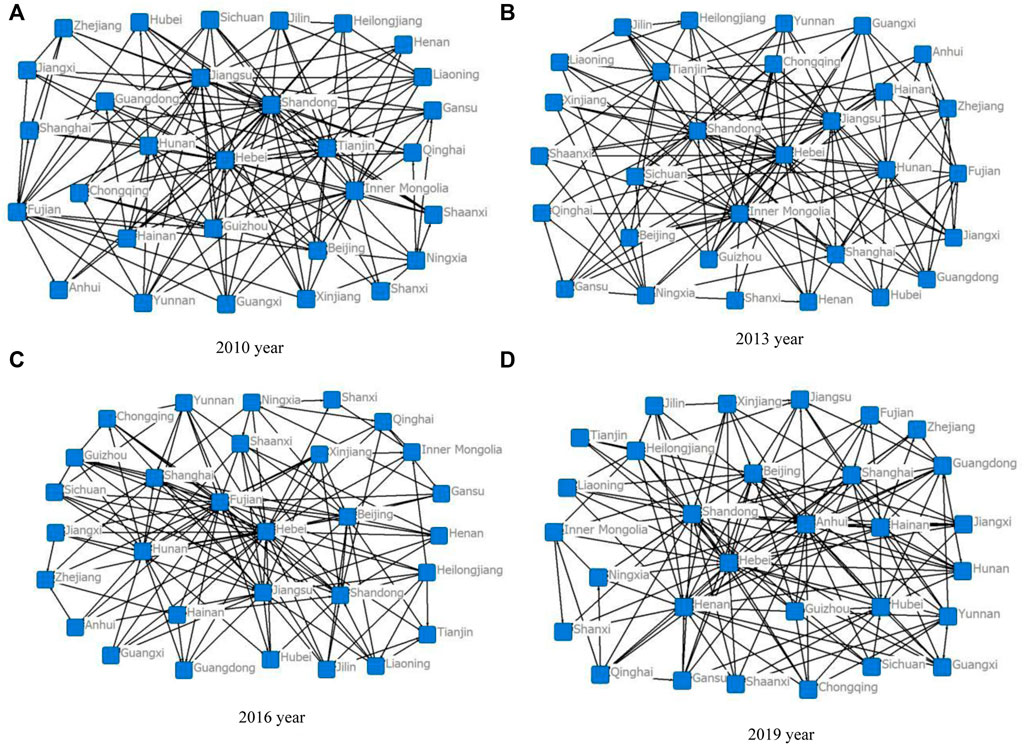
FIGURE 4. Structure of the spatial correlation network of carbon emission efficiency in China’s logistics industry.
The overall characteristic index values of the spatial correlation network of carbon emission efficiency in China’s logistics industry from 2010 to 2019 were calculated using Ucinet 6.0 software (Table 5). From 2010 to 2019, the network relatedness of the spatial correlation network of carbon emission efficiency of China’s logistics industry was one, indicating that 30 provinces and cities were included in the spatial correlation network, forming a stable spatial correlation network. From 2010 to 2019, the network efficiency of space related networks decreased from 0.702 to 0.562, and the lowest was 0.382 in 2018. The decline in network efficiency indicates that the spatial spillover of the network is enhanced, the carbon emission efficiency relationship of the logistics industry among provinces and cities is superimposed, the redundant correlation lines are increased, and the structure of the spatial correlation network is becoming more and more stable. From 2010 to 2019, the network number and network density of the spatial association network showed a trend of “first decreasing and then increasing.” The network density increased from 0.201 in 2010 to 0.212 in 2019. Although the network density value increased, the density of the spatial association network was still low compared with the maximum value of network density “1.” The spatial association degree of the carbon emission efficiency of the logistics industry in each province was not high. The number of network connections increased from 175 in 2010 to 184 in 2019, which is still far from the maximum number of possible network connections (870), which indicates that the network structure of spatial connection networks is still relatively loose, and the communication and cooperation between the logistics industry in various provinces and cities on carbon emission efficiency should be further improved. Meanwhile the network hierarchy decreases from 0.714 to 0.700, indicating that despite the coordinated allocation of logistics industry labor and information technology across the country due to the influence of policies, transportation and information, the gap between provinces in the spatially linked network is still large.
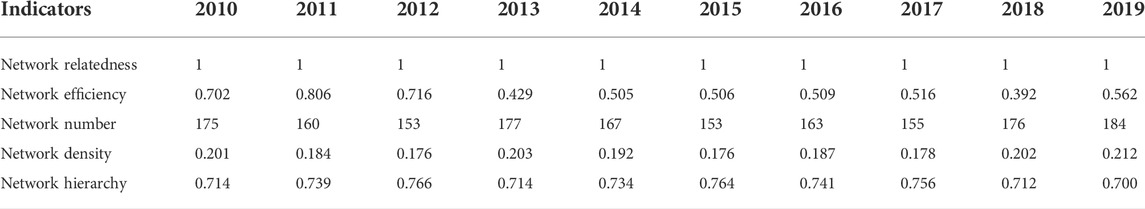
TABLE 5. Overall characteristic indicators of the spatially linked network of carbon emission efficiency in China’s logistics industry, 2010–2019.
The individual characteristic index values of the spatial correlation network of carbon emission efficiency of China’s logistics industry in 2019 were calculated using Ucinet 6.0 software (Table 6). From the degree centrality, the individual degree centrality of eight provinces, including Hebei, Shandong, Anhui, Henan, Beijing, Hubei, Shanghai, and Guangdong, are at the top, indicating that these provinces are closer to the center in the spatial correlation network and have more influence on other provinces. The reasons for this are that the above-mentioned provinces are in the economically developed eastern and central-eastern regions of China, with mature development of logistics industry, convenient transportation network, high efficiency of carbon emission in logistics industry, and good circulation channels for capital, transportation and low-carbon logistics products, so they can play an important role in influencing the development of low-carbon logistics in the surrounding provinces. The number of point-in is much larger than point-out in Hebei, Anhui, Shandong, Henan, and Beijing, indicating that the above provinces have obvious “siphon effect” and can absorb a large amount of low-carbon logistics development resources, which is an obvious net gain in the spatially related network. In contrast, Shanxi, Tianjin, Zhejiang, Jilin, Liaoning, Shaanxi, Sichuan and Fujian provinces have lower individual degree centrality and have little influence on other provinces, and are located at the edge of the spatially linked network. The reason is that most of these provinces are located in the northeast and western regions of China, with relatively remote geographic location and backward logistics industry infrastructure, so it is necessary to increase the development of low-carbon logistics in these regions and enhance the closeness of association with other provinces.
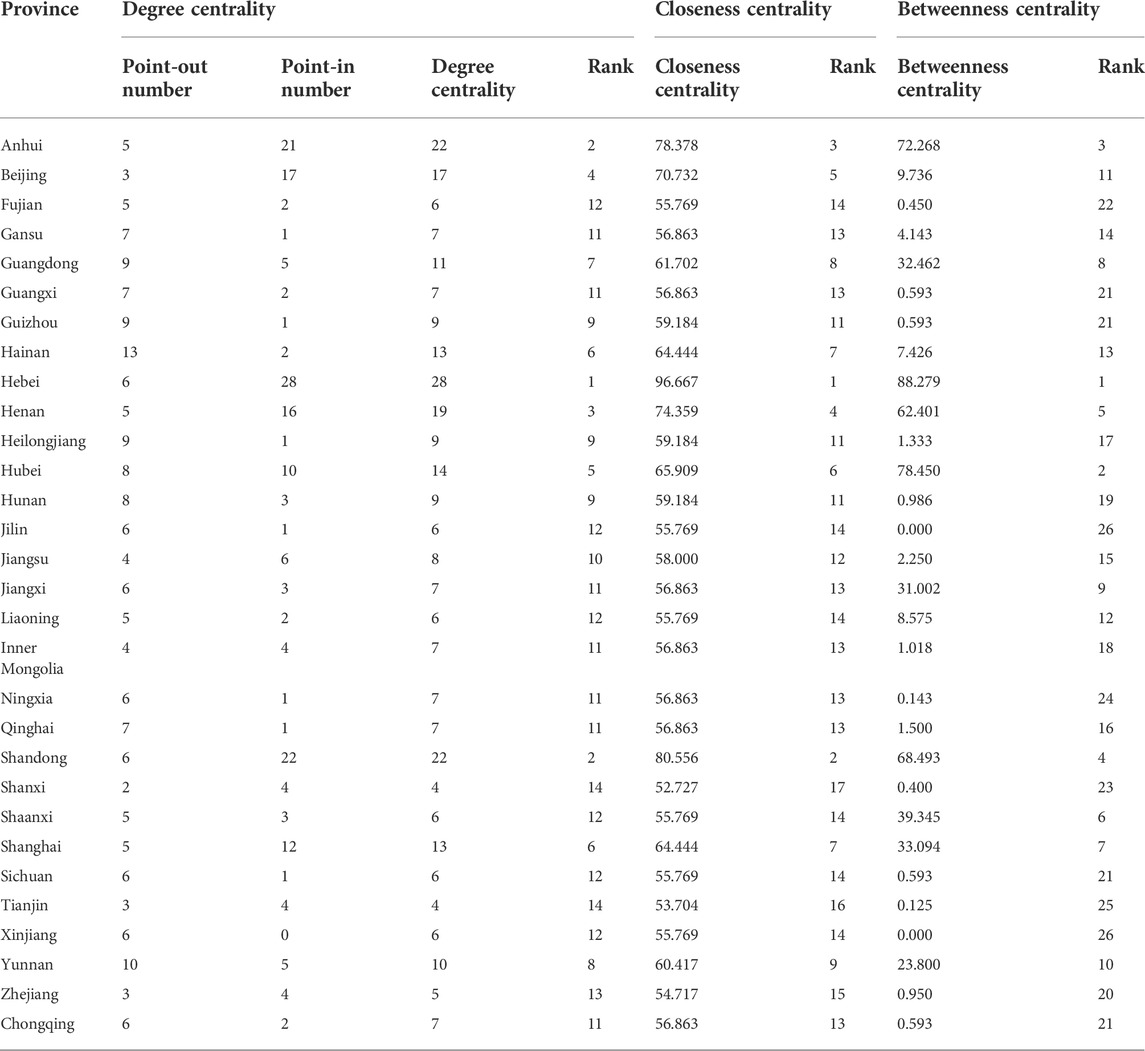
TABLE 6. Individual characteristic indicators of the spatially linked network of carbon emission efficiency in China’s logistics industry in 2019.
In terms of closeness centrality, the individual closeness centrality of Hebei, Shandong, Anhui, Henan, Beijing, Hubei, Shanghai, and Guangdong are among the top eight provinces, indicating that these provinces play the role of “central actor” in the spatial association network and are easily associated with other provinces. The change of carbon emission efficiency of logistics industry in these provinces can significantly affect the carbon emission efficiency of logistics industry in other provinces. The individual closeness centrality of Shanxi, Tianjin, Zhejiang, Xinjiang, Sichuan, Shaanxi, Liaoning, Jilin and Fujian provinces is low, indicating that these provinces are in the position of “marginal actors” in the spatial association network, and are less likely to be spatially associated with other provinces, and are hardly driven by other provinces.
In terms of betweenness centrality, there is a wide range of betweenness centrality among the 30 Chinese provinces. Nine provinces, including Hebei, Hubei, Anhui, Shandong, Henan, Shaanxi, Shanghai, Guangdong, Jiangxi, and Yunnan, have the highest individual betweenness centrality, which indicates that these provinces have strong control and dominance over the technology, capital, information, and other factors required for the development of low-carbon logistics, and play the role of “bridge” and “intermediary” in the spatial linkage network. They play the role of “bridge” and “intermediary” in the spatial linkage network, and have a stronger control and regulation role on the carbon emission efficiency of logistics industry in other provinces. The individual betweenness centrality of Xinjiang, Jilin, Tianjin, Ningxia, Shanxi, Fujian, Guangxi, Guizhou, Sichuan and Chongqing provinces is low, indicating that these provinces are not well connected with other provinces in spatial relations, and their own influence is weak, so it is difficult to regulate and control the carbon emission efficiency of logistics industry in other provinces.
The spatial correlation network of carbon emission efficiency in China’s logistics industry in 2019 was divided into four plates using the CONCOR method of Ucinet 6.0 software (Table 7). As can be seen from Table 7, the total number of spatial association network in 2019 is 184, and the number of relationships between plates is 153, and the spatial spillover effect between plates is obvious. Plate I contains six provinces, including Anhui, Beijing and Hebei, and the expected internal relationship ratio of the plate is smaller than the actual internal relationship ratio, and the number of incoming relationships is much larger than the number of outgoing relationships, which is classified as a net beneficiary plate; plate II contains five provinces, including Hubei, Fujian and Jiangsu, and the expected internal relationship ratio of the plate is higher than the actual internal relationship ratio, and the number of incoming and outgoing relationships is close, acting as The proportion of expected internal relations is higher than the proportion of actual internal relations, and the number of incoming and outgoing relations is close to each other, acting as a “link” in the spatial association network, classified as a broker plate; plate Ⅲ includes 10 provinces such as Jiangxi, Guangxi and Sichuan, and the proportion of expected internal relations is higher than the proportion of actual internal relations. Spillover plate; plate IV includes nine provinces such as Gansu, Qinghai and Shaanxi, mainly in the western region provinces, the expected internal relationship ratio of the plate is greater than the actual internal relationship ratio, the number of incoming relationships is 14, the number of outgoing relationships is 53, and the gap between the number of incoming and outgoing relationships is the largest, classified as a net spillover plate.
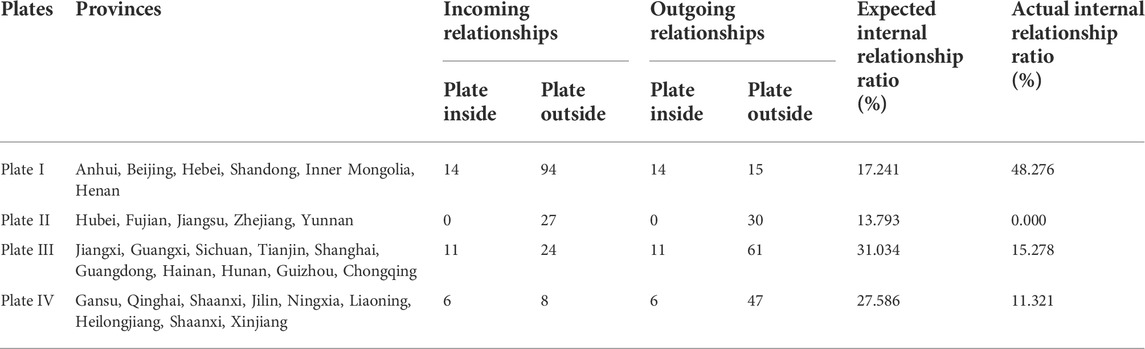
TABLE 7. Spatially related segmentation of carbon emission efficiency in China’s logistics industry.
In order to further analyze the spatial correlation between carbon emission efficiency of logistics industry in different plates, the plate density matrix was calculated using Ucinet 6.0 software. The total density of the spatial correlation network of carbon emission efficiency of China’s logistics industry in 2019 was measured above as 0.212, and the density matrix with inter-plate density greater than 0.212 was recorded as 1, otherwise it was recorded as 0, which led to the image matrix (Table 8). From Table 8, we can see that Plate I, where Anhui and Beijing are located, receives spatial overflow from the remaining three plates and is the beneficiary of the correlation network; there is a two-way overflow relationship between Plate II, where Hubei and Fujian are located, and Plate III, where Jiangxi and Guangxi are located, with frequent spatial interaction. Plate IV, where Gansu and Qinghai are located, has less interaction with Plate II and Plate III, except for the spillover relationship to Plate I.
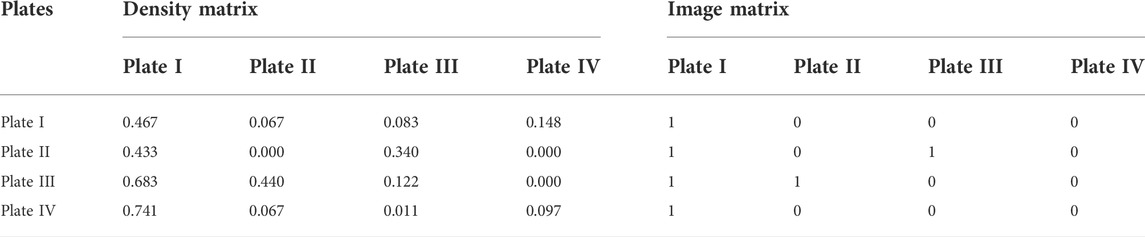
TABLE 8. Density matrix and like matrix of spatially correlated panels of carbon emission efficiency in China’s logistics industry.
A QAP regression analysis with 10,000 random permutations was performed on the spatially correlated binary matrix of carbon emission efficiency of China’s logistics industry and the matrix of influencing factors (Table 9). As can be seen from Table 9, spatial adjacency, logistics development level, and logistics energy utilization rate are significant at the 1% level; logistics environmental protection level is significant at the 10% level, and the regression coefficients are all positive, indicating that the closer the geographical distance between provinces, the easier it is to generate spatial association; the greater the variability of logistics development level, logistics energy utilization rate, and logistics environmental protection level between provinces, the more beneficial the spatial association network spillover The greater the difference in the level of inter-provincial logistics development, logistics energy utilization, and logistics environmental protection, the more beneficial the spatial correlation network spillover. The reason is that the closer the spatial distance between provinces, the easier it is for the technology and capital required for low-carbon logistics to circulate and be allocated between provinces, and the stronger the correlation between the carbon emission efficiency of logistics industry between provinces. When there is a difference in the development level of logistics industry, the larger the logistics industry development province will provide the surrounding provinces with the technology and resources required for the development of logistics industry, the greater the possibility of these logistics resources circulating between provinces, which can strengthen the spatial correlation of carbon emission efficiency of logistics industry between provinces. When there are differences in logistics energy utilization rates, provinces with high logistics energy utilization rates have high integrated turnover per unit of energy consumption, and their low-carbon logistics development levels are high. The exchange of low-carbon logistics technologies and resources between provinces with differences in logistics energy utilization rates is more frequent, thus promoting the spatial correlation of carbon emission efficiency in the logistics industry between provinces. When there is a difference in the level of environmental protection in logistics industry, it indicates that the environmental supervision ability of logistics industry varies between provinces, and the province with strong environmental supervision ability will inevitably transfer part of the carbon emission of logistics industry to the province with weak supervision ability, thus, the linkage of carbon emission efficiency of logistics industry between provinces is closer.
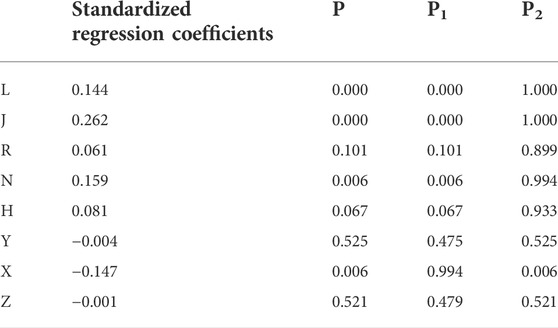
TABLE 9. Regression analysis of the factors influencing the spatial correlation of carbon emission efficiency in China’s logistics industry.
The level of logistics informatization is significant at the 1% level, and the regression coefficients are all negative, indicating that similar levels of logistics informatization between provinces can improve regional correlation and help establish regional association. The reason is that the transfer of technology, capital and resources required for the development of low-carbon logistics needs to be based on the information industry as a prerequisite, and the more similar the level of logistics informatization is, the more favorable it is to the transfer of low-carbon logistics resources, which also enhances the spatial correlation of carbon emission efficiency of logistics industry between provinces.
On the premise of steadily improving the carbon emission efficiency of the logistics industry in the eastern region, we should increase the logistics infrastructure construction, information technology investment and support of low-carbon logistics resources in the western and northeastern regions, so as to realize cross-regional and multi-provincial joint synergistic emission reduction. 2) Bring into play the leading and driving role of eastern provinces such as Hebei, Shanghai and Guangdong in the spatial correlation network of carbon emission efficiency of logistics industry, strengthen the circulation and transfer of resources, technology and capital required for low-carbon logistics to western and northeastern provinces such as Xinjiang, Jilin and Guizhou, break through the existing regional factor circulation barriers, enhance their spatial correlation with northeastern and western provinces, and realize low-carbon logistics among provinces. The balanced development of low-carbon logistics among provinces. 3) Each province should continuously improve its own economic development level, increase environmental protection efforts in logistics industry, improve energy utilization rate, enhance its own information development level, strive to narrow the gap between itself and provinces with high carbon emission efficiency in logistics industry, and increase the possibility of establishing spatial linkages between itself and other provinces.
This paper uses the EBM model to measure the carbon emission efficiency of the logistics industry in 30 provinces of China from 2010 to 2019, uses the ARCGIS visualization analysis to reveal its spatio-temporal evolution characteristics, introduces the modified gravity model and social network analysis to analyze the structural characteristics of the overall, individual and cluster networks of the carbon emission efficiency of the logistics industry in China, and uses the QAP analysis to analyze the spatial association network formation The following conclusions were obtained.
(1) From 2010 to 2019, the overall national average logistics industry carbon emission efficiency increased. The low-carbon development of the logistics industry has achieved some results. However, the imbalance between the carbon emission efficiency of the logistics industry in 30 provinces still exists, and overall the national logistics industry carbon emission efficiency was shown as follows: eastern region > central region > northeastern region > western region. Although the carbon emission efficiency of the logistics industry has improved, most provinces in China are still in the middle and low carbon emission efficiency zone, and there is more room to improve the carbon emission efficiency of the logistics industry.
(2) The carbon emission efficiency of logistics industry in 30 provinces of China has formed a stable spatial correlation network, and there is an obvious spatial spillover relationship. However, the structure of the spatial association network is loose, the number of network relationships needs to be further improved, and the status of each province in the spatial association network is obviously different.
(3) In the spatial correlation network of carbon emission efficiency in China’s logistics industry, eastern provinces such as Hebei, Shanghai and Guangdong have higher values of individual characteristics indicators and are core participants in the spatial correlation network. The northeastern and western provinces such as Xinjiang, Jilin and Guizhou have lower values of individual characteristics indicators and are marginal in the spatial correlation network, which are dominated by other provinces.
(4) Anhui and Beijing provinces are net beneficiaries in the spatial correlation network of carbon emission efficiency of logistics industry; Hubei and Fujian provinces act as “bridge” and “link” and are brokers; Jiangxi and Guangxi provinces are two-way spillover; Gansu and Qinghai provinces are net spillover. Western provinces are net spillover segments.
(5) Spatial adjacency, logistics development level, logistics energy utilization rate, logistics informatization level, and logistics environmental protection level significantly affect the formation of the spatial correlation network of carbon emission efficiency in China’s logistics industry. The reduction of inter-provincial geospatial distance, the greater the difference of logistics development level, logistics energy utilization rate and logistics environmental protection level, the more favorable the formation of spatial correlation network; the higher the similarity of inter-provincial logistics informationization level, the more favorable the formation of spatial correlation network.
Although this paper analyzes the spatial and temporal evolution of carbon emission efficiency in China’s logistics industry and the spatial correlation network structure, which provides a new idea for the study of carbon emission efficiency in the logistics industry, there are still some limitations. On the one hand, this paper only considers the carbon emissions from the energy consumption of the logistics industry, but does not consider the whole life cycle of the logistics industry, identify different carbon sources, carbon emissions, and carbon efficiency for different periods, stages, and regions. On the other hand, this paper only considers the spatial correlation of carbon emission efficiency of logistics industry in 30 provinces of China, but for important economic zones, such as the Yangtze River Delta, Pearl River Delta, Beijing-tianjin-hebei and smaller units of city and county level, it is necessary to study the relationship between the carbon emission efficiency of the logistics industry, which is helpful to analyze the spatial relationship of the carbon emission efficiency of the logistics industry and to formulate the regional coordinated emission reduction strategy.
The original contributions presented in the study are included in the article/supplementary material, further inquiries can be directed to the corresponding author.
YT conceived the research methodology and ideas of the whole paper. ZY participated in the collection of data of the research related to logistics industry in 30 provinces. JY, XL, and XC carried out the calculation of carbon emission efficiency of logistics industry in 30 provinces and the analysis of the results of the spatial correlation network research. All the authors participated in the preparation of this paper together.
The authors declare that the research was conducted in the absence of any commercial or financial relationships that could be construed as a potential conflict of interest.
All claims expressed in this article are solely those of the authors and do not necessarily represent those of their affiliated organizations, or those of the publisher, the editors and the reviewers. Any product that may be evaluated in this article, or claim that may be made by its manufacturer, is not guaranteed or endorsed by the publisher.
Cao, B. Y., and Deng, L. J. (2019). Factors influencing the efficiency growth of logistics industry in Yangtze River Economic Zone. Econ. Geogr. 39 (07), 148–157.
Chen, H., Su, H., and Wei, J. J. (2019). Unbalanced development trend and coordinated development path of China's logistics industry. Quantitative Econ. Tech. Econ. Res. 36 (07), 81–98.
Chen, W. X., and Pan, Y. (2016). Spatial divergence and spatial-temporal evolution of total factor productivity of logistics industry under low carbon constraint. Ind. Technol. Econ. 35 (11), 42–52.
Cheng, H., Xu, Q., and Zhao, M. Y. (2020). Study on the structure of spatially linked network and its influencing factors of tourism eco-efficiency in China. Ecol. Sci. 39 (05), 169–178.
Doreian, P., and Conti, N. (2012). Social context, spatial structure and social network structure. Soc. Netw. 34 (1), 32–46. doi:10.1016/j.socnet.2010.09.002
Du, H. (2022). Diversified paths to improve the efficiency of China's logistics industry under the goal of "double carbon. Bus. Econ. Res. 2022 (04), 110–113.
He, J. S., Wang, J. F., and Xu, L. (2021). Research on green logistics efficiency and influencing factors of China's three major bay area city clusters under carbon emission constraints. Railw. Transp. Econ. 43 (08), 30–36.
He, Y. Q., Lan, X., Zhou, Z., and Wang, F. (2020). Analyzing the spatial network structure of agricultural greenhouse gases in China. Environ. Sci. Pollut. Res. 28, 1729. doi:10.1007/s11356-020-10945-3
Hou, Y. W., and Zhu, C. F. (2019). A study on the efficiency of logistics industry in five provinces in northwest China along the Silk Road Economic Belt under carbon emission constraints. Transp. Res. 5 (01), 24–31.
Huo, T. F., Cao, R. J., Xi, N. N., Hu, X., Cai, W., and Liu, B. (2022). Spatial correlation network structure of China’s building carbon emissions and its driving factors: A social network analysis method. J. Environ. Manag. 320, 115808. doi:10.1016/j.jenvman.2022.115808
IPCC (2006). IPCC guidelines for national greenhouse gas inventories. Geneva, Switzerland: IPCC. [2013-04-28].
Jiang, X. H., Ma, J. X., Zhu, H. Z., Guo, X., and Huang, Z. (2020). Evaluating the carbon emissions efficiency of the logistics industry based on a super-SBM model and the malmquist index from a strong transportation strategy perspective in China. Int. J. Environ. Res. Public Health 17, 8459. doi:10.3390/ijerph17228459
Li, H., and Li, W. (2019). Evaluation and dynamic evolution analysis of carbon emission efficiency of logistics industry: An example of provinces and regions along the "Silk Road Economic Belt. Environ. Sci. Technol. 42 (03), 165–171.
Li, J., Bai, Z. Y., and Li, B. T. (2022). Research on decoupling and influencing factors of carbon emissions of Beijing Tianjin Hebei logistics industry under the background of double carbon. Urban issues. 2022 (05), 69.
Li, L. L., Han, R. L., and Zhang, X. Y. (2022). Analysis of spatial and temporal evolution characteristics of aviation carbon emissions and their efficiency in China. J. Ecol. 42 (10), 3919–3932.
Liang, H. Y. (2019). Spatial network structure of logistics industry development in five major urban clusters in China and its operational effects. China circ. Econ. 33 (03), 50–61.
Liu, C. L., and Guan, M. M. (2017). Spatial evolution and influencing factors of logistics industry efficiency in China under low carbon constraint. Geoscience 37 (12), 1805–1814.
Liu, H. J., Guo, L. X., Qiao, L. C., and Shi, Y. (2021). Spatial and temporal patterns and dynamic evolution of the efficiency of China's logistics industry. Quantitative Econ. Tech. Econ. Res. 38 (05), 57–74.
Liu, J., and Song, Q. Y. (2018). Spatial network structure and formation mechanism of green innovation efficiency in China's tourism industry. China Population-Resources Environ. 28 (08), 127–137.
Long, R. Y., Ouyang, H. Z., and Guo, H. Y. (2020). Super-slack-based measuring data envelopment analysis on the spatial-temporal patterns of logistics ecological efficiency using global Malmquist Index model. Environ. Technol. Innovation 18, 100770. doi:10.1016/j.eti.2020.100770
Ma, F., Hu, J. Y., Sun, Q. P., Xu, Y., Shang, Z., and Ke, H. N. (2021). A study on carbon emission performance measurement and drivers of inter-provincial logistics industry in China. Ecol. Econ. 37 (09), 27–39.
Ma, F., Wang, Y. X., Yuen, K. F., Wang, W., Li, X., and Liang, Y. (2019). The evolution of the spatial association effect of carbon emissions in transportation: A social network perspective. Int. J. Environ. Res. Public Health 16 (12), 2154. doi:10.3390/ijerph16122154
Ma, Y. Y., and Wang, W. G. (2013). Analysis of carbon emission characteristics and influencing factors of China's logistics industry based on LMDI decomposition technology. Pract. Underst. Math. 43 (10), 31–42.
Quan, C. G., Cheng, X. J., Yu, S. S., and Ye, X. (2020). Analysis on the influencing factors of carbon emission in China's logistics industry based on LMDI method. Sci. Total Environ. 734, 138473. doi:10.1016/j.scitotenv.2020.138473
Ren, Y. F., Fang, C. L., and Li, G. D. (2020). Spatiotemporal characteristics and influential factors of eco-efficiency in Chinese prefecture-level cities: A spatial panel econometric analysis. J. Clean. Prod. 260, 120787. doi:10.1016/j.jclepro.2020.120787
Rong, T., Zhang, P., Zhu, H., Jiang, L., Li, Y., and Liu, Z. (2022). Spatial correlation evolutionand prediction scenario of land use carbon emissions in China. Ecol. Inf. 71, 101802. doi:10.1016/j.ecoinf.2022.101802
Shang, J., Ji, X. Q., Shi, R., and Zhu, M. R. (2022). Study on the structure and drivers of spatially linked network of agricultural carbon emission efficiency in China. Chin. J. Ecol. Agric. (in English and Chinese) 30 (04), 543–557.
Shao, H. Q., and Wang, Z. F. (2021). Spatial correlation network structure of transportation carbon emission efficiency in China and its influencing factors. China Population-Resources and Environment 31 (04), 32–41.
Sheng, P., Li, J., Zhai, M., and Majeed, M. U. (2021). Economic growth efficiency and carbon reduction efficiency in China: Coupling or decoupling. Energy Reports 7, 289–299. doi:10.1016/j.egyr.2020.12.043
Song, J. Z., Feng, Q., Wang, X. P., Fu, H., Jiang, W., and Chen, B. (2019). Spatial association and effect evaluation of CO2 emission in the Chengdu-Chongqing urban agglomeration: Quantitative evidence from social network analysis. Sustainability 11 (1). doi:10.3390/su11010001
Sun, Y. N., Liu, H. J., Liu, C. M., and Cui, R. (2016). Research on the spatial correlation and effects of inter-provincial carbon emissions in China—based on the experience of SNA. Shanghai Economic Research 2016 (02), 82–92.
Sun, Z. R., Fan, J., Sun, Y., and Liu, H. C. (2022). Structural characteristics and influencing factors of spatially linked network of green science and technology innovation efficiency in China. Economic Geography 42 (03), 33–43.
Tao, X., Xu, Y. Q., and Bao, B. S. (2021). Analysis of regional logistics development characteristics and efficiency--analysis based on carbon emission and LMDI methods. Technology Economics and Management Research 2021 (06), 104–108.
Wang, K., Zhang, S. W., Gan, C., Yang, Y. P., and Liu, H. L. (2019). Spatial correlation of carbon emissions from tourism in China and its influencing factors. Environmental Science Research 32 (06), 938–947.
Wang, K., Zhang, S. W., Gan, C., Yang, Y. P., and Liu, H. L. (2020). Study on the spatial network structure of carbon emission efficiency of Chinese tourism and its effects. Geoscience 40 (03), 344–353.
Wang, L. (2021). Research on logistics carbon emissions under the coupling and coordination scenario of logistics industry and financial industry. PLOS ONE 16 (12), e0261556. doi:10.1371/journal.pone.0261556
Wang, Q. W., Zhou, P., and Zhou, D. Q. (2010). Research on dynamic carbon dioxide emissions performance, regional disparity and affecting factors in China. China Industrial Economics 2010 (1), 45–54.
Wang, W. G., and Ma, Y. Y. (2012). Efficiency of China's regional logistics industry - a Malmquist-luenberger index approach based on a three-stage DEA model. Systems Engineering 30 (03), 66–75.
Wang, X. P., Feng, Q., and Song, J. Z. (2020). Evolution and influencing factors of spatial correlation structure of carbon emissions in Chengdu-Chongqing urban agglomeration. China Environmental Science 40 (09), 4123–4134.
Wang, Y. N., Chen, W., Kang, Y. Q., Li, W., and Guo, F. (2018). Spatial correlation of factors affecting CO2 emission at provincial level in China: A geographically weighted regression approach. J. Clean. Prod. 184, 929–937. doi:10.1016/j.jclepro.2018.03.002
Wei, Y. R., and Chen, S. L. (2021). Spatial correlation of land use carbon emissions and carbon balance zoning in Fujian Province. Journal of Ecology 41 (14), 5814–5824.
Wei, Z. X., He, Y. Y., Liu, G. Q., and Zhou, P. (2020). Spatial network analysis of carbon emissions from the electricity sector in China. Journal of Cleaner Production 262, 121193. doi:10.1016/j.jclepro.2020.121193
Xu, A. X., and Ning, Y. (2020). Correlation analysis of CO2 emission in logistics and other industries of China. IOP Conf. Ser, Earth Environ. Sci. 474, 052061. doi:10.1088/1755-1315/474/5/052061
Xu, G. Y., Zhao, T., and Wang, R. (2022). Decomposition and decoupling analysis of factors affecting carbon emissions in China’s regional logistics industry. Sustainability 14, 6061. doi:10.3390/su14106061
Xu, W. G. (2021). Study on carbon emission efficiency measurement in logistics industry of China under low-carbon. Jiangsu: Jiangnan University.
Xu, Y. Q., Cheng, Y., Wang, J. J., and Liu, N. (2022). Spatio-temporal evolution and influencing factors of carbon emission efficiency in low carbon city of China. Journal of Natural Resources 37 (05), 1261–1276. doi:10.31497/zrzyxb.20220511
Yin, Q. M., and Zhu, K. N. (2020). Analysis of spatial and temporal differences in industrial water use efficiency and influencing factors in the Yangtze River Economic Zone based on EBM model. China Environmental Management 12 (06), 103–109.
Yu, Z. Q., Chen, L. Q., Tong, H. X., Zhang, T., Li, L., and Yuan, L. N. (2022). Spatial correlations of land-use carbon emissions in the Yangtze River Delta region: A perspective from social network analysis. Ecological Indicators 142, 109147. doi:10.1016/j.ecolind.2022.109147
Zhang, J., and Cai, J. F. (2014). Measurement and decomposition of regional differences in carbon emissions of China's logistics industry. China Circulation Economy 28 (08), 25–30.
Zhang, L. G. (2016). Analysis on driving factors of carbon dioxide emission change in China's logistics industry. China Circulation Economy 30 (12), 29–39.
Zhang, R. J., Tai, H. W., Cheng, K. T., Cao, Z., Dong, H., and Hou, J. (2022). Analysis on evolution characteristics and dynamic mechanism of urban green innovation network: A case study of Yangtze River economic belt. Sustainability 14 (1), 297. doi:10.3390/su14010297
Zhang, R. J., Tai, H. W., Cheng, K. T., Zhu, Y., and Hou, J. (2022). Carbon emission efficiency network formation mechanism and spatial correlation complexity analysis: Taking the Yangtze River Economic Belt as an example. Science of the Total Environment 841, 156719. doi:10.1016/j.scitotenv.2022.156719
Zhao, L., Gao, X. T., Liu, Y. X., and Han, Z. L. (2021). Characterization of the evolution of the spatial correlation network structure of inclusive green efficiency in China. Economic Geography 41 (09), 69–90.
Zhao, S. L., and Yang, Z. Y. (2019). Research on carbon emission measurement and low carbon coordinated development mechanism of logistics industry in Beijing, Tianjin and Hebei. Ecological Economy 35 (10), 42–44.
Zheng, H., and Ye, A. Z. (2022). Emission reduction effects of spatially linked network structural features: Based on urban cluster perspective. Environmental Science 2022, 1–9.
Zheng, H., and Ye, A. Z. (2022). Spatial correlation network structure of carbon emissions in urban agglomerations and its influencing factors. China Environmental Science 42 (05), 2413–2422.
Zheng, J. E., Guan, G. F., and Du, H. W. (2020). Research on the efficiency difference of provincial logistics industry in the Yangtze River economic belt. Statistics and decision making 36 (11), 110–113.
Keywords: carbon emission efficiency of logistics industry, social network analysis, spatially linked network, low carbon logistics, QAP
Citation: Tang Y, Yang Z, Yao J, Li X and Chen X (2022) Carbon emission efficiency and spatially linked network structure of China’s logistics industry. Front. Environ. Sci. 10:1004463. doi: 10.3389/fenvs.2022.1004463
Received: 27 July 2022; Accepted: 05 October 2022;
Published: 17 October 2022.
Edited by:
Yi Liu, Tsinghua University, ChinaCopyright © 2022 Tang, Yang, Yao, Li and Chen. This is an open-access article distributed under the terms of the Creative Commons Attribution License (CC BY). The use, distribution or reproduction in other forums is permitted, provided the original author(s) and the copyright owner(s) are credited and that the original publication in this journal is cited, in accordance with accepted academic practice. No use, distribution or reproduction is permitted which does not comply with these terms.
*Correspondence: Zhishan Yang, eXpzMTI3QDEyNi5jb20=
Disclaimer: All claims expressed in this article are solely those of the authors and do not necessarily represent those of their affiliated organizations, or those of the publisher, the editors and the reviewers. Any product that may be evaluated in this article or claim that may be made by its manufacturer is not guaranteed or endorsed by the publisher.
Research integrity at Frontiers
Learn more about the work of our research integrity team to safeguard the quality of each article we publish.