 Tingyi Liu
 Jie Li2
 Dongju Li
- 1School of Economics and Management, Wuhan University, Wuhan, China
- 2School of Statistics and Big Data, Henan University of Economics and Law, Zhengzhou, China
- 3School of Economics, Henan University, Kaifeng, China
Natural hazards are a common challenge to human survival and development. China is a country, that is, prone to natural hazards because of its vast territory and vast area. In fact, China is one of the countries most affected by natural hazards. The impact of natural hazards is often multidimensional, and the occurrence of natural hazards can have a dramatic impact on government finances and household property structures. However, existing research in China has mainly focused on individual factors and the household level, and there are gaps in the impact of natural hazards on the economic status of households. Based on the China Household Finance Survey-2019 (CHFS) data, this paper investigates the impact of natural hazards on household financial asset allocation using the Probit and Tobit models and the propensity score matching method. It is found that: the occurrence of natural hazards significantly reduces the likelihood of households’ investment in stocks and risky assets; older, more economically advanced, and better educated household heads are more willing to make risky investments; and households with lower financial literacy are more affected by natural hazards in terms of investment in risky financial assets than those with high financial literacy. Therefore, it is necessary for the government to do pre-disaster prevention and post-disaster reconstruction, and further improve the social security mechanism and optimize the risk management system, so that more households can participate in the financial market and thus obtain higher investment returns.
1 Introduction
Natural hazards refer to abnormal phenomena occurring in nature, including various meteorological and geological hazards, such as earthquakes, floods, typhoons, etc. Natural hazards have a significant impact on human society, and they have become one of the most worrisome global problems as the frequency and severity of natural hazards have increased globally. They result in human casualties, economic losses, and environmental damage (Chen et al., 2020). Due to global climate change and its unique geography, China is affected by major natural hazards. Recently, frequent natural hazards have affected China’s production, 2021 natural hazards have caused 107 million victims, 162,000 houses collapsed, 11,739,000 ha of crops affected, and direct economic losses of 334.02 billion yuan.
Existing studies on natural hazards have focused on a single type of hazard. The research mainly includes the causes and spatial and temporal evolution of natural hazards, risk assessment and avoidance, and impact factors and response analysis (Lohmann et al., 2019; Palanca-Tan, 2020). Researchers have conducted relatively in-depth and systematic studies on the impact of natural hazards mainly from various aspects such as economic, agricultural, industrial, and income disparities. However, empirical studies on the impact of natural hazards on household financial asset allocation are scarce. Household financial asset allocation is an important reflection of household property allocation, and the impact of hazards can be measured from an economic perspective.
Therefore, it is essential to understand the impact factors of natural hazards in China, which has witnessed frequent natural hazards. What happens to the economic structure of households when natural hazards hit society and the economy? What precautions do residents take as a family unit? This study aims to investigate whether the occurrence of natural hazards has an impact on household financial allocation in the context of frequent natural hazards. Based on CHFS2019 data, the difference between Chinese households’ investment in stocks and risky assets is analyzed. Then, the impact of natural hazards on household financial asset allocation is quantified through various empirical methods based on the idea of quasi-natural experiments. This study not only provides an empirical analysis of the current situation of household financial asset allocation in the Chinese region, but also provides valuable references for decision-making on disaster prevention and promoting financial development.
2 Literature review
2.1 Household characteristics and financial asset allocation
Chinese residents generally have a strong sense of family values, and as economic and social development continues apace, households are moving beyond a “state of scarcity”. In particular, the rapid development of financial markets and the increasing abundance of financial products since the reform and opening up have led to a dramatic change in the asset structure of Chinese households, making household asset choice an important issue that affects the welfare of household members and society as a whole (Qiao and Su, 2019).
Household finance is a relatively late start in the field of financial research. Based on a review of the relevant literature, it is found that political background (Ge et al., 2021), household age characteristics (Bertaut and Haliassos et al., 1997), health level of household members (Berkowitz and Qiu, 2006), marital status (Wang and Wu, 2014), educational attainment (Calvet and Sodini, 2014), credit constraints (Yin et al., 2015), urban and rural health insurance (Li and Yang, 2021), financial literacy (Hu et al., 2018; Li, 2021), and art collection (Zhang and Hong, 2017) all influence household financial asset. In addition to this, household economic characteristics have an impact on household risky investments. Household wealth has a significant positive effect on household risky asset investment (Liu, 2015; He and Shilu, 2019), and personally owned capital also affects household risky asset investment (Shum and Faig, 2006). The asset allocation referred to in this study will be based on the amount of financial assets available to households. The asset allocation in this study will be based on the household unit, i.e., the behavior of households in adjusting the type and proportion of assets held according to the market environment and their own status. Due to the dynamic nature of household assets, each household will allocate its assets based on the objectives of safety, profitability and liquidity. The rational allocation of household financial assets is of great significance to the accumulation of wealth and the development and innovation of financial markets.
2.2 Risk assets investment and nature hazards
Under the premise of “rational economic man”, households will participate in a variety of asset investments and allocate their assets according to investors’ risk preferences. The core objective of household financial asset allocation is to optimize asset allocation by choosing different investment portfolios, thereby continuously increasing household income and consumption (Markowitz H., 1952). The structure of household financial assets has gradually shifted from being confined mainly to cash and savings before the reform and opening up 40 years ago, to a combination of assets such as stocks, financial products and commercial insurance. Financial assets can be divided into non-risky financial assets and risk assets according to their riskiness (among them, bank deposits and cash can be regarded as non-risky financial assets, while stock and funds held by households can be regarded as risk assets).
The development and evolution of financial investment instruments has led to an increasing variety of financial investment channels for households, which in turn has led to a significant change in the structure of household wealth, with financial assets accounting for a significantly higher proportion of household assets (Yilmazer and Lich, 2015). Moreover, the risky financial assets held by households are growing rapidly, and the financial asset choices made by households will have a significant impact on their future living standards (Zhang, 2020). A large number of real-life experiences from abroad show that a reasonable allocation of household financial assets plays a very important role in increasing the income of households and the wealth of residents, and that differential household financial asset allocation choices are also an important cause of income disparity (Tsoumas and Antzoulators, 2010). The current situation in China shows that the allocation of household financial assets is not reasonable.
The economic consequences of nature hazards have been a hot and difficult issue of concern to all sectors of society, but existing studies have focused on the macroeconomic and personal impacts of nature hazards. However, most of the existing studies have focused on the macro level of the impact of disasters, while the impact of disasters on the micro level of the economy has not been given due attention. The economic characteristics of households, particularly their wealth levels, influence the allocation of financial assets to households (Wachter and Yogo, 2010). In the face of nature hazards, households reduce the impact by, for example, reducing consumption (Eny Sulistyaningrum, 2015; B. N. Porfiriev, 2016). At present, most domestic and international studies on the structure and choice of household asset allocation mainly analyze the impact of household characteristics or financial literacy on household asset allocation, but there is no research from the perspective of nature hazards shocks (Paul, 2015; Huang and Lu, 2021).
2.3 Risk appetite and economic decision making
Attitudes are an important aspect in determining behavior. In general, domestic and international scholars have conducted studies related to household financial asset allocation from various perspectives, such as household characteristics and wealth levels, pointing out the results of these influences, but the conclusions obtained differ due to differences in data, and research subjects. Past literature suggests that catastrophe experiences affect individual risk attitudes and that the impact of a disaster on an individual may affect their risk expectations, i.e., individuals who have experienced a disaster have an increased level of expected risk for possible future disasters (Gallagher, 2014; Brown et al., 2018). According to the “precautionary savings theory”, risk expectations of hazards also have an impact on households’ precautionary savings, i.e., the higher the expected risk, the higher the households’ precautionary savings tend to be. A study of natural disasters in 15 developed countries found a significant positive relationship between disaster experience and saving rate (Skidmore, 2001), but it has also been shown that the effect of disaster experience on saving rate depends not only on risk expectations but also on the type of risk preferences of consumers (Gunning et al., 2010).
In the present study, it is assumed that individuals who have experienced natural disasters will have very different financial risk intentions, using CHFS2019 data, We focus on the current state of household asset allocation in China’s national context and explore the mechanism of nature hazards on household financial asset allocation using the Probit model, Tobit model, and PSM model. The findings of this paper help to further understand the mechanism of the formation of households’ financial investment risk preferences, and provide some insights into the value of increasing households’ participation in the financial market and guiding them to allocate their financial assets rationally, with a view to providing a new perspective on the impact of nature hazards on financial investment.
The innovation of this paper is that, on the one hand, existing studies on natural disasters tend to focus on the hazards caused by natural disasters, and have not yet studied the changes in household structure economy due to natural disasters by residents as a household unit, which is very important for both individuals and countries, and the changes in household financial asset allocation can, to some extent, measure the severity of disasters in order to make timely and corresponding adjustments to the household asset structure; on the other hand, previous literature on Chinese households’ financial asset allocation has mainly focused on exploring the effects of cultural beliefs, financial literacy, health status, credit levels, and certain collective experiences on asset allocation. In conclusion, there is less literature linking natural hazards to Chinese household financial asset allocation, and this paper will explore the relationship between the two from a new perspective using multiple regression models in order to guide the decision making accordingly.
3 Data
3.1 Data Source
All data selected for this study are from CHFS2019 data. In total, the database collected information on 107,008 household members from 34,643 households, including general demographic characteristics, financial status, assets, income, consumption, employment, insurance, and other household information. Household financial assets can be divided into risk-free financial assets and risky financial assets based on whether or not to take risks. Cash and deposits are risk-free financial assets, and stocks, funds, bonds, wealth management products, gold, foreign currency assets, and financial derivatives are risky financial assets.
In this paper, according to the research purpose, CHFS2019 data is processed as follows: First, the household head samples in the individual variable database are screened out and correspond to the household variable database one-to-one (the individual variable database and the family variable database both contain ID numbers, So here the sample is matched by the ID number in the databa). Second, blank missing samples in terms of dependent and explanatory variables are removed and interpolation is performed for some of the missing values. Thirdly, the group median processing is adopted for the partial range data in the sample, and the logarithmic processing is carried out on the household income data, and the problem of heteroscedasticity and nonlinearity can be solved. Finally, the study obtained a valid sample of 32,465 households across the country, including those affected and not affected by natural hazards.
3.2 Variable definition and descriptive statistics.
3.2.1 Dependent variables
The variables being explained are household investment in equity assets and total risky financial assets. Investment here contains two levels of meaning, namely participation and allocation. Equity asset participation is taken as 1, indicating that the household has invested in equities, and 0 otherwise; a household’s risky asset participation is one if it has invested in any risky assets, and 0 if it has not made any risky investments. The allocation is in terms of the proportion of equity assets in the household’s financial assets and the proportion of risky assets in the household’s financial assets, so that the values of equity assets and risky financial assets range from 0 to 1.
3.2.2 Explanatory variables
The core explanatory variable of this study is whether the respondents and their households have been affected by natural hazards from 2014 to 2019. In the questionnaire, the interviewer determined whether the respondents and their households had been affected by natural hazards through the following questions.“Has your household been affected by a natural hazard since 2014?” If the respondent answered “yes”, a value of one was recorded; otherwise, a value of 0 was recorded.
3.2.3 Control variable
Existing empirical research shows that asset allocation behavior is affected by a variety of factors (Tang and Pan, 2021). Since these factors are mainly focused on the individual level and the household level, the control variables in this study are mainly the personal characteristics and family characteristics of the head of household, including gender, age, education level, health status, marital status, risk preference, etc. The specific variable selection and descriptive statistics are shown in Table 1.
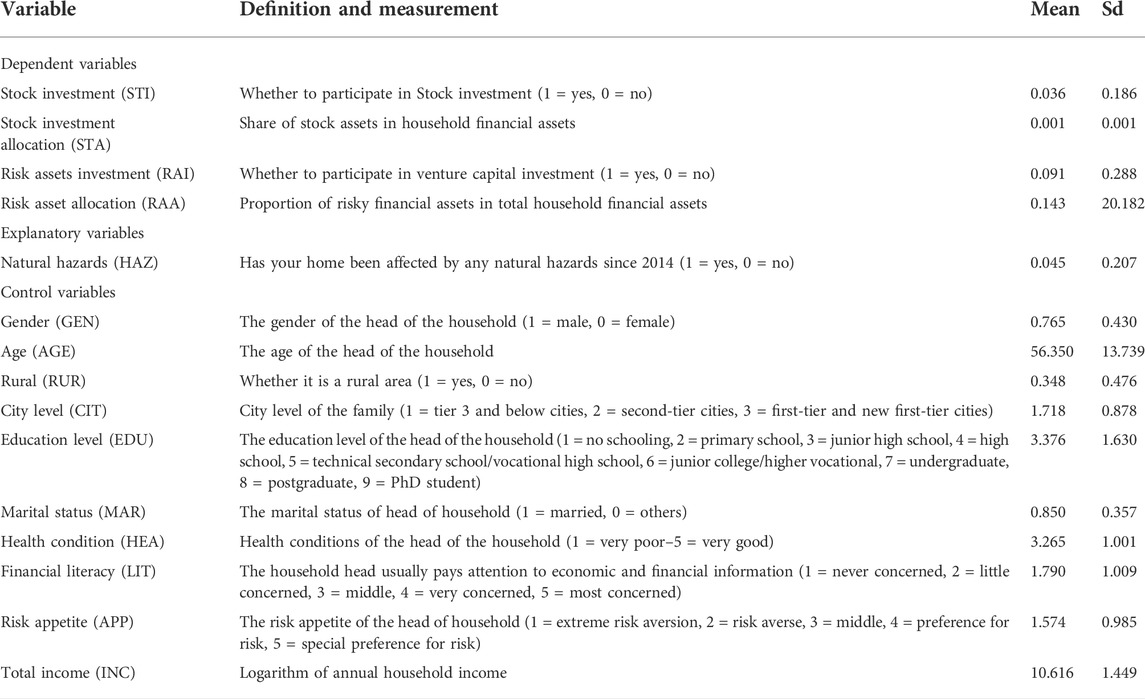
TABLE 1. Description of each variable and descriptive statistics.
3.2.4 Descriptive statistics
As can be seen from Table 1, the participation rates of my country’s household stock assets and risky financial assets are 3.6% and 9.1%, respectively, indicating that households engaged in risky financial asset investment are still a minority in my country, and their asset allocation is relatively unbalanced. In terms of household demographics, households headed by a male account for 76.5% of the total sample, with an average age of 56.35 years; the education level is mostly distributed around 3.376, indicating that the education level of most household heads is at the level of high school or technical secondary school. The degree is generally low; the average value of marital status is 0.850, indicating that 85% are married families. The financial literacy of the head of household is low, and the level of attention to finance is low; the mean value of health water for household heads in the sample is 3.265 and the mean value of risk appetite for household heads is 1.574, indicating that Chinese households as a whole are biased toward risk aversion. In addition, the logarithmic deviation of annual household income in the sample shows that the wealth distribution of Chinese residents is uneven, and the wealth gap is obvious.
4 Methods
To prove whether there are significant relationships between natural hazards and stock assets and risky financial assets, we first use the Probit model to study the participation of stock assets and risky financial assets. The model is set as follows.
where,
Secondly, the Tobit model is used to study the allocation of stock assets and risky financial assets in financial assets. The model is set as follows.
where,
Finally, in order to further strengthen the verification of the impact of natural hazards on household financial asset allocation, we consider eliminating the endogeneity problem that may be caused by sample selection bias and omitted variables, and then adopt the propensity score matching method. PSM is a non-linear estimation method proposed by Rosenbaum and Rubin 1982) that overcomes the problem of selection bias and allows for more effective evaluation of treatment effects. In this study, propensity score matching was conducted using a two-step approach. Households affected by natural hazards were identified as the treatment group
where,
The average treatment effect
where,
5 Results and discussion
5.1 Main regression analysis
The results of regression 1) in Table 2 show that the occurrence of natural hazards reduces the odds of households making stock investments and is significant at the 1% level. Since the coefficient of the Probit model regression result itself has little economic meaning, the analysis also sought the average marginal effect, which is the amount of change in the dependent variable for each unit change in the independent variable. The average marginal effect is calculated to be about −0.0504, indicating that the occurrence of a natural hazard reduces the odds of household stock investment by 5.04%. Corresponding to regression result 2), natural hazards have a disincentive effect on households to invest in financial risk assets, with a mean marginal effect of about −3.45%, which is significant at the 1% level. It can be seen that along with the increase in natural hazards, households tend to invest less in equities or other risky financial instruments.
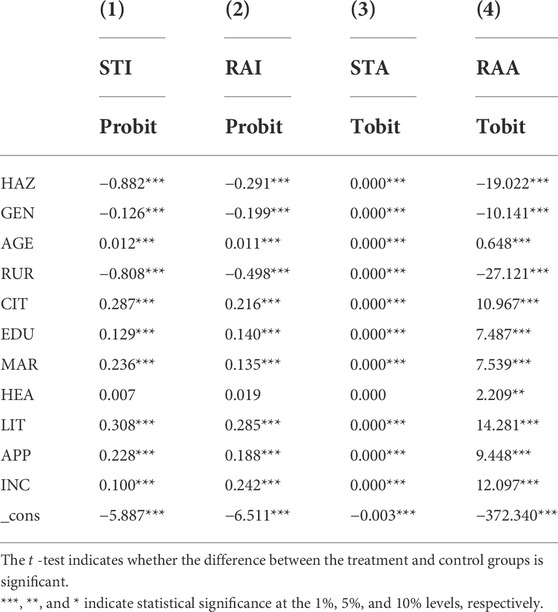
TABLE 2. Regression of the impact of natural hazards on stock investment and risk asset investment participation and allocation.
Regression 3) and regression 4) show the regression results of the effect of natural hazards on the allocation of stock assets and risky financial assets, respectively. The results show that the occurrence of natural hazards is negatively related to households’ risky financial asset allocation, and this effect is significant at the 1% level in both cases. It indicates that the occurrence of natural hazard events reduces the household’s weight in risky financial investments, which is consistent with the results of risky financial assets participation.
In addition, observing the regression results of the control variables shows that the gender of the household head has a significant effect on the investment behavior of the household, as male household heads are more conservative than females and relatively rational in making investment decisions. The increase in the age of the household head effectively promotes the household’s investment in stocks and other risky financial assets, which may be due to the fact that most of the household heads in the sample are approaching their old age, have accumulated more wealth and are not under greater financial pressure. The higher the education level of the household head, the more willing he or she is to engage in riskier investments. Married households are more likely to invest in equities and other risky assets because of their wider sources of household income and more stable family structure than those living alone, and because they are able to bear the corresponding risks. Heads of households with higher financial literacy and more attention to financial information usually use their financial knowledge in a comprehensive manner to allocate their assets rationally to achieve the optimal asset mix, minimize the risk caused by information asymmetry through their own financial knowledge, and increase their investment in high-risk financial assets by virtue of their confidence in their investment philosophy. Investors with a higher degree of risk appetite, who usually have a higher risk tolerance, tend to invest in stocks and other high-risk assets. Households living in urban areas are significantly more likely to make stock and risky investments than rural households; and the higher the urban level, the higher the likelihood of participating in risky financial markets, with both variables significant at the 1% level of significance. The main reason for this status quo is that the level of financial development in cities and towns is relatively developed, the allocation of financial resources is more efficient, and there are more physical outlets of various financial institutions, so residents can easily access investment information and learn about financial products in many ways, while rural areas usually have fewer physical outlets and less convenient access to information; secondly, the higher the urban level, the higher the wealth level of households tends to be, and they have more funds to try risky investments. While rural and below third-tier households will be relatively conservative. At the 1% significance level, households with higher total income are more likely to invest in equities and risky assets, indicating that households with higher wealth levels usually keep more idle funds and can afford to take a certain range of risks. With their standard of living secured, they are more willing to invest part of their idle funds in financial markets to achieve wealth appreciation.
5.2 Heterogeneity analysis of financial literacy levels
The level of financial literacy of household heads is one of the important indicators of household investment decisions. When households invest in risky financial assets, household heads with different levels of financial literacy will exhibit different household investment behaviors under the same natural hazard conditions.
To test the above hypothesis, all households are divided into two groups according to the level of financial literacy of the household head. The first group has relatively low financial literacy, with
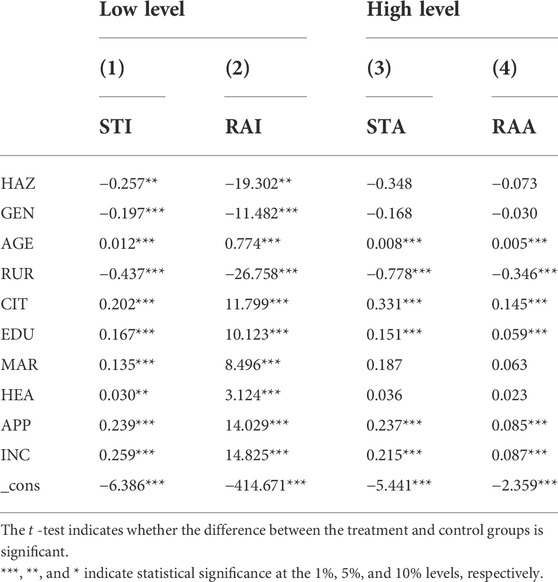
TABLE 3. Heterogeneity analysis of financial literacy levels.
The results show that for the group with lower levels of household financial literacy, natural hazards significantly inhibit households’ participation and allocation of risky financial assets at the 5% level; while for households with higher levels of household financial literacy, natural hazards do not have a significant impact on investment in risky financial assets, and relatively few factors can influence households’ risky investment decisions, this reflects that households with higher levels of financial literacy are more willing to experiment with risky investments and have a certain level of risk tolerance.
5.3 Propensity score matching analysis
The effectiveness of the
The test of balance requires that the treatment and control groups do not differ systematically in terms of matching variables after completion of matching. Rosenbaum (1985) tested for balance before and after matching by standardized deviations. Thus, whether balance passes the test is determined primarily by the change in covariate bias and the change in
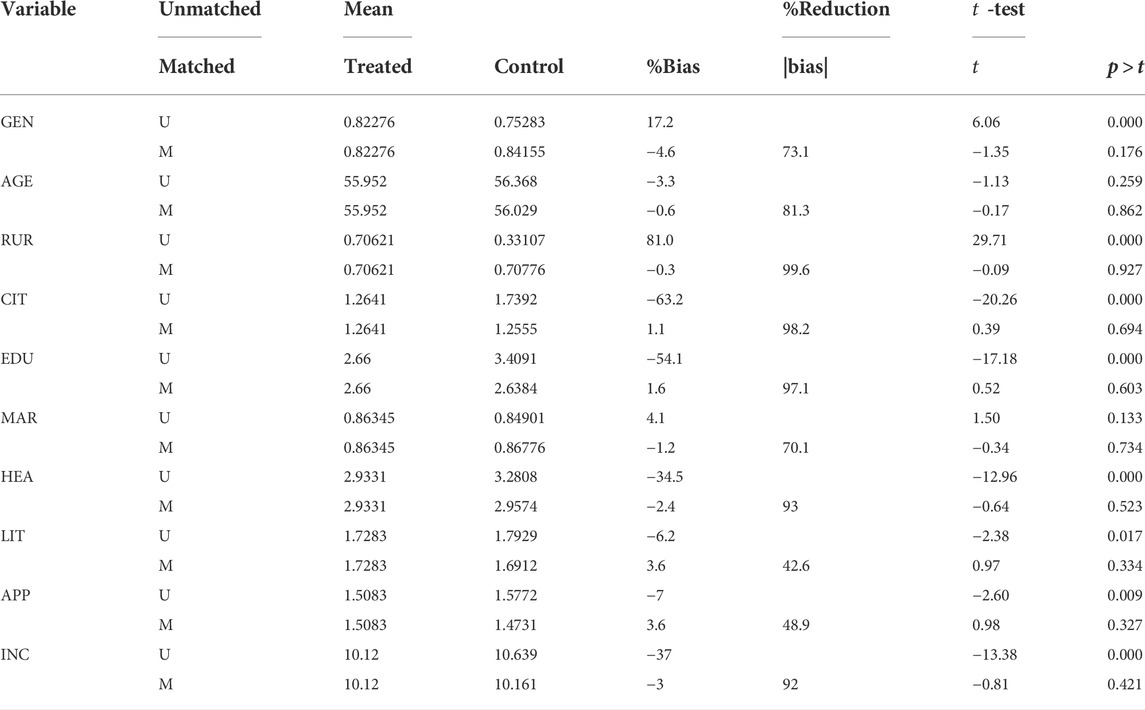
TABLE 4. Balance test results of propensity score matching (PSM).
The kernel density plots for stock investment and risk asset investment are shown in Figure 1, respectively. The kernel density plots show the fitted conditions for the density distribution of P-scores before and after matching between the treatment and control groups. It is clear that there is a significant difference in the
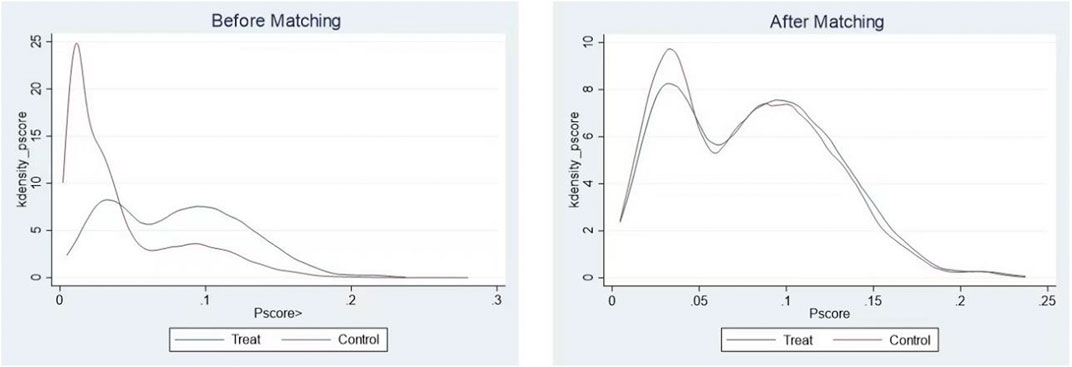
FIGURE 1. Kernel density distributions of natural hazards before and after matching. The blue line represents households that received the specified intervention. The red lines represent households that did not receive the specified intervention.
Estimation based on multiple matching methods can improve the robustness and reliability of the results. Therefore, several different matching methods are used in this section to estimate the
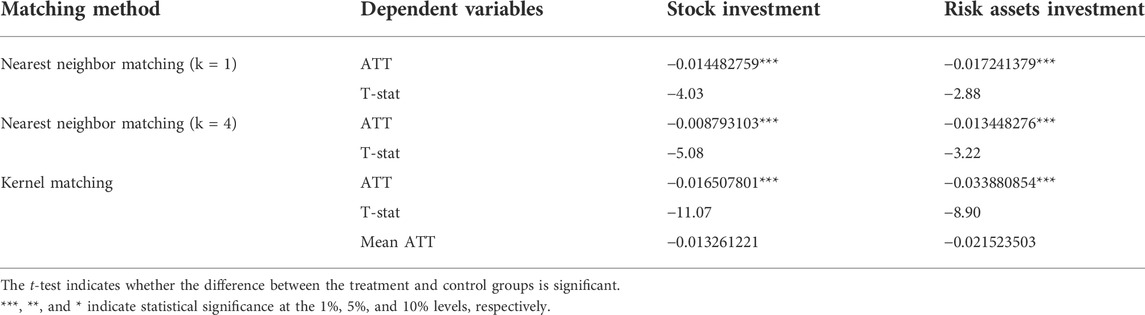
TABLE 5. Comparisons of average treatment effect (ATT).
Although the calculated results of different matching methods were slightly different, their overall trends were consistent. First, the impact of natural hazards on household stock investment is analyzed. As can be seen from Table 5, the average
In conclusion, we find through
6 Conclusion and recommendations
Using CHFS2019 data to examine the relationship between natural hazards and household financial asset allocation, the results show that 1) natural hazards significantly reduce household investment in stock assets and risky financial assets, and natural hazards have a greater impact on total risky financial assets than stock assets. 2) Compared to households with high household financial literacy, households with lower financial literacy are more affected by natural hazards in terms of investment in risky financial assets. 3) Older, more economically advanced and better educated household heads are more willing to make risky investments.
Almost all countries have experienced the effects of various types of natural hazards, so based on the above findings, the following policy recommendations are made.
1) The government should do a good job in hazard prevention and reconstruction, actively explore local characteristics, drive local economic development and narrow the gap between the rich and the poor. And to encourage families to reasonably participate in the financial market, it should simultaneously promote the construction of public mental health, promote the development of psychological resilience, create a good investment environment, and enhance residents’ confidence in investment. While promoting the rapid development of the financial market, optimize the risk management system, establish a risk early warning mechanism, clarify risk management objectives, effectively maintain the smooth operation of the financial market, and promote a sound long-cycle assessment mechanism for investors in various professional institutions, so that residents can participate more in financial investment.
2) Improve the financial literacy and education level of residents. Through education and learning to improve the residents’ investment level and establish the correct investment concept. Residents should keep up with the times, change the traditional investment concept of avoiding risks by saving and giving up high returns, take the initiative to learn financial knowledge, improve financial literacy, and make reasonable allocation of family financial assets to obtain higher investment returns.
3) Encourage financial institutions to innovate financial products, accelerate the innovation of financial instruments to meet the diversified needs of family financial assets, innovate and develop various types of securities, bonds and notes, etc., and encourage financial institutions to develop innovative insurance varieties around the needs of residents.
Data availability statement
Publicly available datasets were analyzed in this study. This data can be found here: https://chfs.swufe.edu.cn.
Author contributions
TL designed the research, collected data, revised and polished the article. JL constructed empirical models and obtained the results. DL drafted the paper and conducted the data interpretation. All authors have read and agreed to the published version of the article.
Funding
This work was supported by the Key Program of the National Philosophy and Social Science Foundation of China (Grant No. 21ATJ003) and 2021 Annual Program of Huamao Financial Research Institute of Henan University of Economics and Law (Measurement and Demonstration of Welfare Based on High- Quality Development).
Conflict of interest
The authors declare that the research was conducted in the absence of any commercial or financial relationships that could be construed as a potential conflict of interest.
Publisher’s note
All claims expressed in this article are solely those of the authors and do not necessarily represent those of their affiliated organizations, or those of the publisher, the editors and the reviewers. Any product that may be evaluated in this article, or claim that may be made by its manufacturer, is not guaranteed or endorsed by the publisher.
Supplementarymaterial
The Supplementary Material for this article can be found online at: https://www.frontiersin.org/articles/10.3389/fenvs.2022.963465/full#supplementary-material
References
Berkowitz, M. K., and Qiu, J. (2006). A further look at household portfolio choice and health status. J. Bank. Finance 30 (4), 1201–1217. doi:10.1016/j.jbankfin.2005.05.006
Bertaut, C. C., and Haliassos, M. (1997). Precautionary portfolio behavior from a life-cycle perspective. J. Econ. Dyn. Control 21 (8-9), 1511–1542. doi:10.1016/s0165-1889(97)00060-2
Brown, P., Daigneault, A., Tjemstrm, E., and Zou, W. (2018). Natural disasters, social protection, and risk perceptions. World Dev. 104, 310–325. doi:10.1016/j.worlddev.2017.12.002
Caliendo, M., and Scheel-Kopeinig, S. (2008). Some practical guidance for the implementation of propensity score matching. J. Econ. Surv. 22, 31–72. doi:10.1111/j.1467-6419.2007.00527.x
Calvet, L. E., and Sodini, P. (2014). Twin picks: Disentangling the determinants of risk‐taking in household portfolios. J. Finance 69 (2), 867–906. doi:10.1111/jofi.12125
Chen, F., Chen, S., Zhang, X., Chen, J., Wang, X., Gowan, E. J., et al. (2020). Asian dust-storm activity dominated by Chinese dynasty changes since 2000 BP. Nat. Commun. 11, 992. doi:10.1038/s41467-020-14765-4
Gallagher, J. (2014). Learning about an infrequent event: Evidence from flood insurance take-up in the United States. Am. Econ. J. Appl. Econ. 6 (03), 206–233. doi:10.1257/app.6.3.206
Ge, Y., Chen, H., Zou, L., and Zhou, Z. (2021). Political background and household financial asset allocation in China. Emerg. Mark. Finance Trade 57 (4), 1232–1246. doi:10.1080/1540496x.2020.1865147
Gunning, J. W. (2010). Risk and savings: A taxonomy. Econ. Lett. 107 (01), 39–41. doi:10.1016/j.econlet.2009.12.020
He, Z., Shi, X., Lu, X., and Li, F. (2019). Home equity and household portfolio choice: Evidence from China. Int. Rev. Econ. Finance 60 (03), 149–164. doi:10.1016/j.iref.2018.12.014
Hu, Z., Wang, Y., and Shi, B. (2018). Does financial literacy affect household financial asset portfolio diversity? Invest. Res. 37 (03), 78–91.
Huang, Z., and Lu, Y. (2021). Analysis of asset risk and household Financial Asset Allocation structure - empirical analysis from a nonlinear model. E3S Web Conf. 235, 01039. doi:10.1051/e3sconf/202123501039
Li, L. (2021). Analysis on the Influence of Financial Literacy on the Household Financial Assets Allocation. Front. 2 (6). doi:10.6981/FEM.202106_2(6).0009
Li, S., and Yang, Y. (2021). An empirical study on the influence of the basic medical insurance for urban and rural residents on family financial asset allocation. Front. Public Health 9, 725608. doi:10.3389/fpubh.2021.725608
Liu, J. (2015). Household heterogeneity and risky financial asset investment in urban households in China. Econ. Issues (03), 51–55+60. doi:10.16011/j.cnki.jjwt.2015.03.011
Markowitz, H. (1952). Portfolio selection. J. Finance 7 (1), 77–91. doi:10.1111/j.1540-6261.1952.tb01525.x
Palanca-Tan, R. (2020). Social capital and vulnerability to extreme climate in a semi-urban fishing community in Laguna de Bay, Philippines. J. Environ. Sci. Manag. 23 (2). doi:10.47125/jesam/2020_2/10
Paul, M. (2015). The Economic Impacts of Natural Disaster. J. Econ. issues 49 (1), 313–315. doi:10.1080/00213624.2015.1013902
Porfiriev, B. N. (2016). The economics of natural disasters. Her. Russ. Acad. Sci. 86 (1), 1–11. doi:10.1134/s1019331616010020
Qiao, H., and Su, Y. (2019). Traumatic experiences, risk appetite and household asset selection: Evidence based on microdata from national baseline surveys. Southern Finance (12), 43–53. doi:10.3969/j.issn.1007-9041.2019.12.005
Rosenbaum, P. R., and Rubin, D. B. (1985). Constructing a control group using multivariate matched sampling methods that incorporate the propensity score. Am. Stat. 39, 33–38. doi:10.1080/00031305.1985.10479383
Shum, P., and Faig, M. (2006). What Explains Household Stock Holdings?. J. Bank. Finance 30 (09), 2579–2597. doi:10.1016/j.jbankfin.2005.11.006
Skidmore, M. (2001). Risk, natural disasters, and household savings in a life cycle model. Jpn. World Econ. 13 (01), 15–34. doi:10.1016/s0922-1425(00)00056-6
Sulistyaningrum, E. (2015). Household Expenditure in Response to Natural Disasters. J. Indonesian Econ. Bus. 30 (3), 257–272. doi:10.22146/jieb.10315
Tang, L., and Pan, W. (2021). The impact of intergenerational care on household financial asset allocation: An empirical analysis based on CHFS data. Consum. Econ. (1), 39–49.
Yilmazer, T., and Lich, S. (2015).Portfolio choice and risk attitudes: A household bargaining approach. Review of economics of the household 13 (2), 219–241. doi:10.1007/s11150-013-9207-8
Tsoumas, C., and Antzoulatos, A. A. (2010). Financial development and household portfolios - Evidence from Spain, the U.K. and the U.S. J. Int. Money Finance 29 (2), 300–314. doi:10.1016/j.jimonfin.2009.03.001
Wachter, J. A., and Yogo, M. (2010). Why do household portfolio shares rise in wealth?. Rev. Financ. Stud. 23 (11), 3929–3965. doi:10.1093/rfs/hhq092
Wang, J., and Wu, W. (2014). The impact of marriage on households' risky asset choices. Nankai Econ. Res. (03), 100–112. doi:10.14116/j.nkes.2014.03.003
Yin, Z., Song, P., and Huang, Q. (2015). Credit constraints and household asset selection: An empirical study based on Chinese household financial survey data. Invest. Res. 34 (01), 4–24.
Zhang, Y., and Zhou, H. (2017). Household financial assets allocation and behavior of art collection holding. DEStech Trans. Comput. Sci. Eng., 465–472. doi:10.12783/dtcse/itme2017/8035
Keywords: natural hazards, household financial asset allocation, financial literacy, China, CHFS
Citation: Liu T, Li J and Li D (2022) Effect of natural hazards on the household financial asset allocation: Empirical analysis based on CHFS2019 data. Front. Environ. Sci. 10:1003877. doi: 10.3389/fenvs.2022.1003877
Received: 27 July 2022; Accepted: 25 October 2022;
Published: 09 November 2022.
Edited by:
Zheng Duan, Lund University, SwedenReviewed by:
Jian Wang, Nanjing Audit University, ChinaHongmin Li, Northeast Forestry University, China
Copyright © 2022 Liu, Li and Li. This is an open-access article distributed under the terms of the Creative Commons Attribution License (CC BY). The use, distribution or reproduction in other forums is permitted, provided the original author(s) and the copyright owner(s) are credited and that the original publication in this journal is cited, in accordance with accepted academic practice. No use, distribution or reproduction is permitted which does not comply with these terms.
*Correspondence: Tingyi Liu, MjAxOTEwMTA1MDA0N0B3aHUuZWR1LmNu