 Jingxin Li
 Wenzhe Ma1
 Siyu Chen
 Minghu Ding
94% of researchers rate our articles as excellent or good
Learn more about the work of our research integrity team to safeguard the quality of each article we publish.
Find out more
ORIGINAL RESEARCH article
Front. Environ. Sci., 31 October 2022
Sec. Atmosphere and Climate
Volume 10 - 2022 | https://doi.org/10.3389/fenvs.2022.1003526
Global solar radiation (GSR) reaching the Earth’s surface can directly alter the energy balance of the climate system. The potential influence of inhomogeneity issues on Chinese GSR records on dimming and brightening in China has been argued for years. In this study, we explored the temporal evolution and spatial distribution of the long-term trend of GSR in eastern China (EC) during 1961–2018 using a homogenized GSR dataset, which removed the artificial signals. Results demonstrate that EC experienced a significant dimming period from 1961 to 1999, a brightening period from 2010 until 2018 and a leveling-off period between them (2000–2010), which resulted from opposite trends of GSR in the northern (dimming) and southern (brightening) regions of EC. The reduction of cloud coverage after the dimming period (2000) induced an early coming brightening in the southern region of China between 2000 and 2010, while the increase in aerosols and the rapidly extending cloud fraction resulted in the continuing dimming in northern China.
• The long-term (1961-2018) changes in global solar radiation in eastern China were presented by using the recently published homogenized data.
• GSR displayed an increasing trend at a rate of 9.8 Wm−2 decade−1 from 2010 to 2018, and reverted back to 1970s radiation levels.
• There are opposite trends of GSR in the northern (dimming) and southern (brightening) regions of eastern China during 2000–2010.
Global solar radiation (GSR) reaching the Earth’s surface has a direct impact on the energy balance in the climate system and is thus considered as one of the drivers of climate change (Wild et al., 2008; Liang et al., 2010; Stephens et al., 2012; Wild, 2012; Wild et al., 2013). Solar radiation heats land and sea surfaces, which modulates the local flow in the planetary boundary layer directly through sensible heat flux (Stull 1988; Li et al., 2017; Guo et al., 2019; Xu et al., 2021) as well as large-scale atmospheric circulation indirectly through atmospheric teleconnections (e.g., Liu et al., 2015a; Liu et al., 2015b; Liu et al., 2016; Wild, 2016; Liu et al., 2017; Wang et al., 2017; Zhang et al., 2019). The net radiation effects deeply depend on solar radiation anomalies and surface conditions that demonstrate remarkable regional differences (e.g., Liu et al., 2012; Liu et al., 2014a; Han et al., 2014; Xin et al., 2014). In addition, understanding the variability of regional solar radiation is conducive to the effective and reasonable use of solar energy.
The global trends of GSR have been extensively investigated as early as the 2000s (Liepert, 2002). For instance, numerous studies have reported significant trends and decadal changes at worldwide distributed terrestrial sites (e.g., Dutton et al., 2006; Gilgen et al., 2009; Ohmura, 2009 and references therein). In these researches, the long-term declining and increasing trends in solar radiation, which are also termed as solar “dimming” and “brightening” (Stanhill and Cohen, 2001), respectively, have been extensively concerned. Through analyzing long term records of GSR measurements, these studies generally suggested a widespread decreasing trend between the 1950s and 1980s, with an increasing trend at many locations in the early of the 20th century (Wild et al., 2005; Wild, 2009; Wild et al., 2009; Schwarz et al., 2020). Compared with the dimming, the subsequent brightening is non-uniform in space-time distribution on the global scale. There have also been numerous studies on the variability of regional solar radiation in addition to that of global or continental solar radiation (Norris and Wild, 2007; Ruckstuhl et al., 2008; Stjern et al., 2009; Zerefos et al., 2009; Chiacchio and Wild, 2010; Sanchez-Lorenzo et al., 2013; Perdigão et al., 2016).
China experienced a dimming before the 1990s (e.g., Liang and Xia, 2005; Xia et al., 2006; Qian et al., 2007; Shi et al., 2008; Wang et al., 2011). Some sites show an increase in GSR between 1990 and 2000 (Wild et al., 2005; Qian et al., 2007; Hayasaka, 2016; Wang and Wild, 2016; Yang et al., 2018), whereas renewed dimming appears between 2000 and 2005 (Wild et al., 2009; He et al., 2018). Some results have indicated the brightening in recent years in China (Yang et al., 2019). In terms of the studies of GSR trend analysis in China, many preceding researches have presented the long-term changes in GSR at different temporal-spatial scales (e.g., Che et al., 2005; Tang et al., 2011; Zhou et al., 2019). Some researchers have further compared regional differences in the variabilities of GSR between different areas in China. Hayasaka (2016) indicated the increasing (declining) trend of GSR in southern (northern) China from 1993 to 2005. For the period 1979–2008, a dipole pattern of GSR was observed (Qian, 2016). There are some moderately increasing (declining) trends in most stations to the south (north) of the Yangtze River (Qian, 2016). Recently, Li et al. (2018) also discovered that GSR in the East of China has increased during 2005–2015, with the largest increase in the northeast and southeast regions of China after 2010. The annual trend increases in clear-sky GSR in most parts of arid and semi-arid areas in China during the period 2001–2015 (Yu et al., 2019). As a result, there has been a trend difference in large-scale GSR in almost all parts of China or East China. These studies identified regional differences between northern and southern China. Thus the study of regional trend changes in GSR is required except on a global or continental scale (Zhang et al., 2004; Xu et al., 2011; You et al., 2013; Deng et al., 2015).
In addition, it is noteworthy that the inhomogeneity issues in Chinese GSR records caused by instrument replacements occurring at all sites in the early 1990s (Wang, 2014) probably mislead the results of in surface solar radiation to some extent and give rise to arguments in climatic changes (Tang et al., 2010). The National Meteorological Information Center (NMIC) released a homogenized GSR dataset available from 1961 to 2018 in 2018 (Yang et al., 2018). It eliminated the significant inhomogeneous issues in the GSR records. The observed stations dataset was used to verify two satellite derived products (SARAH-E and CERES-SYN1deg) and three reanalysis data sets (ERA5, ERA-Interim and MERRA-2) (Fei and Wang, 2019; Zhang et al., 2020; Cao et al., 2022). These reanalysis products overestimate the GSR in China due to an underestimation of cloud coverage and underestimate the GSR in southern China due to an overestimation of atmospheric aerosol loading and aerosol–cloud interaction (Fei and Wang, 2019; Zhang et al., 2020). The Clouds and the Earth’s Radiant Energy System (CERES) data are more consistent with observed stations dataset than the reanalysis data (Zhang et al., 2016). Other updated radiation products have good performance as CERES (Liang et al., 2021; Letu et al., 2022). But the available satellite products are quite short. Thus, this is a good opportunity to use the homogeneous observed dataset to further assess when the GSR in China shows consistent variability, when it shows regional differences, and what are the underlying reasons for inducing regional GSR differences in China.
Extraterrestrial influences, such as the solar output (i.e., sunspot cycle) (Willson and Mordvinov, 2003) and earth orbital parameters (Fröhlich and Lean, 1998), and influences of climate system, such as water vapor (Wild, 1997; Wild et al., 2007), atmospheric concentrations (Kvalevag and Myhre, 2007) of NO2, H2O, CH4, CO2 and stratospheric ozone possibly modulate the variability of GSR. However, these factors of influence on GSR are at least an order of magnitude smaller than the GSR changes detected from surface observations on a large spatial scale. Thus their minor effects can be neglected to interpret the observed GSR trends (Wild, 2009). The changes in the aerosol and cloud cover are commonly considered as the two most probable causes for global dimming and brightening (Liepert and Tegen, 2002; Wild, 2009; Chiacchio et al., 2011; Ye and Xia, 2016). For example, the long-term trend of GSR was closely linked to the changes of AOD and cloud fraction (Fei and Wang, 2019). The direct radiative effects of aerosol are revealed to be the determining factor of the clear-sky solar radiation trends over the arid and semi-arid (ASA) areas in China by using satellite remote sensing aerosol and reanalysis data (Yu et al., 2019). Cloud fraction is the internal variability of the climate system. The long-term trend of cloud fraction is recognized to be significantly influenced by aerosol particles derived from anthropogenic activities, due to the well-known aerosol-cloud interaction effect (Boucher et al., 2013; Yang et al., 2021). Therefore, we will further investigate the potential contribution of aerosols and clouds to solar dimming and brightening phenomena.
The contents of this paper are as follows: the data and methods used in this research are described in section 2. Section 3 presents the characteristics of the temporal and spatial distribution of radiation and explores possible causes for the trends in radiation in the entire sky. Section 4 concludes the key findings obtained here and discusses the meaning of our findings.
Previous studies have identified marked uncertainties in radiation data onto China (e.g. Wang, 2014; Wang F. et al., 2015). The reorganization of the GSR networks and replacement of instruments during 1990–1993, resulted in the abrupt increases in the published composite GSR time series (e.g., Wang K. et al., 2015). A homogenized radiation dataset (Yang et al., 2018) released by National Meteorological Information Center (NMIC) (https://data.cma.cn/) was used in this study. It had identified and eliminated the significant inhomogeneity issues in GSR data, which may mislead the long-term change analysis.
The data of Aerosol Optional Depth (AOD) covering 1980–2018 was from the Modern-Era Retrospective analysis for Research and Applications (MERRA) (Gelaro et al., 2017). An alternative set of data of AOD during 2002–2018 was from the Moderate-resolution Imaging Spectroradiometer (MODIS) (Justice et al., 2002). A series of data was used to verify the variations of Cloud Fraction (CF) including the CF from the International Satellite Cloud Climatology Project (ISCCP) (Rossow and Schiffer, 1991), MODIS and MERRA, during 1981–2018. A long cloud fractions measurement data series (from NMIC) during 1961–2018 was used, which was based on observer estimates in 1/10 of sky coverage. These data were used to estimate potential influential factors. The cloud fractions indicate the accumulation of the cloud.
Two statistical methods were used to compute the trends of the time series. One is the linear least squares fit to compute the linear regression (Taylor, 1997). The regression coefficient calculated represents the linear trend. The least squares were the method of fitting a straight line to sample points by selecting the median of the slopes of all straight lines of pairs of points. This estimator has high calculation efficiency. It is commonly used to determine long-term trends in meteorology and climatology. The results were tested for Theil-Sen estimator method (Theil, 1950; Sen, 1968; Hirsch et al., 1982). The results computed by the two methods are consistent.
The other method is the Mann-Kendall (MK) test (Mann, 1945; Kendall, 1975), which is used to identify the monotonic trends exist on a time series, is more suitable for the normally distributed data. The Mann-Kendall nonparametric statistical method was used in trend detection under the influence of climate change. The two methods were used together in the present study to improve the reliability of trend estimation. A trend is considered significantly if the confidence levels are above 95% for both the least squares and MK test.
Lowess-filtered is computed using weighted linear least squares and a degree-1 polynomial model for local regression.
This research focuses on the regional GSR trends in eastern China (EC, 17°N–42°N and 100°E–122°E). The instrument replacement occurred at all sites in EC (Yang et al., 2018). The EC with a high population density has a high density of observation sites. Thirty-six stations in the region with long-term records were used to analyze the GSR trends and their relationships with other climatological factors. The time series of the area-mean GSR anomaly was obtained from the area-weighted average of the anomalies at all stations. The method of area-weighted average, namely the climate anomaly method (CAM) can more objectively reflect regional averages (Jones, 1994). In this study, EC was divided into northern (NR) and southern regions (SR). The dividing line is around 33°N. It is approximately along the Qinling-Huaihe climate line, which has been extensively used as the boundary of the climate transition zone of China (e.g. Huang, 1958; Yuan et al., 2017). Geographically, the increase in temperatures to the north of 30°N is noticeably higher than that to the south of 30°N. The drying trends are statistically significant in both NR and SR, bounded by 30°N (Yang and Xing, 2022). The Middle-lower Yangtze Plain and Hilly Areas of the Southern Yangtze River are below 33°N. Loess Plateau and North China Plain are above 33°N. Hence, there are the great differences in the characteristics of the topography and climate between the two regions. Fourteen (twenty two) stations are uniformly distributed in NR (SR).
Figure 1 shows the linear running window linear trends of the area-weighted average GSR in EC. The x-axis denotes the starting year of the running window, while the y-axis denotes the ending year of the running window. The GSR decline trends start in any years before 2000 and end in 2000. The GSR increasing trends start in 2010 and end in any years after 2010. Therefore, the linear trends of the GSR anomalies of the time series in EC are shown in Figure 2 with the dividing points 2000 and 2010.
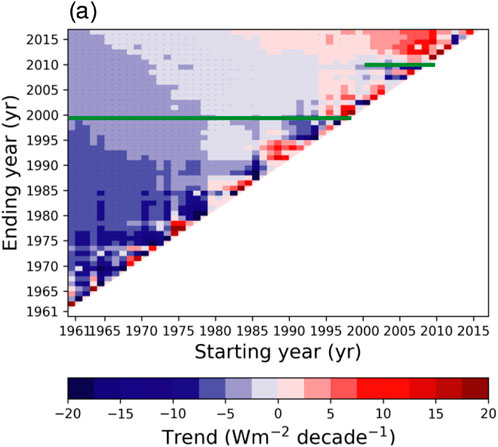
FIGURE 1. The running window linear trends of the area-weighted average GSR in eastern China. The x-axis denotes the starting year of the running window, while the y-axis denotes the ending year of the running window. Asterisk indicates that the trends are statistically significant at the 95% confidence level.

FIGURE 2. Time series of the area-weighted average of yearly GSR anomalies based on 36 stations in eastern China during 1961–2018. “R” is the correlation coefficient.
Figure 2 shows the GSR anomalies of the time series in EC and its linear trends for the period 1961-1999, 2000-2009 and 2010-2018. Yang et al. (2019) implied a strong declining trend before the early 2000s. Our results support a significant dimming from 1961 to 1999. The magnitude of GSR decreased by about −5.1 Wm−2 decade−1, which is generally in agreement with the trend slopes estimated in previous studies that were found ranging from −4.1 to −7.4 W m−2 decade−1 (Che et al., 2005; Liang and Xia, 2005; Shi et al., 2008; Yang et al., 2019). After such a significant decrease, the GSR anomaly experienced a stable period from 2000 until 2010, indicating no significant linear trend (the trend slope of only −0.43 Wm−2 decade−1). This is generally consistent with the result from the previous studies that showed GSR should have remained stable rather than significantly brightening in China before 2008 (Tang et al., 2011; Qian, 2016; Yang et al., 2019). The minimum value 5.48 Wm−2 is in 2010. Since 2010, a significant linear increase in the GSR anomaly (i.e., brightening) has occurred, with a linear slope of 9.8 Wm−2 decade−1 during 2010–2018. The GSR anomaly reached 6.37 Wm−2 in 2018, which is close to the value in 1979.
Figure 3 depicts the spatial distribution of the GSR decadal trends for the dimming period 1961–1999 (A), the leveling-off period 1999–2009 (B) and the brightening period 2010–2018 (C) in 36 radiation stations in the EC. As shown in Figure 3A, 34 stations consistently show decreasing trends, indicating a phenomenon of large-scale solar dimming in almost the entire EC. At these sites, GSRs ranged from −15 to −0.4 Wm−2 decade−1. The exceptions occurred at only two stations (Nanjing and Kunming with the upward trends of 1.1 Wm−2 decade−1 and 1 Wm−2 decade−1, respectively). The above results support the previous findings that disclosed large-range dimming in the EC until the 1990s (Liang and Xia, 2005; Ohmura, 2006; Xia, 2010).
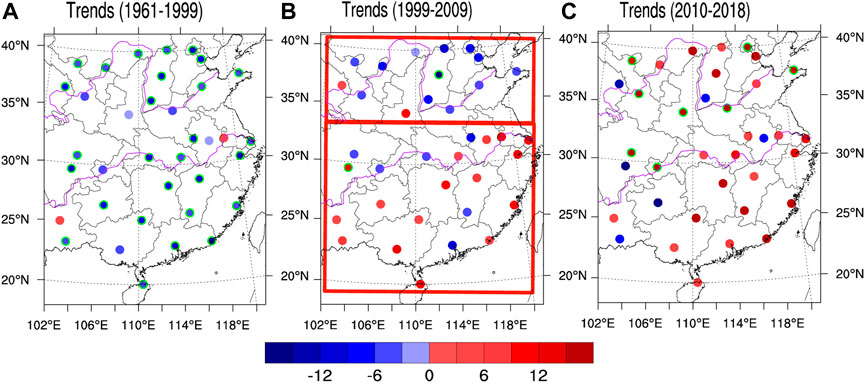
FIGURE 3. Geographical distribution of the decadal trends in GSR for the period 1961–1999 (A), 1999–2009 (B) and 2010–2018 (C) in 36 radiation stations in eastern China. (Unit: W m−2 decade−1). Green circle indicate that trends are statistically significant at the 95% confidence level.
In contrast, GSR trends distinctly manifested a regional difference during the leveling-off period (1999–2009), with increasing trends appearing in the most southern stations and declining trends occurring in the most northern stations, displaying a north-south dipole pattern (Figure 3B). Interestingly, the north-south comparison in the GSR trend is divided by the Qinling-Huaihe climate line. This implies that the difference in climate changes between northern and southern China may be to some extent responsible for the north-south dipole in GSR trends during the leveling-off period. We will discuss it further in the following section.
As for the rising period (2010–2018) (Figure 3C), most stations have upward trends and several stations showing downward trends appear to randomly distribute in EC. In general, EC experienced a consistent brightening during this period.
In short, there was no significant spatial difference in the trends of GSR anomalies in EC during the periods of dimming and brightening, but a remarkable north-south regional difference (i.e., solar dimming in northern China and brightening in southern China) during the leveling-off period. Therefore, the offsetting effect of north dimming and south brightening may be a reason for this leveling-off phenomenon in the EC during this period.
Figure 4 presents the mean annual variations in GSR anomalies in northern region (NR) (including 14 stations) and southern region (SR) (including 22 stations) during 1961–2018. The temporal evolution of GSR anomalies in NR implies a brightening since 2007 (the lowest value in the lowess-filtered GSR anomalies) after the dimming from 1961 to 2007 (see the thick blue line in Figure 4). The value of the GSR anomaly reached 4.33 Wm−2 in 2018, which is close to the value of 5.12 Wm−2 in 1982. In SR, an earlier brightening has appeared since 1999 (see the thick red line in Figure 4). The GRS anomaly was 7.66 Wm−2 in 2018, which is close to the value of 7.96 Wm−2 in 1978. Both the minimum value of −5.33 Wm−2 in SR and the low value of -5.71 Wm−2 in NR appeared in 2010, which causes the smallest average value of GSR over EC in 2010. As a result, there is a temporary brightening in the SR before 2010 and a large brightening in both NR and SR after 2010.
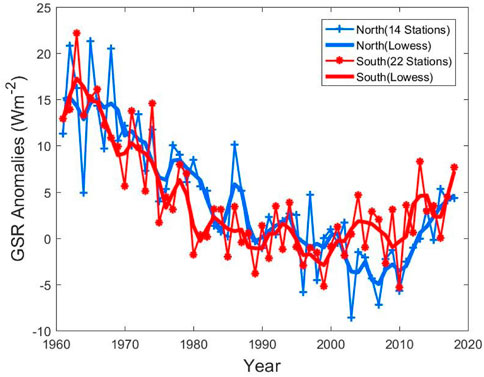
FIGURE 4. Time series of the area-weighted average of yearly GSR anomalies from 14 stations in northern China (blue) and from 22 stations in southern China (red) during 1961–2018. Original data (dot and line) are smoothed by the lowess filter (Local regression using weighted linear least squares and a 1st degree polynomial model) (Thick line).
We further compare the variations in GSR anomalies in NR and SR for four seasons, namely, winter (December, January and February), spring (March, April and May), summer (June, July and August), and autumn (September, October and November). As shown in Figure 5, there is a generally consistent downward trend for both NR and SR over the four seasons up to 1999. Likewise, significant decreases appeared at most stations in the four seasons before 1999 (not shown). Nevertheless, the GSR anomalies show clear seasonal differences after 1999. Specifically, GSR anomalies in both spring (10 Wm−2 decade−1) and summer (5.1 Wm−2 decade−1) display significant upward trends in SR (see Figures 5B,C), and tend to be leveling-off in winter (-1.2 Wm−2 decade−1) (see Figure 5A) and autumn (2.2 Wm−2 decade−1) (see Figure 5D) between 1999 and 2009. For NR, the GSR anomalies in summer (−12 Wm−2 decade−1) seem to contribute to the dimming from 1999 to 2009 (see the blue curve in Figure 5C), the linear trends are relatively weaker in the other three seasons (−3.9 Wm−2 decade−1, −0.92 Wm−2 decade−1, 0.43 Wm−2 decade−1) (Figures 5A,C,D). After 2010, the increasing trends in the GSR anomalies have occurred in both NR and SR in four seasons. Due to the above contributions of GSR anomalies to the trends in the NR and SR in different seasons, NR and SR experienced opposite trends of GSR in summer and summer half-year (spring and summer) respectively, from 1999 to 2009. We are mainly concerned about the summer (summer half-year) hereinafter.
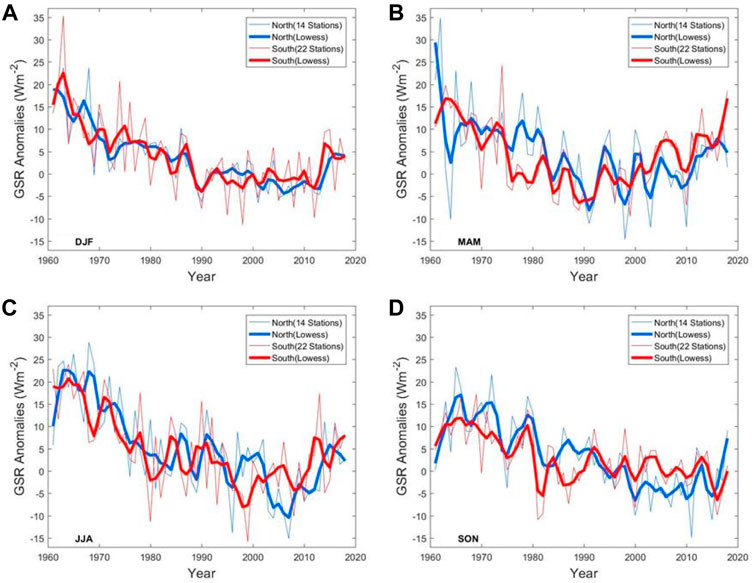
FIGURE 5. Time series of the area-weighted average GSR anomalies based on 14 stations in northern China (blue) and 22 stations in southern China (red) during (A) winter (DJF), (B) spring (MAM), (C) summer (JJA), and (D) autumn (SON) for the period 1961–2018. Original data (thin line) are smoothed by the lowess filter (local regression using weighted linear least squares and a 1st-degree polynomial model) (thick line).
To explain the north-south differences in GSR anomalies, the temporal evolution of Aerosol Optional Depth (AOD) in NR in summer and that in SR in summer half-year during the period 1980–2018 are presented in Figure 6. During 1980–2010, there were significantly increasing trends in AOD in NR (0.082 decade−1) (Figure 6A) and SR (0.069 decade−1) (Figure 6B). After 2010, the AOD in both NR and SR showed decreasing trends. It is worth noting that the AOD dropped back near the value in 2000 during the transition period. Qian et al. (2007) demonstrated that between the 1960s and 1980s the increasing aerosol loading with the emission of pollutants was responsible for the observed diminished GSR. Resulting from changes in the mix of fuel and consumption technologies in China, the aerosol single scattering albedo has significantly increased from 1983 (Qian et al., 2007). As a result, high aerosol-loads generally means small GSR (Liang and Xia, 2005). Therefore, the increasing trend of AOD from the 1980s to the 2010s appears to have partially contributed to the decreasing trend of GSR anomalies in NR in the summer. The decreasing trends of AOD after 2010 seem to partly contribute to the increasing trends of GSR anomalies in NR and SR. In the brightening phase when the emission regulations become effective, urbanization effects on GSR become insignificant (Wang and Wild, 2016). This may be a reason why AOD decreased in both NR and SR after 2010.

FIGURE 6. Time series of AOD from the MERRA in northern China [34°N-42°N,100°E-123°E] in summer (A) and southern China [19°N-33°N, 100°E-123°E] in summer half-year (B) during the period 1980–2018. “R” is the correlation coefficient.
In Figure 6, the AOD in the NR and SR exhibited similar trends signifies that AOD can not be the primary cause for the difference in the trend of GSR between the NR and SR. In particular, there is a clear increase of the GSR in SR in summer half-year during 1999–2010 (red curve in Figure 5C), but there was an increasing trend in AOD during the same period. Therefore, other factors may offset the decrease in GSR caused by the rising AOD.
The changes in cloudiness play a more significant role in interannual variability of GSR (Long et al., 2009). Cloud fraction (CF) is even deemed as the largest effect on the GSR’s interannual variation in China and Japan (Hayasaka, 2016). Therefore, we investigate the temporal variability of the cloud. Cloud data from MODIS, ISCCP and MERRA were used to verify the reliability of CF data from observed stations (Figure 7). They all show similar interannual change, interdecadal change and trend. Figure 8 compares the trend of CF during the summer NR with that of SR during the summer half-year. The CF trend in NR shows the significantly increased after 2000 (Figure 8A). However, there is no significant change in the trend in SR over the same period, Figure 8B and no significant linear trend in NR and SR before 2000.
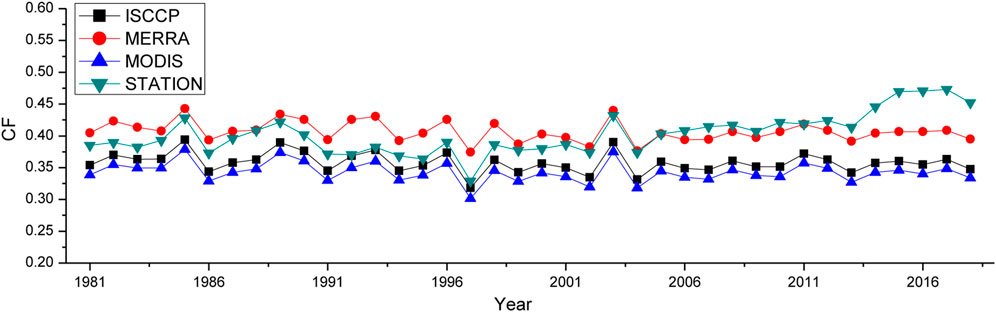
FIGURE 7. Time series of the annual cloud fraction in NR for four datasets (ISCCP, MERRA, MODIS, and station data).
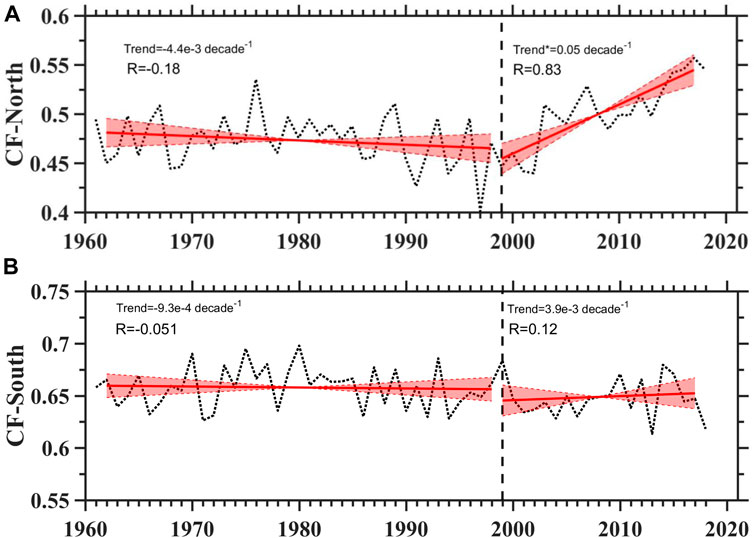
FIGURE 8. Time series of annual Cloud Fraction from the observations in NR in summer [34°N-42°N,100°E-123°E] (A) and in SR in summer half-year [19°N-33°N, 100°E-123°E] (B) during the period 1960–2018.
Figure 9 shows the CF anomaly in the SR introduced by the interdecadal variations in the summer half-year. There were positive anomalies in the 1970s and 1980s. The negative anomaly appears in the 1960s, 1990s, 2000s and 2010s, matching the increase in GSR after 2000. Thus, the increase in the summer semi-annual GSR in the SR during the period 2000–2010 may be attributed to the decrease in cloud cover.
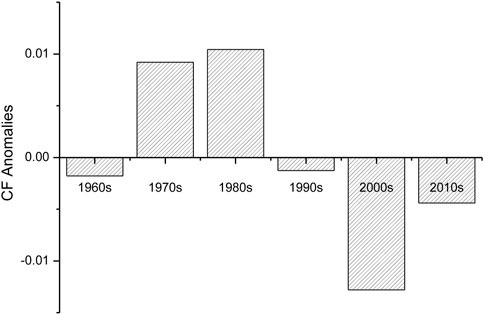
FIGURE 9. Interdecadal anomalies of Cloud Fraction in southern China in summer half-year.
Overall, the constant and slow reduction of clouds coverage after dimming period (2000) induced an early coming brightening in SR during 2000–2010, while the later coming increase in AOD and the rapidly extending cloud coverage resulted in the continuing dimming in NR in the same period.
In this study, we use new homogenized monthly and daily data to investigate long-term trends in the annual, seasonal variability and spatial distribution of the GSR in the EC for the period 1961–2018.
Results show that in the EC, there was a significant dimming from 1961 to 1999 and a significant linear increase trend with a linear slope of 9.8 Wm−2 decade−1 during the period 2010–2018. The GSR anomaly reached 6.37 Wm−2 in 2018, which is close to the value in 1979. The recovery of radiation is distinctly profitable to the generation of solar electricity (Sweerts et al., 2019). Noticeably, the nationwide averaged GSR anomalies (averaged over 119 stations in China) experienced a stable period from 2000 until 2010. This is largely in agreement with the result from Yang et al. (2019) and Zhou et al. (2019). The result shows that the GSR anomalies experienced the opposite trends in NR and SR during the leveling-off period (2000–2010), mainly for the summer. The decline trend in NR can be clearly observed until 2010. However, the GSR anomaly shows a brightening in SR around 2000. As such, the GSR average in EC seems to be “leveling-off”. This new finding implies this “leveling-off” is not true for the entire EC, but is a result of the opposite trends of GSR in the NR (dimming) and SR (brightening).
The trends of aerosol and GSR in the summer NR are reversed. NR experienced a significant dimming period from 1961 to 2007 as the AOD increased, and a brightening period from 2008 to 2018 as the AOD decreased. Nevertheless, the trend in the GSR anomaly in the SR cannot be explained by the variability in the AOD. SR experienced a period of significant dimming from 1961 to 1999 as the AOD increased. However, there has been an earlier brightening since 1999, but the AOD did not decrease until 2010. Cloud fraction variations can partially explain this phenomenon. Specifically, the increase in the GSR in SR during the summer half-year is consistent with the decrease in the cloud fraction after 2000.
In particular, for local areas and short timescales, changes in cloud cover appear to play a more important role in modulating the trends of the GSR relative to aerosols. The dimming or brightening cannot simply be attributed to the increase in anthropogenic aerosols or the reduction in air pollution (Wang et al., 2010). Further investigations are needed to explain why the summer half-year cloud fraction decreases in SR after 2000. On the other hand, due to an increase in cloud condensation nuclei, the direct radiative effect of aerosols and indirect radiative effects change into cloud cover in the polluted area (Wild, 2012). Aerosols and clouds may not be completely independent of each other, and their interactions are complex and diverse, which merits further investigation in the future. It is highly confident that clouds and aerosols can interact and account for a significant fraction of the global mean forcing from well-mixed greenhouse gases. The radiative force of the overall aerosol effect on the atmosphere contains a negative forcing from most aerosols and a positive forcing from black carbon absorption of solar radiation (Hartmann et al., 2013). They contribute the most to the uncertainty in the estimate of the total radiation force. The radiative effect of absorbing aerosols leads to cooling at the surface and heating in the atmosphere, thereby decreasing latent heat fluxes and stabilizing the atmosphere (Hayasaka, 2016). Accordingly, clouds, convection, and electrical activity are likely to be inhibited (Koren et al., 2004). Additionally, the present study shows that the GSR anomaly in the EC has generally recovered to the mean value of radiation in the 1970s. Such radiation recovery is profitable for solar power generation, especially for SR during the summer months.
Publicly available datasets were analyzed in this study. This data can be found here: https://data.cma.cn/.
JL and MD analyzed the data and wrote the manuscript; SY analyzed the data and prompted the text; GL supported the conception and wrote the manuscript; SC participated in constructive discussion and revised the manuscript; HZ provided many valuable suggestions; WM participated in part of analyses.
The research was supported by National Natural Science Foundation of China (41805128, 42175106), National Key Research and Development Program of China (2017YFA0603502), Liaoning Province Key R & D Program of Liaoning of China (2020JH2/10300091), Bohai Rim Meteorological Science Collaborative Innovation Fund (QYXM201901) and Basic Research Special Project of Chinese Academy of Meteorological Sciences (2021Z007, 2020Z003).
The authors declare that the research was conducted in the absence of any commercial or financial relationships that could be construed as a potential conflict of interest.
All claims expressed in this article are solely those of the authors and do not necessarily represent those of their affiliated organizations, or those of the publisher, the editors and the reviewers. Any product that may be evaluated in this article, or claim that may be made by its manufacturer, is not guaranteed or endorsed by the publisher.
Boucher, O., Randall, D., Artaxo, P., Bretherton, C., Feingold, G., Forster, P., et al. (2013). “Clouds and aerosols,” in Climate change 2013: The physical science basis. Contribution of working group I to the fifth assessment report of the intergovernmental panel on climate change (Cambridge, UK: Cambridge University Press).
Cao, Q., Liu, Y., Sun, X., and Liu, Y. (2022). Country-level evaluation of solar radiation data sets using ground measurements in China. Energy 241, 122938. doi:10.1016/j.energy.2021.122938
Che, H. Z., Shi, G. Y., Zhang, X. Y., Arimoto, R., Zhao, J. Q., Xu, L., et al. (2005). Analysis of 40 years of solar radiation data from China, 1961–2000. Geophys. Res. Lett. 32, 2322. doi:10.1029/2004gl022322
Chiacchio, M., Ewen, T., and Wild, M. (2011). Decadal variability of aerosol optical depth in Europe and its relationship to the temporal shift of the North Atlantic Oscillation in the realm of dimming and brightening. J. Geophys. Res. Atmos. 116 (D2), 14471. doi:10.1029/2010jd014471
Chiacchio, M., and Wild, M. (2010). Influence of NAO and clouds on long-term seasonal variations of surface solar radiation in Europe. J. Geophys. Research-Atmospheres 115, 2182. doi:10.1029/2009jd012182
Deng, J., Zhang, Y., Shi, B. K., and Shi, K. (2015). Long-term changes in surface solar radiation and their effects on air temperature in the Shanghai region. Int. J. Climatol. 35, 3385–3396. doi:10.1002/joc.4212
Dutton, E. G., Nelson, D. W., Stone, R. S., Longenecker, D., Carbaugh, G., Harris, J. M., et al. (2006). Decadal variations in surface solar irradiance as observed in a globally remote network. J. Geophys. Res. 111, D19101. doi:10.1029/2005jd006901
Fei, F., and Wang, K. (2019). Does the modern-era retrospective analysis for research and applications‐2 aerosol reanalysis introduce an improvement in the simulation of surface solar radiation over China? Int. J. Climatol. 39, 3.doi:10.1002/joc.5881
Fröhlich, C., and Lean, J. (1998). The Sun's total irradiance, Cycles and trends in the past two decades and associated climate change uncertainties. Geophys. Res. Lett. 25, 4377–4380. doi:10.1029/1998GL900157
Gelaro, R., McCarty, W., Todling, M. J. R., Molod, A., Takacs, L., Randles, C., et al. (2017). The Modern-Era retrospective analysis for research and applications, version 2 (MERRA-2). J. Clim. 30 (14), 5419–5454. doi:10.1175/JCLI-D-16-0758.1
Gilgen, H., Roesch, A., Wild, M., and Ohmura, A. (2009). Decadal changes in shortwave irradiance at the surface in the period from 1960 to 2000 estimated from Global Energy Balance Archive Data. J. Geophys. Res. Atmos. 114, D00d08. doi:10.1029/2008jd011383
Guo, J., Li, Y., Cohen, J., Li, J., Chen, D., Xu, H., et al. (2019). Shift in the temporal trend of boundary layer height in China using long‐term (1979-2016) radiosonde data. Geophys. Res. Lett. 46 (11), 6080–6089. doi:10.1029/2019GL082666
Han, J., Liu, G., and Xin, Y. (2014). A dipole pattern of summer precipitation over mid-high latitude Asia and related snow cover anomalies in the preceding spring. Atmos. Ocean. Sci. Lett. 7 (4), 364–368.
Hartmann, D. L., Klein Tank, A. M. G., Rusticucci, M., Alexander, L. V., Brönnimann, S., Charabi, Y., et al. (2013). “Observations: Atmosphere and surface,” in Climate change 2013: The physical science basis. Contribution of working group I to the fifth assessment report of the intergovernmental panel on climate change. Editors T. F. Stocker, D. Qin, G.-K. Plattner, M. Tignor, S. K. Allen, J. Boschunget al. (Cambridge, United Kingdom and New York, NY, USA: Cambridge University Press).
Hayasaka, T. (2016). The long-term variation in surface shortwave irradiance in China and Japan: A review. J. Meteorological Soc. Jpn. 94, 393–414. doi:10.2151/jmsj.2016-024
He, Y., Wang, K., Zhou, C., and Wild, M. (2018). A revisit of global dimming and brightening based on the sunshine duration. Geophys. Res. Lett. 45 (9), 4281–4289. doi:10.1029/2018gl077424
Hirsch, R. M., Slack, J. R., and Smith, R. (1982). Techniques of trend analysis for monthly water quality data. Water Resour. Res. 18 (1), 107–121. doi:10.1029/wr018i001p00107
Huang, B. W. (1958). Preliminary draft of China’s comprehensive natural zoning (in Chinese). Acta Geogr. Sin. 24, 14–31.
Jones, P. D. (1994). Hemispheric surface air temperature variations: A reanalysis and an update to 1993. J. Clim. 7, 1794–1802. doi:10.1175/1520-0442(1994)007<1794:hsatva>2.0.co;2
Justice, C. O., Townshend, J., Vermote, E. F., Masuoka, E., Wolfe, R. E., Saleous, N., et al. (2002). An overview of modis land data processing and product status. Remote Sens. Environ. 83 (1–2), 3–15.doi:10.1016/S0034-4257(02)00084-6
Koren, I., Kaufman, Y. J., Remer, L. A., and Martins, J. V. (2004). Measurement of the effect of Amazon smoke on inhibition of cloud formation. Science 303 (5662), 1342–1345. doi:10.1126/science.1089424
Kvalevåg, M. M., and Myhre, G. (2007). Human impact on direct and diffuse solar radiation during the industrial era. J. Clim. 20, 4874–4883. doi:10.1175/jcli4277.1
Letu, H., Nakajima, T. Y., Wang, T., Shang, H., Ma, R., Yang, K., et al. (2022). A new benchmark for surface radiation products over the East asia-pacific region retrieved from the himawari-8/AHI next-generation geostationary satellite. Bull. Am. Meteorological Soc. 103 (3), E873–E888. doi:10.1175/bams-d-20-0148.1
Li, J., Jiang, Y., Xia, X., and Hu, Y. (2018). Increase of surface solar irradiance across East China related to changes in aerosol properties during the past decade. Environ. Res. Lett. 13 (3), 034006. doi:10.1088/1748-9326/aaa35a
Li, Z., Guo, J., Ding, A., Liao, H., Liu, J., Sun, Y., et al. (2017). Aerosol and boundary-layer interactions and impact on air quality. Natl. Sci. Rev. 4 (6), 810–833. doi:10.1093/nsr/nwx117
Liang, F., and Xia, X. A. (2005). Long-term trends in solar radiation and the associated climatic factors over China for 1961-2000. Ann. Geophys. 23, 2425–2432. doi:10.5194/angeo-23-2425-2005
Liang, S., Cheng, J., Jia, K., Jiang, B., Liu, Q., Xiao, Z., et al. (2021). The global land surface satellite (GLASS) product suite. Bull. Am. Meteorological Soc. 102 (2), E323–E337. doi:10.1175/bams-d-18-0341.1
Liang, S., Wang, K., Wild, X. M., and Wild, M. (2010). Review on estimation of land surface radiation and energy budgets from ground measurement, remote sensing and model simulations. IEEE J. Sel. Top. Appl. Earth Obs. Remote Sens. 3, 225–240. doi:10.1109/jstars.2010.2048556
Liepert, B. G. (2002). Observed reductions of surface solar radiation at sites in the United States and worldwide from 1961 to 1990. Geophys. Res. Lett. 29, 1421. doi:10.1029/2002gl014910
Liepert, B., and Tegen, I. (2002). Multidecadal solar radiation trends in the United States and Germany and direct tropospheric aerosol forcing. J. Geophys. Research-Atmospheres 107 (D12), 2. doi:10.1029/2001jd000760
Liu, G., Liren, J., and Wu, R. (2012). An east-west SST anomaly pattern in the mid-latitude North Atlantic Ocean associated with winter precipitation variability over eastern China. J. Geophys. Res. 117, D15104. doi:10.1029/2012jd017960
Liu, G., Wu, R., Sun, S., and Wang, H. (2015a). Synergistic contribution of precipitation anomalies over northwestern India and the South China Sea to high temperature over the Yangtze River Valley. Adv. Atmos. Sci. 32, 1255–1265. doi:10.1007/s00376-015-4280-y
Liu, G., Wu, R., and Wang, H. (2016). Contribution of intraseasonal oscillation to long-duration summer precipitation events over southern China. Atmos. Ocean. Sci. Lett. 10 (1), 1–15. doi:10.1080/16742834.2017.1233799
Liu, G., Wu, R., Wang, H., and Ji, J. (2017). Effect of tropical Indian Ocean thermal condition during preceding winter on summer high temperature anomalies over the southern Yangtze River valley. Int. J. Climatol. 37, 3478–3490. doi:10.1002/joc.4932
Liu, G., Wu, R., Zhang, Y., and Nan, S. (2014a). The summer snow cover anomaly over the Tibetan Plateau and its association with simultaneous precipitation over the mei-yu-baiu region. Adv. Atmos. Sci. 31 (4), 755–764. doi:10.1007/s00376-013-3183-z
Liu, G., Zhao, P., Yang, J. S., and Yang, S. (2015b). Preceding factors of summer asian-pacific oscillation and the physical mechanism for their potential influences. J. Clim. 28, 2531–2543. doi:10.1175/jcli-d-14-00327.1
Long, C. N., Dutton, E. G., Augustine, J. A., Wiscombe, W., Wild, M., McFarlane, S. A., et al. (2009). Significant decadal brightening of downwelling shortwave in the continental United States. J. Geophys. Research-Atmospheres 114, 10. doi:10.1016/s0034-4257(02)00084-6
Mann, H. B. (1945). Nonparametric tests against trend. Econometrica 13, 245–259. doi:10.2307/1907187
Norris, J. R., and Wild, M. (2007). Trends in aerosol radiative effects over Europe inferred from observed cloud cover, solar “dimming,” and solar “brightening”. J. Geophys. Res. Atmos. 112, 8. doi:10.1029/2006jd007794
Ohmura, A. (2009). Observed decadal variations in surface solar radiation and their causes. J. Geophys. Res. Atmos. 114, D00d05. doi:10.1029/2008jd011290
Ohmura, A. (2006). Observed long-term variations of solar irradiance at the Earth's surface. Space Sci. Rev. 125, 111–128. doi:10.1007/s11214-006-9050-9
Perdigão, J. C., Salgado, R., and Costa, M. J. (2016). Variability and trends of downward surface global solar radiation over the Iberian Peninsula based on ERA‐40 reanalysis. Int. J. Climatol. 36 (12), 3917–3933.doi:10.1002/joc.4603
Qian, C. (2016). Impact of land use/land cover change on changes in surface solar radiation in eastern China since the reform and opening up. Theor. Appl. Climatol. 123, 131–139. doi:10.1007/s00704-014-1334-5
Qian, Y., Wang, W., Leung, L. R., and Kaiser, D. P. (2007). Variability of solar radiation under cloud-free skies in China: The role of aerosols. Geophys. Res. Lett. 34, 12. doi:10.1029/2006gl028800
Rossow, W. B., and Schiffer, R. A. (1991). ISCCP cloud data products. Bull. Amer. Meteor. Soc. 72, 2–20. doi:10.1175/1520-0477(1991)072<0002:icdp>2.0.co;2
Ruckstuhl, C., Philipona, R., and Behrens, K. (2008). Aerosol and cloud effects on solar brightening and the recent rapid warming. Geophys. Res. Lett. 35 (12), L12708. doi:10.1029/2008gl034228
Sanchez-Lorenzo, A., Calbó, J., and Wild, M. (2013). Global and diffuse solar radiation in Spain: Building a homogeneous dataset and assessing their trends. Glob. Planet. Change 100, 343–352. doi:10.1016/j.gloplacha.2012.11.010
Schwarz, M., Folini, D., Allan, S. R. P., and Wild, M. (2020). Changes in atmospheric shortwave absorption as important driver of dimming and brightening. Nat. Geosci. 13, 110–115. doi:10.1038/s41561-019-0528-y
Sen, P. K. (1968). Estimates of the regression coefficient based on kendall's tau. J. Am. Stat. Assoc. 63, 1379–1389. doi:10.1080/01621459.1968.10480934
Shi, G.-Y., Hayasaka, T., Ohmura, A., Chen, Z.-H., Wang, B., Zhao, J.-Q., et al. (2008). Data quality assessment and the long-term trend of ground solar radiation in China. J. Appl. Meteorology Climatol. 47, 1006–1016. doi:10.1175/2007jamc1493.1
Stanhill, G., and Cohen, S. (2001). Global dimming: A review of the evidence for a widespread and significant reduction in global radiation with discussion of its probable causes and possible agricultural consequences. Agric. For. Meteorology 107 (4), 255–278. doi:10.1016/s0168-1923(00)00241-0
Stephens, G. L., Li, J., Wild, M., Clayson, C. A., Loeb, N., Kato, S., et al. (2012). An update on Earth's energy balance in light of the latest global observations. Nat. Geosci. 5, 691–696. doi:10.1038/ngeo1580
Stjern, C. W., Kristjánsson, J. E., and Hansen, A. W. (2009). Global dimming and global brightening-an analysis of surface radiation and cloud cover data in northern Europe. Int. J. Climatol. 29, 643–653. doi:10.1002/joc.1735
Stull, R. B. (1988). An introduction to boundary layer meteorology. Netherlands: Springer. doi:10.1007/978–94–009–3027–8_7
Sweerts, B., Pfenninger, S. S., Yang, S., Folini, D., van der Zwaan, B., and Wild, M. (2019). Estimation of losses in solar energy production from air pollution in China since 1960 using surface radiation data. Nat. Energy 4, 657–663. doi:10.1038/s41560-019-0412-4
Tang, W., Yang, K., He, J., and Qin, J. (2010). Quality control and estimation of global solar radiation in China. Sol. Energy 84 (3), 466–475. doi:10.1016/j.solener.2010.01.006
Tang, W. J., Yang, K., Qin, J., He, C. C. K. J., and He, J. (2011). Solar radiation trend across China in recent decades: A revisit with quality-controlled data. Atmos. Chem. Phys. 11, 393–406. doi:10.5194/acp-11-393-2011
Taylor, J. R. (1997). “Least-squares fitting,” in An introduction to error analysis: The study of uncertainties in physical measurements. (Sausalito, Calif: Univ. Sci. Books), 181–207.
Theil, H. (1950). A rank-invariant method of linear and polynomial regression analysis. I, II, III. Nederl. Akad. Wetensch., Proc. 53, 386–392.
Wang, C., Tian, Z. W., and Tian, W. (2011). Factors affecting the surface radiation trends over China between 1960 and 2000. Atmos. Environ. 45, 2379–2385. doi:10.1016/j.atmosenv.2011.02.028,
Wang, F., Guo, J., Zhang, J., Huang, J., Min, M., Chen, T., et al. (2015a). Multi-sensor quantification of aerosol-induced variability in warm clouds over eastern China. Atmos. Environ. 113, 1–9. doi:10.1016/j.atmosenv.2015.04.063
Wang, H., Liu, G., and Chen, J. (2017). Contribution of the tropical Western Atlantic thermal conditions during the preceding winter to summer temperature anomalies over the lower reaches of the Yangtze River basin–Jiangnan region. Int. J. Climatol. 37 (13), 5111. doi:10.1002/joc.5111
Wang, K., Dickinson, R. E., and Liang, S. (2010). Evidence for decadal variation in global terrestrial evapotranspiration between 1982 and 2002: 2. Results. J. Geophys. Res. Atmos. doi:10.1029/2010jd013847
Wang, K., Ma, Q., Wang, Z. J., and Wang, J. (2015b). Decadal variability of surface incident solar radiation over China: Observations, satellite retrievals, and reanalyses. J. Geophys. Res. Atmos. 120, 6500–6514. doi:10.1002/2015jd023420
Wang, K. (2014). Measurement biases explain discrepancies between the observed and simulated decadal variability of surface incident solar radiation. Sci. Rep. 4, 6144. doi:10.1038/srep06144
Wang, Y., and Wild, M. (2016). A new look at solar dimming and brightening in China. Geophys. Res. Lett. 43, 11777–11785. doi:10.1002/2016gl071009
Wild, M. (2016). Decadal changes in radiative fluxes at land and ocean surfaces and their relevance for global warming. WIREs Clim. Change 7, 91–107. doi:10.1002/wcc.372
Wild, M., Folini, D., Schär, C., Loeb, N., König-Langlo, E. G. G., and Koenig-Langlo, G. (2013). The global energy balance from a surface perspective. Clim. Dyn. 40, 3107–3134. doi:10.1007/s00382-012-1569-8
Wild, M., Gilgen, H., Roesch, A., Ohmura, A., Long, C. N., Dutton, E. G., et al. (2005). From dimming to brightening: Decadal changes in solar radiation at Earth's surface. Science 308, 847–850. doi:10.1126/science.1103215
Wild, M. (2009). Global dimming and brightening: A review. J. Geophys. Research-Atmospheres 114, 10. doi:10.1029/2008jd011470
Wild, M., Grieser, J., and Schär, C. (2008). Combined surface solar brightening and increasing greenhouse effect support recent intensification of the global land-based hydrological cycle. Geophys. Res. Lett. 35, L17706. doi:10.1029/2008gl034842
Wild, M. (2012). New directions: A facelift for the picture of the global energy balance. Atmos. Environ. 55, 366–367. doi:10.1016/j.atmosenv.2012.03.022
Wild, M., Ohmura, A., and Makowski, K. (2007). Impact of global dimming and brightening on global warming. Geophys. Res. Lett. 34, 8031. doi:10.1029/2006gl028031
Wild, M. (1997). The heat balance of the Earth in GCM simulations of present and future climate. Zuercher Geogr. Schriften 68, 188.
Wild, M., Truessel, B., Ohmura, A., Long, C. N., Koenig-Langlo, G., Dutton, E. G., et al. (2009). Global dimming and brightening: An update beyond 2000Secular total solar irradiance trend during solar cycles 21-23. J. Geophys. Research-AtmospheresGeophysical Res. Lett. 114, 30. doi:10.1029/2008jd011382
Willson, R. C., and Mordvinov, A. V. (2003). Secular total solar irradiance trend during solar cycles 21–23. Geophys. Res. Lett., 30.
Xia, X. (2010). A closer looking at dimming and brightening in China during 1961-2005. Ann. Geophys. 28, 1121–1132. doi:10.5194/angeo-28-1121-2010
Xia, X. A., Wang, P. C., Chen, H. B., and Liang, F. (2006). Analysis of downwelling surface solar radiation in China from National Centers for Environmental Prediction reanalysis, satellite estimates, and surface observations. J. Geophys. Res. 111, D09103. doi:10.1029/2005jd006405
Xin, Y., Liu, G., and Jin, Q. (2014). Individual variations of winter surface air temperature over Northwest and Northeast China and their respective preceding factors. Atmos. Ocean. Sci. Lett. 7 (4), 346–351. doi:10.3878/j.issn.1674-2834.14.0010
Xu, J., Li, C., Shi, H., Pan, Q. L., and Pan, L. (2011). Analysis on the impact of aerosol optical depth on surface solar radiation in the Shanghai megacity, China. Atmos. Chem. Phys. 11, 3281–3289. doi:10.5194/acp-11-3281-2011
Xu, Z., Chen, H., Guo, J., and Zhang, W. (2021). Contrasting effect of soil moisture on the daytime boundary layer under different thermodynamic conditions in summer over China. Geophys. Res. Lett. 48, e2020GL090989. doi:10.1029/2020gl090989
Yang, R., and Xing, B. (2022). Evidence for intensification in meteorological drought since the 1950s and recent dryness-wetness forecasting in China. Atmosphere 13 (5), 745. doi:10.3390/atmos13050745
Yang, S., Wang, X. L., and Wild, M. (2018). Homogenization and trend analysis of the 1958-2016 in situ surface solar radiation records in China. J. Clim. 31 (11), 4529–4541. doi:10.1175/jcli-d-17-0891.1
Yang, S., Wang, X. L., and Wild, M. (2019). Causes of dimming and brightening in China inferred from homogenized daily clear-sky and all-sky in situ surface solar radiation records (1958-2016). J. Clim. 32, 5901–5913. doi:10.1175/jcli-d-18-0666.1
Yang, S., Zhou, Z., Su, Y., Zhou, Z., Yu, Y., and Wild, M. (2021). Cloud 'shrinking' and 'optical thinning' in the 'dimming' period and a subsequent recovery in the 'brightening' period over China. Environ. Res. Lett. 16 (310), 034013. doi:10.1088/1748-9326/abdf89
Ye, F., and Xia, X. (2016). Decadal variations of aerosol-cloud-radiation in eastern China and their relationships during 1980—2009. Meteorological Environ. Sci. 2, 1–9. doi:10.16765/j.cnki.1673-7148.2016.02.001
You, Q., Sanchez-Lorenzo, A., Wild, M., Folini, D., Fraedrich, K., Kang, G. S., et al. (2013). Decadal variation of surface solar radiation in the Tibetan Plateau from observations, reanalysis and model simulations. Clim. Dyn. 40, 2073–2086. doi:10.1007/s00382-012-1383-3
Yu, L., Zhang, M., and Wang, L. (2019). Clear-sky solar radiation changes over arid and semi-arid areas in China and their determining factors during 2001–2015. Atmos. Environ. 223, 117198. doi:10.1016/j.atmosenv.2019.117198
Yuan, Q. Z., Wu, S. H., Dai, E. F., Zhao, D. S., Zhang, X. R., and Ren, P. (2017). Spatio-temporal variation of the wet-dry conditions from 1961 to 2015 in China. Sci. China Earth Sci. 60, 2041–2050. doi:10.1007/s11430-017-9097-1
Zerefos, C. S., Eleftheratos, K., and Meleti, C. (2009). Solar dimming and brightening over thessaloniki, Greece, and beijing, China. Tellus B 61, 657–665. doi:10.3402/tellusb.v61i4.16862
Zhang, B., Liu, G., Zhu, Y., and Shi, N. (2019). Frequency of persistent blocking and ridge events related to precipitation over eastern China during August and its preceding atmospheric signals. Weather Forecast. 34 (6), 1705–1719. doi:10.1175/waf-d-19-0047.1
Zhang, X., Liang, S., Wang, G., Yao, Y., Jiang, B., Cheng, J., et al. (2016). Evaluation of the reanalysis surface incident shortwave radiation products from NCEP, ECMWF, GSFC, and JMA using satellite and surface observations. Remote Sens. 8, 225. doi:10.3390/rs8030225
Zhang, X., Lu, N., Jiang, H., and Yao, L. (2020). Evaluation of reanalysis surface incident solar radiation data in China. Sci. Rep. 10, 3494. doi:10.1038/s41598-020-60460-1
Zhang, Y. L., Qin, B. Q., and Chen, W. M. (2004). Analysis of 40 year records of solar radiation data in shanghai, nanjing and hangzhou in eastern China. Theor. Appl. Climatol. 78, 217–227. doi:10.1007/s00704-003-0030-7
Keywords: trend, global solar radiation, eastern China, aerosol, cloud
Citation: Li J, Ma W, Yang S, Liu G, Chen S and Ding M (2022) Northern dimming and southern brightening in eastern China during the first decade of the 21st century. Front. Environ. Sci. 10:1003526. doi: 10.3389/fenvs.2022.1003526
Received: 26 July 2022; Accepted: 10 October 2022;
Published: 31 October 2022.
Edited by:
Suvarna Sanjeev Fadnavis, Indian Institute of Tropical Meteorology (IITM), IndiaReviewed by:
Chong Shi, Aerospace Information Research Institute (CAS), ChinaCopyright © 2022 Li, Ma, Yang, Liu, Chen and Ding. This is an open-access article distributed under the terms of the Creative Commons Attribution License (CC BY). The use, distribution or reproduction in other forums is permitted, provided the original author(s) and the copyright owner(s) are credited and that the original publication in this journal is cited, in accordance with accepted academic practice. No use, distribution or reproduction is permitted which does not comply with these terms.
*Correspondence: Su Yang, eWFuZ3N1QGNtYS5nb3YuY24=; Ge Liu, bGl1Z2VAY21hLmdvdi5jbg==
† These authors have contributed equally to this work
Disclaimer: All claims expressed in this article are solely those of the authors and do not necessarily represent those of their affiliated organizations, or those of the publisher, the editors and the reviewers. Any product that may be evaluated in this article or claim that may be made by its manufacturer is not guaranteed or endorsed by the publisher.
Research integrity at Frontiers
Learn more about the work of our research integrity team to safeguard the quality of each article we publish.