 Hongkun Ji
- School of Statistics and Management, Shanghai University of Finance and Economics, Shanghai, China
China’s development has been accompanied by serious corruption and environmental pollution. Corruption is particularly prevalent in the energy sector, where it can bring very substantial benefits. However, corruption in the energy sector can lead to serious misallocation of energy, resulting in wasteful and inefficient use of energy. With the rise of the anti-corruption campaign, there is an urgent need to explore the impact of the anti-corruption campaign (ACC) on energy efficiency (EE). This paper investigates whether and how the ACC affects EE in China. Leveraging a staggered difference-in-differences (DID) model, we estimate the causal effect of the ACC in China on EE. Our results indicate that the ACC significantly improves EE, which is robust to a battery of robustness tests, such as parallel trend test, placebo test, excluding other policies, and substituting the explained variable. The positive relationship is correlated to reducing rent-seeking behavior, promoting innovation capacities, and upgrading industrial structure within a city. The heterogeneous results suggest that the effect of the ACC on EE improvement is more pronounced in big cities, cities located in the central, cities with high fiscal expenditures and low R&D expenditures. The results of this paper show that we must be tenacious in the anti-corruption campaign to establish a clean government and increase energy efficiency in order to achieve sustainable development.
1 Introduction
Corruption is a critical concern around the world, especially for China, the largest developing country in the world, as it generates lots of rent-seeking behavior, and impedes the long-term economic growth and social justice (Aidt, 2016; Kong and Qin, 2021). Since the 18th National Congress of the Communist Party of China (CPC) in 2012, President Xi of China puts forward “Eight Rules” to regulate officials’ behavior and kicks off the anti-corruption campaign (ACC). Unlike previous anti-corruption campaign, this one is resolute and unprecedented in its intensity, inevitably having profound effects on all kinds of social activities. At present, much literature has studied the relationship between the ACC and economic development and environmental outcomes. However, given that China is the largest energy consuming country in the world, whether and how the ACC affects energy efficiency (EE) is rarely explored.
Along with the economic development, the massive energy consumption also imposes a severe burden on the ecological environment (Bao and Chen, 2017). According to statistics, China’s carbon dioxide emissions account for nearly 30% of the total global carbon dioxide emissions in 2020. China becomes the world’s largest energy consumer and carbon dioxide emitter (Yu, 2021). The 17th CPC National Congress points out that people and nature should live in harmony, and accelerate the construction of a resource-saving and environment-friendly society. Economic development needs to consider the ecological environment protection, and only green development is sustainable development. Therefore, it is imperative to improve energy efficiency.
Corruption is especially prevalent in the energy sector. Numerous enterprises cannot develop without energy, and because the power to distribute energy is concentrated in government officials, enterprises are likely to pay bribes to government officials in order to obtain more energy, while government officials are likely to benefit financially from corruption. The impact of corruption on energy efficiency might have twofold consequences. The “greasing the wheel” hypothesis suggests that corruption might help firms overcome inefficient regulation and improve their operational efficiency. Using data set of 73 countries, Egger and Winner (2005) find that corruption can be beneficial in administrative efficiency. Pierre-Guillaume and Laurentand (2010) construct a regression model using three measures of corruption and five measures of other aspects of governance, and the results show that corruption may be positively associated with efficiency in countries where institutions are ineffective. Covering a maximum of 43 countries over the 2003–2005 period, Dreher and Gassebner (2011) reveal that corruption reduces the negative impact of regulations on entrepreneurship in highly regulated economics, and increase the efficiency of market entry for entrepreneurial firms. For the energy efficiency of interest in this paper, some small and new-emerging industries with advanced energy techniques gain access to the market by specific means. In this way, corruption may improve energy efficiency. However, more studies show that the impact of corruption is negative. Corruption allows firms to evade high environmental taxes by obtaining government protection through rent-seeking, which leads to a significant overall reduction in eco-efficiency (López and Mitra, 2000). Based on the data from 2006 to 2016, Wang et al. (2020) find that corruption can directly affect eco-efficiency and can also reduce eco-efficiency by reducing economic efficiency (Wang et al., 2020). Corruption can exacerbate the misallocation of resources (Yang et al., 2018). For places with a surplus of energy, corruption brings about wasteful and inefficient use of energy (Lu et al., 2021). The anti-corruption campaign makes it impossible for companies with low production or high energy consumption to bribe officials and establish political connections anymore, so they must exit the market (Liu et al., 2021). The closure of these companies reduces the inefficient use of energy, and thus increases energy efficiency. Based on the above references, we can conclude that the impact of the corruption or anti-corruption on environment, operational efficiency and eco-efficiency is likely to be twofold. However, basically no studies have analyzed the impact of the anti-corruption campaign on energy efficiency and through what channels it affects energy efficiency. Furthermore, the existing literature is limited to measuring anti-corruption using only a few indicators, which does not allow for a comprehensive assessment of the impact of anti-corruption. The direct and indirect effects of anti-corruption on energy efficiency are complex, and it is not easy to assess the impact of anti-corruption objectively and comprehensively on energy efficiency, so we should further study and give some suggestions.
This paper investigates the causal effect of the anti-corruption campaign on energy efficiency, and plausible mechanisms. We also study the heterogeneous impacts of the anti-corruption campaign on energy efficiency in different cities. In this paper, we study the ACC conducted by a central inspection team led by the Central Commission for Discipline Inspection (CCDI), and the ACC can be treated as an external impact and a quasi-natural experiment. Based on the panel data of 273 prefecture-level cities ranging from 2010 to 2018, we construct the staggered DID because the time of launching the ACC varies among provinces. Our econometric results show that the ACC significantly improves EE by 4.5%. We find that the ACC can improve EE by reducing rent-seeking behavior, promoting innovation capacities, and upgrading industrial structure. Finally, we also find that the effect of the ACC on EE improvement is more profound in big cities, cities located in the central, cities with high fiscal expenditures and low R&D expenditures.
A critical challenge for the models and results is that energy efficiency may be influenced by other determinants that we do not observe. We address this issue in two ways. First, we conduct a parallel trend test and demonstrate that the treatment group and the control group have the same trend prior to the ACC. Second, we also conduct a placebo test by randomizing the start time of the ACC in each province and conducting 500 fictitious treatments. These fictitious treatments show that the ACC does not have a significant effect on EE. Our study passes the placebo test. These two tests can show that the results of this paper are quite robust. In addition, we also conduct two other robustness tests: 1) we exclude the effect of policies such as the Carbon Emissions Trading Scheme (CETS), and the Energy-consuming Right Trading System (ERTS) on the regression results. 2) We introduce two other measures of EE to substitute the explained variable. In all the above robustness tests, the ACC still significantly improves EE.
The main contributions of this paper are as follows. First, we investigate the impact of the ACC on EE at the prefecture-level and find that the ACC can significantly increase EE. There is little literature examining the impact of the anti-corruption on energy efficiency. The existing literature closest to this research is Liu et al. (2021). Compared to Liu et al. (2021), this paper provides a more in-depth study of the impact of the anti-corruption on energy efficiency. Liu et al. (2021) use the ratio of the number of cases of corruption, bribery, and malfeasance to the number of civil servants to present the degree of corruption, and currently, there are many indices that portray corruption but none of them can measure the full kinds of corruption (Knack, 2006). However, this paper studies the effect of the anti-corruption campaign conducted by a central inspection team on energy efficiency. The core explanatory variable ACC in this paper is an external impact and a quasi-natural experiment, which allows this paper to study the impact of the anti-corruption more accurately, objectively, and comprehensively on energy efficiency. In addition, the method used in this paper is staggered DID, which can better address issues such as endogeneity compared to the fixed effects model in Liu et al. (2021). The result indicates that the ACC increases EE by 4.5%, which is significant at 5% significance level. Second, compared to Liu et al. (2021), this paper presents the overall picture of the effects of the ACC on EE, including plausible influencing channels and heterogeneous effects among different cities. We find that the ACC can improve EE by reducing rent-seeking behavior, promoting innovation capacities, and upgrading industrial structure. The effect of the ACC on EE improvement is more pronounced in big cities, cities located in the central, cities with high fiscal expenditures and low R&D expenditures. In the context of carbon neutrality, our results have substantial practical implications. Third, previous studies show that communication technologies (Murshed, 2020), green innovation (Sun et al., 2019), and technological innovation (Pan et al., 2019; Chen M. et al., 2021), can contribute significantly to improve EE. In addition, some objective factors such as energy poverty (Li W. et al., 2021) and factor price distortions (Ouyang et al., 2018) have an essential impact on EE. Regarding the influence of policies on EE, most scholars study from environmental policies, such as energy intensity constraint policy (Shao et al., 2019), environmental regulation (Wu et al., 2020) and emissions trading system (ETS) (Li S. et al., 2021). From a new perspective, this study illustrates that EE can be affected not only by environmental policies but also by anti-corruption policies. We expand on the factors that influence EE. Fourth, most of the past research focuses on the impact of anti-corruption on the economy and firms. Anti-corruption can promote economic development (Ehrlich and Lui, 1999; Drury et al., 2016). Anti-corruption makes firms’ investment choices more rational, discourages over-investment (Zhang et al., 2019), and promotes firms’ innovation (Gan and Xu, 2019). Our results contribute to the literature investigating the effects of anti-corruption.
The remainder of the paper is organized as follows: Section 2 presents the background of China’s anti-corruption campaign. Section 3 constructs the model, explains the model’s variables in detail, and presents the data sources. Section 4 presents the baseline regression results of the model and the robustness tests. Section 5 is the analysis of the mechanism and heterogeneity of the ACC on EE. Section 6 is some conclusions and discussions.
2 Institutional background
2.1 Anti-corruption campaign in China
Over the past few decades, China’s rapid economic development has been accompanied by an increasingly severe corruption problem. Corruption can bring serious harm to society, the economy, and the environment. Corruption extends to all sectors of society, and the energy sector is particularly affected by corruption. Energy-intensive industries are considered the ones that need the most attention and are most prone to corruption problems (Zhan, 2015). The main reason for this is that the energy sector is prone to monopolistic industries, bringing substantial economic benefits. Also, the energy sector lacks a solid regulatory system (Chen X. et al., 2021), and government officials in China control the country’s energy resources. Due to corruption, government officials can use their power to influence the free flow of production factors, which can exacerbate the resource mismatch problem (Aidt, 2016; Restuccia and Rogerson, 2017; Pailler, 2018). In conclusion, corruption leads to the resource misallocation and energy inefficiency (Wei and Li, 2017; Lu et al., 2021).
Although the previous anti-corruption campaigns repeatedly criticized the country’s grave corruption issues and attempted to address them, the benefits of such efforts were little, and high government officials were seldom affected (Zhou et al., 2020; Kong and Qin, 2021). Since the 18th CPC National Congress, Xi Jinping has placed a high priority on the punishment of corruption. Unlike previous transient and uncritical anti-corruption campaigns, this one is resolute and thorough (Xu and Yano, 2017). After the 18th CPC National Congress, a central inspection team led by Wang Qishan goes deep into the provinces to carry out the anti-corruption campaign. In 2012, officials at all levels in Guangdong and Sichuan provinces are first investigated, marking the full-scale launch of the anti-corruption campaign. Over the next 3 years, investigations are launched in the remaining 29 provinces. The campaign is conducted in secret, and the investigated provinces are unaware of the inspection team’s plans until they announce its findings. At March 2018, China establishes the National Supervisory Commission, which is the highest-level anti-corruption body rich in Chinese characteristics.
2.2 The influence of the ACC on EE
The anti-corruption campaign eliminates firms’ opportunity to build illegal political and commercial ties via rent-seeking, allowing for a more reasonable and effective use of energy. China’s fast economic expansion and industrialization result in increasing environmental pollution, and as a result, we are very concerned about energy efficiency. The ACC will help improve EE in three ways as follows.
First, the anti-corruption campaign can reduce rent-seeking behavior. Since the establishment of the National Energy Administration in 2010, a total of two directors, two deputy directors, and eight divisional officials have been investigated by the CCDI for corruption. Many officials at different levels in China’s energy sector are removed from their posts as the ACC proceeds (Liu et al., 2021). The ACC eliminates rent-seeking opportunities, restoring fair market competition and a more rational resource allocation such as energy allocation (Guo et al., 2021). Because of the ACC, government officials can no longer seek benefits through their power and are more likely to allocate energy to businesses based on production efficiency and energy efficiency. Firms with low output and high energy consumption cannot receive government support and must exit the market. As a result, the ACC leads to a more rational energy allocation and increases energy efficiency.
Second, the anti-corruption campaign can promote innovation capacities. When corruption is prevalent, the society fills with all kinds of power deals, allowing social resources to flow into a few unscrupulous people. However, with the ACC, the social resources are distributed more fairly and reasonably. Many high-tech industries and young entrepreneurs can receive government support and concessions. The government supports and concessions contribute to capital inflow into these enterprises. Thus, the enterprises can invest more on research and development (R&D). As a result, the ACC in China, to some extent, promotes innovation in firms (Xu and Yano, 2017). With the improvement of innovation capacities, more and more green technologies are used in production and life, greatly reducing the carbon dioxide emissions and other pollutants (Wurlod and Noailly, 2018). All above can show that promoting innovation can promote energy efficiency (Fisher-Vanden et al., 2004; Lin and Moubarak, 2014).
Third, the anti-corruption campaign can upgrade industrial structure. The ACC makes many monopolies no longer sheltered by the government, and brings more and more companies new opportunities for development and promotes industrial transformation and upgrading. The secondary industry, which tends to be some processing and manufacturing industries, has the higher consumption and more serious waste of energy. The ACC protects the development of modern high-tech industries, transportation, service industries and social security, and facilitates the industrial structure upgrading from secondary industry to tertiary industry. Sun and Yuan (2015) find that cities with more manufacturing industries have poorer environments, while cities with more service industries have higher environmental quality and higher energy efficiency. When the industrial structure is transformed more from the secondary industry to the tertiary industry, there will be a corresponding reduction in energy consumption and waste, thus improving energy efficiency (Ang, 1994). Consequently, the industrial structure rationalization and upgrading substantially reduce carbon emissions and improve energy efficiency (Li et al., 2017). Based on the analysis above, the impacting mechanism of the anti-corruption campaign on energy efficiency is shown in Figure 1.

FIGURE 1. Impacting mechanism of the ACC.
3 Variables and identification strategy
3.1 Variables
3.1.1 Energy efficiency
Energy efficiency (EE) works as the explained variable in our empirical strategy. Some scholars measure EE using data envelopment analysis (DEA) or stochastic frontier analysis (SFA) (Ouyang et al., 2018). However, both DEA and SFA also have their disadvantages, like relying heavily on data and a small sample size. In this paper, we start from the macroeconomic implications, and extend the method of Renshaw (1981) and Patterson (1996) for measuring EE as follows:
i and t index i-th city and t-th year, respectively. Yit represents regional GDP of i-th city in t-th year. ECit represents total energy consumption of gas, oil, and electricity. Since different energy usage have different units, we transform the physical amounts of each energy usage into standard coal consumption by multiplying the coefficient of standard coal of each energy usage.1
3.1.2 Anti-corruption campaign
Anti-corruption campaign (ACC) works as the explanatory variable in our empirical strategy. First, the definitions of corruption and anti-corruption variable might be diverse in empirical strategies. For example, the corruption perception index (COR) and the incidence of corruption are used as a measure of corruption in a country (Duan et al., 2018; Ozturk et al., 2019). Additionally, some scholars use the number of corruption cases investigated as the measure of anti-corruption (Zhou et al., 2020). However, these kinds of measurement might encounter an endogenous problem as anti-corruption usually happens in those highly corrupting cities. Instead, increasing scholars generate a dummy variable to measure ACC (Zhang et al., 2019). In this paper, we use the province-specific shocks as a measurement of ACC. As shown in background, the anti-corruption investigation is conducted in secret, and the investigated provinces are not aware of the inspection team’s plans until the survey results are released, satisfying the exogenous requirement (Kong and Qin, 2021). Following Kong and Qin (2021), we generate the variable ACC according to their investigation year. That is, the ACC takes value one after a province is investigated and zero otherwise. And cities within a province have the same value. Table 1 shows the investigated years of each province in China.
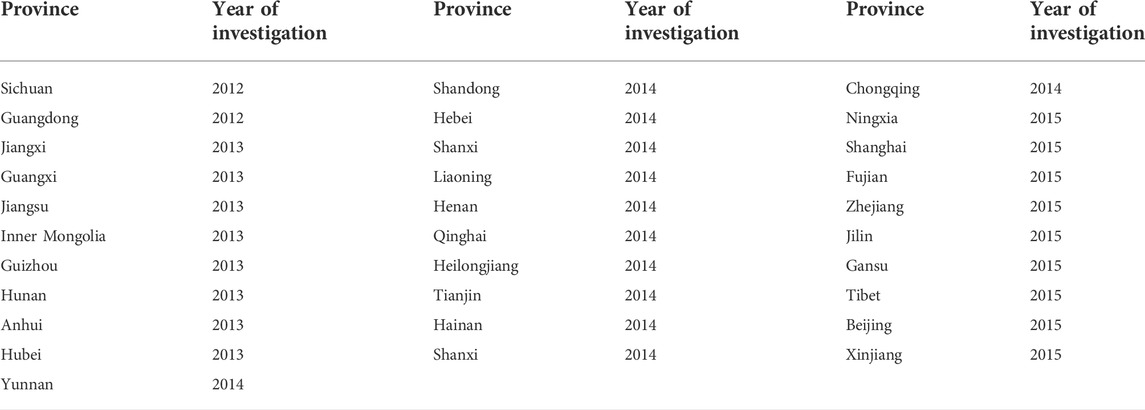
TABLE 1. The launching time of the ACC in each province.
3.1.3 Covariates
Energy efficiency may be affected by other factors except for the anti-corruption campaign. Therefore, we need to include a collection of prefecture-level variables to control these influences. In this paper, based on the results of previous studies, these variables include: 1) Economic development (pgdp), defined as natural logarithm of the GDP per capita in each city (Hu and Wang, 2006). Additionally, according to the Environmental Kuznets Curve (EKC), various phases of economic growth may have varying effects on EE (Dinda, 2004). As a result, we incorporate the quadratic form (pgdp2) to account for economic development. 2) Industrial structure (second_prop), defined as the proportion of the added value of the secondary industry to gross regional product (Wei et al., 2009). 3) Population size (million people) (lpop), defined as natural logarithm of total population of each city (Chen et al., 2018). 4) Urbanization rate (urban), defined as the proportion of the non-farm payrolls to the total employment (Moshiri, 2020). 5) Foreign direct investment (open), measured by natural logarithm of the share of foreign investment in GDP (Yan et al., 2019). 6) Education level (edu), measured by the number of college students per 1,000 people (Mills and Schleich, 2012).
3.2 Data source
The main data source is Statistical Yearbook of Chinese Cities, with a period ranging from 2010 to 2018. Patent data come from China National Intellectual Property Administration, aggregated at the prefecture level. Descriptive statistics of these variables are shown in Table 2. All variables denoted by nominal value are converted into the constant price of year 2010.
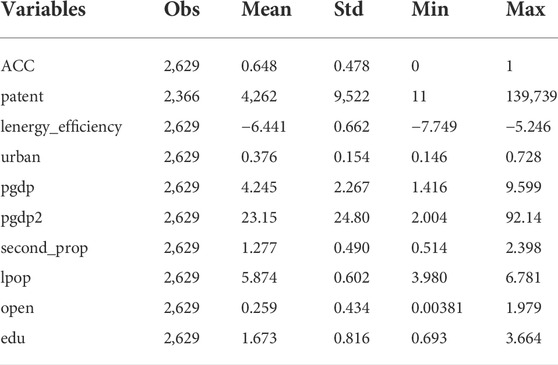
TABLE 2. Descriptive statistics.
3.3 Empirical strategy
Since the ACC is carried out in batches, we employ a staggered DID to estimate its effect on EE of prefecture-level cities. The identification strategy is constructed as follows:
i and t denote i-th city and t-th year, respectively. ACC is the core variable studied in this paper. We are concerned about the point estimate β1. The positive sign of β1 indicates the anti-corruption campaign in China contributes to improving energy efficiency, whereas the negative sign means the anti-corruption campaign impedes energy efficiency. Xit represents a vector of control variables, and θ is the corresponding coefficients. μi captures city-level fixed effects. trendt controls time trend effects.
4 Empirical results and analysis
4.1 Baseline results
The results of the baseline regression are shown in Table 3. The data in this paper are interpolated and complemented. If there is no data for the prefecture-level city corresponding to a variable, the sample is deleted. Table 3 assesses the underlying effect of the ACC on EE in 273 cities based on balanced panel data, controlling for fixed effects. And Table A1 is based on unbalanced data. Column (1–2) of Table 3 show that the ACC contributes to increasing EE whether includes the covariates or not. Specifically, after controlling the covariates, the result indicates that the ACC increases EE by 4.5% (e0.044-1), which is significant at 5% significance level. In summary, the anti-corruption campaign can significantly improve energy efficiency. Thus, our results suggest that when the anti-corruption campaign is implemented, the government regulates the energy sector more tightly and there are fewer incidents of corruption in the energy sector, blocking the collusion between business and government in the energy sector. The energy sector can allocate energy resources more rationally and efficiently, forcing highly polluting and energy-consuming enterprises to transition to clean energy and promoting the development of high-tech and energy-efficient enterprises, thus improving energy efficiency.
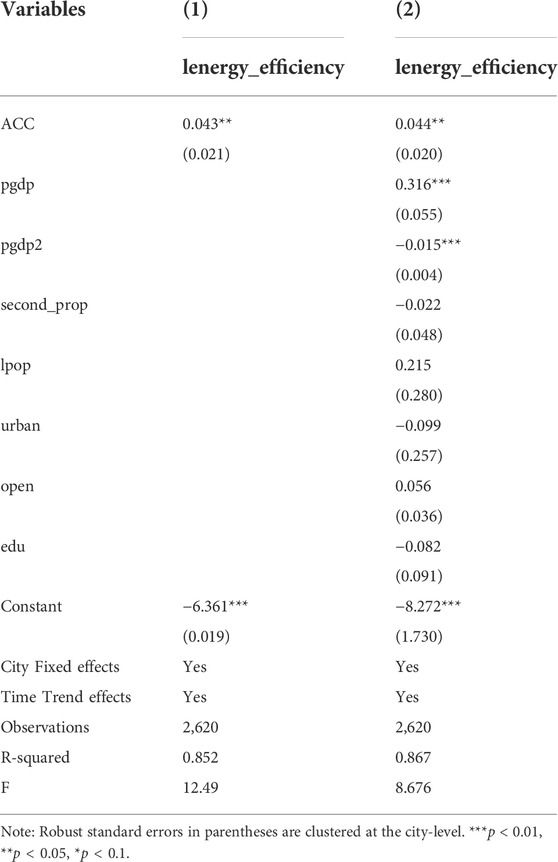
TABLE 3. Baseline results.
4.2 Robustness tests
In this section, we test the underlying assumptions that need to be satisfied by the model we construct. We conduct a parallel trend test, a placebo test, excluding other policies, replacing the explained variable, and other robustness test respectively, further demonstrating that the findings of this paper are robust and trustworthy.
4.2.1 Parallel trend test
One prerequisite requirement for using the staggered DID model is that the treatment group and the control group have the same trend before the policy is implemented. Based on the models of Beck et al. (2010) and Serfling (2016), we conduct an event study to investigate the dynamic effects of the ACC on EE. The parallel trend test model is constructed as follows:
i represents the city, t represents time, μi is individual fixed effects, trendt is time trend effects, and εit is residuals. I choose t as the base period in the parallel trend test.
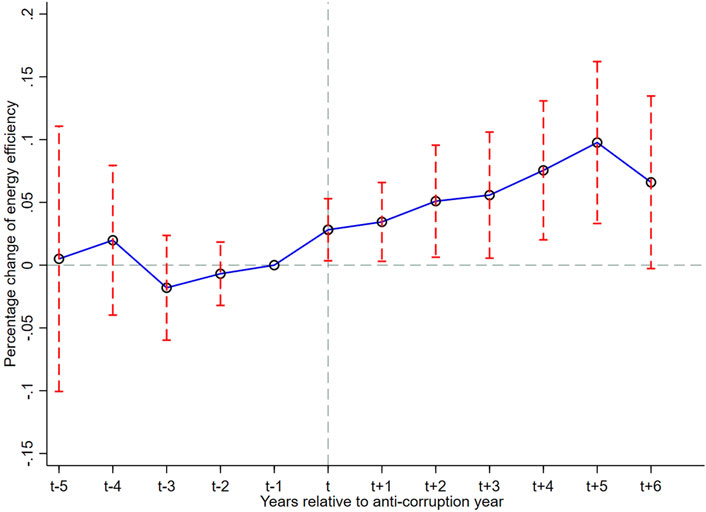
FIGURE 2. Parallel trend test.
4.2.2 Placebo test
Although the calculated coefficient indicates that the ACC enhances EE, it might be an occasional result determined by other ignored factors. To address this worry, following Jia et al. (2022) and Chen and Lin (2021), we use the placebo test to ensure that the ACC actually enhances EE rather than an occasional result. Concretely, we randomly select the time of anti-corruption campaign in each province to work as the “fictious treatment” group, and repeat the baseline regression by 500 times. Due to the fictitious nature of the produced treatment groups, the point estimate prior to the DID variable should be mainly zero. We plot the regression coefficient results of these 500 fictitious treatments as a probability density plot, as shown in Figure 3. As seen in the figure, the calculated point estimates for the fictitious treatment groups are generally zero, suggesting that the fictitious treatment groups have no substantial promotion impact on EE. In the baseline result, the true coefficient of the ACC variable is 0.044, much over the 5% threshold criterion for the estimated fictitious coefficients. Thus, the ACC’s improvement of EE is quite robust and not an occasional result.
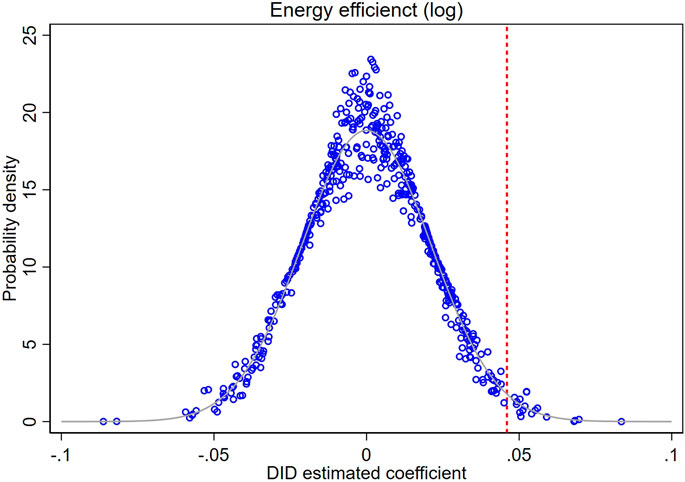
FIGURE 3. Placebo test..
4.2.3 Excluding other policies
Furthermore, the empirical results’ correctness and statistical significance may be challenged by other policies that can influence energy efficiency. We find that the Carbon Emissions Trading Scheme (CETS), and the Energy-consuming Right Trading System (ERTS) might influence our regression results. The CETS was first launched in 2013 in Beijing, Shanghai, Shenzhen, Tianjin, Chongqing, Hubei, and Guangdong provinces to explore market-based environmental regulation to reduce pollution emissions. The ERTS was first carried out in 2016 in Zhejiang, Fujian, Henan, and Sichuan provinces, aiming to solve the increasingly severe energy crisis and environmental problems. We exclude these highly possible affected cities and use subsamples to perform staggered DID regression. Column (1) of Table 4 illustrates the effect of the ACC on EE following the elimination of CETS’s pilot cities. Column (2) shows the estimated result after dropping ERTS’s pilot cities. Column (3) presents the result eliminating all possible affected cities by the two policies. We find that regardless of whether we exclude the effect of a single policy or all policies, the ACC continues to significantly improve EE, demonstrating the robustness of our results.
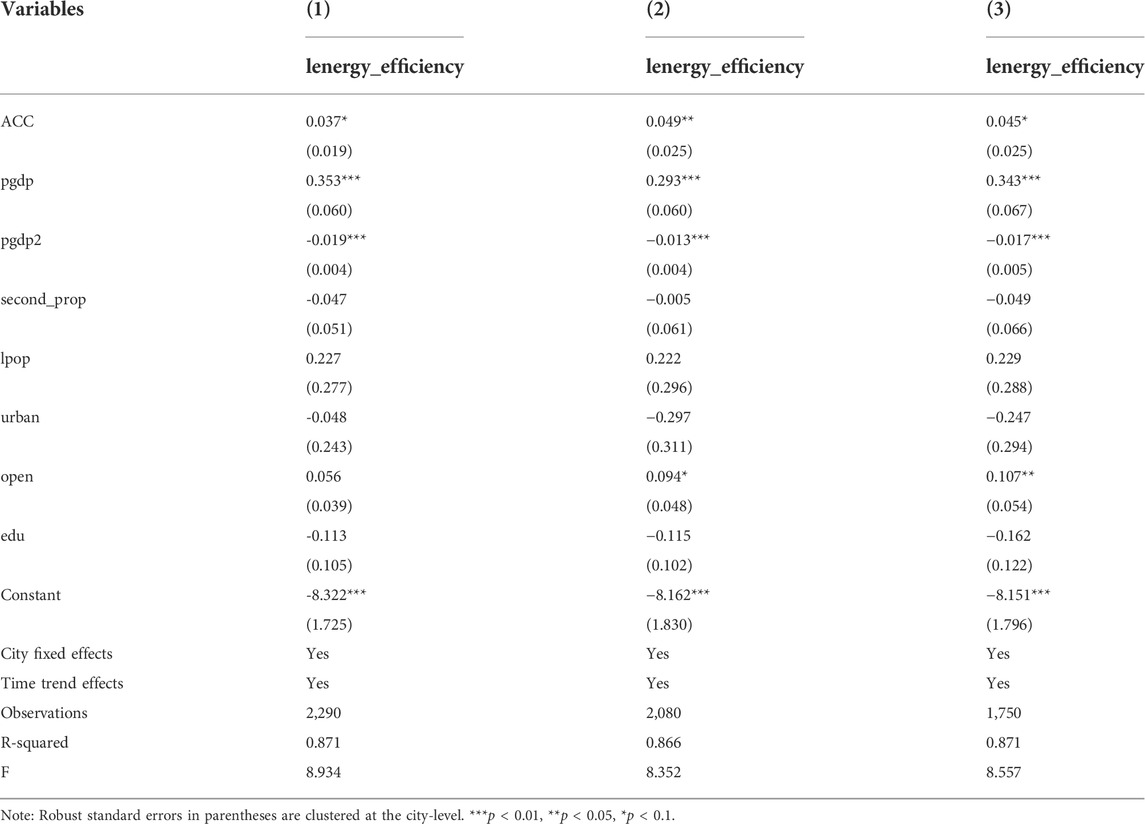
TABLE 4. Excluding other policies.
4.2.4 Substituting the explained variable
An increase in energy efficiency means that more output is produced per unit of energy (Patterson, 1996). We consider alternative measures of energy efficiency. The original energy efficiency is measured in terms of GDP output per unit of energy. Considering that energy consumption mainly comes from the secondary sector, we replace the GDP output with the value added of the secondary sector and the results are shown in column (1) of Table 5. At the same time, from the perspective of urban population, we consider the population that can be served per unit of energy and define energy efficiency as the ratio of population to energy consumption, and the results are shown in column (2). We can conclude that the ACC significantly improves EE whichever way we measure EE, which shows the robustness of our results.
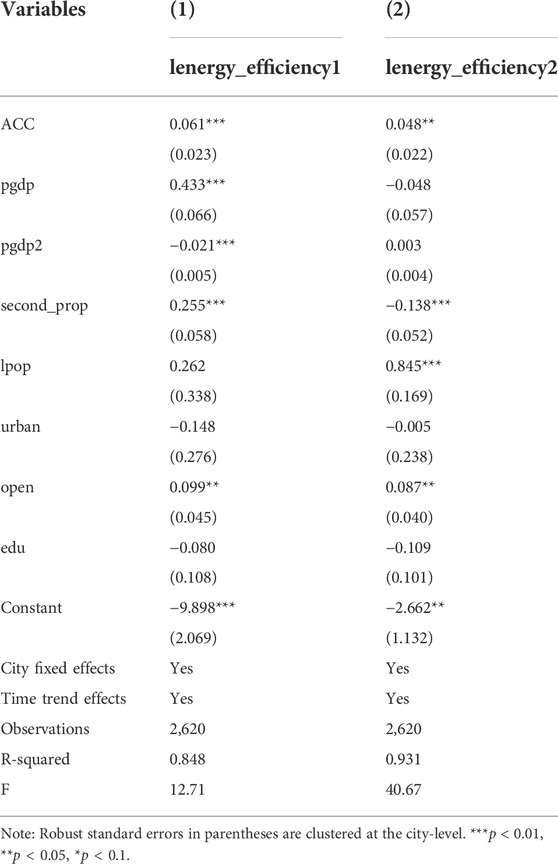
TABLE 5. Substituting the explained variable.
5 Further analysis
5.1 Mechanism analysis
In this section, we delve into the mechanisms of the effect of the ACC on EE. According to Section 2.2, we discuss the impact mechanism of the ACC on EE from three perspectives: reducing rent-seeking behavior, promoting innovation capacities, and upgrading industrial structure, which help further to understand the improvement effect of the ACC on EE.
5.1.1 Reducing rent-seeking behavior
Rent-seeking behavior refers to seeking economic rents and using government policies to profit without being productive, and is involved in many corruption cases (Zhang et al., 2019). The prepaid card is a critical indicator of rent-seeking behavior (Kong and Qin, 2021). Prepaid cards are issued by merchants such as shopping malls and restaurants, and the purchase of prepaid cards does not require the registration of personal information. Therefore, corrupt officials are not easily detected by the government when they use prepaid cards. The use of prepaid cards in local shopping malls and supermarkets can reflect local rent-seeking behavior. Also, one of the most critical features of prepaid cards is that they lead to an increase in deferred revenue. We determine the scope of the survey within 50 listed companies, and collect their annual deferred revenue data. Additionally, we regularize the deferred revenue data to annual city data, and define the deferred revenue as the variable defer. Following Kong and Qin (2021), we define the rent-seeking behavior as followings:
As shown in Column (1) of Table 6, the ACC help reduce rent-seeking behavior by 22.3% (1e-0.252), which is significant at the 5% significance level. At the same time, we also examine the differential impacts of anti-corruption campaign influences on energy efficiency in local cities with different severity of rent-seeking problems. Since 2011 is the eve of the anti-corruption campaign, we use the median deferred revenue in 2011 as a benchmark to divide the cities into a low rent-seeking group [Column (2) of Table 6] and a high rent-seeking group [Column (3) of Table 6]. From the results, we can conclude that the ACC in low rent-seeking cities does not significantly improve EE, while the ACC in high rent-seeking cities improves EE significantly. Reducing rent-seeking behavior facilitates the restoration of fair market competition, so that companies with high energy consumption and low production capacity must exit the market. Energy is more rationally allocated and less energy is wasted, leading to improving energy efficiency (Li et al., 2020). In addition, reducing rent-seeking behavior allows companies to focus more on improving their core technology and productivity, thus increasing energy efficiency (Guo et al., 2021).
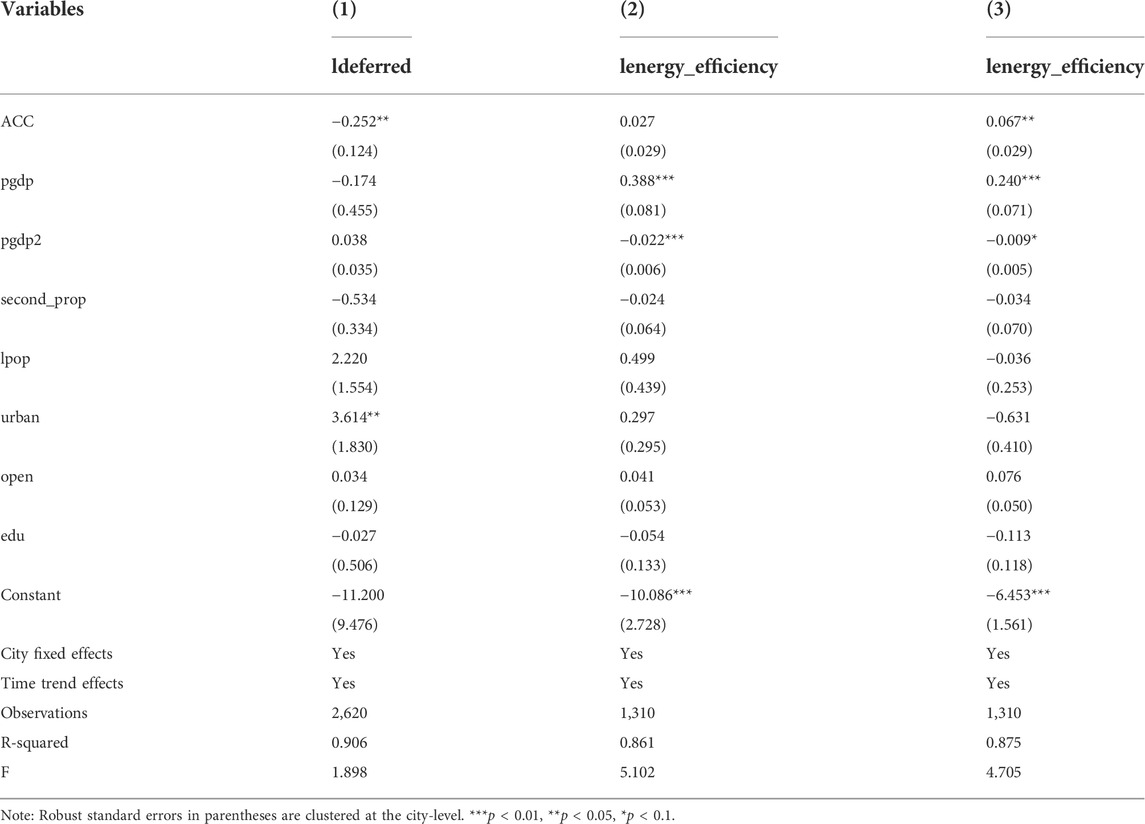
TABLE 6. Reducing rent-seeking behavior.
5.1.2 Innovation effect
Innovation has a dual purpose of fostering economic growth and mitigating negative environmental externalities, thus improving energy efficiency (Zhao et al., 2021). First, we use the logarithm of municipal government’s scientific and technology expenditure as a proportion of GDP (ltech_ex) to measure the city’s innovation capability. The more the government spends on science and technology, the more innovative the city will be. Column (1) of Table 7 shows that the ACC significantly improves the municipal government’s scientific and technology expenditure as a proportion of GDP. Second, we use the logarithm of the number of a city’s patent 2 applications and final approvals to measure the city’s innovation capability (He and Tian, 2013). The more the invention patents are, the stronger the innovation (Liu and Lin, 2019). The Column (2) of Table 7 shows that the ACC increases patents by 11% (e0.104-1), which is significant at the 1% significance level. In addition, we also examine the impact of the ACC on the number of patents in the next year. Column (3) shows that the ACC has a significant effect on increasing the number of patents within the next year. As a result, the ACC significantly increases the city’s innovation capacity. Innovative technologies are increasingly used in production and life, reducing the cost and consumption of energy extraction and transportation, reducing emissions of pollution, and improving energy efficiency (Fisher-Vanden et al., 2004; Wurlod and Noailly, 2018).

TABLE 7. Innovation effect and structure effect.
5.1.3 Structure effect
Additionally, the industrial structure has a considerable impact on energy efficiency (Ang, 1994). We use the ratio of secondary to tertiary industry to represent the industrial structure. Column (4) of Table 7 shows that the ACC reduces the ratio by 2%, which is significant at the 1% significance level. The secondary industry is mostly composed of conventional industries, which cause enormous quantities of energy consumption and pollution emissions (Yoon and Nadvi, 2018). The tertiary sector, with its higher concentration of high-tech and low-pollution enterprises, is more ecologically benign in comparison (Sun and Yuan, 2015). Thus, upgrading industrial structure often entails a reduction in the share of secondary industry and an increase in the share of tertiary industry (Cao et al., 2021). The result reveals that the ACC achieves the structure effect, thereby reducing energy consumption and waste, and improving energy efficiency.
5.2 Heterogeneity analysis
The impact of the ACC on EE can vary from city to city due to resource allocation, and geographic location, etc. According to the previously constructed model, it does not show the differences among these cities. In this paper, we divide cities into several groups with equal number of cities according to population scale, geographic location, fiscal expenditure, and R&D expenditure. We generate corresponding Dummyi variables (i = 0, 1, 2, Dummyi = 0 or 1) based on different characteristics of cities. The generated Dummyi variables are multiplied with the original ACC variable, and we put them into the model of the baseline regression. In addition, to avoid the dummy variable trap, we delete the ACC term in columns (1–4) in Table 8 (Li S. et al., 2021; Shi et al., 2021). This part explores the heterogeneous effects of the ACC on EE in different cities. We construct the following model for the heterogeneity analysis:
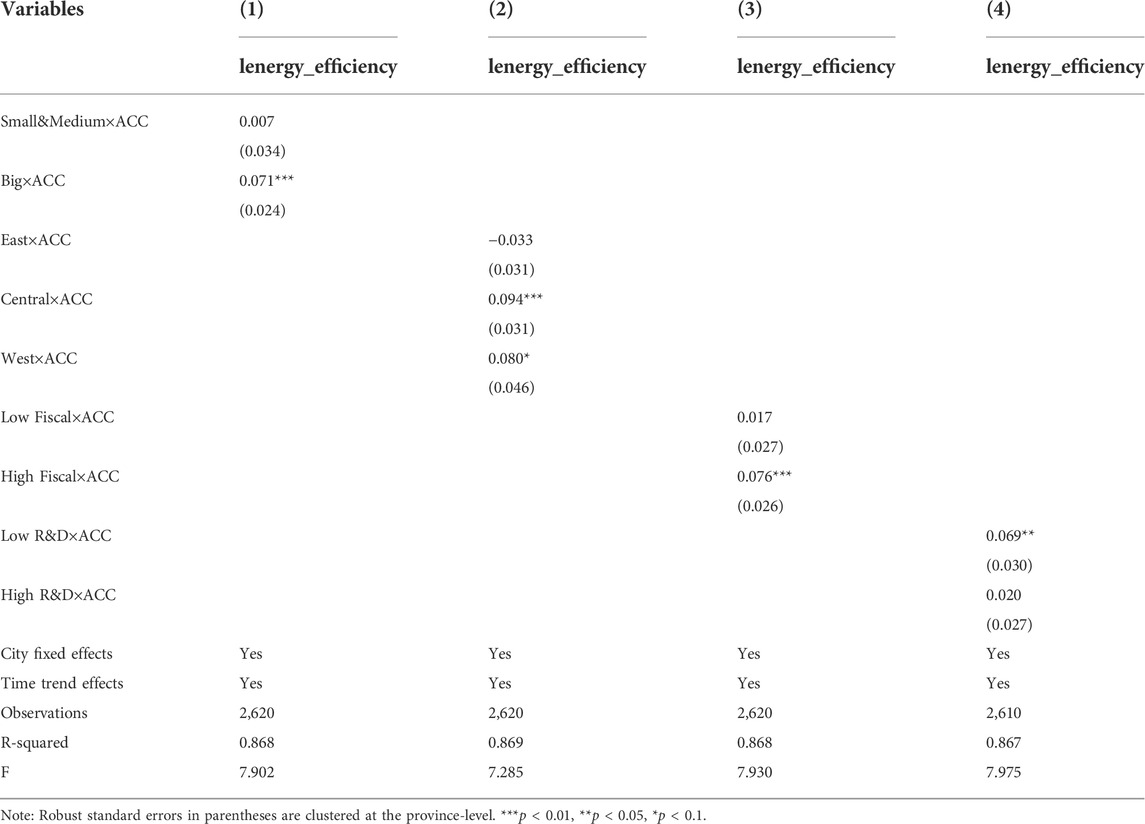
TABLE 8. Heterogeneous effects.
5.2.1 Size and location
The population size and geographic location of a city also have a significant impact on corruption and energy efficiency (Elliott et al., 2013; Saiz and Simonsohn, 2013; Chen et al., 2018). First, according to the population size 3 of urban areas, we divide cities into two groups: small and medium, and big. Column (1) shows that the effect of the ACC on EE improvement is significant in cities of big population size, whereas it is less pronounced in small and medium cities. Intuitively, the bigger the city, the worse the corruption problem is likely to be. And the stronger the anti-corruption campaign is likely to be in the bigger cities. Second, according to geographical locations, we divide the cities into three groups: eastern, central, and western regions 4. As can be seen from Column (2), the effect on EE improvement is significant in central and western cities, whereas it is more pronounced in central cities. The central and western regions are more polluted than the eastern regions, and there is more space for energy efficiency improvements. Additionally, the central regions have a higher concentration of high-tech firms concerned with environmental preservation than the western regions, which is more conducive to energy efficiency improvements.
5.2.2 Fiscal expenditure and R&D expenditure
We category the cities according to their fiscal conditions, since fiscal expenditure and R&D expenditure are critical for business growth (Arrow, 1971; Xu and Yang, 2022). We chose fiscal expenditures in 2011, before the anti-corruption campaign, as the benchmark and divide the cities into two equal parts according to the median fiscal expenditures. Similarly, we divide the cities into two equal parts using the ratio of R&D expenditures to fiscal expenditures. Column (3)–4) of Table 8 indicate that the improvement effect of the ACC on EE is more pronounced in cities with high fiscal expenditures and low R&D expenditures. After the anti-corruption campaign, the cities with low R&D investment in the past significantly increase their R&D expenditures, which leads to the ACC improving EE more significantly in the cities with low R&D expenditures. Increased R&D expenditures may boost firms’ capital investment in R&D activities, which promotes the creation of more low-carbon, environmentally friendly, and green advanced technologies, thus enhancing enterprises’ innovative potential and energy efficiency (Cheng et al., 2020; Farmer, 2022; Haider and Mishra, 2021; Zhang and Jin, 2021). In addition, fiscal expenditures provide the necessary conditions for greater improvements in energy efficiency. As a result, the ACC has a considerable beneficial influence on EE, both statistically and economically, in cities with strong fiscal support.
6 Conclusions and discussions
In this paper, we construct a staggered DID model to explore the impact of the anti-corruption campaign on energy efficiency in China by using the panel data of 273 prefecture-level cities from 2010 to 2018. Our conclusions are as follows: 1) The baseline estimated results show that the ACC significantly improve EE by 4.5%. And the baseline findings are sufficiently robust when subjected to parallel trend test, placebo test, excluding other policies, and substituting the explained variable. As a result, the ACC in China not only combats corruption and upholds social justice, but also contributes significantly to energy efficiency and sustainable development. 2) Underlying mechanism reveals that the ACC can improve EE by reducing rent-seeking behavior, promoting innovation capacities, and upgrading industrial structure. 3) As for the heterogeneous effect of the ACC on EE, the improvement effect on EE is more pronounced in big cities, cities located in the central, cities with high fiscal expenditures and low R&D expenditures.
Over the past years, China’s development has been accompanied by serious corruption and high pollution emissions. China stresses the need to unswervingly promote the fight against corruption and continuously achieve the strategic goal of not daring to corrupt, not being able to corrupt and not wanting to corrupt. At the same time, China is under tremendous pressure to achieve a carbon peak by 2030 and carbon neutrality by 2060 (Shi et al., 2022). Under these multiple pressures, our results show that China must be tenacious in the anti-corruption campaign, which will not only contribute to a clean government, but also to energy efficiency for sustainable development. The anti-corruption campaign prevents government officials from gaining benefits by establishing ties with businesses, leaving officials to advance and gain benefits by allocating resources such as energy more rationally and regulating businesses more closely to improve their own performance, all of which is conducive to improving energy efficiency. While carrying out the anti-corruption campaign, the government should speed up the upgrading of the industrial structure and the construction of the innovation system. The government should advocate for a tough crackdown on energy-intensive industries that benefit from government protection obtained via bribes, and increase fiscal support for new energy, big data, high-tech and other clean industries. Additionally, the government should vigorously promote business innovation, increase the proportion of knowledge-intensive service industries, and fully use the “Porter Hypothesis” innovation compensation effect (Ambec et al., 2013). This study may enlighten developing countries about the need of reducing environmental pollution, improving energy efficiency, and achieving carbon neutrality by encouraging the anti-corruption campaign.
Although this paper is the first to investigate the impact of the anti-corruption campaign conducted by a central inspection team led by the CCDI on energy efficiency at prefecture-level cities, it has several limitations. Due to the limitation of data availability, this paper only uses prefecture-level city data from 2010 to 2018. With latest anti-corruption campaigns and latest available data, scholars can further investigate the long-term effects or time-varying effects of anti-corruption campaigns on energy efficiency. In addition, this paper only focuses on the impact of the anti-corruption campaign on energy efficiency, when in fact we could pay more attention to the impact of the anti-campaign on other sustainability indicators, such as decarbonization efficiency (Zhang et al., 2022), etc. This can give us a more comprehensive understanding of the significance of the anti-corruption campaign on sustainable development. At the same time, future scholars can also focus on key emission sectors, such as the building sector (Xiang et al., 2022), and can explore the different impacts of the anti-corruption campaign on energy saving and emission reduction in different industries.
Data availability statement
The data analyzed in this study is subject to the following licenses/restrictions: The datasets used and analyzed during the current study are available from the corresponding author on reasonable request. Requests to access these datasets should be directed to HJ, amloa0AxNjMuc3VmZS5lZHUuY24=.
Author contributions
HJ developed the conceptual framework, prepared and processed the data, wrote the manuscript, and supervised the final manuscript.
Conflict of interest
The author declares that the research was conducted in the absence of any commercial or financial relationships that could be construed as a potential conflict of interest.
Publisher’s note
All claims expressed in this article are solely those of the authors and do not necessarily represent those of their affiliated organizations, or those of the publisher, the editors and the reviewers. Any product that may be evaluated in this article, or claim that may be made by its manufacturer, is not guaranteed or endorsed by the publisher.
Footnotes
1Due to availability of data, we use the energy usage from three primary sources as the amount of energy consumption. In fact, electricity usage also reflects coal consumption, as most of them comes from thermal power. The coefficient of gas to standard coal is 1.2143 kg standard coal per kilogram. The coefficient of oil to standard coal is 1.4286 kg standard coal per kilogram. The coefficient of electricity to standard coal is 0.1229 kg standard coal per kilowatt-hour.
2There are three main kinds of patents: invention patent, utility model patent, and design patent. Considering that the design patent involves limited technological advances, only the logarithm of invention patents plus utility model patents plus one is taken as the patent variable.
3Big cities are defined as those with a population of more than three million urban residents, and small and medium cities are other cities.
4Eastern regions include: Hebei, Liaoning, Jiangsu, Zhejiang, Fujian, Guangdong, Shandong, Hainan province; Central regions include: Heilongjiang, Jilin, Shanxi, Anhui, Jiangxi, Henan, Hubei, Hunan province; Western regions include: Inner Mongolia, Guangxi, Sichuan, Guizhou, Yunnan, Xizang, Shanxi, Gansu, Qinghai, Ningxia and Xinjiang, Tibet province.
Appendix
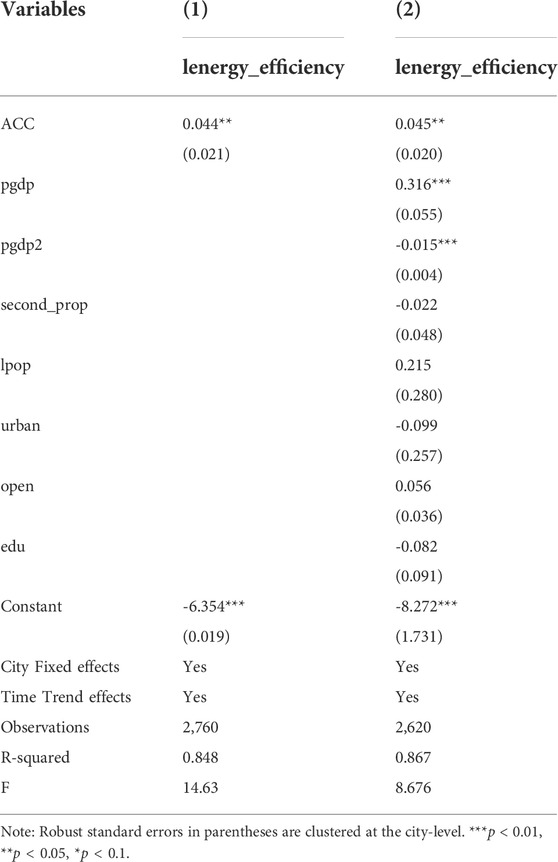
TABLE A1. Baseline results based on the unbalanced panel.
References
Aidt, T. S. (2016). Rent seeking and the economics of corruption. Const. Polit. Econ. 27, 142–157. doi:10.1007/s10602-016-9215-9
Ambec, S., Cohen, M. A., Elgie, S., and Lanoie, P. (2013). The porter hypothesis at 20: Can environmental regulation enhance innovation and competitiveness?. Rev. Environ. Econ. Policy 7, 2–22. doi:10.1093/reep/res016
Ang, B. W. (1994). Decomposition of industrial energy consumption: The energy intensity approach. Energy Econ. 16, 163–174. doi:10.1016/0140-9883(94)90030-2
Arrow, K. J. (1971). “The economic implications of learning by doing,” in Readings in the theory of growth (Springer), 131–149.
Bao, C., and Chen, X. (2017). Spatial econometric analysis on influencing factors of water consumption efficiency in urbanizing China. J. Geogr. Sci. 27, 1450–1462. doi:10.1007/s11442-017-1446-9
Beck, T., Levine, R., and Levkov, A. (2010). Big bad banks? The winners and losers from bank deregulation in the United States. J. Finance 65, 1637–1667. doi:10.1111/j.1540-6261.2010.01589.x
Cao, X., Deng, M., and Li, H. (2021). How does e-commerce city pilot improve green total factor productivity? Evidence from 230 cities in China. J. Environ. Manag. 289, 112520. doi:10.1016/j.jenvman.2021.112520
Chen, J., Wang, P., Cui, L., Huang, S., and Song, M. (2018). Decomposition and decoupling analysis of CO2 emissions in OECD. Appl. Energy 231, 937–950. doi:10.1016/j.apenergy.2018.09.179
Chen, M., Sinha, A., Hu, K., and Shah, M. I. (2021a). Impact of technological innovation on energy efficiency in industry 4.0 era: Moderation of shadow economy in sustainable development. Technol. Forecast. Soc. Change 164, 120521. doi:10.1016/j.techfore.2020.120521
Chen, X., Chen, G., Lin, M., Tang, K., and Ye, B. (2021b). How does anti-corruption affect enterprise green innovation in China's energy-intensive industries? Environ. Geochem. Health 44, 2919–2942. doi:10.1007/s10653-021-01125-4
Chen, X., and Lin, B. (2021). Towards carbon neutrality by implementing carbon emissions trading scheme: Policy evaluation in China. Energy Policy 157, 112510. doi:10.1016/j.enpol.2021.112510
Cheng, S., Fan, W., Meng, F., Chen, J., Liang, S., Song, M., et al. (2020). Potential role of fiscal decentralization on interprovincial differences in CO2 emissions in China. Environ. Sci. Technol. 55, 813–822. doi:10.1021/acs.est.0c04026
Dinda, S. (2004). Environmental Kuznets curve hypothesis: A survey. Ecol. Econ. 49, 431–455. doi:10.1016/j.ecolecon.2004.02.011
Dreher, A., and Gassebner, M. (2011). Greasing the wheels? The impact of regulations and corruption on firm entry. Public Choice 155, 413–432. doi:10.1007/s11127-011-9871-2
Drury, A. C., Krieckhaus, J., and Lusztig, M. (2016). Corruption, democracy, and economic growth. Int. Political Sci. Rev. 27, 121–136. doi:10.1177/0192512106061423
Duan, H., Snyder, T., and Yuan, W. (2018). Corruption, economic development, and auto loan delinquency: Evidence from China. J. Econ. Bus. 99, 28–38. doi:10.1016/j.jeconbus.2018.08.001
Egger, P., and Winner, H. (2005). Evidence on corruption as an incentive for foreign direct investment. Eur. J. political Econ. 21, 932–952. doi:10.1016/j.ejpoleco.2005.01.002
Ehrlich, I., and Lui, F. T. (1999). Bureaucratic corruption and endogenous economic growth. J. Political Econ. 107, S270–S293. doi:10.1086/250111
Elliott, R. J., Sun, P., and Chen, S. (2013). Energy intensity and foreign direct investment: A Chinese city-level study. Energy Econ. 40, 484–494. doi:10.1016/j.eneco.2013.08.004
Farmer, J. L. (2022). State-level influences on community-level municipal sustainable energy policies. Urban Aff. Rev. 58, 1065–1095. doi:10.1177/1078087421995262
Fisher-Vanden, K., Jefferson, G. H., Liu, H., and Tao, Q. (2004). What is driving China’s decline in energy intensity? Resour. Energy Econ. 26, 77–97. doi:10.1016/j.reseneeco.2003.07.002
Gan, W., and Xu, X. (2019). Does anti-corruption campaign promote corporate R&D investment? Evidence from China. Finance Res. Lett. 30, 292–296. doi:10.1016/j.frl.2018.10.012
Guo, J., Wang, Y., and Yang, W. (2021). China's anti-corruption shock and resource reallocation in the energy industry. Energy Econ. 96, 105182. doi:10.1016/j.eneco.2021.105182
Haider, S., and Mishra, P. P. (2021). Does innovative capability enhance the energy efficiency of Indian iron and steel firms? A bayesian stochastic frontier analysis. Energy Econ. 95, 105128. doi:10.1016/j.eneco.2021.105128
He, J. J., and Tian, X. (2013). The dark side of analyst coverage: The case of innovation. J. Financial Econ. 109, 856–878. doi:10.1016/j.jfineco.2013.04.001
Hu, J.-L., and Wang, S.-C. (2006). Total-factor energy efficiency of regions in China. Energy Policy 34, 3206–3217. doi:10.1016/j.enpol.2005.06.015
Jia, P., Zhuang, J., Vaca Lucero, A. M., and Li, J. (2022). Does the energy consumption revolution improve the health of elderly adults in rural areas? Evidence from China. Sci. Total Environ. 807, 150755. doi:10.1016/j.scitotenv.2021.150755
Knack, S. F. (2006). Measuring corruption in eastern europe and central asia: A critique of the cross-country indicators. Washington: World Bank Publications.
Kong, D., and Qin, N. (2021). China’s anticorruption campaign and entrepreneurship. J. Law Econ. 64, 153–180. doi:10.1086/711313
Li, D. D., Rishi, M., and Bae, J. H. (2020). Green official development aid and carbon emissions: Do institutions matter? Environ. Dev. Econ. 26, 88–107. doi:10.1017/s1355770x20000170
Li, S., Liu, J., and Shi, D. (2021a). The impact of emissions trading system on corporate energy efficiency: Evidence from a quasi-natural experiment in China. Energy 233, 121129. doi:10.1016/j.energy.2021.121129
Li, W., Chien, F., Hsu, C.-C., Zhang, Y., Nawaz, M. A., Iqbal, S., et al. (2021b). Nexus between energy poverty and energy efficiency: Estimating the long-run dynamics. Resour. Policy 72, 102063. doi:10.1016/j.resourpol.2021.102063
Li, W., Wang, W., Wang, Y., and Qin, Y. (2017). Industrial structure, technological progress and CO2 emissions in China: Analysis based on the STIRPAT framework. Nat. Hazards (Dordr). 88, 1545–1564. doi:10.1007/s11069-017-2932-1
Lin, B., and Moubarak, M. (2014). Renewable energy consumption – economic growth nexus for China. Renew. Sustain. Energy Rev. 40, 111–117. doi:10.1016/j.rser.2014.07.128
Liu, J., Guo, J., Liu, X., Bai, X., and Taghizadeh-Hesary, F. (2021). Does anti-corruption policy influence energy efficiency in China? Front. Energy Res. 9. doi:10.3389/fenrg.2021.634556
Liu, K., and Lin, B. Q. (2019). Research on influencing factors of environmental pollution in China: A spatial econometric analysis. J. Clean. Prod. 206, 356–364. doi:10.1016/j.jclepro.2018.09.194
López, R., and Mitra, S. (2000). Corruption, pollution, and the Kuznets environment curve. J. Environ. Econ. Manag. 40, 137–150. doi:10.1006/jeem.1999.1107
Lu, S., Zhang, X., Peng, H., Skitmore, M., Bai, X., and Zheng, Z. (2021). The energy-food-water nexus: Water footprint of Henan-Hubei-Hunan in China. Renew. Sustain. Energy Rev. 135, 110417. doi:10.1016/j.rser.2020.110417
Mills, B., and Schleich, J. (2012). Residential energy-efficient technology adoption, energy conservation, knowledge, and attitudes: An analysis of European countries. Energy Policy 49, 616–628. doi:10.1016/j.enpol.2012.07.008
Moshiri, S. (2020). Consumer responses to gasoline price and non-price policies. Energy Policy 137, 111078. doi:10.1016/j.enpol.2019.111078
Murshed, M. (2020). An empirical analysis of the non-linear impacts of ICT-trade openness on renewable energy transition, energy efficiency, clean cooking fuel access and environmental sustainability in South Asia. Environ. Sci. Pollut. Res. 27, 36254–36281. doi:10.1007/s11356-020-09497-3
Ouyang, X., Wei, X., Sun, C., and Du, G. (2018). Impact of factor price distortions on energy efficiency: Evidence from provincial-level panel data in China. Energy Policy 118, 573–583. doi:10.1016/j.enpol.2018.04.022
Ozturk, I., Al-Mulali, U., and Solarin, S. A. (2019). The control of corruption and energy efficiency relationship: An empirical note. Environ. Sci. Pollut. Res. 26, 17277–17283. doi:10.1007/s11356-019-05016-1
Pailler, S. (2018). Re-election incentives and deforestation cycles in the Brazilian Amazon. J. Environ. Econ. Manag. 88, 345–365. doi:10.1016/j.jeem.2018.01.008
Pan, X., Ai, B., Li, C., Pan, X., and Yan, Y. (2019). Dynamic relationship among environmental regulation, technological innovation and energy efficiency based on large scale provincial panel data in China. Technol. Forecast. Soc. Change 144, 428–435. doi:10.1016/j.techfore.2017.12.012
Patterson, M. G. (1996). What is energy efficiency? Concepts, indicators and methodological issues. Energy policy 24, 377–390. doi:10.1016/0301-4215(96)00017-1
Pierre-Guillaume, M., and Laurent, W. (2010). Is corruption an efficient grease? World Dev. 38, 244–259. doi:10.1016/j.worlddev.2009.06.004
Renshaw, E. F. (1981). Energy efficiency and the slump in labour productivity in the USA. Energy Econ. 3, 36–42. doi:10.1016/0140-9883(81)90005-0
Restuccia, D., and Rogerson, R. (2017). The causes and costs of misallocation. J. Econ. Perspect. 31, 151–174. doi:10.1257/jep.31.3.151
Saiz, A., and Simonsohn, U. (2013). Proxying for unobservable variables with internet document-frequency. J. Eur. Econ. Assoc. 11, 137–165. doi:10.1111/j.1542-4774.2012.01110.x
Serfling, M. (2016). Firing costs and capital structure decisions. J. Finance 71, 2239–2286. doi:10.1111/jofi.12403
Shao, S., Yang, Z., Yang, L., and Ma, S. (2019). Can China's energy intensity constraint policy promote total factor energy efficiency? Evidence from the industrial sector. Energy J. 40. doi:10.5547/01956574.40.4.ssha
Shi, D., Bu, C., and Xue, H. (2021). Deterrence effects of disclosure: The impact of environmental information disclosure on emission reduction of firms. Energy Econ. 104, 105680. doi:10.1016/j.eneco.2021.105680
Shi, D., Yang, Z., and Ji, H. (2022). Energy target-based responsibility system and corporate energy efficiency: Evidence from the eleventh Five Year Plan in China. Energy Policy 169, 113214. doi:10.1016/j.enpol.2022.113214
Sun, H., Edziah, B. K., Sun, C., and Kporsu, A. K. (2019). Institutional quality, green innovation and energy efficiency. Energy Policy 135, 111002. doi:10.1016/j.enpol.2019.111002
Sun, P., and Yuan, Y. (2015). Industrial agglomeration and environmental degradation: Empirical evidence in Chinese cities. Pac. Econ. Rev. 20, 544–568. doi:10.1111/1468-0106.12101
Wang, S., Zhao, D., and Chen, H. (2020). Government corruption, resource misallocation, and ecological efficiency. Energy Econ. 85, 104573. doi:10.1016/j.eneco.2019.104573
Wei, C., and Li, C.-Z. (2017). Resource misallocation in Chinese manufacturing enterprises: Evidence from firm-level data. J. Clean. Prod. 142, 837–845. doi:10.1016/j.jclepro.2016.04.083
Wei, C., Ni, J., and Shen, M. (2009). Empirical analysis of provincial energy efficiency in China. China & World Econ. 17, 88–103. doi:10.1111/j.1749-124x.2009.01168.x
Wu, H., Hao, Y., and Ren, S. (2020). How do environmental regulation and environmental decentralization affect green total factor energy efficiency: Evidence from China. Energy Econ. 91, 104880. doi:10.1016/j.eneco.2020.104880
Wurlod, J.-D., and Noailly, J. (2018). The impact of green innovation on energy intensity: An empirical analysis for 14 industrial sectors in OECD countries. Energy Econ. 71, 47–61. doi:10.1016/j.eneco.2017.12.012
Xiang, X., Ma, M., Ma, X., Chen, L., Cai, W., Feng, W., et al. (2022). Historical decarbonization of global commercial building operations in the 21st century. Appl. Energy 322, 119401. doi:10.1016/j.apenergy.2022.119401
Xu, G., and Yang, Z. (2022). The mechanism and effects of national smart city pilots in China on environmental pollution: Empirical evidence based on a DID model. Environ. Sci. Pollut. Res. 29, 41804–41819. doi:10.1007/s11356-021-18003-2
Xu, G., and Yano, G. (2017). How does anti-corruption affect corporate innovation? Evidence from recent anti-corruption efforts in China. J. Comp. Econ. 45, 498–519. doi:10.1016/j.jce.2016.10.001
Yan, D., Kong, Y., Ren, X., Shi, Y., and Chiang, S. (2019). The determinants of urban sustainability in Chinese resource-based cities: A panel quantile regression approach. Sci. Total Environ. 686, 1210–1219. doi:10.1016/j.scitotenv.2019.05.386
Yang, M., Yang, F., and Sun, C. (2018). Factor market distortion correction, resource reallocation and potential productivity gains: An empirical study on China's heavy industry sector. Energy Econ. 69, 270–279. doi:10.1016/j.eneco.2017.11.021
Yang, Z. B., Shao, S., and Yang, L. L. (2021). Unintended consequences of carbon regulation on the performance of SOEs in China: The role of technical efficiency. Energy Econ. 94, 105072. doi:10.1016/j.eneco.2020.105072
Yoon, S., and Nadvi, K. (2018). Industrial clusters and industrial ecology: Building 'eco-collective efficiency' in a South Korean cluster. Geoforum 90, 159–173. doi:10.1016/j.geoforum.2018.01.013
Yu, B. (2021). Urban spatial structure and total-factor energy efficiency in Chinese provinces. Ecol. Indic. 126, 107662. doi:10.1016/j.ecolind.2021.107662
Zhan, J. V. (2015). Do natural resources breed corruption? Evidence from China. Environ. Resour. Econ. (Dordr). 66, 237–259. doi:10.1007/s10640-015-9947-4
Zhang, D. Y., and Jin, Y. (2021). R&D and environmentally induced innovation: Does financial constraint play a facilitating role? Int. Rev. Financial Analysis 78, 101918. doi:10.1016/j.irfa.2021.101918
Zhang, H., An, R., and Zhong, Q. (2019). Anti-corruption, government subsidies, and investment efficiency. China J. Account. Res. 12, 113–133. doi:10.1016/j.cjar.2018.12.001
Zhang, S., Ma, M., Xiang, X., Cai, W., Feng, W., and Ma, Z. (2022). Potential to decarbonize the commercial building operation of the top two emitters by 2060. Resour. Conservation Recycl. 185, 106481. doi:10.1016/j.resconrec.2022.106481
Zhao, N., Liu, X. J., Pan, C. F., and Wang, C. Y. (2021). The performance of green innovation: From an efficiency perspective. Socio-Economic Plan. Sci. 78, 101062. doi:10.1016/j.seps.2021.101062
Keywords: anti-corruption campaign, energy efficiency, staggered DID, rent-seeking reducing, innovation improving, structure upgrading
Citation: Ji H (2022) The impact of the anti-corruption campaign on energy efficiency: Evidence from prefecture-level cities in China. Front. Environ. Sci. 10:1002578. doi: 10.3389/fenvs.2022.1002578
Received: 25 July 2022; Accepted: 30 September 2022;
Published: 12 October 2022.
Edited by:
Lin Zhang, City University of Hong Kong, Hong Kong SAR, ChinaReviewed by:
Shujahat Haider Hashmi, Bahria University, PakistanMinda Ma, Tsinghua University, China
Copyright © 2022 Ji. This is an open-access article distributed under the terms of the Creative Commons Attribution License (CC BY). The use, distribution or reproduction in other forums is permitted, provided the original author(s) and the copyright owner(s) are credited and that the original publication in this journal is cited, in accordance with accepted academic practice. No use, distribution or reproduction is permitted which does not comply with these terms.
*Correspondence: Hongkun Ji, amloa0AxNjMuc3VmZS5lZHUuY24=