 Yi Zhang1,2
 Guangliang Feng
 Chengcheng Gao
95% of researchers rate our articles as excellent or good
Learn more about the work of our research integrity team to safeguard the quality of each article we publish.
Find out more
ORIGINAL RESEARCH article
Front. Environ. Sci. , 19 September 2022
Sec. Environmental Informatics and Remote Sensing
Volume 10 - 2022 | https://doi.org/10.3389/fenvs.2022.1002474
This article is part of the Research Topic Spatial Modelling and Failure Analysis of Natural and Engineering Disasters through Data-based Methods - Volume II View all 36 articles
Rock mass failure is gradually becoming more common as the number of geotechnical engineering projects continues to increase. In this paper, the probability density distributions of initial and peak frequency events in the acoustic emission (AE) from two types of rock (phosphate rock and granite) undergoing failure are analyzed. Feature events (FEs) in this AE are proposed and obtained. The probabilities of events with an initial frequency of 1,000 kHz and peak frequency of 625 kHz are found to be higher than those with other frequencies. The evolutionary behavior of the cumulative probability distributions (CPDs) of the FEs as the rocks fail is subsequently investigated. The characteristic FEs of the AE and their CPD evolution behavior in the two rocks are then compared and contrasted. The CPD curves derived for both types of rock consist of four stages: slow rise—concave rise—rapid rise—slow rise. The differences related to the FEs for the two rocks are also found. The duration of the last stage (near rock failure) is quite different for phosphate rock and granite. The peak frequencies of the FEs are the highest and the smallest in the two rocks, respectively. Our method of analyzing the AE data and results provide a theoretical method for analyzing the stability of rock masses and predicting their failure.
There has been an increase in the development of mineral resources and the number of rock mass engineering construction projects in response to national policies aimed at promoting the continued social and economic development of China. As a result, geological disasters have become progressively more frequent leading to serious casualties and huge economic losses (Feng et al., 2015; Zhou et al., 2016; Feng et al., 2017; Wang et al., 2019; Wang et al., 2022; Xu et al., 2022). The characteristics and mechanisms responsible for rock mass failure and other geological hazards have thus become hot topics of research (Sainoki et al., 2020; Sun et al., 2020; Feng et al., 2019; Feng et al., 2022; Yu et al., 2022a; Yu et al., 2022b).
Acoustic emission (AE) techniques are used to study the stability of rock masses. In general, such techniques monitor the internal state of a rock mass by detecting the elastic waves generated as cracks are initiated, propagate, and undergo closure in the rock mass due to loading and outputting the resulting information in the form of electrical signals (Beattie, 1983; Scruby, 1987). AE is also commonly employed in laboratory research studies in rock mechanics. In the 1960s, Knill et al. (1968) performed indoor AE rock mechanics experiments and posited that the technique had great potential. Pollock (1968) studied the application of elastic waves from AE. In more recent years, numerous studies have been successfully carried out using AE. For example, Du et al. (2020) elucidated the essential characteristics of different rock failure modes and crack types using AE detection techniques. Zhao et al. (2020) studied the characteristics of axial stress-strain and time-frequency parameters of AE signals from rock specimens. Dong et al. (2021) investigated the qualitative relationship between rock instability precursors and principal stress direction using the velocities of AE waves. Wang et al. (2021) proposed a multiparameter synergetic method for predicting rockburst based on true triaxial AE tests. The AE data obtained by monitoring rock masses contains extremely detailed information about their internal stability (Zhou et al., 2019). However, there are still aspects of the AE data that have largely been unexplored. In particular, how the data from AE monitoring should be most effectively processed is still an issue that needs further research.
In probability theory, the concept of cumulative probability distribution (CPD), which is derived from probability density, is characterized by its flexibility and practical usefulness (Burr, 1942; Hatke, 1949). It is a powerful and valuable tool for processing data and has been used in many fields, such as geological engineering, bridge engineering, slope engineering, image processing, systems engineering, and hydraulic engineering (Wagner et al., 2002; Narvekar and Karam, 2009; Tian et al., 2018; Deng et al., 2020; Ries et al., 2020; Zhang and Liu, 2020), and so on. For example, Garijo et al. (2021) used a CPD method to process data and thus propose a model to predict the probability that natural hydraulic lime mortar will undergo failure.
In this paper, the density distributions of initial and peak frequency AE events in phosphate rock undergoing failure are first analyzed. Certain feature events (FEs) in the AE data from the phosphate rock are proposed and obtained. Then, the evolutionary behavior of the CPDs of the FEs in phosphate rock is investigated. Furthermore, the FEs of the AE data (and their CPD evolution behavior) from another failing rock (granite) are also studied and compared. The similarities and differences of the FE characteristics and their CPD evolution laws in the two types of rock are then discussed. This method of analyzing AE data and the results can provide a theoretical basis for analyzing the stability of rock masses and predicting their failure.
The phosphate rocks used in this study were obtained from an underground mining site in Yichang, Hubei Province, China. The rocks were shaped into cylindrical specimens measuring 50 mm (diameter) by 100 mm (height). Phosphate rock is a grey-black phosphorus-bearing ore with a microcrystalline structure and brecciated configuration. The phosphorus pentoxide (P2O5) content is approximately 30%. The granite is a large size rock sample of 200 mm × 200 mm x 400 mm. Granite specimens were provided by Taiyuan University of Technology and the Chinese Society of Rock Mechanics & Engineering. Scanning electron microscope (SEM) images of the phosphate rock and granite are shown in Figure 1. Their physical and mechanical properties are listed in Table 1.
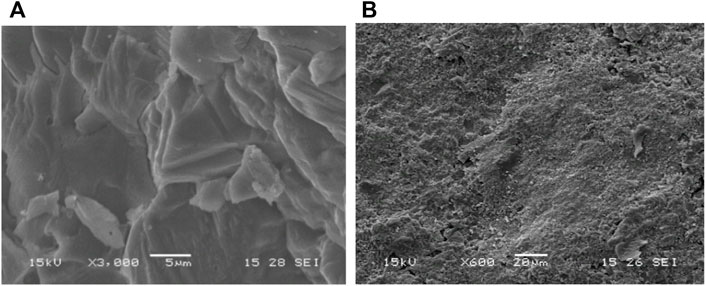
FIGURE 1. SEM images of the rocks. (A) Phosphate rock, and (B) granite.
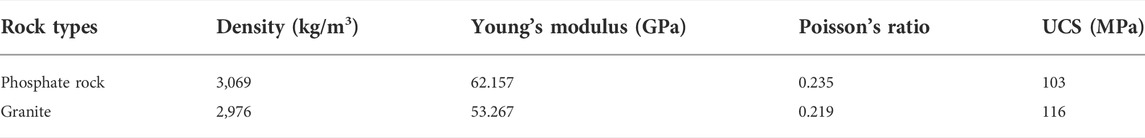
TABLE 1. Physical properties of the phosphate rock and grainte.
A computer-controlled multi-function electro-hydraulic servo tester was used to perform the rock failure tests. It consisted of four main components: a mainframe, a hydraulic control system, a monitoring system, and a loading system. It was designed to measure the mechanical properties of materials such as rock and concrete and complies with the relevant national standards. The system has a maximum loading capacity of 1,500 kN. The Young’s modulus and Poisson’s ratio of the test sample can be measured during the loading process and the system automatically generates a stress-strain curve. Loading is carried out at a constant displacement rate of 0.001 mm/s. To prevent detrimental effects due to friction, a layer of graphite powder is added to the top and bottom of the specimen before loading to act as a lubricant.
AE testing techniques are non-destructive and involve the detection of elastic wave energy. When a rock specimen is stressed, elastic waves are generated due to the formation and propagation of cracks within. These propagate along the rock and can be captured by sensors on the rock’s surface (Aggelis et al., 2012).
Figure 2 shows an example of the typical form of an acoustic wave as detected using an appropriate sensor. The figure further illustrates how certain parameters (AE count, duration, rise time, threshold, maximum amplitude, etc.) are defined.
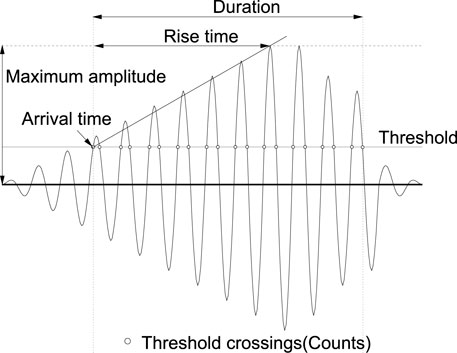
FIGURE 2. Parameters used to interpret the AE data.
The AE device employed in this work was manufactured by Changsha PengXiang Technology. The equipment has AE-related software installed that is used to acquire and interpret the waveform data (and other relevant data) in real-time to derive the AE parameters of interest. Four small AE probes (2.5 mm in diameter) are used to acquire the waveform data from the samples. The use of small AE probes is highly desirable as they can ensure that the acoustic energy is more efficiently transmitted to the probe from the curved surface of the cylindrical specimen. The probes are connected to the specimens using a couplant and then fixed with tape. To obtain the best collection results, all transducers are placed as symmetrically as possible (Figure 3).
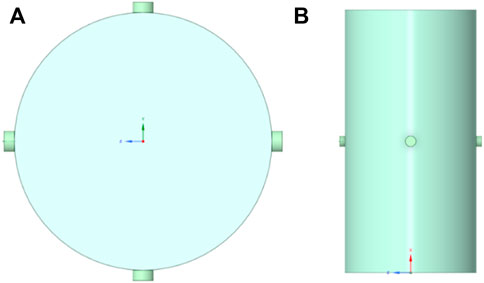
FIGURE 3. Schematic diagram showing the arrangement of the AE probes: (A) top view, and (B) front view.
The AE preamplifier is set to 32 dB and the collection threshold is set at 50 dB. The sampling frequency is chosen to be 2.5 MHz (taking into account the noise from the loading and collection devices during the loading process). The values of the peak definition hit definition, and hit lockout times are set to 200 us, 800 us, and 1,000 us respectively. As shown in Figure 3, the rise time is the period that elapses between the first time the signal crosses the threshold and the time at which the amplitude reaches its maximum value. The ‘initial frequency’ is defined to be equal to the pre-peak ringing count/rising time (in kHz). The dominant frequency, i.e., the frequency corresponding to the maximum energy point in the signal spectrum after fast Fourier transformation, is also referred to as the ‘peak frequency’. In this paper, it is these two AE parameters, initial frequency, and peak frequency that are employed to study the failure of the rock. Table 2 summarizes their definitions.
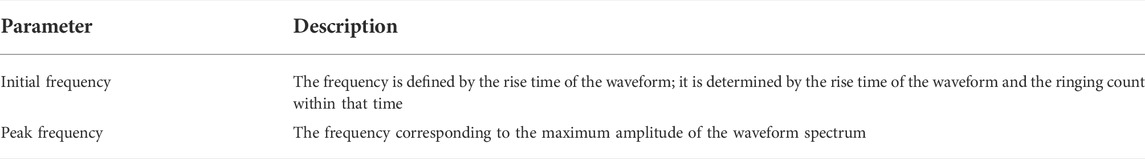
TABLE 2. AE parameters of interest in this paper.
In this section, we consider the probability densities of the initial and peak frequencies of all the AE events analyzed. A probability density function describes the likelihood that a certain output value of a random variable is measured. Discrete data uses a distribution law which corresponds to the probability
where
The probability densities quoted in this study are derived from actual AE monitoring data to give them practical significance. The probability distribution is formed by plotting probability density (vertical axis) against frequency (horizontal axis) which allows the probability distributions of the initial and peak frequencies to be readily identified.
The initial frequencies of all the AE events recorded during the failure of the phosphate rock specimens are statistically analyzed. The number of events with an initial frequency of
where N is the total number of events recorded during loading.
The probability distributions of the initial frequencies of the events recorded when three specimens are loaded are shown in Figure 4. As can be seen, events with an initial frequency of 1,000 kHz have a higher probability of occurring than events with other initial frequencies. Furthermore, the maximum probability at ∼1,000 kHz corresponds to 0.2–0.3.
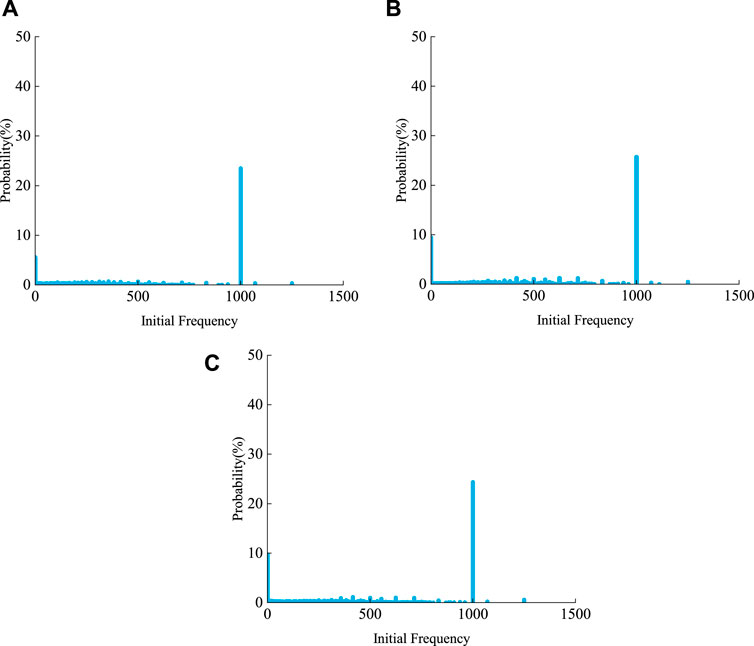
FIGURE 4. Initial frequency probability density distributions were derived for specimens (A) G1, (B) G2, and (C) G3 (G1, G2, and G3 refer to three phosphorite specimens).
The peak frequencies of the AE events recorded as the phosphate rock specimens are subjected to loading and failure are also statistically analyzed. The probability distribution of the peak frequencies of the events can then be calculated using an expression analogous to Eq. 2. Three examples are shown in Figure 5. As can be seen from Figure 5, the most likely peak frequency is ∼625 kHz which has a probability of occurrence of 0.3–0.5. There is also a cluster of events in the 200–400 kHz part of the distribution with a maximum probability of ∼0.13. This cluster is generally considered to be a secondary dominant frequency. There is also a third band in the distribution at 0–100 kHz with a maximum probability of 0.01. The peak at 625 kHz is overwhelmingly strong compared to other frequencies which suggest that a study of the events with this peak frequency is of exceptional interest. Thus, these events are chosen for subsequent study.
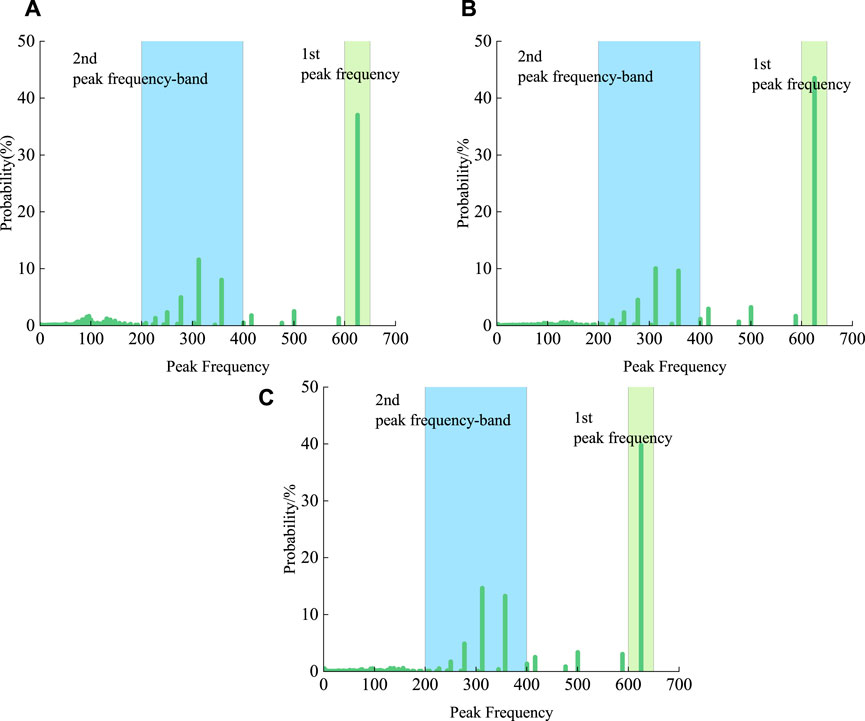
FIGURE 5. Peak frequency probability density distributions were derived for specimens (A) G1, (B) G2, and (C) G3.
Figure 6 presents scatter diagrams showing the distribution of the peak frequencies of events occurring at specific times. The two diagrams correspond to all events (a) and those with initial frequencies of 1,000 kHz (b). The two diagrams are very similar in form. Figure 7 shows similar scatter diagrams based on the initial frequencies of the events. In this case, all events are shown in (a), while (b) is filtered to show only those events with a peak frequency of 625 kHz. As can be seen, the temporal distributions presented in Figures 7A,B are also very similar. The above results highlight the fact that the most likely events to occur are those with an initial frequency of 1,000 kHz and peak frequency of 625 kHz.
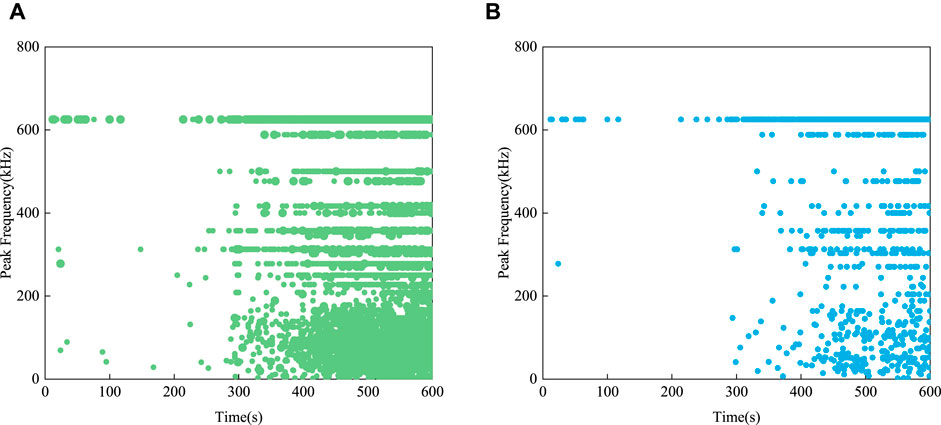
FIGURE 6. Temporal distribution of events with specific peak frequencies showing: (A) all events and (B) only those with an initial frequency of 1,000 kHz.
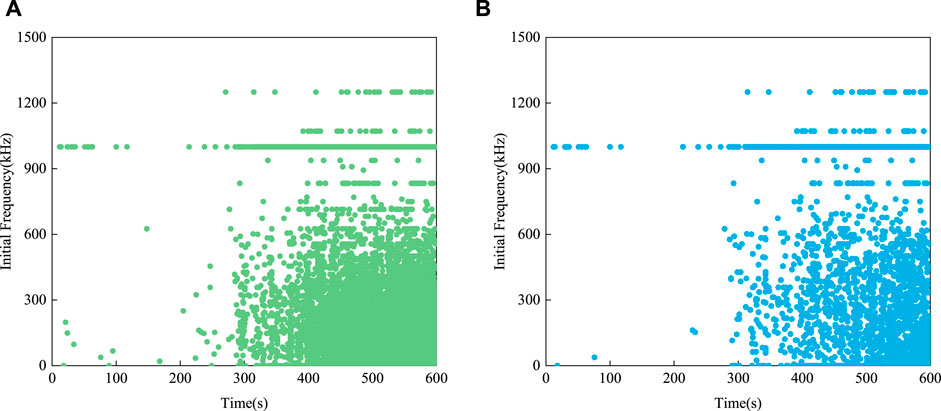
FIGURE 7. Temporal distribution of events with specific initial frequencies showing: (A) all events and (B) only those with a peak frequency of 625 kHz.
The initial frequency, in the concept of acoustic emission, corresponds to the count of the signal in the rise time of the signal. The peak frequency is the highest part of the signal spectrum. The spectrum is obtained by the Fast Fourier Transform. The peak frequency represents the highest energy part of a signal and is the direct representation to identify the characteristic of a signal. In this paper, the term ‘feature events’ is taken to be an AE event that has an initial frequency of 1,000 kHz and a peak frequency of 625 kHz. The FEs appears at the time of continuous rupture within the rock, and it has higher energy at 625 kHz than other frequencies. Therefore, we regard them to be ‘FE’ that are worthy of further study.
CPD is used to describe the probability that a variable randomly sampled at a particular time falls within a certain interval and is often regarded as a characteristic property of the data. If the variable is continuous, the CPD is derived by integrating the probability density function; if the data relates to a discrete variable, the CPD is derived by summation.
A CPD is described via its cumulative probability function F(x) which, for continuous variables, is defined by the expression
where
More specifically, in this experiment,
The function has the following properties: (1)
As mentioned above, we concentrate on the FEs in the AE monitoring data recorded as the phosphate rock specimens are subjected to loading. The FE data are first expressed in the form of the number of FE events recorded per second and this data are then summed to generate the corresponding CPD (Figures 8–10).
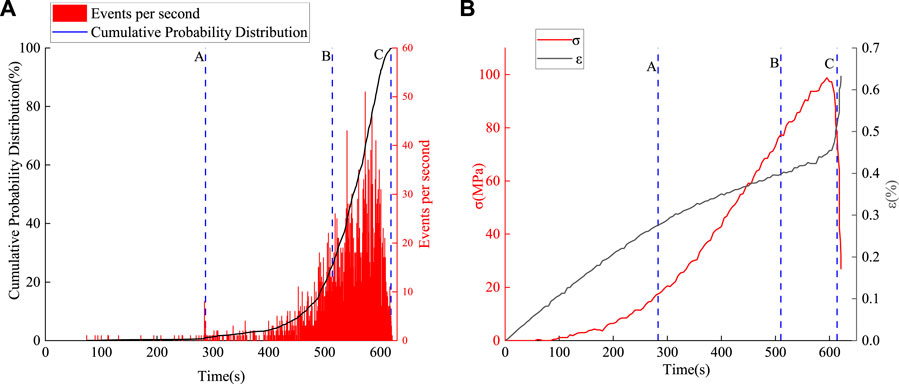
FIGURE 8. Results obtained for specimen G1: (A) CPD of the feature events and (B) variation of the stress and strain in the specimen during the same period.
The paper shows three sets of data (G1, G2, and G3), due to the variability of the specimens. Figure 8A, Figure 9A, and Figure 10A show the cumulative frequency curves of the FEs and the number of times the FEs occurred per second for specimens G1, G2, and G3, respectively. Figure 8B, Figure 9B, and Figure 10B show the corresponding changes in the stress and strain in the specimens during loading over the same timescale.
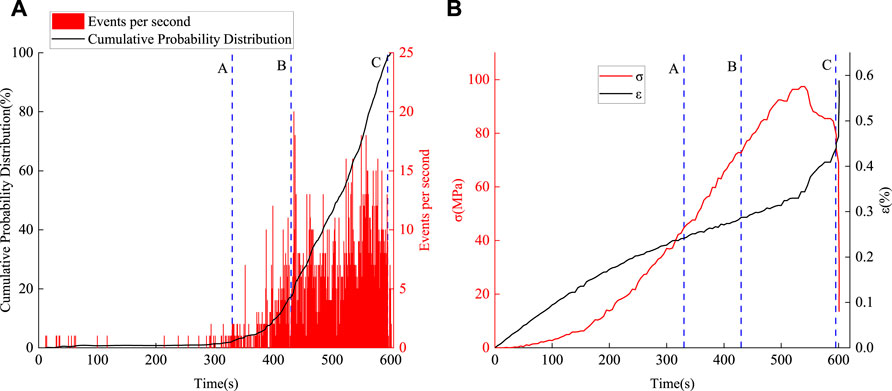
FIGURE 9. Results obtained for specimen G2: (A) CPD of the feature events and (B) variation of the stress and strain in the specimen during the same period.
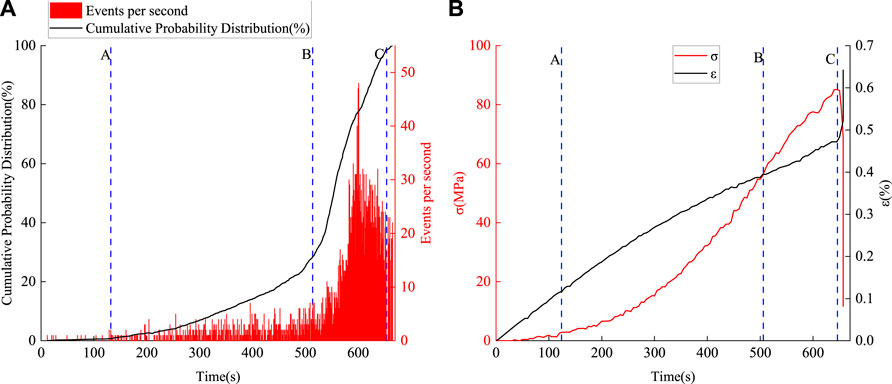
FIGURE 10. Results obtained for specimen G3: (A) CPD of the feature events and (B) variation of the stress and strain in the specimen during the same period.
The CPD curves inFigure 8A, Figure 9A, and Figure 10A all show the same trends: slow rise—concave rise—rapid rise—slow rise. The durations of each of these stages, however, vary from specimen to specimen and relate to the performance of the specimen. For example, the slow rise stages in specimens G1 and G2 end after 287 and 330 s Respectively. That in G3, however, lasts only 132 s. Similarly, G2 completes its concave rise stage (and started its rapid rise stage) at 430 s. In contrast, specimens G1 and G3 do not reach the rapid rise stage until 514 s. Then again, G1 and G3 reach their straight-up stages when the CPD reaches 25.1 and 28.5%, respectively. Specimen G2 reaches the rapid rise stage with a cumulative probability of 17.2%. These variations arise due to differences occurring inside the specimens. However, the cumulative probabilities of the FEs in the different specimens are all around 98.8% at the beginning of the fourth (slow rise) stage. The rocks subsequently fail 5–10 s later.
We denote the point at which the slow rise stage ends and the second stage begins as ‘A’. Similarly, the letters ‘B’, ‘C’, and ‘D’ represent the ends of the second, third, and fourth stages, respectively. Point D, of course, represents the failure of the rock. The times at which these points occur in the CPDs and the corresponding CPD values are summarized in Table 3.
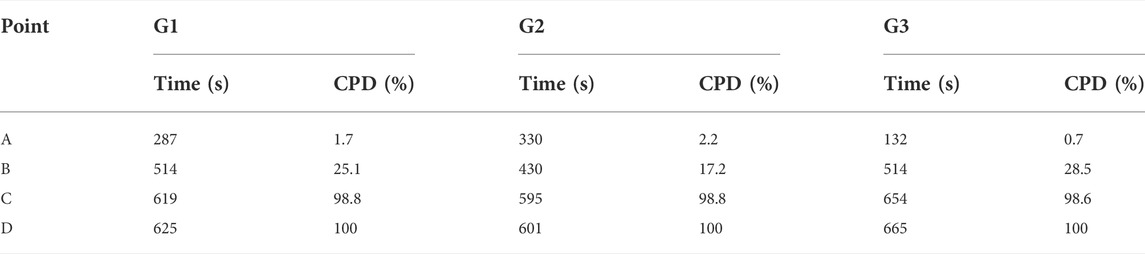
TABLE 3. The times and CPD values corresponding to the ends of the different stages in specimens G1–G3.
Figure 8B, Figure 9B, and Figure 10B show the variation of the stress and strain as the phosphate rock is subjected to loading. Points A–C is also marked on these diagrams. At the point where the CPDs of the FEs end their slow rise stages (i.e. point A), the stress and strain end their slow and rapid rise stages, respectively. The B-C stage encompasses the plastic stage of the phosphate rock. This is especially the case for specimen G2 where the curve does not break down after the peak stress is reached—rather, the stress decreases as the loading proceeds and there is a tendency for a second peak to appear after the first peak. In general, we consider a specimen to be damaged when the peak stress is reached. If it is not damaged, and the stress decreases, then we consider the moment at which the stress reaches 1/2 of the highest peak to be the moment when the sample is damaged.
Figure 11 presents stress–strain curves for the three specimens highlighting the values occurring when the points A, B, and C are reached. Such curves give a good indication of the state of the rock specimen during loading. The CPD of the FEs for G1 suggests that the slow rise stage is completed in this specimen after 287 s. In the corresponding stress–strain curve, this time is when the compressive stage of the phosphate rock is completed and there is a tendency to enter the plastic stage at point B (after 514 s). At point C, the peak stress is reached and critical failure occurs. The specimen G2 is not ready to break after reaching its peak stress but goes on to produce a second stress peak at point C. Specimen G3 starts to enter the linear elastic stage at 132 s (point A) and is ready to enter the plastic stage at 514 s (point B). The results in Table three show that the durations of the C-D intervals in the three phosphate rock specimens near failure are 6, 6, and 11 s, respectively, representing 0.96, 0.99, and 1.65% of the total loading times, respectively. The CPD of the FEs therefore gives a good indication of the loading state of the rock in terms of the timescale of the stress–strain curve.
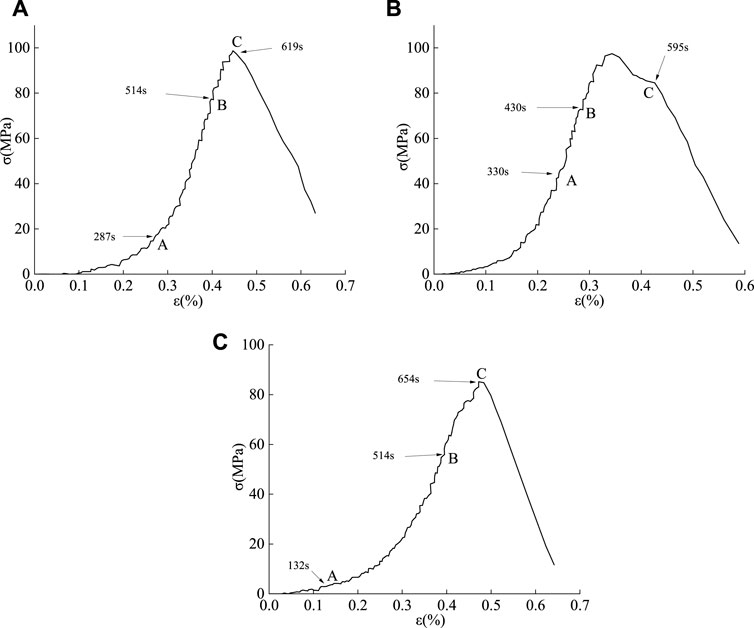
FIGURE 11. Stress–strain curves for: (A) G1, (B) G2, and (C) G3.
The intervals O-A, A-B, etc. divide the FE CPD curves into different stages. The proportion of the initial frequency events at 1,000 kHz, peak frequency events at 625 kHz, and FEs can then be determined in each stage (Figure 12 and Table 4). The proportion of 1,000 kHz initial frequency events, 625 kHz peak frequency events, and FEs is the highest in the A-B stage and lowest in the C-D stage, while the ratios in the O-A and B-C stages are approximately equal.
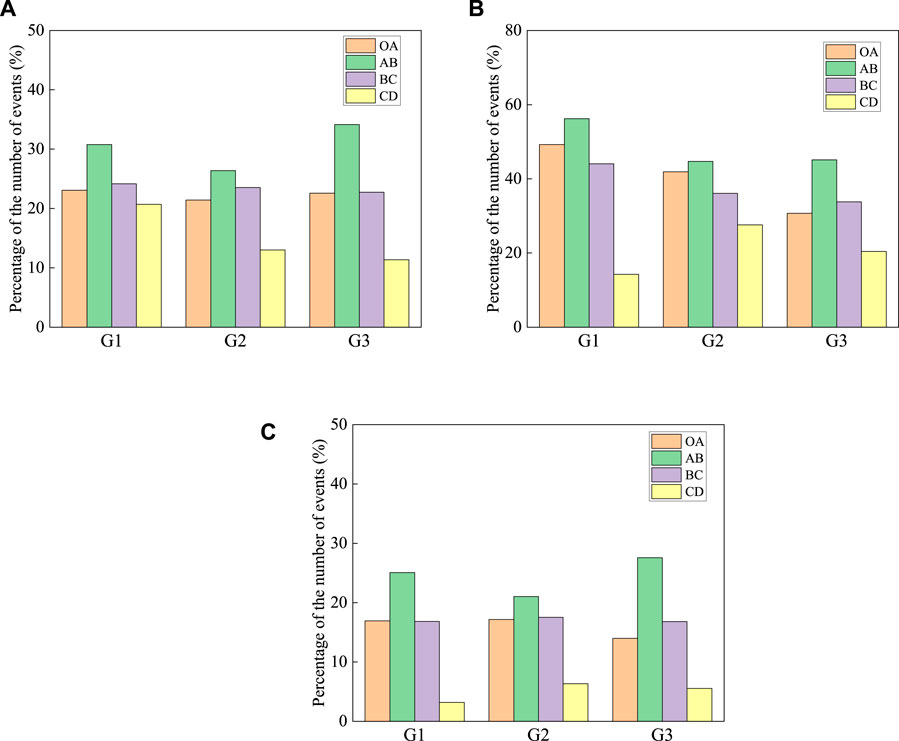
FIGURE 12. Percentage number of events in the different stages of the CPDs: (A) 1,000 kHz initial frequency events, (B) 625 kHz peak frequency events, and (C) FEs at each stage.
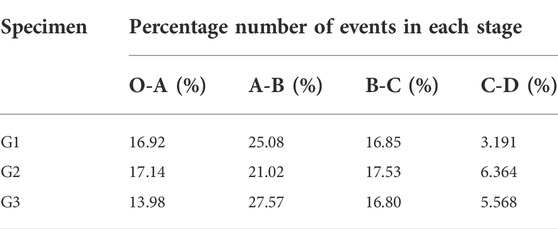
TABLE 4. Ratios of FEs in each stage.
The above analysis indicates that the FEs do not make a major contribution to the rock fracturing taking place in the period just before the rock fails. However, they do make outstanding contributions to the linear-elastic and elastic-plastic stages as the fractures evolve in the rock.
Experiments were also carried out on a granite specimen and the probability density distributions were calculated for the initial and peak frequencies (Figure 13). The results shown in Figure 13A indicate that the initial frequencies of most events are concentrated around 1,000 kHz (p ≈ 0.35). The peak frequency results (Figure 13B) appear to be divided into four frequency intervals corresponding to 6–24, 64–119, 222–305, and 625 kHz. The FEs are similarly expressed, except that the peak frequency of 625 kHz is not the first highest (60%) but the smallest (about 10%) in the granite experiment.
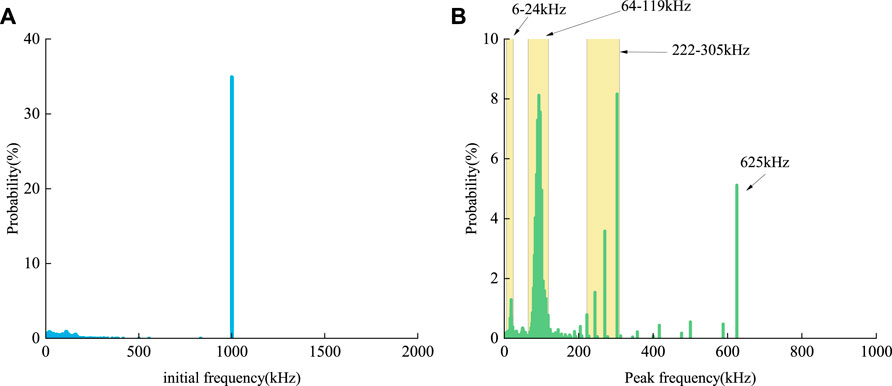
FIGURE 13. Probability density distributions derived for granite: (A) initial frequency results, and (B) peak frequency results.
Figure 14A shows CPD curves for events with an initial frequency of 1,000 kHz and peak frequencies of 6–24, 64–119, 222–305, and 625 kHz. And the FEs are considered to be consistent with an initial frequency of 1,000 kHz and a peak frequency of 625 kHz. The CPDs in Figure 14A all show an explosive increase in the period before the granite fails. However, as can be seen from Figure 14B, the FE CPD of the granite shows a slow increase in the period before failure. It is also observed that the CPD curve of the FEs follows the same pattern observed before: slow rise—concave rise—rapid rise—slow rise. And the period of the final stage is also longer for granites than for phosphorites as a percentage (final stage period/total loading time).
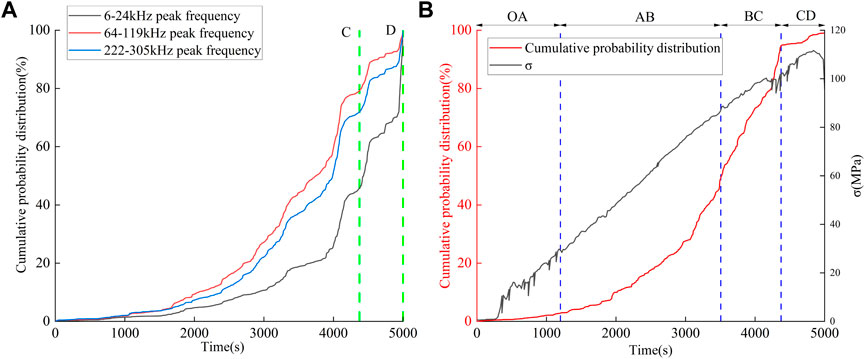
FIGURE 14. Statistical results for granite showing: (A) CPD curves of events with an initial frequency of 1,000 kHz combined with peak frequencies of 6–24, 64–119, 222–305 and 625 kHz, and (B) FEs (625 kHz peak frequency& 1,000 kHz initial frequency) CPD and stress curves.
The cumulative probabilities at the times corresponding to the points A–D are shown in Table 5 which should be compared to the results shown in Table 3 for phosphate rock. Point A is reached in granite after 1,200 s when the cumulative probability is 2.8%. This is similar to the results obtained for phosphate rock specimens. Point B (3,491 s) is reached when the cumulative probability is 47.9% in granite (∼24% in phosphate rock). Point C (4,373 s) is reached when the cumulative probability is 94.7% in granite (98.7% in phosphate rock). Of course, point D (5,296 s) is reached when the granite fails (which occurs after ∼630 s in phosphate rock).
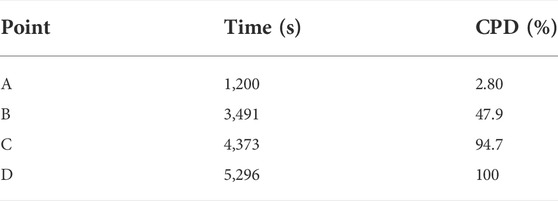
TABLE 5. Times and corresponding cumulative probabilities of the FEs in granite.
Figure 15 also shows how the stress in the granite varies with time. At point A (1,200 s), the stress stops fluctuating and begins to rise more smoothly. When it reaches point B (3,491 s), the rate at which the stress is rising begins to slow down. Finally, at point C (4,373 s), the stress begins to fluctuate rapidly.
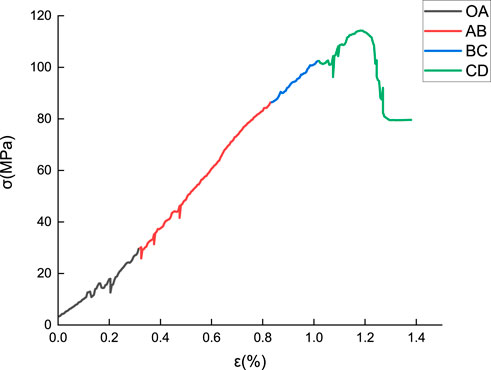
FIGURE 15. Stress-strain curve for granite.
These times are highlighted on the corresponding stress-strain curve for granite shown in Figure 15. At 1,200 s, the granite appears to enter the linear elastic stage; at 3,491 s the slope of the stress-strain curve starts to decrease; and at 4,373 s, the stress-strain curve starts to fluctuate violently as it reaches its peak value (which is a very good indication that the granite has entered the elastic-plastic stage). Ten minutes before it fails, a loud noise is emitted from the granite. An examination of Table 5 shows that the C-D stage (when the granite is approaching failure) lasts for 923 s, accounting for 17.4% of the total loading time. At the same time, the loading stress when this stage begins is ∼90% of the peak stress and so the granite is in a very dangerous state throughout this stage.
The proportion of FEs in each of the stages in granite is analyzed giving the results shown in Table 6. The number of feature events in stage C-D is similar to that found in the phosphate rock, that is, the proportion of FEs (0.8%) is significantly lower than those in other stages. That is, the FEs contribute very little to the fracturing processes occurring just before the granite fails as well.
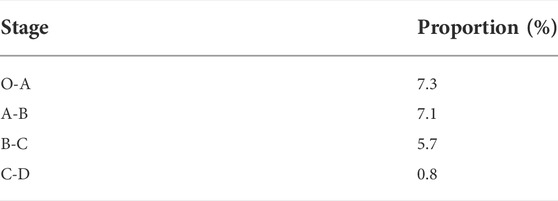
TABLE 6. Percentage of FEs in each of the stages for granite.
Some interesting results are shown by comparing the results of phosphate rock and granite. The CPDs produced all have the same trend. The trend can be used to establish feature points (labeled A, B, C, and D here) which mark the times at which the behavior changes. It is found that these times correspond to points in the stress and strain curves where these parameters undergo characteristic changes (see Figures 8–10, 14B, 15). The feature points in the CPD have a certain regularity which can be used as a basis for determining the stability of the phosphate rock during loading. The result will be helpful for the warning of rock mass failure and related geological hazards. The percentage of FEs occurring in each stage (O-A, A-B, etc.) can be readily calculated. According to these two points, the characteristic event corresponds to a rupture with higher amplitude at 625 kHz occurring within the rock (the part with lower amplitude, will not be recognized as the dominant frequency).
Overall, in terms of stress, the c-point of phosphorite is closer to the peak stress than granite; in terms of the loading phase, the CPD curve of granite expresses more obvious precursors to failure than phosphorite; in terms of time, the CPD curve change of granite also fits the stress-strain curve more than phosphorite. Therefore, in terms of hazard, the c-point of phosphorite is more dangerous because it is closer to the time of failure; in terms of evaluating the stability of the rock, granite performs better and can correspond more accurately to the stability state of the rock. The result will be helpful for the warning of phosphorite and granite failure in site.
It is worth noting that compared with the laboratory test, the environment of on-site engineering is more complex. The stability of rock mass and results of in-situ acoustic emission testing are affected by many factors. The rock mass is heterogeneous and discontinuous, including a large number of structural planes. Therefore, there are many differences between laboratory test and in situ monitoring. More scientific research is needed before the results of laboratory tests can be used in the engineering field in the future. However, the results obtained in this study will give a new idea for the monitoring and analyzing of rock failure processes in engineering. The state of the rock mass can be judged by the feature points monitored. By monitoring the accumulated FEs events and analyzing the characteristics of CPD curve, we may find the risk state of the rockmass and some measure can be conducted to mitigate the risk if necessary.
In this paper, the AE produced in phosphate rock and granite during the failure is analyzed and the data are used to generate probability density distributions for the initial and peak frequencies of the acoustic signals. The probabilities of events with an initial frequency of 1,000 kHz and peak frequency of 625 kHz are found to be higher than those with other frequencies. Therefore, such events are given a special name: ‘feature events’ (or FEs for short).
The forms of the CPDs of the FEs in phosphate rock and granite are then studied. The CPDs of both materials show a similar pattern involving four stages: slow rise—concave rise—rapid rise—slow rise. As loading commences, the number of FEs per unit time slowly increases. In the second stage, the number of FEs recorded per unit time increases more rapidly and the proportion of events that are FEs reaches its maximum value. In the third stage, the number of FEs per unit time increases very rapidly (and the rate of increase reaches its maximum value). In the last stage, the number of FEs per second decreases, and the proportion of events that are FEs also decreases. The FE CPD curves contain information about the behavior of the test specimens as loading proceeds and so there is a certain correspondence between the CPD curves and stress-strain curves of the specimens.
The FEs recorded using the two different types of rock are also found to show different characteristic. The FE peak frequency (625 kHz) is the strongest peak frequency band observed in phosphate rock, whereas it is the smallest strongest in granite. In terms of hazard identification, FEs CPD curves reflect the stability state of the rock. The analysis of curve characteristics enables to make judgments about the state of rocks. The research presented in this work suggests that using FEs CPD can provide useful information about damage evolution mechanisms in rock masses and hence the stability of the rock masses. The period evolution of the CPD clearly corresponds to the state of stress changes in the rock. This result will provide a reference for disaster waning and risk mitigation in the construction of rock engineering.
The original contributions presented in the study are included in the article/Supplementary Material, further inquiries can be directed to the corresponding authors.
Methodology, YZ and GF; formal analysis, ML and XL; investigation and experiment, YZ, CG, and XL; resources, ML and XL; writing—original draft preparation, YZ and ML; writing—review and editing, GF; supervision, GF. All authors have read and agreed to the published version of the manuscript.
This research was funded by the National Natural Science Foundation of China (grant nos. 52174085 and 51474159), the Project of Youth Innovation Promotion Association of Chinese Academy of Sciences (No. 2021326), Open Fund of National Engineering and Technology Research Center for Development and Utilization of Phosphate Resources (NECP 2022-08), the Central Leading Local Science and Technology Development Project of Hubei Province (grant no. 2017ZYYD007) and Graduate Innovative Fund of Wuhan Institute of Technology (NO. CX2021485).
The authors declare that the research was conducted in the absence of any commercial or financial relationships that could be construed as a potential conflict of interest.
All claims expressed in this article are solely those of the authors and do not necessarily represent those of their affiliated organizations, or those of the publisher, the editors and the reviewers. Any product that may be evaluated in this article, or claim that may be made by its manufacturer, is not guaranteed or endorsed by the publisher.
AE, Acoustic emission; FE, Feature event; CPD, Cumulative probability distribution
Aggelis, D., Mpalaskas, A., Ntalakas, D., and Matikas, T. (2012). Effect of wave distortion on acoustic emission characterization of cementitious materials. Constr. Build. Mater. 35, 183–190. doi:10.1016/j.conbuildmat.2012.03.013
Beattie, A. G. (1983). Acoustic emission, principles and instrumentation (No. SAND-82-2825). Albuquerque, NM (USA): Sandia National Labs.
Burr, I. W. (1942). Cumulative frequency functions. Ann. Math. Stat. 13, 215–232. doi:10.1214/aoms/1177731607
Deng, Z., Liu, X., Liu, Y., Liu, S., Han, Y., Tu, Y., et al. (2020). Cumulative damage evolution and failure modes of the bedding rock slope under frequent microseisms. Arab. J. Geosci. 13 (10), 1–13. doi:10.1007/s12517-020-05299-6
Dong, L., Chen, Y., Sun, D., and Zhang, Y. (2021). Implications for rock instability precursors and principal stress direction from rock acoustic experiments. Int. J. Min. Sci. Technol. 31, 789–798. doi:10.1016/j.ijmst.2021.06.006
Du, K., Li, X., Tao, M., and Wang, S. (2020). Experimental study on acoustic emission (AE) characteristics and crack classification during rock fracture in several basic lab tests. Int. J. Rock Mech. Min. Sci. 133, 104411. doi:10.1016/j.ijrmms.2020.104411
Feng, G.-L., Feng, X.-T., Chen, B.-R., Xiao, Y.-X., and Yu, Y. (2015). A microseismic method for dynamic warning of rockburst development processes in tunnels. Rock Mech. Rock Eng. 48, 2061–2076. doi:10.1007/s00603-014-0689-3
Feng, X.-T., Pei, S.-F., Jiang, Q., Zhou, Y.-Y., Li, S.-J., and Yao, Z.-B. (2017). Deep fracturing of the hard rock surrounding a large underground cavern subjected to high geostress: In situ observation and mechanism analysis. Rock Mech. Rock Eng. 50, 2155–2175. doi:10.1007/s00603-017-1220-4
Feng, G.-L., Feng, X.-T., Xiao, Y.-X., Yao, Z. B., Hu, L., Niu, W. J., et al. (2019). Characteristic microseismicity during the development process of intermittent rockburst in a deep railway tunnel. Int. J. Rock Mech. Min. Sci. 124, 104135. doi:10.1016/j.ijrmms.2019.104135
Feng, G.-L., Chen, B.-R., Xiao, Y.-X., Jiang, Q., Li, P.-X., Zheng, H., et al. (2022). Microseismic characteristics of rockburst development in deep tbm tunnels with alternating soft–hard strata and application to rockburst warning: A case study of the neelum–jhelum hydropower project. Tunn. Undergr. Space Technol. 122, 104398. doi:10.1016/j.tust.2022.104398
Garijo, L., Ortega, J., Ruiz, G., De La Rosa, Á., and Zhang, X. (2021). Effect of loading frequency on the fatigue life in compression of natural hydraulic lime mortars. Theoretical and Applied Fracture Mechanics 118, 103201. doi:10.1016/j.tafmec.2021.103201
Hatke, M. A. (1949). A certain cumulative probability function. Ann. Math. Stat. 20(3), 461–463. doi:10.1214/aoms/1177730002
Knill, J. L., Franklin, J. A., and Malone, A. W. (1968). A study of acoustic emission from stressed rock. Int. J. Rock Mech. Min. Sci. Geomechanics Abstr. 5 (1), 87–88. doi:10.1016/0148-9062(68)90025-9
Narvekar, N. D., and Karam, L. J. (2009). A no-reference perceptual image sharpness metric based on a cumulative probability of blur detection. Proceeding of the 2009 International workshop on quality of multimedia experience. July 2009, San Diego, CA, USA. IEEE. doi:10.1109/qomex.2009.5246972
Pollock, A. A. (1968). Stress-wave emission — A new tool for industry. Ultrasonics 6 (2), 88–92. doi:10.1016/0041-624x(68)90199-6
Ries, R., Brudzinski, M. R., Skoumal, R. J., and Currie, B. S. (2020). Factors influencing the probability of hydraulic fracturing‐induced seismicity in Oklahoma. Bull. Seismol. Soc. Am. 110, 2272–2282. doi:10.1785/0120200105
Sainoki, A., Maina, D., Schwartzkopff, A. K., Obara, Y., and Karakus, M. (2020). Impact of the intermediate stress component in a plastic potential function on rock mass stability around a sequentially excavated large underground cavity. Int. J. Rock Mech. Min. Sci. 127, 104223. doi:10.1016/j.ijrmms.2020.104223
Scruby, C. B. (1987). An introduction to acoustic emission. J. Phys. E. 20 (8), 946–953. doi:10.1088/0022-3735/20/8/001
Sun, H., Liu, X., Zhang, S., and Nawnit, K. (2020). Experimental investigation of acoustic emission and infrared radiation thermography of dynamic fracturing process of hard-rock pillar in extremely steep and thick coal seams. Eng. Fract. Mech. 226, 106845. doi:10.1016/j.engfracmech.2019.106845
Tian, Y., Choi, T.-M., Ding, X., Xing, R., and Zhao, J. (2018). A grid cumulative probability localization-based industrial risk monitoring system. IEEE Trans. Autom. Sci. Eng. 16, 557–569. doi:10.1109/tase.2018.2839194
Wagner, R., Head, J. W., Wolf, U., and Neukum, G. (2002). Stratigraphic sequence and ages of volcanic units in the Gruithuisen region of the Moon. J. -Geophys. -Res. 107 (E11), 14-1–14-15. doi:10.1029/2002je001844
Wang, S, Li, X, Yao, J, Gong, F., Li, X, Du, K., et al. (2019). Experimental investigation of rock breakage by a conical pick and its application to non-explosive mechanized mining in deep hard rock. Int. J. Rock Mech. Min. Sci. 122, 104063. doi:10.1016/j.ijrmms.2019.104063
Wang, C., Cao, C., Liu, Y., Li, C., Li, G., and Lu, H. (2021). Experimental investigation on synergetic prediction of rockburst using the dominant-frequency entropy of acoustic emission. Nat. Hazards (Dordr). 108 (3), 3253–3270. doi:10.1007/s11069-021-04822-6
Wang, S., Sun, L., Li, X., Zhou, J., Du, K., Wang, S., et al. (2022). Experimental investigation and theoretical analysis of indentations on cuboid hard rock using a conical pick under uniaxial lateral stress. Geomech. Geophys. Geo. Energy. Ge. Resour. 8 (1), 34. doi:10.1007/s40948-022-00345-x
Xu, D. P., Liu, X. Y., Jiang, Q., Li, S. J., Zhou, Y. Y., Qiu, S. L., et al. (2022). A local homogenization approach for simulating the reinforcement effect of the fully grouted bolt in deep underground openings. Int. J. Min. Sci. Technol. 32 (2), 247–259. doi:10.1016/j.ijmst.2022.01.003
Yu, Y, Zhao, D-C, Feng, G-L, Geng, D-X, and Guo, H-S (2022a). Energy evolution and acoustic emission characteristics of uniaxial compression failure of anchored layered sandstone. Front. Earth Sci. (Lausanne). 10, 841598. doi:10.3389/feart.2022.841598
Yu, Y, Feng, G-L, Xu, C-J, Chen, B-R, Geng, D-X, and Zhu, B-T (2022b). Quantitative threshold of energy fractal dimension for immediate rock-burst warning in deep tunnel: A case study. Lithosphere 2021, 1699273. doi:10.2113/2022/1699273
Zhang, S., and Liu, Y. (2020). Damage detection of bridges monitored within one cluster based on the residual between the cumulative distribution functions of strain monitoring data. Struct. Health Monit. 19, 1764–1789. doi:10.1177/1475921719895955
Zhao, K., Yang, D., Gong, C., Zhuo, Y., Wang, X., and Zhong, W. (2020). Evaluation of internal microcrack evolution in red sandstone based on time–frequency domain characteristics of acoustic emission signals. Constr. Build. Mater. 260, 120435. doi:10.1016/j.conbuildmat.2020.120435
Zhou, J., Li, X., and Mitri, H. S. (2016). Classification of rockburst in underground projects: Comparison of ten supervised learning methods. J. Comput. Civ. Eng. 30 (5), 04016003. doi:10.1061/(asce)cp.1943-5487.0000553
Keywords: rock stability, probability theory, acoustic emission frequency, acoustic emission events, uniaxial loading
Citation: Zhang Y, Feng G, Lin M, Li X, Gao C and Liang X (2022) Acoustic emission feature events during rock failure and their cumulative probability distribution: Case study of phosphate rock and granite. Front. Environ. Sci. 10:1002474. doi: 10.3389/fenvs.2022.1002474
Received: 25 July 2022; Accepted: 24 August 2022;
Published: 19 September 2022.
Edited by:
Faming Huang, Nanchang University, ChinaReviewed by:
Hans J. Laimer, Austrian Federal Railways, AustriaCopyright © 2022 Zhang, Feng, Lin, Li, Gao and Liang. This is an open-access article distributed under the terms of the Creative Commons Attribution License (CC BY). The use, distribution or reproduction in other forums is permitted, provided the original author(s) and the copyright owner(s) are credited and that the original publication in this journal is cited, in accordance with accepted academic practice. No use, distribution or reproduction is permitted which does not comply with these terms.
*Correspondence: Guangliang Feng, Z2xmZW5nQHdocnNtLmFjLmNu; Manqing Lin, bWFucWluZ19saW5AZm94bWFpbC5jb20=
Disclaimer: All claims expressed in this article are solely those of the authors and do not necessarily represent those of their affiliated organizations, or those of the publisher, the editors and the reviewers. Any product that may be evaluated in this article or claim that may be made by its manufacturer is not guaranteed or endorsed by the publisher.
Research integrity at Frontiers
Learn more about the work of our research integrity team to safeguard the quality of each article we publish.