 Ziyi Wang
 Yu Wang2
 Debin Ma
 Jiaming Li
95% of researchers rate our articles as excellent or good
Learn more about the work of our research integrity team to safeguard the quality of each article we publish.
Find out more
ORIGINAL RESEARCH article
Front. Environ. Sci. , 01 September 2022
Sec. Environmental Informatics and Remote Sensing
Volume 10 - 2022 | https://doi.org/10.3389/fenvs.2022.1002014
This article is part of the Research Topic Meta-Scenario Computation for Social-Geographical Sustainability View all 60 articles
China’s ecological compensation (EC) is based on the property rights structure of public ownership of natural resources, which should be based on the spatial planning, which is defined by local government as the boundary of property right management and the distribution of development power. This study combined spatial planning and ecosystem service value (ESV) accounting to design a decision-making framework of EC, which includes “Subject choice, Value accounting, Priority evaluation, Policy supply”. We selected 32 counties (districts) in the Yangtze River Delta region as the research object with the consideration of spatial planning and expert advice, and found that the implementation of EC slowed down the urbanization process and promoted the increase of ecological space. We conducted an accounting and sensitivity analysis on the spatial and temporal changes of ESV in the region from 2000 to 2019, and finally determined the amount and priority of accepting EC. The research results show that the ESV in the study area shows a general trend of increasing and then decreasing in time, and a spatial pattern of high in the south and low in the north and high in the east and low in the west. Forestland and water area are the main providers of ESV in the study area. The sensitivity coefficients of each type of ESV do not change much in each period, but the coefficients between the types have large differences. The total amount of EC in the Yangtze River Delta ecological barrier (YRDEB) is RMB 38,098.11 billion, and Shitai County is the area with the highest priority for compensation. We believe that this decision-making framework has the potential to be applied to the implementation of EC in other regions of China. At the same time, it can also be used to enrich the international views on EC research.
Since the industrial revolution, the world has been paying a heavy price for the growth way of extensive economy, and the problems of global warming, biodiversity decrease and heat island effect have become increasingly serious (Banks-Leite et al., 2014; Burke et al., 2015; Huang et al., 2020; Wang et al., 2022). In response to these growing global environmental problems, the Millennium Ecosystem Assessment promoted the concept of ecosystem services (ESs) and argued that maintaining ESs plays an important role in the sustainable development of human beings (MEA, 2005; Chan et al., 2012; Schrter et al., 2014). With the integration of ESs into mainstream environmental policy and planning management research frameworks (Gómez-Baggethun et al., 2010; Soh and Cho, 2019), paying for ESs to ease the contradiction between ecosystem and economic and social development has become a hot international topic (Muradian et al., 2013; Bremer et al., 2014; Ouyang et al., 2020). Many scholars have debated over the concept of payment for ecosystem services (PES) (Muradian et al., 2010; Wunder, 2015), value goals (Muradian et al., 2013), and implementation procedures (Wunder et al., 2018). Combining a number of views, Wunder put forward a revised concept of PES which is widely accepted, the concept is: “Voluntary transactions between users based on agreed natural resource management rules for generating offsite services.” At the same time, many PES practices have been carried out in different countries, such as China’s Grain-to-Green Program (GTGP) (Xie et al., 2022), Costa Rica’s forest EC (Tafoya et al., 2020), Ecuador’s SocioParamo Program (Bremer et al., 2014), etc. According to statistics, there were more than 552 PES programs in 2017 (Salzman et al., 2018).
The ecosystem valuation proposed by Costanza and Daily’s is a ground-breaking and controversial study, which changed the past perception that ESs are “Free” (Costanza et al., 1997; Daily, 1997; Costanza et al., 2017). While there is much support for incorporating ESV into the PES implementation framework, it is still difficult to see cases where payments are made entirely in accordance with the market model in practice (Wunder, 2007; Fletcher and Büscher, 2017), more cases are made through negotiations or government action (Van Hecken et al., 2015). Some scholars regard EC in China as the equivalence of the PES (Shang et al., 2018; Yu et al., 2020). China has provided EC to China’s key ecological function areas and restricted development areas through financial transfer payments since 2008. By 2022, more than 800 counties in China have received ecological transfer payments, with total transfer payments exceeding 600 billion yuan (Cao et al., 2022). Most of the money is used to protect and rehabilitate key ecological functional areas and compensate for the sacrifices for ecosystem protection made by the administrative units in such areas.
The selection of the subjects and the order of compensation are the basis for the implementation of EC. The subject of EC is essentially the issue of property rights (Engel et al., 2008). The private property rights system in Western countries provides the preconditions for PES. But they ignore that the property rights of natural resources in China are owned by the whole people and executed by different local administrative bodies. If we cannot understand this logic, we cannot understand the practice of EC in China for more than 20 years, and even cause some scholars “Misjudge” the effect of EC (He and Sikor, 2015; Shang et al., 2018). The priority of the allocation of EC funds is related to how to allocate the limited budget more efficiently, which directly affects the effectiveness and fairness of compensation (Li et al., 2021). It needs to consider the supply of ESs and the stage of economic and social development of the main body of EC. Because the main body of EC often has the characteristics of an underdeveloped economy and a high supply of ESs. The motive for judging this priority is not the effect of environmental protection actions, but the right of different regions to pursue development.
With the advancement of the theory and practice of EC, the combination of EC and spatial planning has attracted more and more attention (Chen et al., 2022; Yu et al., 2022a). Because of the difference of natural resources and ecological endowment in different regions, the development level of different regions is different (Moran et al., 2007). As an important public policy, spatial planning has a natural “Referee” role. For example, spatial planning can make overall arrangements for the development of different regions from a macro perspective, and alleviate the extreme imbalance of regional development caused by capital concentration (Wünscher and Engel, 2012; Fagan et al., 2016; Moreira et al., 2018; Yu et al., 2022b). Cuperus regarded spatial planning as an important factor in promoting the implementation of EC for infrastructure in the Netherlands (Cuperus et al., 1999). The combination of spatial planning and ecological compensation can help the spatial identification of ecological compensation, and find out the most effective ecological suppliers (Areas accepting EC), so as to improve the efficiency and accuracy of EC (Grêt-Regamey et al., 2017; Zulian et al., 2018; Huang et al., 2021).Wunder found that the principle of spatial positioning is beneficial to the practice of PES through the research on the global social science literature data set (Wunder et al., 2018). Fan constructed a quantitative estimation model of EC based on village, which provides a feasible way to reconcile the conflicts of interests among regional economy, society and ecology (Fan et al., 2019). Taking the Middle Route of South-to-North Water Diversion Project as an example, Su conducted an in-depth analysis of how EC can be implemented in spatial planning, which is conducive to promoting regional water resources protection and ecological sustainability (Su et al., 2022).However, there are few studies on the selection of EC subjects and the determination of compensation order in combination with spatial planning.
Based on the background of China’s territorial spatial planning, this study analyzes China’s EC decisions from a spatial perspective, in order to design a new framework to respond to the problems of the subject selection and compensation order of EC. It can be used to assist the decision-making of EC in China and enrich the theory and practice of international EC. We choose YRDEB as a case. On the one hand, this area is an important ecological function area in China and an ecological security barrier for the Yangtze River Delta urban agglomeration. On the other hand, it has made huge sacrifices for the green development of the Yangtze River Delta region and has been regarded as the key object of EC by the Chinese government. In Section 2, the paper describes in detail about the decision-making framework of EC on the basis of spatial planning and ecosystem service accounting. In Section 3, we introduce methods and data sources. In Section 4, we give a brief description of the empirical results. Finally, we reiterate our main points and research uncertainties in the discussion.
We designed a decision-making framework for EC combining spatial planning and ESs accounting (Figure 1):
1) The implementation of EC through spatial planning is determined by China’s special property rights structure. Unlike the private ownership of property rights in Western countries, China takes state ownership of natural resources, so the state is normally both a provider of ESs and a beneficiary. It is the governments at all levels that exercise natural resource management rights and income rights. Therefore, they may become both payers and recipients of EC under different scenarios. In China, individuals may become payers of EC only in a few instances, such as farmland where individuals have quasi-private property rights. In most instances they will only become payees of EC. Under the background of departing from the logic of Neoclassical and Neoliberalism market behavior (Fletcher and Büscher, 2017; Van Hecken et al., 2018), what has driven China’s two-decade-long practice of EC? We believe that the following three points are central to China’s promotion of EC practices: ①The setting of macro-objectives reflects the will of the state. ②The creation of inter-regional supply and demand through the regulation of factors and uses. ③Through the establishment of the right to development to endow the rights and responsibilities of different administrative subjects. As we can see, all of these initiatives need to be implemented through spatial planning. Spatial planning, as the main means of space development, protection and management of administrative units at all levels, is the most unquestionable tool to achieve EC in China. Moreover, spatial planning plays an active role in the rational use of resources, environmental protection and coordinated regional development in developed countries (Mascarenhas et al., 2012).
2) After clarifying the subject of EC, the theoretical amount and priority should be determined. We evaluated ESV in these areas. At present, the methods of EC amount evaluation mainly include the direct cost method (Li, 2011), conditional value method (Chu et al., 2020), opportunity cost method (Adhikari et al., 2017), ESV method, etc (Costanza et al., 1997). The direct cost method is less common in concrete practice. The opportunity cost method requires high accuracy and completeness of data. The conditional value method mainly determines compensation between interest subjects and is highly influenced by subjective will. Ecosystem service valuation applies spatially explicit integrated ecological and economic models to account for costs and benefits that are not taken into account by the market and incorporated into economic decisions (Ouyang et al., 2020). Constanza’s first assessment of the ESV on a global scale, using the value equivalent factor approach, has been widely discussed (Costanza et al., 1997).
3) Furthermore, we evaluate the priority of EC with the theoretical compensation amount. Since the resources for EC are limited, we must prioritize the allocation of limited resources to areas of greater need (Ceballos et al., 2015). Although this distribution is not done in a full market, it cannot achieve the “Ideal kingdom” of Pareto efficiency, the design of the “Complex” decision-making framework for EC implies the pursuit of spatial positioning, differentiated payment and supervision-regulation (Wunder et al., 2018). In the end, this distribution method may achieve a better EC effect.
4) We put forward multiple EC methods. We do not think that ESV is the true amount of EC. Since the nature of EC is not only the economic means to adjust the interests of stakeholders, but also many participants to affect the supply and demand of ESs decision-making process (Metzger et al., 2020), which should be reflected in a variety of ways. Therefore, compared with the “Blood-transfusion” EC model, which is directly subsidy, the “Blood-making” EC model may have a longer lasting vitality (Liu et al., 2020).
5) Finally, we propose possible ways to optimize our framework. It includes demonstrating the spatial selection of EC with the suggestions of experts; optimizing the distribution of development rights through more scientific planning methods; determining the amount of EC based on the wishes of the government, enterprises and individuals, not just by the ESV evaluation; introducing NGOs to participate in the practice of EC and establishing EC funds.
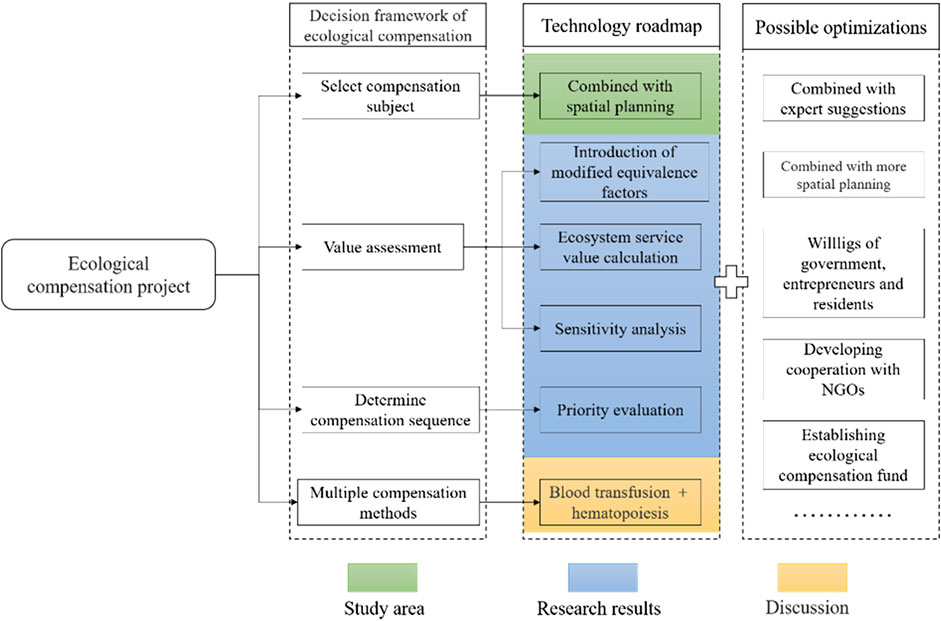
FIGURE 1. Decision framework of EC.
According to the research framework, we have to select out the EC area according to China’s important spatial planning document “National Major Functional Area Planning”. In the main functional zoning, different functional areas take different responsibilities, among which urban areas can promote economic development and lead China’s modernization process, major agricultural production areas can ensure food security and sustainable human survival (Yu et al., 2022), while key ecological function areas can ensure ecological security and ecological sustainability (Du et al., 2021). Our criteria for selecting study areas are as follows: 1) According to the “Yangtze River Delta regional integration development plan outline”, which pointed out to build the Yangtze River Delta green ecological barrier in the ‘West Anhui Dabie Mountains and South Anhui-Zhejiang West-South Zhejiang mountainous area’, it determines the region is an important ecological protection area in the Yangtze River Delta region. 2) Based on “Zhejiang Province Main Function Area Planning” and “Anhui Province Main Function Area Planning”, restricted development areas and prohibited development areas are selected as EC areas. 3) According to the experts’ suggestion, we should consider other major agricultural production areas, eco-economy areas, and administrative areas where world-class natural and cultural heritage and national cultural relics protection units are located. 4) To ensure the integrity of administrative subject’s business and financial rights, and to implement EC action (Table 1).
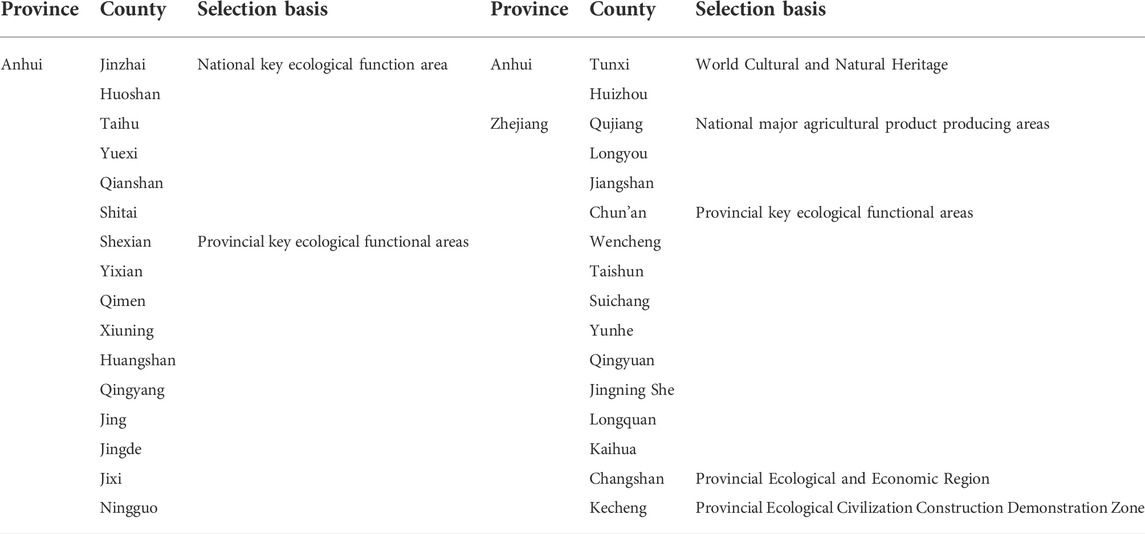
TABLE 1. Selection basis of the study area.
We selected 32 counties (cities and districts) as the YRDEB, which is also the research area of this paper. In general, the YRDEB spans 115°–120° degrees east and 27°–32° degrees north, and is located in the lower reaches of the Yangtze River, southwest of Anhui Province and southwest of Zhejiang province. it covers Hangzhou, Wenzhou, Quzhou, Lishui, Lu’an, Xuancheng, Chizhou, Anqing and Huangshan City, covering a total area of 57,558.19 km2. This area is an important ecological reserve and food security area in China (Figure 2.).
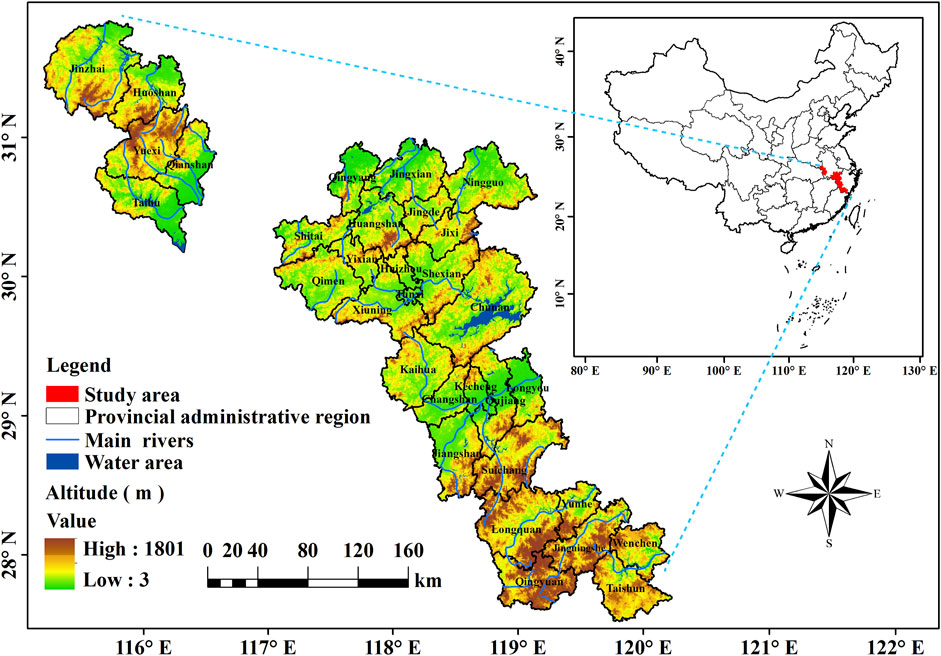
FIGURE 2. The research area.
The precondition of using the equivalent factor method to evaluate ESV is to construct an objective and accurate equivalent factor table. In this paper, based on the ESV calculation method proposed by Costanza et al. (1997), referring to the research results of Chinese ESV equivalent scale published by Xie et al. (2015), the ESs are divided into 11 categories. Meanwhile, combined with the research results proposed by Wang et al. (2010) the ESV is divided into market value and non-market value. We made a localized correction to the unit ecological service value equivalent factor, combined with the actual production capacity of Anhui and Zhejiang and the availability of data considerations, and selected wheat, cotton and rapeseed as the main grain crop species. By consulting the “National Compilation of Agricultural Product Cost-benefit Data in 2019” and the yearbooks of each region, the average grain yield was 5,686.484 kg/hm2 in the study area from 2000 to 2019. According to the economic value of one ESV equivalent factor is 1/7 of the average grain yield market value of the study area in 2019, the average grain price of the study area is 2.225 yuan/kg, and the economic value of natural grain yield of farmland was about 1807.095 yuan/hm2. Also, since ESV is susceptible to different factors, including physical geographic factors, willingness-to-pay and ability-to-pay, the coefficients need to be corrected when calculating ESV at the regional scale to further calculate the adjustment coefficient C. As has been mentioned above, ESV per unit area of different ecosystems in the study area is calculated (Table 2). The formulas are as follows:
Where
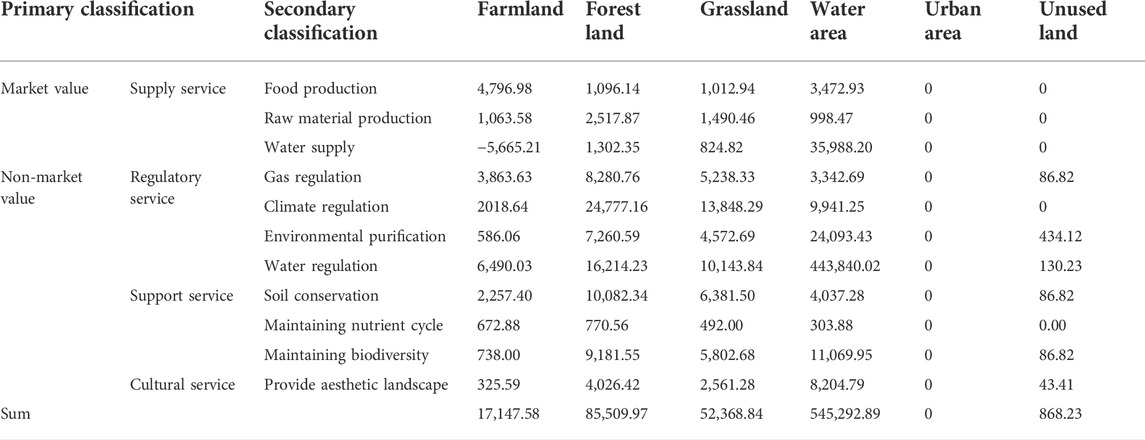
TABLE 2. Ecological service value per unit area of different ecosystems in the YRDEB.
This study corresponded the land use types to those close to the ecosystem types in the study by Xie et al. (2003, 2015). We have classified farmland, forestland and unused land corresponding to each other with farmland, forest and desert respectively, and residential, industrial, mining land and transportation land as urban area, and the ESV of urban area is taken as 0. The calculation formulas of ESV and individual ESV (
Where
This study proposed an EC priority index, which provides a basis for objectively reflecting the supply and demand of regional ESs and measuring the urgency of EC. The prioritization in this study was determined by two variables: the level of economic development and ESV. Since the market value (food production, raw material production and water supply values) has been converted into currency in the market mechanism and is reflected in the regional economic development, only non-market value is considered when estimating the ESV. The specific relation is as follows:
Where
This paper introduced the intensity of EC demand (the urgency of EC in different regions) and the conversion coefficient of non-market ESV (converted by regional actual non-market ESV) to reflect the regional differences in the amount of EC (Wang et al., 2010). The demand intensity coefficient of EC was characterized by the normalized result of EC priority. The specific expressions are as follows:
Where
The coefficient of sensitivity (CS) was introduced to verify the representativeness of ecosystem types for various land cover types and the accuracy of the selected ecological value coefficients, which is calculated as:
Where
The data used in this paper mainly includes land use, vegetation classification, socio-economic, main functional zoning and administrative data of Zhejiang and Anhui provinces. Among them, the land use and vegetation classification data were downloaded from the Resource and Environmental Science Data Center of the Chinese Academy of Sciences (https://www.resdc.cn/). The data was generated by manual visual interpretation based on Landsat TM imagery from the United States Landsat satellite (He et al., 2022). The land use types include six categories: farmland, forestland, grassland, urban area, water area and unused land. Socio-economic data were obtained from the statistical yearbooks and government website bulletins of cities and counties in the study area (Obtained on 28 November 2020). The “National Main Functional Area Planning,” “Zhejiang Provincial Main Functional Area Planning” and “Anhui Provincial Main Functional Area Planning” referenced in the division of the main functional area of each county (city and district) in the study area were from the documents published by the government. The administrative data was provided by the National Geographic Information Center on a scale of 1:4 million.
By using ArcGIS, the spatial distribution maps of three stages of various land areas, types of land use (Figure 3) and types of land use transfer were obtained (Figure 4). The area and proportion of land types in each period were calculated based on the classification of land use, as well as the absolute amount and rate of change of area for each land use type from 2000 to 2019. The results showed that forest, farmland and grassland were the main land use types in the YRDEB (Figure 3). The total area of these three types accounted for more than 95% of the total area. Among them, the proportion of forestland was the largest, which was 74.44%, 74.01% and 73.70% in the three stages. In terms of the amount of change, the land use change in the study area from 2000 to 2019 showed that urban area, water area, and grassland increased, while forestland, farmland, and unused land decreased. The urban area increased the most, which was 76,589.55 hm2, the proportion increased from 0.69% in 2000 to 2.02% in 2019. Forestland decreased the most with a decrease of 42,022.89 hm2, followed by farmland with a decrease of 42,022.89 hm2 and the rest of the land with a little change. The spatial distribution of different land use types of transfer was explored from 2000–2019, and it was found that the maximum amount of farmland-forestland transfer was 440.73 hm2, farmland-grassland transfer was 42.57 hm2, and farmland-water area transfer was 15.66 hm2, the forestland-farmland conversion was 436.32 hm2, and forestland-grassland transfer was 209.25 hm2, while the urban area-farmland shifted 10.8 hm2.
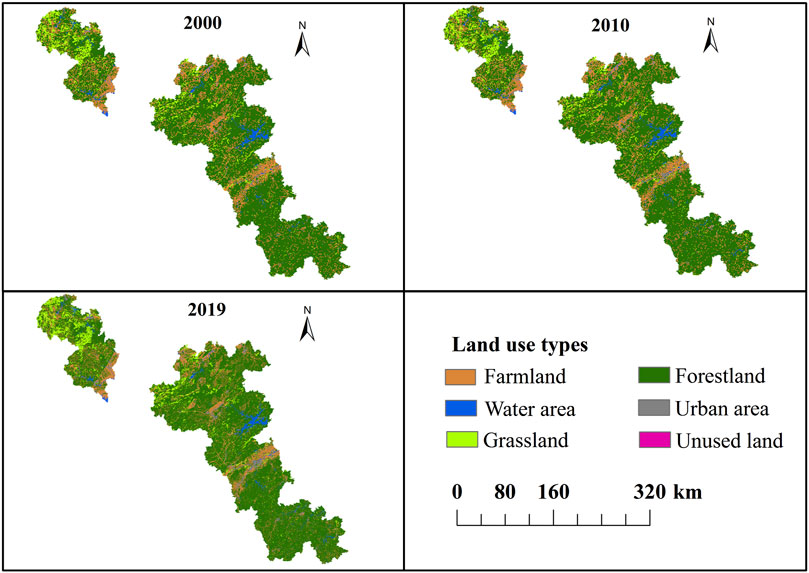
FIGURE 3. Spatial distribution of land use types in YRDEB from 2000 to 2019.
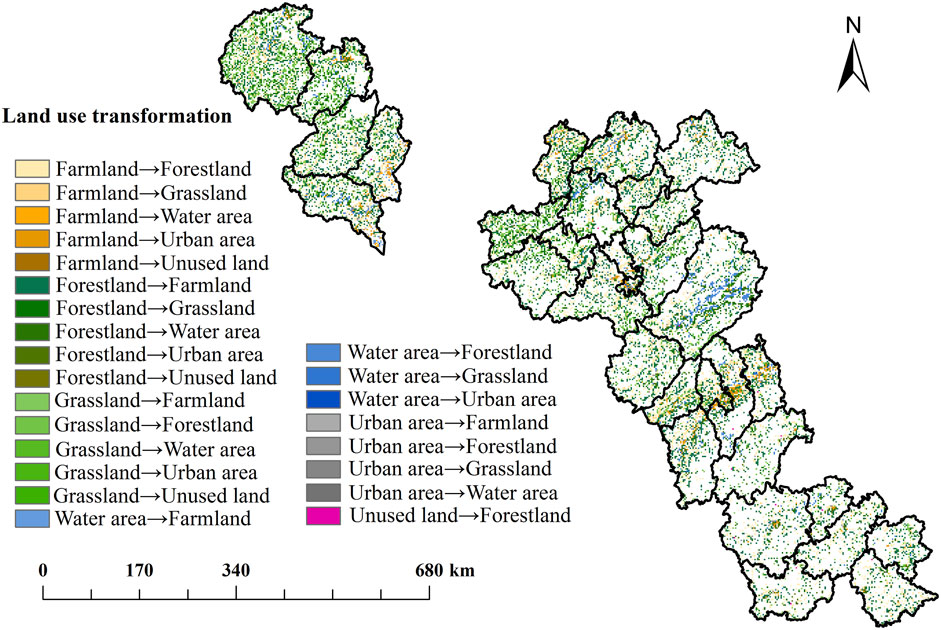
FIGURE 4. Spatial distribution map of land use type transfer in YRDEB from 2000 to 2019. Changes of ESV and sensitivity test.
As we can see from Figure 5, the ESV such as climate regulation, hydrological regulation and soil conservation was more prominent. With the change of land area, the total ESV in the study area increased first and then decreased from 2000 to 2019, and the total ESV decreased by 0.75 billion CNY. Specifically, forestland and water area were the main providers of ESV of the YRDEB, accounting for more than 90% in the three periods. In terms of the absolute value, from 2000 to 2019, the total value of forestland decreased the most, the change rate of farmland was -4.71%, which decreased by 720 million CNY. The ESV in water area increased year by year, with a cumulative increase of 4.309 billion CNY and a growth rate of 7.29%.
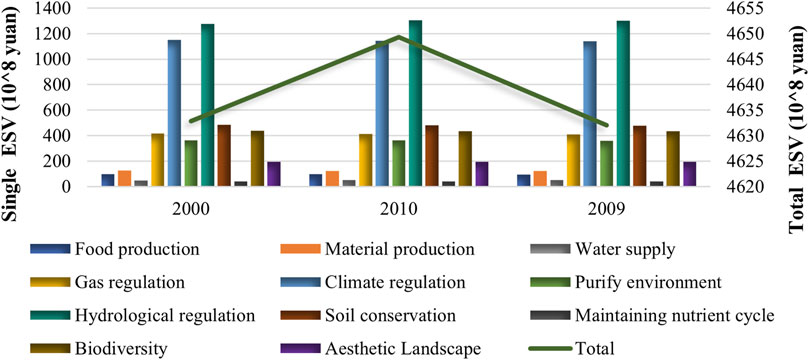
FIGURE 5. The single service value and the total value of ecosystem in YRDEB in 2000, 2010, 2019.
From the perspective of every single ESV (Supplementary Appendix Figure S1), the proportion of the same ESV was relatively stable from 2000 to 2019, but there were significant differences in the proportion of each ESV during the same period. Among them, the value of hydrologic adjustment and climate regulation accounted for more than 50% of the total value, followed by soil conservation and gas regulation, accounting for more than 19% of the total value, the smallest was to maintain the nutrient cycle, accounting for less than 1%. From the dynamic point of view, the overall growth of hydrological regulation services from 2000–2019 was 1.99%, and ESV decreased steadily.
From the spatial point of view (Figure 6), the areas with high ESV in the study area were mainly located in central Chun’an County, northern Huangshan District, and northeastern Jinzhai County. The EVS increased significantly in the northern and southern areas of the study area, including parts of Huangshan District, Huoshan County, Longyou County, Longquan City, Suichang County, and Yunhe County. According to Figure 3, forestland and water areas were the main land use types in the above-mentioned areas. The areas with an ESV less than 1 million CNY in the unit grid showed a decreasing trend from 2000 to 2019, mainly in the northern part of Jinzhai County, the northeastern part of Huoshan County, and the southeastern part of Qianshan County, and the southern part of Taihu County. Overall, the ESV of the grid units in the YRDEB showed spatial variability of high in the south and low in the north, and high in the east and low in the west.
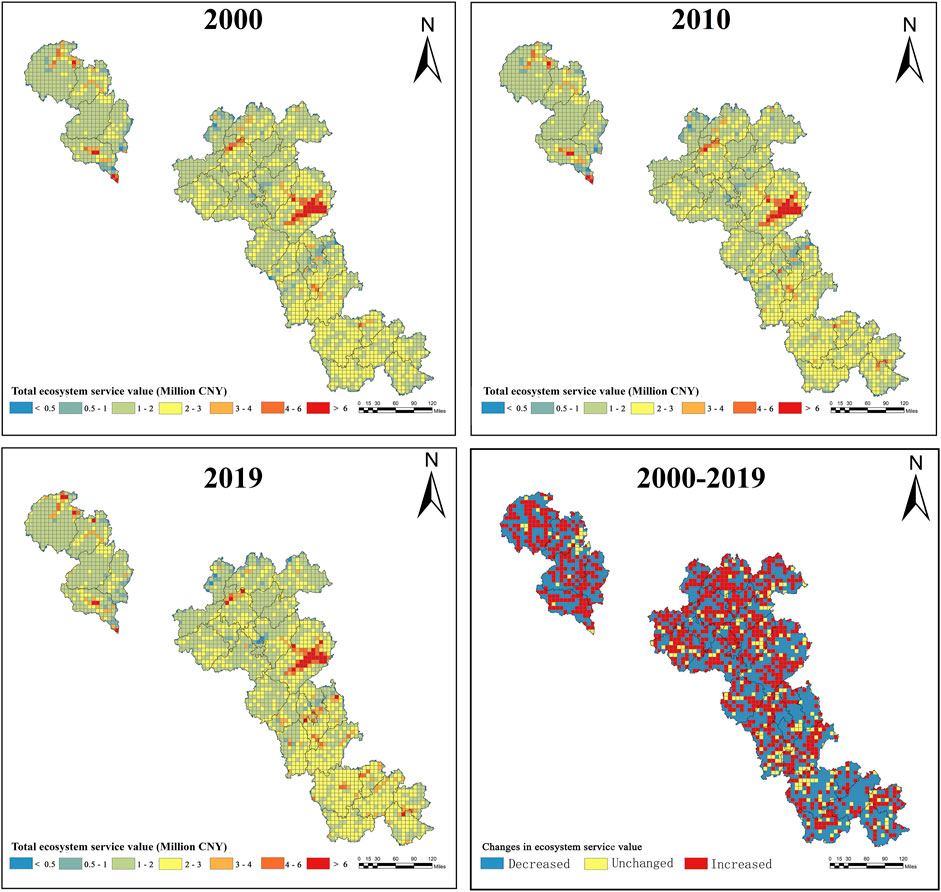
FIGURE 6. Spatial distribution of ESV in the YRDEB from 2000 to 2019.
According to the above formula, the VC of 5 land use types were adjusted by 50% up and down to calculate the sensitivity index, to reflect the sensitivity of the ESV to the value coefficient in the YRDEB. As we can see from Table 3, the ESV sensitivity coefficients for each land use type were less than 1, indicating that the chosen ecological value coefficients were suitable for the study of the YRDEB and were inelastic. Horizontally, the sensitivity coefficients of each type of ESV did not change much in each period, among which farmland, forestland, and unused land decreased year by year, grassland showed a decrease and then an increase, and the sensitivity coefficient of water area increased year by year from 0.12 in 2000 to 0.13 in 2019, reflecting its continuous contribution to ESV.

TABLE 3. Sensitivity index of ESs value in YRDEB from 2000 to 2019.
In 2019, the theoretical EC of the YRDEB was 38.098 billion CNY (Supplementary Appendix Table S1). Among the 32 compensation areas, Chun’an County received the highest compensation, reaching 5.668 billion CNY, accounting for 14.9% of the total compensation; followed by Jinzhai County with 2.987 billion CNY, accounting for 7.8%. Ke Cheng District and Tunxi District received a smaller amount of ecological compensation, accounting for only 0.18% of the total amount of compensation (Supplementary Appendix Table S2). In terms of the proportion of the compensation amount to GDP, the EC amount of each county (city and district) in the study area was smaller than the local GDP of that year, but the proportion difference among the different regions was large, the extreme difference was 0.43, and there were 14 counties, accounting for 44% of the total area, whose total compensation was less than 0.09% of the total GDP. From the priority index distribution (Figure 7), Shitai County has the highest priority, and Jingning County, Qimen County, Jinzhai County and Chun’an County are also located in high-value areas, indicating that the output capacity of ecological value was strong, and the regional economic level was relatively backward. Regional ecological protection bore great development pressure and should be paid for first.
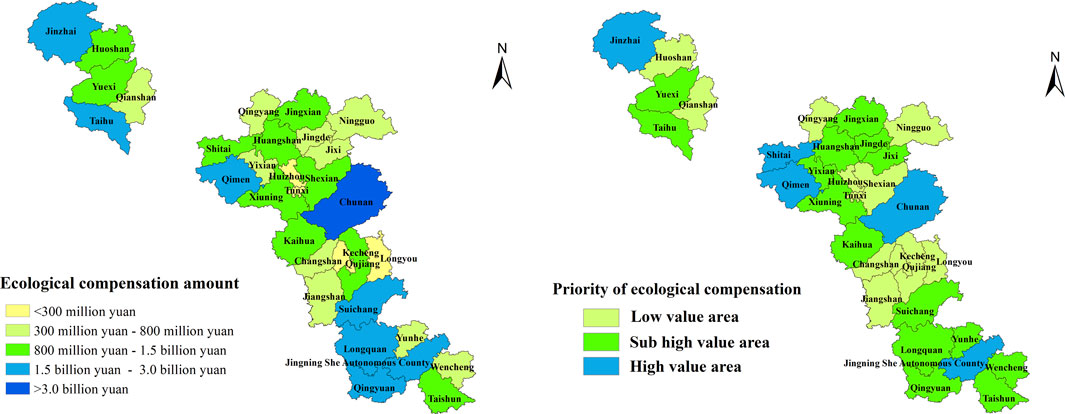
FIGURE 7. EC amount and priority level of counties (districts) in YRDEB.
The origin of this research is to try to design a frame that accords with the Chinese system characteristic to explain the EC practice in China. The Chinese government regards ecological civilization as the development strategy of the whole country, and the EC project is an important part of this strategy (Liu et al., 2021). Government action is not constrained by economic rationality. It is motivated by multiple political goals that are “bundled” (Lv et al., 2015), such as alleviating poverty through EC (Fan et al., 2020). In China, EC entails not only the monetized expression of ESs, but also includes a range of policies and institutions (Li et al., 2016; Hagedoorn et al., 2021). The implementation of EC is based on China’s main functional area planning, which takes the development, protection and utilization of natural resources into account (Zhang and Zong, 2010). The main functional areas set up ‘key development zone, optimized development zone, restricted development zone and prohibited development zone’ with the county as an administrative unit. The starting point of the plan is not only space development based on the carrying capacity of natural resources, but also defines the development rights of different regions by means of government intervention. EC can be regarded as compensation for areas that have sacrificed the right to develop.
We believe that ecological compensation under the guidance of spatial planning mitigates the extensive development behavior in the past. The period 2000–2019 is a 20-year period of rapid urbanization in China. The growth rate of urban area in the Yangtze River Delta area is 6.21%. In contrast, the growth rate of urban area in the study area is only 1.33%. One of the reasons is that China has limited the urbanization and industrialization of the YRDEB through the main function area planning (Yang et al., 2018). At the same time, we found that 498.96 hm2 of farmland was transferred to the forestland, grassland and water area, which was benefited from the biggest ecological space construction project in China - The conversion of farmland to the forestland (Yang et al., 2020). At present, the government has invested over $51.95 billion in this project. The conversion of farmland to the forestland was introduced to the world as a typical case of EC (Bennett, 2008; He and Sikor, 2015).
The evaluation of ESV has been carried out on a global scale for more than 20 years, but we rarely see cases where payments are made according to this logic (Li et al., 2022). We do not deny the need for price assessment, because a clearer understanding of ESV can help to connect nature with society and make better decisions (Braat and De Groot, 2012). Without “prices” it is impossible to solve a series of problems arising from the neoliberal economy under the logic of neoliberalism (Jia and Zhao, 2006). In order to obtain a more reasonable compensation amount, we did not use ESV directly as the criterion for compensation proposal but used GDP for correction. The results show that in 2019, the theoretical EC of the YRDEB is 38.098 billion CNY, accounting for 9% of the region’s GDP. However, we think that this value is still just a reference value. Since “price” do not come from evaluation, “price” should be internalized in the value and supply-demand, and reflected in the market exchange.
We proposed a priority proposal of accepting EC as a further application after ESV. This means that this value can be transferred into feasible actions, such as the prioritization of EC to determine a “right of access to funds”. EC is not necessarily a “monetary” compensation, but can also be a policy compensation, a development right compensation. In part 4.3, five counties were given priority to receive compensation, namely Shitai County, jingning, Qimen County, Jinzhai County and Chun’an County. The meaning of this study is that we can jump out the debate of whether it makes sense of monetary compensation, and move on to applying value assessment to the prioritization of development authority, it may provide a solution to the current difficult situation of PES and EC implementation on a global scale.
EC should consider not only monetary compensation, but also system and policy (He B. J. et al., 2022). Because the nature of ecological compensation is not only an economic means to regulate the interests of stakeholders, but also a series of participants to affect the supply and demand of ESs decision-making process (Metzger et al., 2020). Direct financial support to receiving EC areas is model of “Blood-transfusion,” which is consider to be an inefficient way of compensation (Li et al., 2020). The “blood-making” EC emphasizes multiple policy supplies. In Section 4.3, we identified the priority levels of EC for different regions. We should design a more diverse approach to EC in the context of current Chinese national policies. For example, we should expand market-based green finance in these regions and develop financing tools based on water rights, emission rights, carbon emission rights, and other types of resource and environmental rights. As far as we know, Chun’an County and Chizhou City have already formulated relevant policies. The EC project of Xin’an River in Chun’an County is also taken as a typical case of government-led EC in China (Ren et al., 2021). We can moderately guide the population in ecologically important areas with high environmental carrying pressure to gradually and orderly move outward and reduce human disturbance to the natural ecosystem. China’s “EC for immigration” policy is an important part of China’s poverty alleviation strategy. Since 2011, China’s Ningxia Hui Autonomous Region has been home to nearly 1.3 million eco-migrants. From 2016 to 2020,1.42 million people were relocated in Guizhou, China. In addition, other ways include industrial transfer, personnel training, and park co-construction.
We developed a decision-making framework of “Subject choice, Value accounting, Priority evaluation, Policy supply” for EC in the context of China’s current system. Taking the YRDEB as a case study, the spatio-temporal changes of its ESV were calculated and analyzed by using relevant data and methods from the spatial perspective, the spatial subject selection and compensation order of EC space were studied. The results show that the ESV in the study area increases first and then decreases. Forestland and water area are the main providers of ecosystem services value in the study area, the proportion of individual ESs was relatively stable. The spatial pattern of ESV showed a high in the south and a low in the north, and a high in the east and a low in the west. The theoretical amount of EC in the YRDEB is RMB 38,098.11 billion, accounting for a relatively low proportion of GDP. Chun’an County should receive the largest amount of compensation, and Shitai County is the highest priority area for compensation. We determine the priority of EC based on the spatial planning and ESV, and put forward the corresponding countermeasures. We hope that this study will optimize future EC practice.
Although this paper has designed a complete framework and carried out empirical studies, there are still many deficiencies: First, although this study has made localized corrections of the “ESV equivalent per unit area in China” proposed by Xie et al. (2015), the problem of spatial heterogeneity of the ecological service value of different valuation objects cannot be completely solved due to the limitation of data information. Second, for the reason that most of the county-level and even city-level ecological environment statistics are lagging behind, the depth of the study has been hindered. Third, the dynamic evaluation of priority is very important. However, these problems do not affect the reference significance of this paper in methodologies and conclusions.
The datasets presented in this study can be found in online repositories. The names of the repository/repositories and accession number(s) can be found in the article/Supplementary Material.
ZW: Conceptualization, Formal analysis, Writing—original draft. DM: Methodology, Visualization, Writing–original draft. JL: Validation, Supervision, Writing—review and editing. YW: Conceptualization, Writing—review and editing. ZZ: Conceptualization, Writing—review and editing. FY: Writing—review and editing. All authors have read and agreed to the published version of the manuscript.
This research was funded by the National Natural Science Foundation of China, grant numbers 42171178.
The authors declare that the research was conducted in the absence of any commercial or financial relationships that could be construed as a potential conflict of interest.
All claims expressed in this article are solely those of the authors and do not necessarily represent those of their affiliated organizations, or those of the publisher, the editors and the reviewers. Any product that may be evaluated in this article, or claim that may be made by its manufacturer, is not guaranteed or endorsed by the publisher.
The Supplementary Material for this article can be found online at: https://www.frontiersin.org/articles/10.3389/fenvs.2022.1002014/full#supplementary-material
Adhikari, R. K., Kindu, M., Pokharel, R., Castro, L. M., and Knoke, T. (2017). Financial compensation for biodiversity conservation in Ba Be national park of northern vietnam. J. Nat. Conserv. 35, 92–100. doi:10.1016/j.jnc.2016.12.003
Banks-Leite, C., Pardini, R., Tambosi, L. R., Pearse, W. D., Bueno, A. A., Bruscagin, R. T., et al. (2014). Using ecological thresholds to evaluate the costs and benefits of set-asides in a biodiversity hotspot. Science 345, 1041–1045. doi:10.1126/science.1255768
Bennett, M. T. (2008). China's sloping land conversion program: institutional innovation or business as usual? Ecol. Econ. 65, 699–711. doi:10.1016/j.ecolecon.2007.09.017
Braat, L. C., and De Groot, R. (2012). The ecosystem services agenda: bridging the worlds of natural science and economics, conservation and development, and public and private policy. Ecosyst. Serv. 1, 4–15. doi:10.1016/j.ecoser.2012.07.011
Bremer, L. L., Farley, K. A., and Lopez-Carr, D. (2014). What factors influence participation in payment for ecosystem services programs? An evaluation of Ecuador's SocioPáramo program. Land use policy 36, 122–133. doi:10.1016/j.landusepol.2013.08.002
Burke, M., Hsiang, S. M., and Miguel, E. (2015). Global non-linear effect of temperature on economic production. Nature 527, 235–239. doi:10.1038/nature15725
Cao, H., Li, M., Qin, F., Xu, Y., Zhang, L., and Zhang, Z. (2022). Economic development, fiscal ecological compensation, and ecological environment quality. Int. J. Environ. Res. Public Health 19, 4725. doi:10.3390/ijerph19084725
Ceballos, G., Ehrlich, P. R., Barnosky, A. D., García, A., Pringle, R. M., and Palmer, T. M. (2015). Accelerated modern human–induced species losses: Entering the sixth mass extinction. Sci. Adv. 1, e1400253. doi:10.1126/sciadv.1400253
Chan, K., Satterfield, T., and Goldstein, J. (2012). Rethinking ecosystem services to better address and navigate cultural values. Ecol. Econ. 74, 8–18. doi:10.1016/j.ecolecon.2011.11.011
Chen, Y., Yang, J., Yang, R., Xiao, X., and Xia, J. (2022). Contribution of urban functional zones to the spatial distribution of urban thermal environment. Build. Environ. 216, 109000. doi:10.1016/j.buildenv.2022.109000
Chu, X., Zhan, J., Wang, C., Hameeda, S., and Wang, X. (2020). Households' willingness to accept improved ecosystem services and influencing factors: Application of contingent valuation method in Bashang Plateau, Hebei Province, China. J. Environ. Manage. 255, 109925. doi:10.1016/j.jenvman.2019.109925
Costanza, R., D'Arge, R., De Groot, R., Farber, S., Grasso, M., Hannon, B., et al. (1997). The value of the world's ecosystem services and natural capital. Nature 387, 253–260. doi:10.1038/387253a0
Costanza, R., De Groot, R., Braat, L., Kubiszewski, I., Fioramonti, L., Sutton, P., et al. (2017). Twenty years of ecosystem services: How far have we come and how far do we still need to go? Ecosyst. Serv. 28, 1–16. doi:10.1016/j.ecoser.2017.09.008
Cuperus, R., Canters, K. J., de Haes, H. A. U., and Friedman, D. S. (1999). Guidelines for ecological compensation associated with highways. Biol. Conserv. 90, 41–51. doi:10.1016/S0006-3207(99)00007-5
Daily, G. C. (1997). Nature’s services: Societal dependence on natural ecosystems. Washington D.C: Island Press.
Du, W., Yan, H., Feng, Z., Yang, Y., and Liu, F. (2021). The supply-consumption relationship of ecological resources under ecological civilization construction in China. Resour. Conserv. Recycl. 172, 105679. doi:10.1016/j.resconrec.2021.105679
Engel, S., Pagiola, S., and Wunder, S. (2008). Designing payments for environmental services in theory and practice: An overview of the issues. Ecol. Econ. 65, 663–674. doi:10.1016/j.ecolecon.2008.03.011
Fagan, M. E., DeFries, R. S., Sesnie, S. E., Arroyo‐Mora, J. P., and Chazdon, R. L. (2016). Targeted reforestation could reverse declines in connectivity for understory birds in a tropical habitat corridor. Ecol. Appl. 26, 1456–1474. doi:10.1890/14-2188
Fan, M., Chen, L., and Wang, Q. (2019). Assessing the high impacts of land use change: Spatial characteristics of land uses and ecological compensation based on payment for ecosystem services model in a mountainous area, China. Mitig. Adapt. Strateg. Glob. Chang. 24, 1431–1460. doi:10.1007/s11027-019-09858-5
Fan, J., Zhou, K., and Wu, J. (2020). Typical study on sustainable development in relative poverty areas and policy outlook of China. Bull. Chin. Acad. Sci. 35, 1249–1263. doi:10.16418/j.issn.1000-3045.20201008001
Fletcher, R., and Büscher, B. (2017). The PES conceit: Revisiting the relationship between payments for environmental services and neoliberal conservation. Ecol. Econ. 132, 224–231. doi:10.1016/j.ecolecon.2016.11.002
Gómez-Baggethun, E., De Groot, R., Lomas, P. L., and Montes, C. (2010). The history of ecosystem services in economic theory and practice: From early notions to markets and payment schemes. Ecol. Econ. 69, 1209–1218. doi:10.1016/j.ecolecon.2009.11.007
Grêt-Regamey, A., Altwegg, J., Sirén, E. A., Van Strien, M. J., and Weibel, B. (2017). Integrating ecosystem services into spatial planning—a spatial decision support tool. Landsc. Urban Plan. 165, 206–219. doi:10.1016/j.landurbplan.2016.05.003
Hagedoorn, L. C., Koetse, M. J., and van Beukering, P. J. (2021). Estimating benefits of nature-based solutions: Diverging values from choice experiments with time or money payments. Front. Environ. Sci. 275. doi:10.3389/fenvs.2021.686077
He, J., and Sikor, T. (2015). Notions of justice in payments for ecosystem services: Insights from China's sloping land conversion program in yunnan province. Land Use Policy 43, 207–216. doi:10.1016/j.landusepol.2014.11.011
He, B. J., Wang, J., Zhu, J., and Qi, J. (2022). Beating the urban heat: Situation, background, impacts and the way forward in China. Renew. Sustain. Energy Rev. 161, 112350. doi:10.1016/j.rser.2022.112350
He, F., Yang, J., Zhang, Y., Sun, D., Wang, L., Xiao, X., et al. (2022). Offshore island connection line: A new perspective of coastal urban development boundary simulation and multi-scenario prediction. Gisci. Remote Sens. 59, 801–821. doi:10.1080/15481603.2022.2071056
Huang, H., Yang, H., Deng, X., Hao, C., Liu, Z., Liu, W., et al. (2020). Analyzing the influencing factors of urban thermal field intensity using big-data-based GIS. Sustain. Cities Soc. 55, 102024. doi:10.1016/j.scs.2020.102024
Huang, H., Yang, H., Chen, Y., Chen, T., Bai, L., and Peng, Z. R. (2021). Urban green space optimization based on a climate health risk appraisal–A case study of Beijing city, China. Urban For. Urban Green. 62, 127154. doi:10.1016/j.ufug.2021.127154
Jia, G., and Zhao, K. (2006). Evolutionary economics and Neo - liberalism are totally different economic policy views. Comp. Econ. Soc. Syst. 2, 137–143. doi:10.3969/j.issn.1003-3947.2006.02.025
Li, G., Fang, C., and Wang, S. (2016). Exploring spatiotemporal changes in ecosystem-service values and hotspots in China. Sci. Total Environ. 545, 609–620. doi:10.1016/j.scitotenv.2015.12.067
Li, J., Deng, X., Zhang, F., and Cai, C. (2020). The effects of ecological forest compensation on farmers' income from the perspective of incentive compatibility theory: An empirical study in Sanming, Fujian. J. Nat. Resour. 35, 2942–2955. doi:10.31497/zrzyxb.20201210
Li, J., Li, L., Wang, J., Zhou, C., Niu, Q., Zhang, C., et al. (2021). Priority areas recognition of ecological compensation for soil and water conservation: Taking Dongting Lake Eco-economic Zone as an example. J. Ecol. Rural. Environ. 37, 474–483. doi:10.19741/j.issn.1673-4831.2020.0848
Li, H., Ren, J., Li, N., Fu, B., Song, Y., and Xu, H. (2022). Research hotspot and case analysis of ecological compensation based on bibliometrics. Ecol. Sci. 41, 171–180. doi:10.14108/j.cnki.1008-8873.2022.04.020
Li, Y. (2011). Study on construction method and implementation approaches of ecological compensation mechanism for China’s nature reserves. Ecol. Environ. Sci. 20, 1957–1965. doi:10.16258/j.cnki.1674-5906.2011.12.034
Liu, M., Bai, Y., Ma, N., Rao, D., Yang, L., and Min, Q. (2020). Blood transfusion or hematopoiesis? How to select between the subsidy mode and the long-term mode of eco-compensation. Environ. Res. Lett. 15, 094059. doi:10.1088/1748-9326/ab9793
Liu, Z., Wu, R., Chen, Y., Fang, C., and Wang, S. (2021). Factors of ecosystem service values in a fast-developing region in China: Insights from the joint impacts of human activities and natural conditions. J. Clean. Prod. 297, 126588. doi:10.1016/j.jclepro.2021.126588
Lv, Y., Liu, X., Liu, Y., and Zeng, Y. (2015). Lee kuan yew: How can Singapore govern effectively. Beijing: Beijing Book Co. Inc.
Mascarenhas, A., Ramos, T. B., and Nunes, L. (2012). Developing an integrated approach for the strategic monitoring of regional spatial plans. Land Use Policy 29, 641–651. doi:10.1016/j.landusepol.2011.10.006
Metzger, J. P., Fidelman, P., Sattler, C., Schroter, B., Maron, M., Eigenbrod, F., et al. (2020). Connecting governance interventions to ecosystem services provision: A social-ecological network approach. People Nat. Hob. 3, 266–280. doi:10.1002/pan3.10172
Millennium_Ecosystem_Assessment (2005). Ecosystems and human well-being: General synthesis. Washington, D.C: Island Press.
Moran, D., McVittie, A., Allcroft, D. J., and Elston, D. A. (2007). Quantifying public preferences for agri-environmental policy in scotland: A comparison of methods. Ecol. Econ. 63, 42–53. doi:10.1016/j.ecolecon.2006.09.018
Moreira, M., Fonseca, C., Vergílio, M., Calado, H., and Gil, A. (2018). Spatial assessment of habitat conservation status in a macaronesian island based on the InVEST model: A case study of pico island (azores, Portugal). Land Use Policy 78, 637–649. doi:10.1016/j.landusepol.2018.07.015
Muradian, R., Corbera, E., Pascual, U., Kosoy, N., and May, P. H. (2010). Reconciling theory and practice: An alternative conceptual framework for understanding payments for environmental services. Ecol. Econ. 69, 1202–1208. doi:10.1016/j.ecolecon.2009.11.006
Muradian, R., Arsel, M., Pellegrini, L., Adaman, F., Aguilar, B., Agarwal, B., et al. (2013). Payments for ecosystem services and the fatal attraction of win‐win solutions. Conserv. Lett. 6, 274–279. doi:10.1111/j.1755-263X.2012.00309.x
Ouyang, Z., Song, C., Zheng, H., Polasky, S., Xiao, Y., Bateman, I. J., et al. (2020). Using gross ecosystem product (GEP) to value nature in decision making. Proc. Natl. Acad. Sci. U. S. A. 117, 14593–14601. doi:10.1073/pnas.1911439117
Ren, Y., Lu, L., Yu, H., and Zhu, D. (2021). Game strategies in government-led eco-compensation in the Xin’an River Basin from the perspective of the politics of scale. J. Geogr. Sci. 31, 1205–1221. doi:10.1007/s11442-021-1893-1
Salzman, J., Bennett, G., Carroll, N., Goldstein, A., and Jenkins, M. (2018). The global status and trends of payments for ecosystem services. Nat. Sustain. 1, 136–144. doi:10.1038/s41893-018-0033-0
Schrter, M., Zanden, E., Oudenhoven, A., Remme, R. P., Serna‐Chavez, H. M., Groot, R., et al. (2014). Ecosystem services as a contested concept: A synthesis of critique and counter‐arguments. Conserv. Lett. 7, 514–523. doi:10.1111/conl.12091
Shang, W., Gong, Y., Wang, Z., and Stewardson, M. J. (2018). Eco-compensation in China: Theory, practices and suggestions for the future. J. Environ. Manage. 210, 162–170. doi:10.1016/j.jenvman.2017.12.077
Soh, M., and Cho, S. (2019). Spatial targeting of payments for ecosystem services to achieve conservation goals and promote social equity and economic impact. Nat. Resour. Model. 32, e12219. doi:10.1111/nrm.12219
Su, Z., Wang, Z., and Zhang, L. (2022). Spatial-temporal characteristics of ecosystem service values of watershed and ecological compensation scheme considering its realization in spatial planning. Sustainability 14, 8204. doi:10.3390/su14138204
Tafoya, K. A., Brondizio, E. S., Johnson, C. E., Beck, P., Wallace, M., Quirós, R., et al. (2020). Effectiveness of Costa Rica’s conservation portfolio to lower deforestation, protect primates, and increase community participation. Front. Environ. Sci. 8, 580724. doi:10.3389/fenvs.2020.580724
Van Hecken, G., Bastiaensen, J., and Huybrechs, F. (2015). What’s in a name? epistemic perspectives and payments for ecosystem services policies in Nicaragua. Geoforum 63, 55–66. doi:10.1016/j.geoforum.2015.05.020
Van Hecken, G., Kolinjivadi, V., Windey, C., McElwee, P., Shapiro-Garza, E., Huybrechs, F., et al. (2018). Silencing agency in payments for ecosystem services (PES) by essentializing a neoliberal ‘monster’into being: a response to fletcher & büscher's ‘PES conceit. Ecol. Econ. 144, 314–318. doi:10.1016/j.ecolecon.2017.10.023
Wang, N., Liu, J., Daqian, W. U., Gao, S., and Wang, R. (2010). Regional eco-compensation based on ecosystem service assessment: a case study of Shandong province. Acta Ecol. Sin. 30, 66466653. doi:10.1016/S1872-5813(11)60001-7
Wang, Z., Sun, D., Hu, C., Wang, Y., and Zhang, J. (2022). Seasonal contrast and interactive effects of potential drivers on land surface temperature in the Sichuan Basin, China. Remote Sens. (Basel). 14 (5), 1292. doi:10.3390/rs14051292
Wunder, S., Brouwer, R., Engel, S., Ezzine-de-Blas, D., Muradian, R., Pascual, U., et al. (2018). From principles to practice in paying for nature’s services. Nat. Sustain. 1, 145–150. doi:10.1038/s41893-018-0036-x
Wunder, S. (2007). The efficiency of payments for environmental services in tropical conservation. Conserv. Biol. 21, 48–58. doi:10.1111/j.1523-1739.2006.00559.x
Wunder, S. (2015). Revisiting the concept of payments for environmental services. Ecol. Econ. 117, 234–243. doi:10.1016/j.ecolecon.2014.08.016
Wünscher, T., and Engel, S. (2012). International payments for biodiversity services: Review and evaluation of conservation targeting approaches. Biol. Conserv. 152, 222–230. doi:10.1016/j.biocon.2012.04.003
Xie, G., Lu, C., Leng, Y., Zheng, D., and Li, S. (2003). Ecological assets valuation of the Tibetan Plateau. J. Nat. Resour. 18, 189–196. doi:10.11849/zrzyxb.2003.02.010
Xie, G., Zhang, C., Zhang, L., Chen, W., and Li, S. (2015). Improvement of the evaluation method for ecosystem service value based on per unit area. J. Nat. Resour. 30, 1243–1254. doi:10.11849/zrzyxb.2015.08.001
Xie, Y., Wang, L., An, R., Luo, X., Lu, Y., Liu, Y., et al. (2022). The effect of sloping land conversion program on soil erosion in shaanxi province, China: A spatial panel approach. Front. Environ. Sci. 10, 913712. doi:10.3389/fenvs.2022.913712
Yang, J., Guan, Y., Xia, J. C., Jin, C., and Li, X. (2018). Spatiotemporal variation characteristics of green space ecosystem service value at urban fringes: A case study on ganjingzi district in dalian, China. Sci. Total Environ. 639, 1453–1461. doi:10.1016/j.scitotenv.2018.05.253
Yang, Y., Yao, C., and Xu, D. (2020). Ecological compensation standards of national scenic spots in western China: A case study of taibai mountain. Tour. Manag. 76, 103950–103950.17. doi:10.1016/j.tourman.2019.103950
Yu, H., Xie, W., Yang, L., Du, A., Almeida, C. M., and Wang, Y. (2020). From payments for ecosystem services to eco-compensation: Conceptual change or paradigm shift? Sci. Total Environ. 700, 134627. doi:10.1016/j.scitotenv.2019.134627
Yu, H., Yang, J., Li, T., J., and Sun, D. (2022a). Morphological and functional polycentric structure assessment of megacity: An integrated approach with spatial distribution and interaction. Sustain. Cities Soc. 80, 103800. doi:10.1016/j.scs.2022.103800
Yu, H., Yang, J., Sun, D., Li, T., and Liu, Y. (2022b). Spatial responses of ecosystem service value during the development of urban agglomerations. Land 11, 165. doi:10.3390/land11020165
Zhang, X., and Zong, Y. (2010). Application of model and method in the planning of region major functional zones—a case study of beijing–tianjin region, China. Sci. Geog. Sin. 30, 728–734. doi:10.1097/ICO.0b013e3182000add
Keywords: spatial planning, ecosystem services value, ecological compensation, compensation priority, main function area
Citation: Wang Z, Wang Y, Zhou Z, Yu F, Ma D and Li J (2022) Combining spatial planning and ecosystem services value to assist ecological compensation decision-making—A case study of Yangtze River Delta ecological barrier, China. Front. Environ. Sci. 10:1002014. doi: 10.3389/fenvs.2022.1002014
Received: 24 July 2022; Accepted: 09 August 2022;
Published: 01 September 2022.
Edited by:
Jun Yang, Northeastern University, ChinaReviewed by:
Huisheng Yu, Northeastern University, ChinaCopyright © 2022 Wang, Wang, Zhou, Yu, Ma and Li. This is an open-access article distributed under the terms of the Creative Commons Attribution License (CC BY). The use, distribution or reproduction in other forums is permitted, provided the original author(s) and the copyright owner(s) are credited and that the original publication in this journal is cited, in accordance with accepted academic practice. No use, distribution or reproduction is permitted which does not comply with these terms.
*Correspondence: Debin Ma, MjIzNTQxOTIwNEBxcS5jb20=; Jiaming Li, bGlqbUBpZ3NucnIuYWMuY24=
Disclaimer: All claims expressed in this article are solely those of the authors and do not necessarily represent those of their affiliated organizations, or those of the publisher, the editors and the reviewers. Any product that may be evaluated in this article or claim that may be made by its manufacturer is not guaranteed or endorsed by the publisher.
Research integrity at Frontiers
Learn more about the work of our research integrity team to safeguard the quality of each article we publish.