 Simone LeoniJanusz DominikDaniele CassinGiorgia ManfèDavide TagliapietraFrancesco Acri
 Roberto Zonta*
- Consiglio Nazionale delle Ricerche - Istituto di Scienze Marine (CNR-ISMAR), Venezia, Italy
From October 2020, the MOSE system went into operation in the three inlets to protect Venice and its lagoon from flooding caused by high tide events in the Adriatic Sea. While the MOSE increases the prospect of physical defense, how will the new status of a regulated lagoon affect the functioning of the waterbody? In particular, the dissolved oxygen balance in the water column can be affected by the expected increase in water residence times. Sediments play an important role in oxygen consumption in the water column and for this reason sediment oxygen demand (SOD) was studied in situ for the first time, in 16 sites at four lagoon areas. SOD rate, measured throughout 2021 with specially made benthic chambers, varied in the different areas and with seasons (from 0.63 to 24.00 g m−2 d−1), with higher values at the more confined sites and significantly lower values in those belonging to the open lagoon. Based on SOD rate, consumption times of dissolved oxygen in the water column were estimated at the MOSE closures, from saturation values to hypoxia and in the temperature range of 11.7–33.3°C. Especially in the confined sites, sediments can exert an important depleting action on dissolved oxygen already at water temperatures above 20°C, which are not particularly high for the lagoon.
Introduction
Dissolved oxygen (DO) in the water column is essential for aquatic life and its concentration is a direct indicator of ecosystem health (Vellidis et al., 2006; MacPherson et al., 2007). Low DO concentrations are harmful to aquatic life, to the point that hypoxia (< 2.8 mg L−1) or anoxia (absence of oxygen) events entail damage to the population structure and ecosystem functioning (Diaz and Rosenberg, 1995; Altieri and Diaz, 2019). Oxygen solubility in water is inversely proportional to temperature and decreases in warmer waters (Garcia and Gordon, 1992). As the threat from global warming increases, one of the main consequences is the decrease in oxygen in aquatic environments (Breitburg et al., 2018; Pitcher et al., 2021). Other processes that decrease DO concentration include water column stratification that reduces the downward supply of O2-rich surface waters (Manabe et al., 1991; Collins et al., 2013; Breitburg et al., 2018), land use and agricultural activities that implicate nutrient enrichment in water (Kemp et al., 2005), and nocturnal oxygen consumption via respiration (Caraco and Caraco, 2002).
Major sources of DO are photosynthetic production and re-aeration from the atmosphere, whereas natural sinks are sediment oxygen demand (SOD) and biochemical oxygen demand (BOD) of the water column (Rounds and Doyle 1997; Rong et al., 2016). SOD is the rate at which DO is removed from the water by biochemical processes in the sediment (Hatcher, 1986). It includes depletion due to both biological respiration of benthic organisms (biological SOD, BSOD) and chemical oxidation of reduced compounds (chemical SOD, CSOD) arising from anaerobic metabolism (Walker and Snodgrass, 1986; Chau, 2002; Doyle and Lynch, 2005). BSOD is governed by aerobic heterotrophs that utilize organic material as an energy source (Middelburg et al., 2005); CSOD involves anaerobic bacteria which degrade organic matter, determining the sulphate reduction (e.g., Zaggia et al., 2007) and releasing reduced compounds (mainly of nitrogen, manganese, and iron) that react with molecular oxygen (Rounds and Doyle, 1997; Todd et al., 2010).
Oxygen concentration is strongly dependent on the air-sea exchange in surface waters, whereas in shallow systems - such as lagoons - exchange across the sediment-water interface is often important (Pitcher et al., 2021). Due to the high sediment surface area to water volume ratios, lagoon sediments influence the dynamics of oxygen and play an important regulatory function for the whole ecosystem (Giordani et al., 2008; Brigolin et al., 2021). Lagoons are also places with high organic matter inputs (Viaroli et al., 2008). Settled organic material is actively decomposed by microbial processes and the DO level consequently decreases (Castel et al., 1996). Systems with long water residence times and stratified water columns are more prone to be subjected to hypoxia events (NRC, 2000).
Serious anoxic events occurred in the Venice Lagoon (Figure 1) during the warm months of the 1980s (Sfriso et al., 1987; Sfriso et al., 1995; Zirino et al., 2016), due to the rot of Ulva rigida after major blooms. Since 1990, water conditions in the lagoon have changed, thanks to a concomitance of climatic situations, increased water turbidity, and biomass harvesting (Sfriso and Marcomini, 1996). While events of that severity did not recur after the 1980s, hypoxia/anoxia conditions have been observed in some sectors of the lagoon since the early 2010s (Bernardi Aubry et al., 2020), although generally lasting less than 24 h (ISPRA and ARPAV, 2016; ISPRA and ARPAV, 2018; ISPRA and ARPAV, 2021).
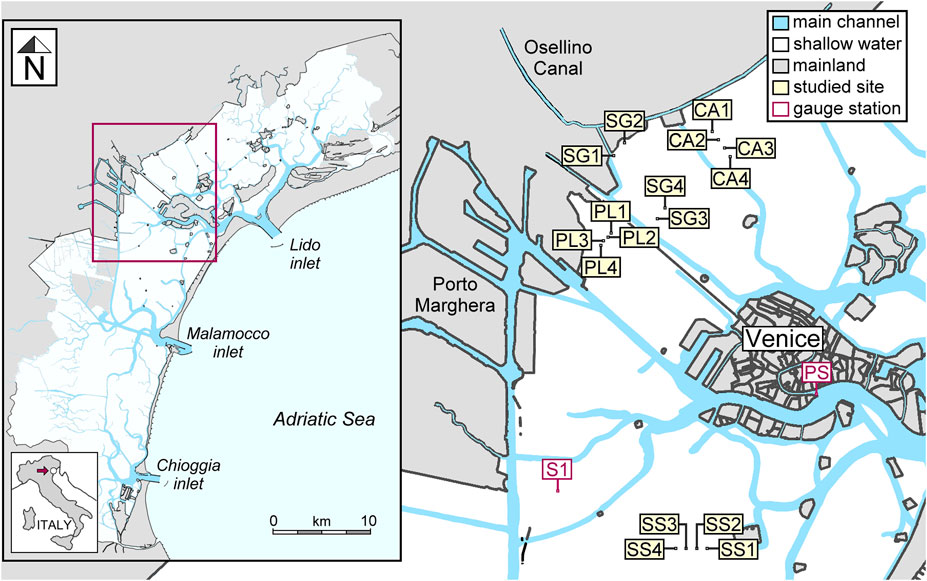
FIGURE 1. Location of the 16 measurement sites in the four selected areas of the Venice Lagoon (in the insert). S1 (45°24.7934°N 12°16.4518°E) and PS (45°25.8656°N 12°20.1826°E) identify the DO gauge station of the SAMANET network and the tide gauge of Punta Salute (managed by the Venice Municipality), respectively.
The MOSE system was operated for the first time in October 2020 (Mel et al., 2021) to protect Venice and the lagoon against flooding during high sea-level events. The MOSE (Scotti, 2005; Trincardi et al., 2016) consists of mobile gates clustered into barriers installed on the bottom of the three inlets of the lagoon, which rise up and temporarily seal off the waterbody from the sea during high tide events. Although the MOSE system can potentially be operated in the future to improve the water exchange with the sea through appropriate maneuvers of the barriers, it is expected to increase the water renewal time in the lagoon as a whole (Ferrarin et al., 2013). Due to the anticipated sea-level rise and the higher incidence of severe storms, the number of times the MOSE is placed in operation is also foreseen to increase (Lionello, 2012; Cavaleri et al., 2020). Moreover, an increase in the frequency of summer heatwaves due to climate change (Molina et al., 2020) is occurring in the Mediterranean region, which may lead to a greater duration and severity of hypoxic events in the Venice Lagoon (Brigolin et al., 2021).
In this context, the aim of this study was to investigate the importance of sediments in the DO consumption in the Venice Lagoon, measuring the SOD rate in four test areas with benthic chambers. A further objective of the study was the evaluation of how much the sediment can affect the concentration of DO in the water column during MOSE closures.
Materials and methods
Study site
Venice Lagoon is widely described in the literature in terms of functioning and ecosystem characteristics (e.g., Zonta et al., 2018 - and references therein). With a surface area of 550 km2 and a mean water depth of about 1 m, it includes islands, tidal marshes, mudflats, and a complex network of tidal channels up to 10 m deep (Figure 1). Shallow water areas account for 75% of the total surface area (ca. 415 km2). The lagoon is linked to the Adriatic Sea by three inlets (Lido, Malamocco and Chioggia), which enable the exchange of water during tidal cycles. The mean tidal excursion is 30 and 80 cm respectively in neap and spring tide conditions (Zaggia et al., 2007).
Four shallow water areas were selected for the study: Campalto (CA), San Giuliano (SG), Pili (PL), and Sacca Sessola (SS). In each area, four sites were identified for the SOD measurements and numbered from 1 to 4, for a total of 16 sites (Figure 1). The sites of the CA area were arranged along a perpendicular to the lagoon-mainland interface, at a distance of about 200 m from each other, while the sites of the PL area were located along a line of about 210 m, parallel to the easternmost sector of the industrial area of Porto Marghera. In the SG area, two sites were closer to the mainland (SG1 and SG2) and the other two sites (SG3 and SG4) were located further south, towards the open lagoon north of the City of Venice; of the former two, one (SG1) was located in the shallow waters of the mouth of the Osellino canal, a 47-km-long watercourse draining a crop area of 50 km2 (Zonta et al., 2005). The distance of SG1 - SG2 from SG3 - SG4 was about 1,400 m. Sites in the SS area were located along a line in the central zone of the lagoon, at a distance of about 200 m from each other.
The Venice Water Authority (Provveditorato Interregionale per le Opere Pubbliche del Veneto - Trentino Alto Adige - Friuli Venezia Giulia) manages an O2 saturation (DO%) measurement network in the lagoon (named SAMANET), including station S1 (Figure 1) which is located not far from this study’s measurement areas. The station is subjected to a greater water exchange than most of the measurement sites, thanks to its proximity to the main tidal channels. Consequently, the concentration of DO in the water column is assumed to be generally higher at station S1 than in our measurement sites. In the warm months from June to September of the years in the period 2018–2021, the hourly DO values recorded by the station were below 50% in 9.2%–31.3% of cases and below 30% in 1%–11% of cases (Table 1).
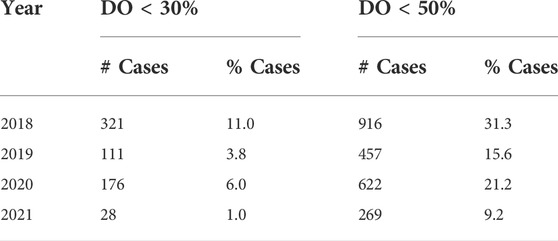
TABLE 1. Number of cases (and percentage) of hourly DO data below 30 and 50% of saturation value, recorded from June to September in the period 2018–2021. Data from SAMANET measuring network.
SOD measurements were carried out approximately on a monthly basis at the 16 sites in the period March - November 2021. Geographic coordinates of site and bathymetric heights are shown in Table 2, referring to the tidal zero level in the lagoon.
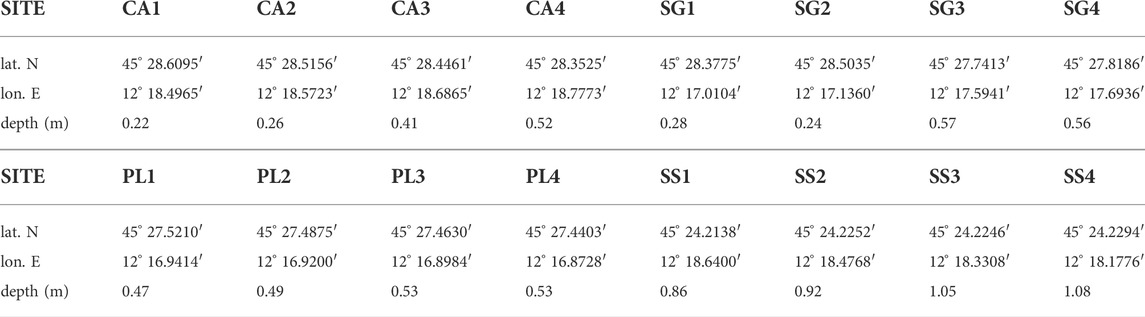
TABLE 2. Coordinates in the WGS84 reference system and bathymetric height of the 16 sites; the latter refers to the zero-tide level recorded by the Punta Salute tide gauge (PS, Figure 1).
Sediment analyses
Small sediment cores (length 10 cm, diameter 6.4 cm) were collected in the 16 sites in May 2021 by utilizing a piston corer, taking care of not disturbing the upper sediment layers. Two sediment samples were obtained from each core, corresponding to the surface (0–1) and sub-surface (1–2 cm) layers. Samples were sieved through a 1 mm Teflon mesh to remove debris and organic fragments, and then carefully homogenized. An aliquot of about 2 g of wet sediment was weighed and dispersed in distilled water before grain-size measurement with a laser diffraction particle size analyzer (Mastersizer 2000; Malvern Instruments, Malvern, United Kingdom). The instrument provided the volumetric percentage of particles belonging to 100 diameter classes in the range of 0.1–2,000 µm.
Total nitrogen (TN) and total carbon (TC) were determined on duplicate samples using a ThermoFisher Flash 2000 IRMS Elemental Analyzer (EA, ThermoFisher Scientific Inc, Aurora, OH, United States). Samples for total organic carbon (TOC) measurements were first decarbonated with HCl 1.5 N. As determined by replicate analyses of the same sample, each measurement had an average standard deviation (STD) of ± 0.01% for TN and ± 0.07% for TOC. Total inorganic carbon (TIC) was calculated as the difference between TC and TOC and converted to carbonates, assuming that it was entirely bound as CaCO3.
Water content (WC) was determined from an aliquot of sample dried in an oven at 105°C until it reached a constant weight (Percival and Lindsay, 1997). Based on variation coefficients of five replicate measurements in three sediment samples, the analytical error of WC determination was less than 0.88%. WC was not corrected for salt, as this correction is negligible.
Sediment porosity (Φ) was calculated following Hobbs (1983), as described in Zonta et al. (2021). Organic matter (OM) content was calculated as 1.7 TOC in %, and its density of 1.25 g cm−3 was assumed (Avnimelech et al., 2001). The density of the mineral fraction was calculated assuming densities of CaCO3 and the remaining Al-Si fraction of 2.8 g cm−3 and 2.65 g cm−3, respectively.
Characteristics of the benthic chambers
Benthic chambers are used to incubate in situ a known volume of water above a given sediment surface, measuring over time the consumption of the DO concentration in the isolated water. The PVC cylindrical benthic chambers were made in-house (Figure 2), introducing some changes to the commonly used design for SOD measurements (Murphy and Hicks, 1986; Coenen et al., 2019). A method for measuring the SOD flow rate in situ has not been standardized (Coenen et al., 2019), and it may be worth experimenting with any technical improvements.
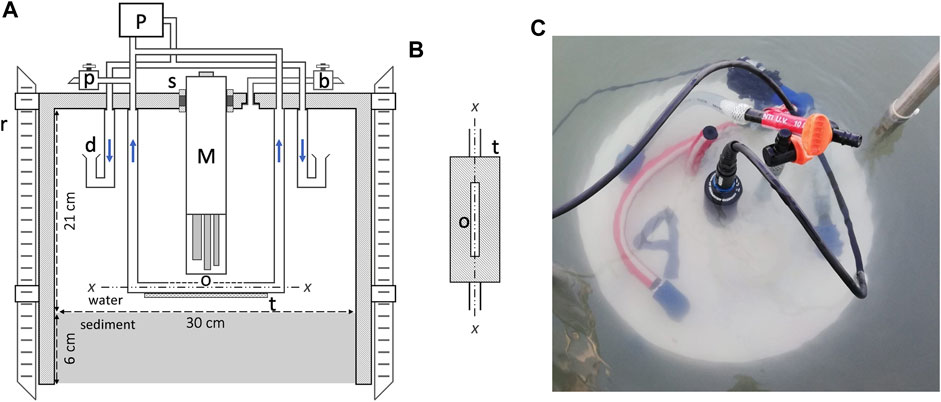
FIGURE 2. (A): schematic drawing of the SOD chamber (not in scale): pump (P); funnel-shaped flow diffusers (d); pump-priming cock (p); air bleed cock (b); multiprobe (M); centimeter steel rods, integral with the chamber (r); composite sleeve in PVC and Plastazote® (s); rectangular suction opening (o); PVC shielding plate (t). (B): detail of the suction opening (o). (C): photo of a chamber being immersed in the water column before deployment in the sediment.
Chambers had an internal diameter of 30 cm and a height of 27 cm, 6 cm of which are intended to be driven into the sediment; the opacity of the material inhibited photosynthesis during incubation. The lower edge of the cylinder was tapered to facilitate the insertion of the chamber into the sediment. Two centimeter-steel rods embedded with the chamber, allowed the chamber to be driven into the sediment at the correct level of penetration from a boat. As the 2 bars protruded from the base of the chamber by 15 cm, they also strengthened the stability of the apparatus once driven into the sediment. In the case of sites with sediments that have a greater sandy component, a housing is present on the head of the benthic chamber to allow it to be pushed into the sediment, utilizing a wooden pole.
A multiparameter water quality probe (Aquaprobe AP 2000; Aquaread Ltd, England) was inserted in the centre of the chamber to measure dissolved oxygen (optically, mg L−1), temperature (°C), pH, turbidity (NTU), and water depth (cm). The probe was mounted vertically in the center of the chamber, thanks to a sleeve consisting of three layers of material (Plastazote® compressed between two layers of PVC), which maintains the hermetic seal of the chamber. The probe was connected to a data-logger (Aquameter, Aquaread Ltd, England), programmed to acquire data every 5 min, but allowing instantaneous readings. The chambers exposed a 0.071 m2 area of sediment to 14.6 L of enclosed water; the correction was made for the volume occupied by both multiprobe and hydraulic circuits inside the chamber. Several tests were carried out to verify that the benthic chamber was completely sealed once it was embedded in the sediment.
A pump powered by a 12-V lead-acid rechargeable battery was used to continuously recirculate the water inside the chamber. The blade shape of the pump propeller was modified to reduce its flow rate to 100 L h−1; this means that the volume of incubated water was completely recirculated in about 9 min. The water circuit inside the chamber had a “recirculating fountain” configuration. The water intake (Figure 2B), located under the probe, suctioned the water from about 2 cm above the water-sediment interface; it consisted of a rectangular opening shielded towards the sediment by a thin sheet of PVC, to prevent the aspirated flow from causing the sediment to be resuspended. The outlet took place through two diffusers that directed the flow towards the upper part of the chamber.
The purpose of the water circulation is to achieve an approximately uniform DO concentration within the chamber, avoiding the occurrence of vertical concentration gradients and making the distance of the probe from the sediment surface substantially irrelevant. In natural systems, a diffusive boundary layer (DBL) (Jørgensen and Revsbech, 1985; Glud et al., 1994; Glud, 2008) at the sediment-water interface reduces the oxygen uptake and may lead to an underestimation of the SOD rate (Doyle and Rounds, 2003). DBL effectiveness is inversely related to the water flow velocity above the interface with the sediment. Inside the chamber, the water intake, which is designed to bring water near the sediment interface, has the purpose of counteracting the formation of DBL during the measurement or - at least - reducing the “effective DBL thickness” (Jørgensen and Des Marais, 1990). In any case, the diffusive oxygen uptake rate in coastal marine sediments makes up roughly only a half of the total uptake rate, the rest being due to irrigation and faunal respiration (Glud, 2008). In all the measurements carried out in this study, the same water recirculation speed was set to ensure repeatability and comparability of the measurement.
On the other hand, sediment resuspension within the chamber increases the surface area of the bottom material in contact with water, leading to an overestimation of the SOD rate (Doyle and Rounds, 2003). Therefore, every effort was made in the set-up of the benthic chamber to avoid resuspension. The shape and position of the inflow diffusers, the conformation of the pump intake inside the chamber, and the flow rate adjustment, obtained by modifying the propeller blades of the pump, were fundamental to this purpose. Laboratory tests were carried out to verify that the chamber did not generate resuspension of sediments during the measurement due to an excessive current speed at the water-sediment interface. To this purpose, silt-clayey sediments similar to those from the 16 measurement sites were used in the test, and the absence of resuspension in the incubated water was monitored with a small camera and a turbidity sensor. In the field, the turbidity sensor of the multi-probe used inside the benthic chamber constituted the ultimate check of the absence of resuspension phenomena throughout the measurement.
Preparation and use of the chamber in situ
Probes were calibrated before each field campaign using specific Aquaread standards for each sensor. The chamber was completely immersed in the water column by holding it by the 2-cm-steel rods (Figure 2C). Then the pump was turned on and primed, and it was ensured that all the air was expelled from the chamber through the bleed valve, which was finally closed. Hence the chamber was lowered and pushed into the bottom sediment; this step was done with care to minimize disturbance to the bottom. The benthic chamber had to remain completely submerged during the entire measurement period. It could be correctly deployed when the height of the water column was equal to at least 40 cm and could be used for measuring up to a minimum height of 25 cm. The final driving depth of the chamber could be precisely recorded, thanks to a centimeter-scale placed on the steel rods.
The chambers were deployed for periods ranging from 100 to 200 min and, less frequently, for longer periods. The pump, battery, and data logger were placed in a resealable polyethylene box, hung to a post driven into the sediment in the proximity of the benthic chamber.
SOD rate calculation
A typical plot of DO concentration depletion vs. time elapsed is shown in Figure 3.
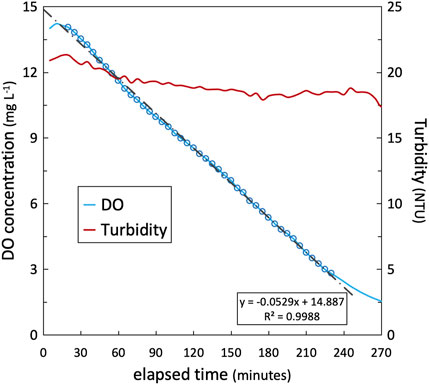
FIGURE 3. Example of oxygen depletion curve for a chamber placed at site CA2 (July 2021). The turbidity trend is superimposed. Slope m is calculated for the approximately straight section of the oxygen-depletion curve, which is highlighted with light blue dots.
With a linear regression applied to the approximately straight section of the curve, the slope m (mg L−1 min−1) was determined and the SOD was obtained as in Murphy and Hicks (1986):
where SODT is the sediment oxygen demand rate (g m−2 d−1) at water temperature T (°C), V is the volume of incubated water (L), A is the area of sediment enclosed by the chamber (m2), and 1.44 is a unit-conversion factor (from mg min−1 to g d−1).
Equation 1 can be rewritten as:
where K includes the geometric parameters of the chamber and the conversion for units of measurement. Chambers used in this study were characterized by K = 298; when the chamber insertion depth was slightly different from the expected 7 cm, a volume correction was made resulting in a K value in the range 270–327, comparable with that of other studies (Steeby et al., 2004 (K = 260); Ziadat and Berdanier, 2004 (K = 363); Doyle and Lynch, 2005 (K = 333); Utley et al., 2008 (K = 347); De Vittor et al., 2016 (K = 305)).
To compare SOD rates measured at different temperatures, the values are corrected to 20°C through a van’t Hoff equation (Thomann and Mueller, 1987), as temperature affects the solubility of oxygen in water:
which is no longer valid for T < 10°C (Rounds and Doyle, 1997).
The initial small increase of DO concentration observed in Figure 3 is due to the water mixing inside the chamber generated by the circulation induced by the pump. The inflection of the curve that sometimes occurs just below the DO concentration of 3 mg L−1 reflects a situation where the respiration of microorganisms at the sediment surface begins to be oxygen limited. Beyond this point, this process may negatively influence the SOD rate value (Doyle and Lynch, 2005), and therefore SOD rate was calculated in the DO ≥ 3 mg L−1 range.
In the first period of the study, measurements were done to determine the rate of DO depletion due to the oxygen demand rate of the water incubated inside the chamber (WOD), in order to be subtracted (blank correction) from the measured DO depletion rate values (Rounds and Doyle, 1997; Doyle and Lynch, 2005). This was done by filling with site water a thick 10 L opaque polyethylene container, which was left at the bottom for the entire duration of the measurement. The water-column oxygen demand was then determined by comparing the DO concentration at the beginning and end of the water incubation period.
WOD measurement can be affected by significant errors (Caldwell and Doyle, 1995; Heckathorn and Gibs, 2010) as waters incubated in the measuring chamber and the blank one may be dissimilar. As observed in other studies (Caldwell and Doyle, 1995; Rounds and Doyle, 1997; Wood, 2001; Heckathorn and Gibs, 2010) the WOD was found to be very small (1%–4%) compared to the measured SOD rate and its measurement was no longer deemed necessary, although it cannot be excluded that it was not negligible in particular environmental conditions encountered during the study.
A total of 141 measurements were performed at the 16 sites and the SOD rate was determined with linear regressions with coefficient of determination R2 > 0.94.
Results and discussion
Sediment characteristics
Sediment analyses (TN, TOC, grain size, TIC, porosity) performed on samples from the 16 sites showed comparable values in the two sampling layers (0–1 and 1–2 cm) except for some variables at a few sites; therefore, the mean values between the two layers were considered. Value distributions among sites are shown in Figure 4. Grain-size characteristics are expressed as both the D50 value (median particle size, which is the particle size when the cumulative percentage reaches 50%) and sand content (in the dimensional range 63–500 μm).
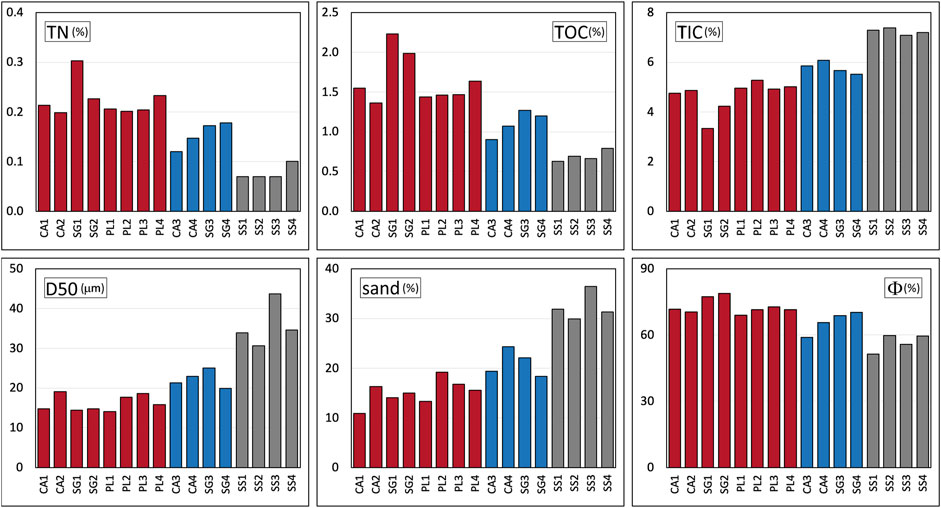
FIGURE 4. TN, TOC and TIC concentration values, D50 diameter, sand content (63–500 μm) and porosity in the 0–2 cm sediment layer of the 16 sites. Bar coloring highlights the three groups of sites.
The sediment of the Venice Lagoon has been extensively investigated since the 1980s, in terms of composition, texture, and contamination, over the entire waterbody as well as in sectors of interest for specific environmental problems (e.g., Zonta et al., 2018 and references therein). The obtained data reflected the known characteristics of the lagoon sediments. A clear difference was observed between sites of the SS area compared to the others, with the former characterized by a coarser particle size, lower porosity, a greater presence of TIC and a lower content of TOC and TN.
CA, SG, and PL areas are located close to the lagoon-mainland interface, which has higher water renewal times (Cucco and Umgiesser, 2006; Ferrarin et al., 2013), lower salinity (Guerzoni and Tagliapietra, 2006) and finer-sized sediments (Zonta et al., 2018) than the SS area, which belongs to the central lagoon. The lagoon sector that includes CA, SG, and PL areas is classified as a “marginal” water body, based on the classification of the Water Framework Directive (WFD), as a result of the resolution of the transition gradient in discrete water bodies in the lagoon (Tagliapietra et al., 2011; ISPRA and ARPAV, 2018). This sector is interested by the presence of the mouths of freshwater tributaries delivering nutrients and chemical compounds from the drainage basin (Collavini et al., 2005), and it is particularly vulnerable to low oxygen conditions in the summer months (ISPRA and ARPAV, 2016; ISPRA and ARPAV, 2018; ISPRA and ARPAV, 2021). The lagoon sector that includes the SS area is instead classified as “open lagoon”, characterized by greater salinity, water exchange, and bathymetry, due to the water circulation driven by the inlets that allow water exchange with the Adriatic Sea.
Among the 12 sites located in the “marginal” sector, two groups can be distinguished on the basis of sediment variables. The first group includes the four sites within the CA and SG areas furthest away from the lagoon-mainland interface (CA3, CA4, SG3, SG4); the second one includes the other four sites (CA1, CA2, SG1, SG2) and the four sites of the PL area.
In the CA area there is a gradient of fine particle content decreasing from the mainland towards the lagoon (from CA1 to CA4), and the sediment of the two more confined sites (CA1 and CA2) has a higher concentration of TN and TOC than the other two (CA3 and CA4). Similarly, these differences are observed between the SG sites close to the mainland (SG1 and SG2) and the more distant ones (SG3 and SG4). SG1 has the finest median grain size and the greatest content of TN and TOC among the 16 sites, due to the proximity of the mouth of the Osellino canal, which is a source of fresh water and fine particles from the drainage basin into the lagoon. Incidentally, small but significant differences are observed due to the greater proximity of SG3, compared to SG4, to a main channel that determines the tidal impulse propagation and therefore the water renewal in the area.
Grain size, porosity, and TIC in these sites are not expected to change substantially in the short term, as evidenced by the scarce variations of the measured values between the upper layer (0–1) and the subsurface layer (1–2 cm), in agreement with previous studies (Sfriso et al., 2005; Zonta et al., 2018). TOC and TN may instead be subject to greater annual variability.
SOD values distribution
Two field tests were conducted to verify the repeatability of the SOD rate measurement. For this purpose, four benthic chambers were placed within a small area at the CA3 and CA4 sites. Low coefficients of variation (CV%) were obtained for the SOD rate (6.2 and 14.8%, respectively), which we attribute more to the heterogeneous nature of the bottom sediments than to possible artifacts in the measurement.
Distributions of the measured SODT and SOD20 values over the year are shown in Figure 5, together with the water temperature (T) measured inside the benthic chamber. SODT values ranged from 0.63 to 24.00 g m−2 d−1 and T values from 11.7 to 33.3°C. Higher values were registered in the warm months in all sites, due to the increase of the rate of oxygen-depleting processes. A significant values increase was recorded as early as June in the more confined sites of CA (CA1 and CA2) and SG (SG1 and SG2) areas, whereas it occurred in July in the PL area.
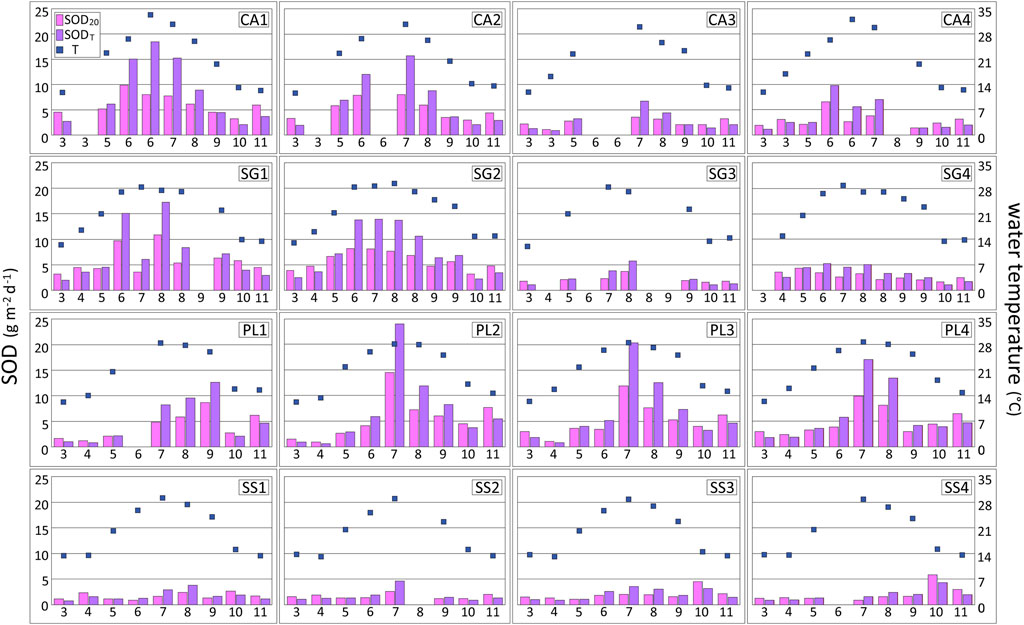
FIGURE 5. SODT and SOD20 2021 monthly trend rates at the 16 sites. Water temperature measured inside the benthic chamber is also shown. Two measurements were done in the CA area in June, and two in SG both in August and September.
Towards the end of the year, a more or less marked increase in the SODT rate was observed in several sites, despite the decrease in water temperature. Particularly, in the SS3 and SS4 sites, the highest values of the study were recorded in October and rates remained relatively high in November. We ascribed these values to the presence of macroalgae fragments (Ulva spp. and Gracilaria spp.) near the water-sediment interface, some of which may have become trapped in the benthic chamber, producing an extra contribution to oxygen consumption.
Correcting the SODT value by the water temperature resulted in a more flattened SOD20 rate distribution. The latter, however, retained considerable variability between sites and months of measurement (from 0.87 to 14.48 g m−2 d−1).
Relation between SOD rate and sediment characteristics
The SOD20 records were in agreement with the subdivision of the 16 sites in the three groups observed on the basis of sediment characteristic (Figure 4). Figure 6 shows mean SOD20 values (from 1.58 to 6.16 g m−2 d−1) recorded over the entire measurement period. The more confined eight sites (CA1, CA2, SG1, SG2, and the four sites in the PL area) had the highest SOD20 values (Type M sites–marginal), whereas the lowest ones were recorded in the SS area (Type O sites–open lagoon). The remaining four sites (CA3, CA4, SG3, SG4) had intermediate values (Type I sites–intermediate).
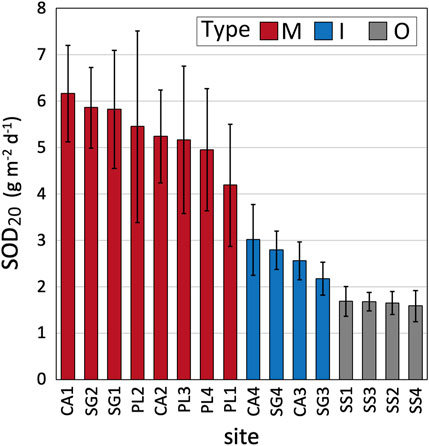
FIGURE 6. Mean SOD20 rate for the whole period in the 16 sites, in increasing order; the line indicates the standard deviation value. Bar coloring highlights the three types of sites.
The subdivision of the 16 sites in three types is highlighted in the dendrogram of Figure 7, obtained from a cluster analysis performed on SOD20, TN and D50 values. It is important to underline how small distances in the position of a pair of sites (1 and 2) with respect to the other (3 and 4) in the SG area and especially in the CA area determined different characteristics of the sediment and consequently different SOD rates.
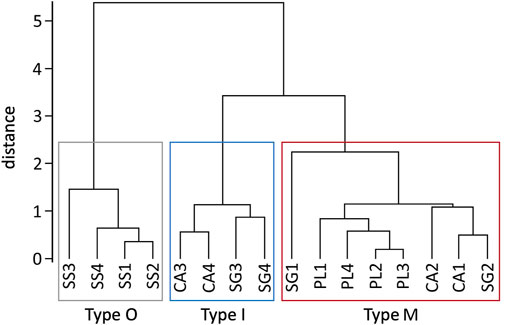
FIGURE 7. Dendrogram obtained from a cluster analysis performed on mean SOD20 rate, TN concentration, and D50 data (complete-linkage hierarchical clustering).
The correspondence between the sediment characteristics and the mean SOD20 rates is summarized by the correlation matrix shown in Table 3. Data normality for each variable was verified using the Kolmogorov-Smirnov test (p > 0.01) after a Iglewicz and Hoaglin outlier test (Iglewicz and Hoaglin, 1993). The latter indicated the two aforementioned values recorded in the SS3 and SS4 sites in October as outliers, which were therefore excluded from the statistics.
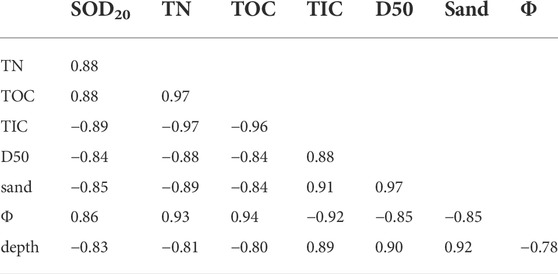
TABLE 3. Pearson correlation matrix calculated among variables measured in the sediment collected in May 2021 at 16 sites, mean SOD20 rate in the 2021 and site depth. Two SOD20 rates measured in SS3 and SS4 in October were excluded. All correlation coefficients are significant at α < 0.05. Distribution normality for each variable was verified using the Kolmogorov-Smirnov test (p > 0.01).
Two elements (regression of SOD20 concerning TN and D50, respectively) of the correlation matrix in Table 3 are shown in Figure 8 to highlight the differentiation of the 16 sites into three types. Various authors have considered sediment grain size and organic matter concentration (frequently measured with the Loss on Ignition technique) with respect to the variation of SOD rate in statistical analyses (e.g., Butts and Evans, 1979; Wood, 2001; Doyle and Lynch, 2005; Foster et al., 2016). Generally, clear-cut relationships were not obtained but instead a more or less defined linear dependence. The degree of correlation obtained in the present study was relatively high among all the variables involved. The reason presumably lay in both having compared mean values of SOD20 measured for a long period and the selection of a set of sites with quite diversified characteristics - even if typical of the Venice Lagoon.
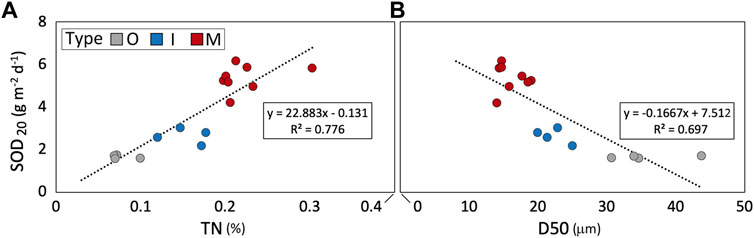
FIGURE 8. Regression plot between mean SOD20 and (A) TN concentration and (B) D50. The three types of sediments are highlighted with different colors.
Among the few studies of sediment and DO in the Venice Lagoon, Melaku Canu et al. (2003) developed an ecological model that simulated the evolution of nine ecological state variables, including DO concentration. In the mass balance components, they assumed a value of SOD20 = 1.08 g m−2 d−1. Based on the experimental results of our study, the value assumed in the model seems excessively low, being respectively about 66 and 20% of the mean SOD20 rate value measured in sites representative of the open lagoon (Type O, 1.65) and the more confined sites (Type M, 5.35 g m−2 d−1). SOD rate distribution values obtained from the study may be useful for mathematical models aimed at the simulation of the distribution of DO concentration in the lagoon system.
The correction of SODT measurement (Eq. 3) - which produces the SOD20 value - removes the effect of temperature on the solubility of the oxygen in the water column, but other factors still introduce a dependence of SOD20 on T. Observing the temporal trend of SOD20 (Figure 5), the permanence of an indirect relationship with the temperature after the rate correction is in fact evident, in particular in the Type M sites that in the summer period showed significantly higher values than in the other months.
In addition to temperature and sediment characteristics, SOD is influenced by variables that depend on the conditions of the water column (available oxygen, velocity of the current on the sediments, aeration), as well as the chemistry of the interstitial water. Even more important factors are the quality and quantity of the organic matter and the composition of the biological community (Bowie et al., 1985), which change with the availability of DO and nutrients.
The consumption of organic matter is due to the growth dynamics of the microbial populations, which in turn are linked to temperature and organic matter supply and type, as well as the composition of the biological community and biotic interactions. Temperature affects the metabolism of oxygen-consuming microorganisms in the sediment, their density, and community structure (Arnosti et al., 1998; Thamdrup et al., 1998; Zakem et al., 2021). The characteristics of the organic matter are also of considerable importance in this process since the rate of degradation depends on its lability (Boudreau, 1992; Kirchman et al., 2005; Fagervold et al., 2014; Zakem et al., 2021). The dependence of the SOD rate on the presence of microbial communities and other organisms in the sediment is beyond the scope of this study.
Estimating water column DO depletion due to the sediment during MOSE closures
According to the present management scenario, the MOSE gates would temporarily isolate the Venice Lagoon from the Adriatic Sea during tides greater than 110 cm (safeguard threshold, Ruol et al., 2020) above the Punta Salute reference level (PS, Figure 1). The latter is 26 cm below the current mean sea level. The 110-cm level is a compromise among the physical protection of the city, ensuring the naval commercial traffic through the inlets, and maintaining the water exchanges between the lagoon and the sea (Trincardi et al., 2016). When a high tide event is forecasted, the gates are closed before the 110-cm level is reached, depending on the meteorological situation (wind speed, rainfall intensity); when a normal storm occurs, the MOSE is closed with a water level equal to 90 cm (Umgiesser, 2020).
In the absence of exchange between lagoon and sea, the water will be stagnant and the oxygen “starvation” of the sediment could have a greater negative effect on the oxygen balance. To evaluate the effect of sediment on oxygen depletion, we considered a simplified scenario: 1) the water column is stationary (no tide or wind-induced current) and sediment resuspension does not occur; 2) the water level at all sites is that corresponding to a level of 90 cm at station PS; 3) the initial oxygen concentration in the water column is equal to 9.17 mg L−1, i.e., the saturation concentration value at 20°C; 4) there is neither production nor consumption of oxygen due to aeration and processes in the water column; 5) the water column is mixed and there is no the formation of a DBL at the sediment interface.
The time (tHYP) to reach the hypoxia value (2.8 mg L−1) in the whole water column due to the SOD rate alone, during the closing of the MOSE, was estimated in the 16 sites and at different water temperatures. The rate value of SODT was used as it reflects - unlike SOD20 - the actual DO consumption of the sediment at a given T.
In Eq. 2, m is expressed as the ratio between the difference in oxygen concentration at saturation and at the limit of hypoxia and the time to reach that limit, obtaining:
where tHYPBC is the time in minutes elapsed to enter the hypoxia condition within the benthic chamber and K is defined in Eq. 2; the concentration of 6.37 (mg L−1) is the difference between DO content in water at saturation and the hypoxia limit.
Considering the entire water column, the time to hypoxia tHYP, in hours, results from a proportion:
where the height of the water column (H) is given by 90 cm plus the bathymetric height at the site (Table 2), and h is the height of incubated water inside the benthic chamber; 60 is the conversion factor between minutes and hours. Obtained values of tHYP are shown in Table 4; they range from a maximum of 368 h (SS1, in March, with T = 13.22°C) to a minimum of 9 h (CA1 with T = 33.27 and PL2 with T = 28.02°C, both in July).
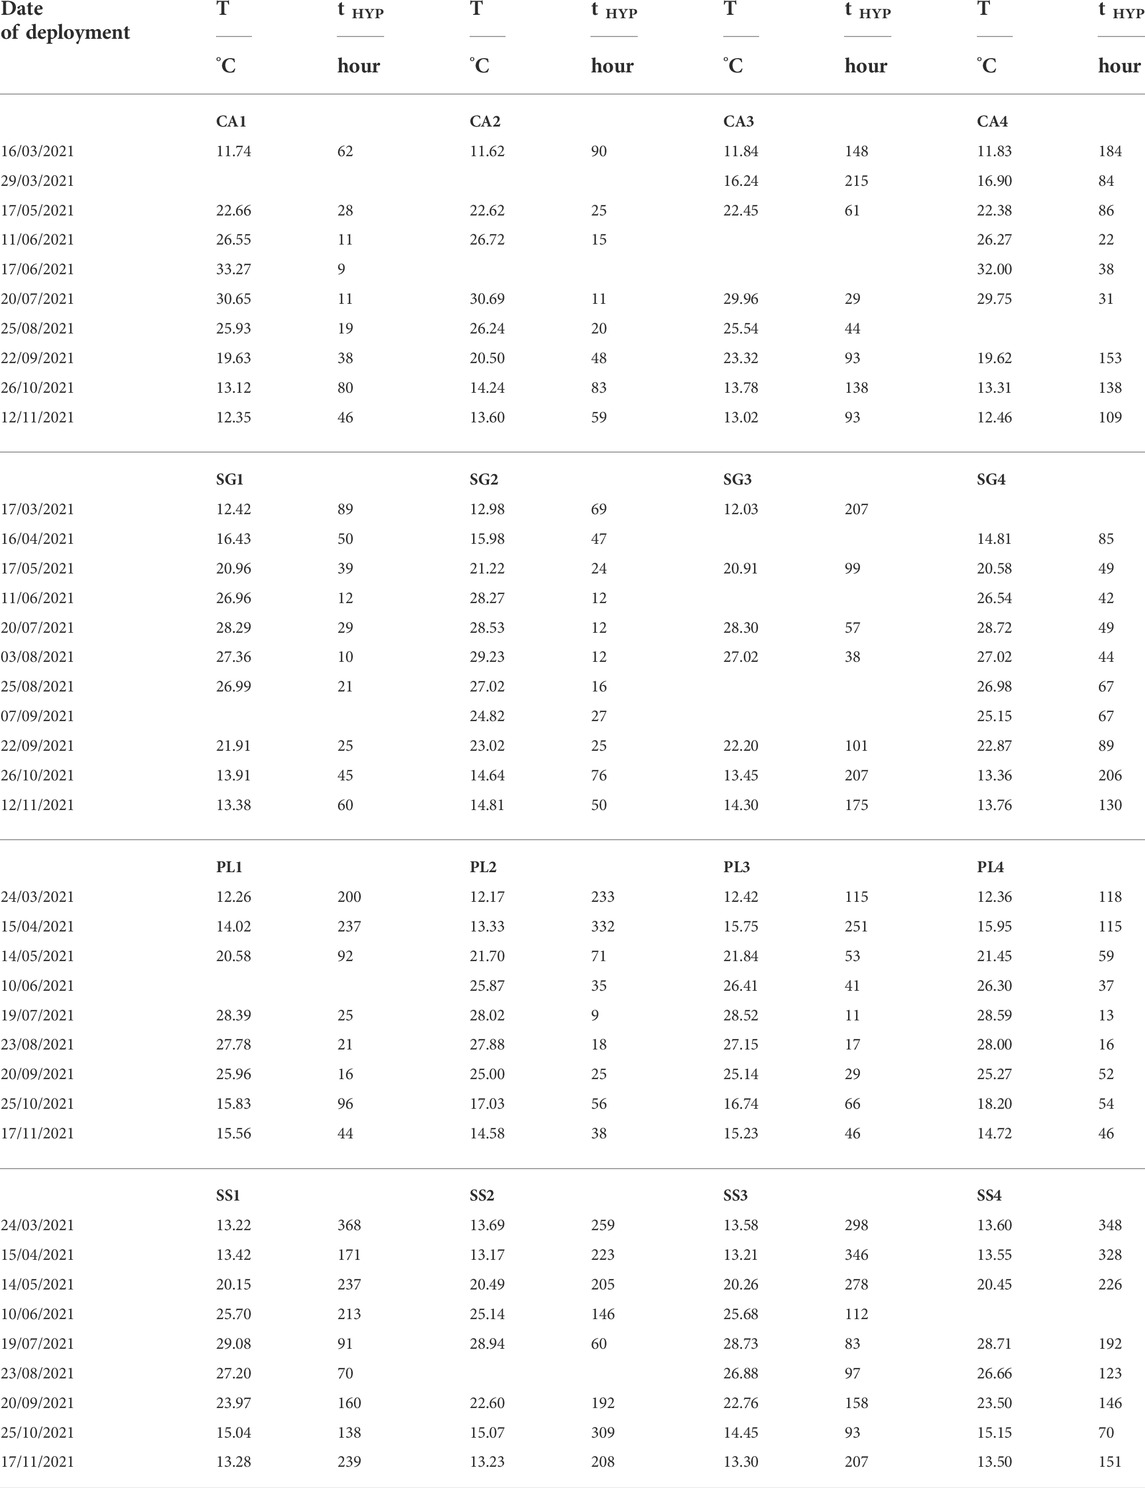
TABLE 4. Estimated time elapsing (tHYP) from the DO saturation to the limit of hypoxia values in the whole water column, due to the SODT rate at the conditions simulating the MOSE closure.
Figure 9 shows the power regression obtained for the mean tHYP values over selected intervals of T, for the three types of sites; data normality for each type was verified using the Kolmogorov-Smirnov test (p > 0.01). Type M sites were prone to reach hypoxic conditions within 48 h of MOSE closure at a water temperature of about 22°C. For temperatures around 30°C, these conditions can be reached in about half a day. Despite being located near Type M sites, oxygen consumption in Type I sites was significantly slower and remained on the order of 2 days even at higher water temperatures. Instead, Type O sites showed a greater “resistance” to the depletion of oxygen caused by the closure of the MOSE, with a tHYP always greater than 4 days.
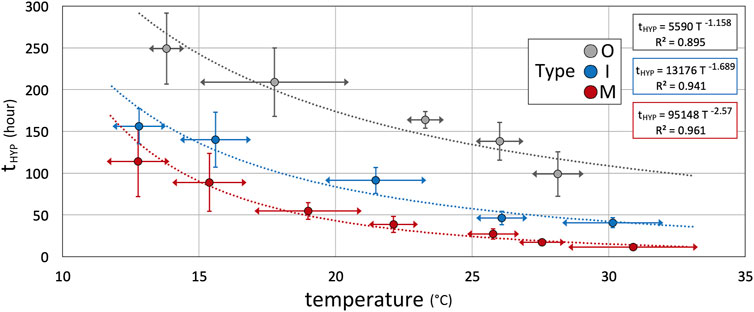
FIGURE 9. Plot of the relationship between temperature and tHYP for the three types of sites. Dots represent mean values of tHYP in the selected T range, highlighted by horizontal arrows; vertical segments indicate the respective tHYP standard deviation.
Following the first closure of the MOSE system, on 3 October 2020, the gates were raised on 34 occasions until 11 December 2021 (MOSE, 2022), mainly in autumn, since floods conditions frequently occur in that period, due to several forcing weather-marine factors (Camuffo, 1993). The mean daily temperatures recorded at the PS station on these 34 days ranged from a minimum of 6.8 to a maximum of 16.5°C (mean 10.1 ± 2.8°C standard deviation). The longest closure period lasted about 42 h (from 4 to 6 December 2020), with an average water temperature of 8.90°C. The climatic conditions in which the MOSE is currently activated are not such as to trigger a relevant consumption of DO by the lagoon sediments. If in the future the MOSE closures will take place with higher temperatures and/or for longer periods, the sediment could play an important negative role in the oxygen balance in the water column, starting from the marginal areas.
Brigolin et al. (2021) investigated the relationship between sediment early diagenesis and hypoxia conditions in the water column in five sites of the central lagoon, analyzing sediment cores in the laboratory by using microelectrodes. The investigation was based on the Diffusive Oxygen Uptake rates (DOU), measured through the O2 concentration gradient calculated over 400 μm in the sediment micro-profile. They estimated that the DO hypoxic level at T = 25°C is reached in the water column in 5–18 days, depending on site. As in our scenario, they neglected oxygen renewal associated with primary production, exchange with the atmosphere, and advection. For sites where sediment is less likely to consume the DO of the water column (Type O) our estimated tHYP at 25°C is around 5 days, which corresponds to the worst situation measured by Brigolin et al. (2021). The difference between the two results can be ascribed to the different measurement methodology and to the fact that DOU constitutes only a fraction of the Total Oxygen Uptake (TOU) (Jørgensen et al., 2022). Whatever the method (sediment cores in the laboratory or benthic chambers in the field), the measurement systems are only an imperfect model of natural conditions and their relative advantages or disadvantages are questionable (Coenen et al., 2019 and references therein). If the sediment at the measurement site is heterogeneous, especially in respect to macrobenthos activity, drastic differences may result (Coenen et al., 2019) due to the disparity between areas of the sediment surfaces examined.
Conclusion
A new era of “regulated flows” has begun for the Venice Lagoon as a result of the start of operations of the MOSE system in October 2020, which temporarily seals the water body during high tide events in the Adriatic Sea. The regulation of the tidal flow is expected to lead to a general increase in the water renewal time in the lagoon and this motivated the investigation of the oxygen-consuming action of the sediment.
SOD rate was measured in a range of water temperature from 11.7 to 33.3°C. The measured SOD rate values (SODT) ranged from 0.63 to 24.00 g m−2 d−1; once standardization was carried out at a temperature of 20°C (SOD20), the resulting range of variation was equal to 0.87–14.48 g m−2 d−1.
Sediment characteristics and SOD value distribution reflected different lagoon conditions, in terms of bathymetry, hydrodynamics, and water renewal. A subdivision of the sites into three typologies was observed based on the distribution of SOD20 values and sediment characteristics. Four sites belonging to the open lagoon (named Type O- open lagoon), characterized by coarser particle size, a greater presence of TIC, and less TOC and TN, showed lower SOD values. The eight more confined sites (Type M - marginal) showed instead the higher values of SOD, particularly in the warm months. The remaining four sites (Type I - intermediate) had intermediate both sediment features and SOD values.
The dependence of the SOD rate on both availability and type of organic matter presence and composition and growth of microbial communities, which is beyond the scope of this study, should be investigated at different water temperatures in an adequate number of lagoon sites.
In a simplified scenario, which involved the absence of both primary production and water renewal/aeration, the incidence of sediment on the DO concentration in the water column has been estimated at the closure of the MOSE, for different range of water temperatures and the three types of sites. In a still and completely mixed water column, it was found that the time (tHYP) elapsing from the saturation of DO (9.17 mg L−1) to the hypoxia values (2.8 mg L−1) has a different power relationship with the temperature in the three types of sites. In the confined sites, DO concentration in the water column can be depleted in about a day, at temperatures of ca. 25°C.
The MOSE system is currently activated for short periods in the cold months, when low water temperatures do not trigger a relevant consumption of DO by the lagoon sediments. However, the ongoing climate change could lead to longer lasting MOSE closure with higher temperatures in the future. At that point the sediment will be able to exert a strong action of oxygen consumption in the water column, especially in the marginal areas of the lagoon.
Data availability statement
The raw data supporting the conclusions of this article will be made available by the authors, without undue reservation.
Author contributions
Conceptualization, SL, DT, and RZ; Methodology, DC, SL, GM, and RZ; Validation, JD, SL, DT, and RZ; Formal Analysis, FA, DC, SL, and RZ; Investigation, SL, DC, GM, FA, and RZ; Resources, DC and GM; Data Curation, SL and RZ; Writing—Original Draft Preparation, SL and RZ; Writing—Review and Editing, JD, SL, DT, and RZ; Visualization, SL and RZ; Supervision, RZ; Project Administration, RZ; Funding Acquisition, RZ.
Funding
Scientific activity performed in the Research Programme Venezia 2021 (Scientific research program for a “regulated” lagoon), coordinated by CORILA (Consortium for coordination of research activities concerning the Venice Lagoon system), with the contribution of the Ministero delle Infrastrutture e della Mobilità Sostenibili - Provveditorato Interregionale per le Opere Pubbliche del Veneto - Trentino Alto Adige - Friuli Venezia Giulia.
Acknowledgments
We thank Loris Dametto and Gianfranco Magris (CNR ISMAR, Venice, Italy), Daniele Curiel and Emiliano Checchin (SELC, Venice, Italy) for the support provided in the field activities. Roberto Pini (CNR IRET, Pisa, Italy) carried out the analysis to determine sediment grain size. Leonardo Langone and Fabio Savelli (Laboratory for the measurement of N and C contents and stable isotopes - CNR ISMAR, Bologna, Italy) performed the elementary analyzes. Paola Focaccia (CNR ISMAR, Bologna, Italy) took care of the administrative aspects of the project. The DO% data of station S1 (SAMANET network) was provided by the Ministero delle Infrastrutture e della Mobilità Sostenibili - Provveditorato Interregionale per le Opere Pubbliche del Veneto - Trentino Alto Adige - Friuli Venezia Giulia. Franca Pastore (Centro Previsioni e Segnalazioni Maree, Venice Municipality) provided recordings of tide and temperature data acquired from the Punta Salute (PS) tide gauge. Caterina Dabalà (CORILA) assisted in retrieving data from institutional measurement stations. The authors gratefully thank Alberto Zirino (Scripps Institution of Oceanography, US) for the constructive comments and recommendations, and Carlo Corsaro for revising the English language.
Conflict of interest
The authors declare that the research was conducted in the absence of any commercial or financial relationships that could be construed as a potential conflict of interest.
The handling editor CB declared a shared affiliation with the authors at the time of review.
Publisher’s note
All claims expressed in this article are solely those of the authors and do not necessarily represent those of their affiliated organizations, or those of the publisher, the editors and the reviewers. Any product that may be evaluated in this article, or claim that may be made by its manufacturer, is not guaranteed or endorsed by the publisher.
References
Altieri, A. H., and Diaz, R. J. (2019). “Dead zones: Oxygen depletion in coastal ecosystems,” in World seas: An environmental evaluation. Ecological issues and environmental impacts. Editor C. Sheppard. 2nd Edition (Academic Press), Vol. III, 453–473. doi:10.1016/B978-0-12-805052-1.00021-8
Arnosti, C., Jorgensen, B. B., Sagemann, J., and Thamdrup, B. (1998). Temperature dependence of microbial degradation of organic matter in marine sediments: Polysaccharide hydrolysis, oxygen consumption, and sulfate reduction. Mar. Ecol. Prog. Ser. 165, 59–70. doi:10.3354/meps165059
Avnimelech, Y., Ritvo, G., Meijer, L. E., and Kochba, M. (2001). Water content, organic carbon and dry bulk density in flooded sediments. Aquac. Eng. 25, 25–33. doi:10.1016/S0144-8609(01)00068-1
Bernardi Aubry, F., Acri, F., Scarpa, G. M., and Braga, F. (2020). Phytoplankton–macrophyte interaction in the lagoon of Venice (northern Adriatic Sea, Italy). Water 12, 2810. doi:10.3390/w12102810
Boudreau, B. P. (1992). A kinetic model for microbic organic-matter decomposition in marine sediments. FEMS Microbiol. Lett. 11 (1), 1–14. doi:10.1111/j.1574-6968.1992.tb05789.x
Bowie, G. L., Mills, W. B., Porcella, D. B., Campbell, C. L., Pagenkopf, J. R., Rupp, G. L., et al. (1985). Rates, constants, and kinetics formulations in surface water quality modeling. second edition. Athens, GA: United States Environmental Protection Agency. EPA/600/3-85/040.
Breitburg, D., Levin, L. A., Oschlies, A., Grégoire, M., Chavez, F. P., Conley, D. J., et al. (2018). Declining oxygen in the global ocean and coastal waters. Science 359, eaam7240. doi:10.1126/science.aam7240
Brigolin, D., Rabouille, C., Demasy, C., Bombled, B., Monvoisin, G., and Pastres, R. (2021). Early diagenesis in sediments of the Venice lagoon (Italy) and its relationship to hypoxia. Front. Mar. Sci. 7, 575547. doi:10.3389/fmars.2020.575547
Butts, T. A., and Evans, R. L. (1979). Sediment oxygen demand in a shallow oxbow lake. Urbana, IL: Illinois State Water Survey, Circular, 136.
Caldwell, J. M., and Doyle, M. C. (1995). Sediment oxygen demand in the lower willamette river, Oregon, 1994. U.S. Geol. Surv. Water-Resources Investig. Rep. 95, 4196. doi:10.3133/wri954196
Camuffo, D. (1993). Analysis of the sea surges at Venice from A.D. 782 to 1990. Theor. Appl. Climatol. 47, 1–14. doi:10.1007/BF00868891
Caraco, N. F., and Caraco, J. J. (2002). Contrasting impacts of a native and alien macrophyte on dissolved oxygen in a large river. Ecol. Appl. 12, 1496–1509. doi:10.1890/1051-0761(2002)012[1496:cioana]2.0.co;2
Castel, J., Caumette, P., and Herbert, R. (1996). Eutrophication gradients in coastal lagoons as exemplified by the Bassin d'Arcachon and the Etang du Prevost. Hydrobiologia 329, ix–xxviii. doi:10.1007/BF00034542
Cavaleri, L., Bajo, M., Barbariol, F., Bastianini, M., Benetazzo, A., Bertotti, L., et al. (2020). The 2019 flooding of Venice and its implications for future predictions. Oceanogr. Wash. D. C). 33, 42–49. doi:10.5670/oceanog.2020.105
Chau, K. W. (2002). Field measurements of SOD and sediment nutrient fluxes in a landlocked embayment in Hong Kong. Adv. Environ. Res. 6 (2), 135–142. doi:10.1016/S1093-0191(00)00075-7
Coenen, E. N., Christensen, V. G., Bartsch, L. A., Kreiling, R. M., and Richardson, W. N. (2019). Sediment oxygen demand: A review of in situ methods. J. Environ. Qual. 48, 403–411. doi:10.2134/jeq2018.06.0251
Collavini, F., Bettiol, C., Zaggia, L., and Zonta, R. (2005). Pollutant loads from the drainage basin to the Venice Lagoon (Italy). Environ. Int. 31 (7), 939–947. doi:10.1016/j.envint.2005.05.003
Collins, M., Knutti, R., Arblaster, J., Dufresne, J. L., Fichefet, T., Friedlingstein, P., et al. (2013). “Long-term climate change: Projections, commitments and irreversibility,” in Climate change 2013: The physical science basis. Contribution of working group I to the fifth assessment report of the intergovernmental panel on climate change. Editors T. F. Stocker, D. Qin., G.-K. Plattner, M. Tignor, S. K. Allen, J. Boschunget al. (Cambridge, United Kingdom and New York, NY, USA: Cambridge University Press), 1029–1136.
Cucco, A., and Umgiesser, G. (2006). Modeling the Venice lagoon residence time. Ecol. Modell. 193, 34–51. doi:10.1016/j.ecolmodel.2005.07.043
De Vittor, C., Relitti, F., Kralj, M., Covelli, S., and Emili, A. (2016). Oxygen, carbon, and nutrient exchanges at the sediment-water interface in the Mar Piccolo of Taranto (Ionian Sea, southern Italy). Environ. Sci. Pollut. Res. 23, 12566–12581. doi:10.1007/s11356-015-4999-0
Diaz, R. J., and Rosenberg, R. (1995). Marine benthic hypoxia: A review of its ecological effects and the behavioral responses of benthic macrofauna. Oceanog. Mar. Biol. Annu. Rev. 33, 245–303. doi:10.1126/science.1156411
Doyle, M. C., and Lynch, D. D. (2005). Sediment oxygen demand in lake ewauna and the klamath river, Oregon, June 2003. U.S. Geological Survey Scientific Investigations. Report 2005-5228.
Doyle, M. C., and Rounds, S. (2003). The effect of chamber mixing velocity on bias in measurement of sediment oxygen demand rates in the tualatin river basin, Oregon. Portland, OR: U.S. Geological Survey: Water-Resources Investigations. Report 03- 4097.
Fagervold, S. K., Bourgeois, S., Pruski, A. M., Charles, F., Kerhervé, P., Vétion, G., et al. (2014). River organic matter shapes microbial communities in the sediment of the Rhône prodelta. ISME J. 8, 2327–2338. doi:10.1038/ismej.2014.86
Ferrarin, C., Ghezzo, M., Umgiesser, G., Tagliapietra, D., Camatti, E., Zaggia, L., et al. (2013). Assessing hydrological effects of human interventions on coastal systems: Numerical applications to the Venice lagoon. Hydrol. Earth Syst. Sci. 17, 1733–1748. doi:10.5194/hess-17-1733-2013
Foster, G. M., King, L. R., and Graham, J. L. (2016). Sediment oxygen demand in eastern Kansas streams, 2014 and 2015. Reston, VA: U.S. Geological Survey Investigations. Report 2016-5113.
Garcia, H. E., and Gordon, L. I. (1992). Oxygen solubility in seawater: Better fitting equations. Limnol. Oceanogr. 37 (6), 1307–1312. doi:10.4319/lo.1992.37.6.1307
Giordani, G., Austoni, M., Zaldivar, J. M., Swaney, D. P., and Viaroli, P. (2008). Modelling ecosystem functions and properties at different time and spatial scales in shallow coastal lagoons: An application of the LOICZ biogeochemical model. Estuar. Coast. Shelf Sci. 77, 264–277. doi:10.1016/j.ecss.2007.09.017
Glud, R. N., Gundersen, J. K., Jorgensen, B. B., Revsbech, N. P., and Schulz, H. D. (1994). Diffusive and total oxygen-uptake of deep-sea sediments in the eastern south-atlantic-ocean: In situ and laboratory measurements. Deep Sea Res. Part I Oceanogr. Res. Pap. 41 (11-12), 1767–1788. doi:10.1016/0967-0637(94)90072-8
Glud, R. N. (2008). Oxygen dynamics of marine sediments. Mar. Biol. Res. 4, 243–289. doi:10.1080/17451000801888726
Guerzoni, S., and Tagliapietra, D. (2006). Atlante della laguna - Venezia tra terra e mare. Venezia (Italy): Ed. Marsilio, 42–43. ISBN88-317-8764-0 (in Italian). English version available at the website: atlante.silvenezia.it/en/start_atlante_ns.phtml.
Hatcher, K. J. (1986). “Introduction to part 1: Sediment oxygen demand processes,” in Sediment oxygen demand: Processes, modeling and measurement. Editor K. J. Hatcher (Athens, GA, USA: Institute of Natural Resources, University of Georgia), 3–8.
Heckathorn, H. A., and Gibs, J. (2010). Sediment oxygen demand in the saddle river and salem river watersheds. New Jersey: U.S. Geological Survey Scientific Investigations. Report 2010–5093.
Hobbs, C. H. (1983). A method for determining the dry bulk density of subaqueous sediments. J. Sediment. Res. 53, 663–665. doi:10.2110/jsr.53.663
Iglewicz, B., and Hoaglin, D. C. (1993). How to detect and handle outliers. Am. Soc. Qual. Control (ASQC), Basic reference Qual. control 16, 87. ISBN 0-87389-247-X.
ISPRA and ARPAV (2016). “Monitoraggio della Laguna di Venezia ai sensi della Direttiva 2000/60/CE finalizzato alla definizione dello stato ecologico,” in Valutazione dei dati acquisiti nel monitoraggio ecologico 2013-2015 ai fini della classificazione ecologica dei corpi idrici lagunari, 114. (in Italian).
ISPRA and ARPAV (2018). “Monitoraggio della Laguna di Venezia ai sensi della Direttiva 2000/60/CE finalizzato alla definizione dello stato ecologico,” in Valutazione dei dati acquisiti nel monitoraggio ecologico 2014-2016 ai fini della classificazione ecologica dei corpi idrici lagunari, 117. (in Italian).
ISPRA and ARPAV (2021). “Monitoraggio della Laguna di Venezia ai sensi della Direttiva 2000/60/CE finalizzato alla definizione dello stato ecologico,” in Valutazione dei dati acquisiti nel monitoraggio ecologico 2017-2019 ai fini della classificazione ecologica dei corpi idrici lagunari, 112. (in Italian).
Jørgensen, B. B., and Des Marais, D. J. (1990). The diffusive boundary layer of sediments: Oxygen micro gradients over a microbial mat. Limnol. Oceanogr. 35 (6), 1343–1355. doi:10.4319/lo.1990.35.6.1343
Jørgensen, B. B., and Revsbech, N. P. (1985). Diffusive boundary layers and the oxygen uptake of sediments and detritus1. Limnol. Oceanogr. 30 (1), 111–122. doi:10.4319/lo.1985.30.1.0111
Jørgensen, B. B., Wenzhöfer, F., Egger, M., and Glud, R. N. (2022). Sediment oxygen consumption: Role in the global marine carbon cycle. Earth-Science Rev. 228, 103987. doi:10.1016/j.earscirev.2022.103987
Kemp, W. M., Boynton, W. R., Adolf, J. E., Boesch, D. F., Boicourt, W. C., Brush, G., et al. (2005). Eutrophication of chesapeake bay: Historical trends and ecological interactions. Mar. Ecol. Prog. Ser. 303, 1–29. doi:10.3354/meps303001
Kirchman, D. L., Malmstrom, R. R., and Cottrell, M. T. (2005). Control of bacterial growth by temperature and organic matter in the Western Arctic. Deep Sea Res. Part II Top. Stud. Oceanogr. 52 (24-26), 3386–3395. doi:10.1016/j.dsr2.2005.09.005
Lionello, P. (2012). The climate of the Venetian and North Adriatic region: Variability, trends, and future change. Phys. Chem. Earth Parts A/B/C 40-41, 1–8. doi:10.1016/j.pce.2012.02.002
MacPherson, T. A., Cahoon, L. B., and Mallin, M. A. (2007). Water column oxygen demand and sediment oxygen flux: Patterns of oxygen depletion in tidal creeks. Hydrobiologia 586 (1), 235–248. doi:10.1007/s10750-007-0643-4
Manabe, S., Stouffer, R. J., Spelman, M. J., and Bryan, K. (1991). Transient responses of a coupled ocean-atmosphere model to gradual changes of atmospheric CO2. Part I. Annual mean response. J. Clim. 4 (8), 785–818. doi:10.1175/1520-0442(1991)004<0785:TROACO>2.0.CO;2
Mel, R. A., Viero, D. P., Carniello, L., Defina, A., and D’Alpaos, L. (2021). The first operations of MO.S.E. system to prevent the flooding of Venice: Insights on the hydrodynamics of a regulated lagoon. Estuar. Coast. Shelf Sci. 261 (1-2), 107547. doi:10.1016/j.ecss.2021.107547
Melaku Canu, D., Solidoro, C., and Umgiesser, G. (2003). Modelling the responses of the Lagoon of Venice ecosystem to variations in physical forcings. Ecol. Modell. 170, 265–289. doi:10.1016/j.ecolmodel.2003.07.004
Middelburg, J. J., Duarte, C. M., and Gattuso, J. P. (2005). “Respiration in coastal benthic communities,” in Respiration in aquatic ecosystems. Editors P. A. Del Giorgio, and P. J. LeB. Williams (New York: Oxford University Press), 206–224.
Molina, M. O., Sánchez, E., and Gutiérrez, C. (2020). Future heat waves over the Mediterranean from an Euro-CORDEX regional climate model ensemble. Sci. Rep. 10, 8801. doi:10.1038/s41598-020-65663-0
MOSE (2022).MOSE. Available at: https://www.mosevenezia.eu/il-mose-in-funzione (Accessed June 6, 2022).
Murphy, P. J., and Hicks, D. B. (1986). “In situ method for measuring sediment oxygen demand,” in Sediment oxygen demand: Processes, modeling, and measurement. Editor K. J. Hatcher (Athens: Institute of Natural Resources, University of Georgia), 307–330.
NRC, National Research Council (2000). Clean coastal waters: Understanding and reducing the effects of nutrient pollution. Washington, D.C: National Academy Press.
Percival, J. B., and Lindsay, P. J. (1997). “Measurement of physical properties of sediments,” in Manual of physico-chemical analysis of aquatic sediments. Editors A. Mudrock, J. M. Azcue, and P. Mudrock (Boca Raton, FL: CRC Press), 7–45.
Pitcher, G. C., Aguirre-Velarde, A., Breitburg, D., Cardich, J., Carstensen, J., Conley, D. J., et al. (2021). System controls of coastal and open ocean oxygen depletion. Prog. Oceanogr. 197, 102613. doi:10.1016/j.pocean.2021.102613
Rong, N., Shan, B., and Wang, C. (2016). Determination of sediment oxygen demand in the Ziya River watershed, China: Based on laboratory core incubation and microelectrode measurements. Int. J. Environ. Res. Public Health 13 (2), 232. doi:10.3390/ijerph13020232
Rounds, S. A., and Doyle, M. C. (1997). “Sediment oxygen demand in the tualatin river basin, Oregon, 1992-96,” in U.S. Geological survey on water-resources investigations report 97-4103, 19.
Ruol, P., Favaretto, C., Volpato, M., and Martinelli, L. (2020). Flooding of piazza san marco (Venice): Physical model tests to evaluate the overtopping discharge. Water 12, 427. doi:10.3390/w12020427
Scotti, A. (2005). “Engineering interventions in Venice and the Venice lagoon,” in Flooding and environmental challenges for Venice and its lagoon: State of knowledge. Editors C. A. Fletcher, and T. Spencer (UK: Cambridge University Press), 245–256. ISBN-13 978-0-521-84046-0.
Sfriso, A., Favaretto, M., Ceoldo, S., Facca, C., and Marcomini, A. (2005). Organic carbon changes in the surface sediments of the Venice lagoon. Environ. Int. 31, 1002–1010. doi:10.1016/j.envint.2005.05.010
Sfriso, A., and Marcomini, A. (1996). Decline of Ulva growth in the lagoon of Venice. Bioresour. Technol. 58, 299–307. doi:10.1016/s0960-8524(96)00120-4
Sfriso, A., Marcomini, A., and Pavoni, B. (1987). Relationships between macroalgal biomass and nutrient concentrations in a hypertrophic area of the Venice lagoon. Mar. Environ. Res. 22, 297–312. doi:10.1016/0141-1136(87)90005-5
Sfriso, A., Marcomini, A., and Zanette, M. (1995). Heavy metals in sediments, SPM, and phytozoobenthos of the Lagoon of Venice. Mar. Pollut. Bull. 30 (2), 116–124. doi:10.1016/0025-326X(94)00109-M
Steeby, J. A., Hargreaves, J. A., Tucker, C. S., and Cathcart, T. P. (2004). Modeling industry-wide sediment oxygen demand and estimation of the contribution of sediment to total respiration in commercial channel catfish ponds. Aquac. Eng. 31, 247–262. doi:10.1016/j.aquaeng.2004.05.006
Tagliapietra, D., Zanon, V., Frangipane, G., Umgiesser, G., and Sigovini, M. (2011). “Physiographic zoning of the Venetian lagoon,” in Scientific research and safeguarding of Venice - volume VII - 2007-2010 results. Editor P. Campostrini (Venice, Italy: CORILA Publ.), 161–164. ISBN: 9788889405215 888940521X.
Thamdrup, B., Hansen, J. W., and Jørgensen, B. B. (1998). Temperature dependence of aerobic respiration in a coastal sediment. FEMS Microbiol. Ecol. 25 (2), 189–200. doi:10.1111/j.1574-6941.1998.tb00472.x
Thomann, R. V., and Mueller, J. A. (1987). Principles of surface water quality modeling and control. New York: Harper and Rowe, 291–293.
Todd, M. J., Lowrance, R. R., Goovaerts, P., Vellidis, G., and Pringle, C. M. (2010). Geostatistical modeling of the spatial distribution of sediment oxygen demand within a Coastal Plain blackwater watershed. Geoderma 159 (1-2), 53–62. doi:10.1016/j.geoderma.2010.06.015
Trincardi, F., Barbanti, A., Bastianini, M., Cavaleri, L., Chiggiato, J., Papa, A., et al. (2016). The 1966 flooding of Venice: What time taught us for the future. Oceanogr. Wash. D. C). 29 (4), 178–186. doi:10.5670/oceanog.2016.87
Umgiesser, G. (2020). The impact of operating the mobile barriers in Venice (MOSE) under climate change. J. Nat. Conserv. 54, 125783. doi:10.1016/j.jnc.2019.125783
Utley, B. C., Vellidis, G., Lowrance, R., and Smith, M. C. (2008). Factors affecting sediment oxygen demand dynamics in blackwater streams of Georgia's coastal plain. J. Am. Water Resour. Assoc. 44, 742–753. doi:10.1111/j.1752-1688.2008.00202.x
Vellidis, G., Barnes, P., Bosch, D. D., and Cathey, A. M. (2006). Mathematical simulation tools for developing dissolved oxygen TMDLS. Trans. ASABE 49 (4), 1003–1022. ISSN 0001−2351. doi:10.13031/2013.21743
Viaroli, P., Bartoli, M., Giordani, G., Naldi, M., Orfanidis, S., and Zaldivar, J. M. (2008). Community shifts, alternative stable states, biogeochemical controls and feedbacks in eutrophic coastal lagoons: A brief overview. Aquat. Conserv. 18, 105–117. doi:10.1002/aqc.956
Walker, R. R., and Snodgrass, W. J. (1986). Model for sediment oxygen demand in lakes. J. Environ. Eng. New. York. 112, 25–43. doi:10.1061/(ASCE)0733-9372(1986)112:1(25)
Wood, T. M. (2001). Sediment oxygen demand in upper klamath and agency lakes, Oregon, 1999. Portland, OR: U.S. Geological Survey Water-Resources Investigations. Report 01-4080.
Zaggia, L., Rosso, J., and Zonta, R. (2007). Sulphate reduction in the sediment of the Venice canals (Italy). Mar. Pollut. Bull. 10-12, 415–424. doi:10.1016/j.marpolbul.2007.09.004
Zakem, E. J., Cael, B. B., and Levine, N. M. (2021). A unified theory for organic matter accumulation. Proc. Natl. Acad. Sci. U. S. A. 118 (6), e2016896118. doi:10.1073/pnas.2016896118
Ziadat, A. H., and Berdanier, B. W. (2004). Stream depth significance during in-situ sediment oxygen demand measurements in shallow streams. J. Am. Water Resour. Assoc. 40 (3), 631–638. doi:10.1111/j.1752-1688.2004.tb04448.x
Zirino, A., Elwany, H., Facca, C., Maicù, F., Neira, C., and Mendoza, G. (2016). Nitrogen to phosphorus ratio in the Venice (Italy) Lagoon (2001–2010) and its relation to macroalgae. Mar. Chem. 180, 33–41. doi:10.1016/j.marchem.2016.01.002
Zonta, R., Costa, F., Collavini, F., and Zaggia, L. (2005). Objectives and structure of the DRAIN project: An extensive study of the delivery from the drainage basin of the Venice lagoon (Italy). Environ. Int. 31 (7), 923–928. doi:10.1016/j.envint.2005.05.002
Zonta, R., Botter, M., Cassin, D., Bellucci, L. G., Pini, R., and Dominik, J. (2018). Sediment texture and metal contamination in the Venice lagoon (Italy): A snapshot before the installation of the MOSE system. Estuar. Coast. Shelf Sci. 205, 131–151. doi:10.1016/j.ecss.2018.03.007
Keywords: benthic chamber, climate changes, lagoons, MOSE system, sediment oxygen demand, Venice
Citation: Leoni S, Dominik J, Cassin D, Manfè G, Tagliapietra D, Acri F and Zonta R (2022) Sediment oxygen demand rate in a flow regulated lagoon (Venice, Italy). Front. Environ. Sci. 10:1000665. doi: 10.3389/fenvs.2022.1000665
Received: 22 July 2022; Accepted: 27 September 2022;
Published: 10 October 2022.
Edited by:
Caterina Bergami, Institute of Marine Science, National Research Council (CNR), ItalyReviewed by:
Daniele Brigolin, Università Iuav di Venezia, ItalyMichele Mistri, University of Ferrara, Italy
Copyright © 2022 Leoni, Dominik, Cassin, Manfè, Tagliapietra, Acri and Zonta. This is an open-access article distributed under the terms of the Creative Commons Attribution License (CC BY). The use, distribution or reproduction in other forums is permitted, provided the original author(s) and the copyright owner(s) are credited and that the original publication in this journal is cited, in accordance with accepted academic practice. No use, distribution or reproduction is permitted which does not comply with these terms.
*Correspondence: Roberto Zonta, ci56b250YUBpc21hci5jbnIuaXQ=