 Yanqing Lian
 Lisha Zhen4†
- 1State Key Laboratory of Hydrology-Water Resources and Hydraulic Engineering, Hohai University, Nanjing, China
- 2Yangtze Institute for Conservation and Development, Hohai University, Nanjing, China
- 3State Key Laboratory of Loess and Quaternary Geology, Institute of Earth Environment, Chinese Academy of Sciences, Xi’an, Shaanxi, China
- 4Shaanxi Provincial Institute of Microbiology, Shaanxi Academy of Sciences, Xi’an, Shaanxi, China
Massive fish farming for more than two decades, combined with external sources of pollution, deteriorated the quality of water and sediment and damaged the ecosystem in Honghu Lake. Although water quality has been improving, great challenges remain in restoring the healthy function of ecosystems for self-mitigation. With concerns about contaminants in the sediment that might be the source of pollution, water and sediment samples were collected systematically across the wetland. With the 16s rDNA gene sequence and multiple statistical analyses, this study was able to identify locations where sediments were mostly impacted by non-point source pollution from the surrounding agricultural areas and fish farming inside the lake. The clustering analysis identified two distinct clusters coincide with areas with and without fish farming. The LEfSe algorithm successfully distinguished the differentially abundant biomarkers between the two clusters. By combining the GIS techniques with microbial analysis, hotspots with hazardous pathogenic bacteria such as Rokubacteria, Elusimicrobia, and Fusobacteria in sediments were located. This study showed that comprehensive biodiversity analysis combined with spatial analysis could make the microbial information serve well as biomarkers and indicators for environmental and ecosystem restoration.
Introduction
The high-throughput sequencing technology can provide a vast amount of biological information that would allow us to study the structural characteristics of the aquatic environment microbial community from different perspectives. Cremona et al. (2014) investigated the influence of functional groups for specific production and respiration patterns on a lake’s metabolic balance and found that planktonic functional groups contributed to most of the metabolism of the lake but minimal from the benthic functional groups. Dang et al. (2011) conducted an experimental study on a pig-fish farm to assess the impact of medicated feed on antimicrobial resistance. They found occurrences of Enterococcus faecium, Enterococcus faecalis, and other Enterococcus spp. in the fish farm sediment had a strong correlation with the pig manure. Harnisz et al. (2015) study showed no significant differences in the abundance of antibiotic-resistant bacteria and antibiotic resistance genes but an increase in the diversity of tetracycline resistance genes. Homklin et al (2009) conducted aerobic biodegradation tests using sediment from the masculinization pond. Their results suggested that the 17alpha-methyltestosterone (MT) is biodegradable and degradation rates decrease with an increase in the initial MT concentration. A study by Ivanova and Dedysh (2012) showed that Planctomycetes were most abundant in the oxic part of the wetland profiles and most peatland sites showed a sharp decline of planctomycete abundance with depth. Liu et al. (2020) study suggested that the microbial community in sediment samples had a higher abundance and diversity than in water samples. Their research also found bacteria related to eutrophication in sample groups. Deltaproteobacteria was found in sediments of the freshwater system as a result of the anaerobic oxidation of methane (Schubert et al., 2011). Results from a study by Xu et al. (2014) using a comprehensive functional gene array (GeoChip 4.0) suggested that indigenous microorganisms could be successfully stimulated for potential in situ bioremediation of persistent organic pollutants (POPs) in contaminated sediments. The application of antibiotic drugs for fish farming had increased antibiotic resistance in water and sediment (Stange et al., 2019).
Massive fish farming over two decades combined with other sources of pollution in the Honghu Lake not only deteriorated the quality of water and sediment but also damaged the ecosystem. There have been a few published papers about the water quality and microbial abundance in the Honghu Wetland area (Wang et al., 2017; Zhang et al., 2017; Han et al., 2019; Chen et al., 2021; Wu et al., 2021). Microbial communities in water samples were largely affected by the TN, TP, NO3(-)-N, and NO2(-)-N concentrations, and sediment was affected by Sed-OM and Sed-TN. Tetracycline, oxytetracycline, chlortetracycline, and sulfadiazine are the four dominant antibiotics in the wetland, and they had a major influence on microbial communities in both water and sediment samples (Wang et al., 2017; Han et al., 2019; Goyal et al., 2022; Malyan et al., 2022). Tetracyclines may have contributed more than sulphonamides in the abundance of sul1, sul2, and tetC gens in Honghu Lake (Yang et al., 2016). Microbial community shift had the most direct contribution to ARG variation (Wang et al., 2020). Honghu wetland has been largely impacted by fish farming inside the wetland and agriculture in its upper source areas, other than Cd that had occasionally exceeded the contamination level, no contamination was found from other heavy metals (Li et al., 2017; Li et al., 2018; Zhang et al., 2018). Studies (Yao et al., 2018) also showed a strong seasonal nitrogen cycle and variation of microbial abundance, but the abundance of functional microorganisms in sediments was not significantly different among vegetation types.
As part of the ecosystem restoration effort, this research was designed for a reconnaissance study to characterize the spatial heterogeneity of microbial communities across the wetland and identify biomarkers as indications of the environmental conditions. It was hopeful that the results would help develop effective practices to restore the ecosystem to its healthy conditions using remediation involving biological processes for water and sediment treatment.
Materials and methods
Study area
Honghu Lake is one of the largest wetlands in the middle reach of the Yangtze River with a surface area of around 400 square kilometers and an average water depth of less than 5 m. It can be divided into the east and west divisions (Figure 1) due to their weak hydraulic connection. This wetland is rich with about 57 fish species and 472 vascular plants and provides service for wildlife and support for social and economic development to local communities. Since the beginning of the 1990’s, the lake was open for unregulated and massive fish farming for over two decades. Contamination of fish fertilizer and antibiotics and other external sources of pollution had deteriorated not only the quality of water and sediment but also damaged the ecosystem. Its water quality had only reached the national class II water quality standard twice in those years, with BOD5, ammonia nitrogen, total nitrogen, total phosphorus, and permanganate indices consistently exceeding the Chinese national standards.
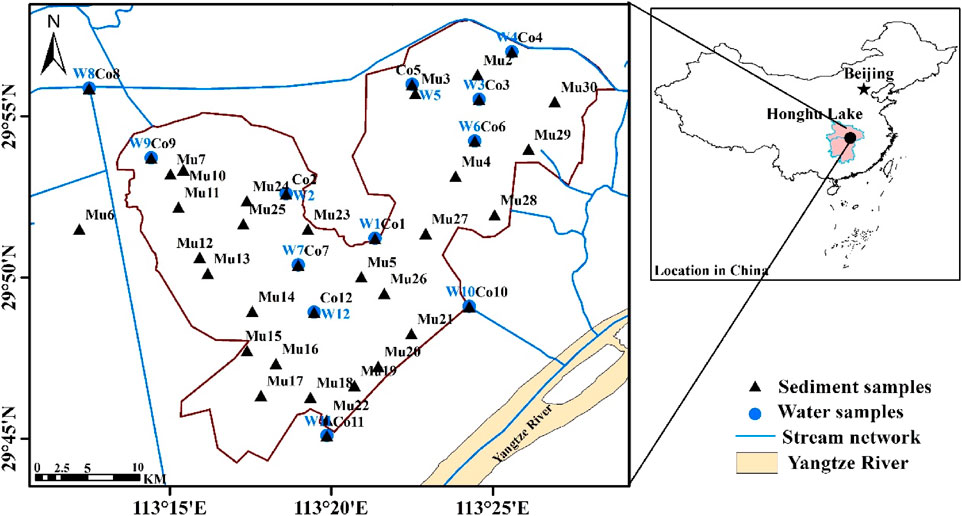
FIGURE 1. Locations of Water and Sediment Samples from the Honghu Wetland.
With the implementation of water protection measures since 2006, significant efforts, including banning all fish farming, cleaning out fish farming structures, and stopping and managing the pollution from its upstream source areas, have been made to restore the ecological environment. Although water quality has been seen to be improving, major challenges lay greatly in the restoration of the healthy function of ecosystems to mitigate on its own, particularly with concerns on contaminants in the sediment that might be the secondary source of water pollution in the wetland. Therefore, effective implementation plans are being sought to improve the eco-environment using remediation involving biological processes.
Sample collection
Twelve core sampling points, where both water and sediment samples were collected, were designed to represent the profiles from the inflow locations of the east and west portions of the wetland to its outlet to the Yangtze River. Thirty-nine additional sediment samples were collected for spatial representation of the Lake area. Sample locations are shown in Figure 1.
Microbial samples were collected using a battery-charged pump on the boat to pump water 1–5 L of water to filter through the 0.45 nm pore diameter filter paper. Water samples were collected for laboratory analysis of other environmental parameters such as cation, anion, nitrate, phosphorous, heavy metal, and environmental isotopes analysis. pH, temperature, dissolved oxygen, electric conductivity, hardness, and Oxidation Reduction Potential (ORP) were measured during sampling. Sediment samples were collected by using the bottom mud sampler. Roughly 1 kg of mud was preserved in polythene bags to analyze the physical and chemical characteristics in the laboratory. About 5–10 g of mud were collected and placed in a 50 ml centrifuge tube and stored with dry ice for 16S rRNA gene sequencing. Coordinates of sample locations were recorded with a GPS device for mapping and spatial analysis.
Sample processing and sequencing
Major processes for DNA samples include DNA extraction from water samples, PCR amplification, fluorescence quantification, construction of Miseq Library, and Miseq sequencing. The genomic DNA was extracted by 1% agarose gel electrophoresis.
Specific primers with barcodes were synthesized according to the designated sequencing region. To ensure the accuracy and reliability of the subsequent data analysis, the PCR amplification used low cycle number amplification as much as possible and ensure the same cycle number of each sample amplification. Representative samples were randomly selected for the pre-test to ensure that the majority of samples can be amplified with an appropriate concentration in the minimum number of cycles.
According to the preliminary quantitative results of electrophoresis, the PCR products were quantified by the QuantiFluor™ -ST blue fluorescence quantitative system (Promega company) and then mixed in corresponding proportion according to the requirements of the sequencing quantity of each sample. To construct the Miseq library, the official connector sequence of Illumina was added to the outer end of the target region by PCR, the gel recovery kit was then used to recover PCR products, and then the Tris HCl buffer was eluted and detected by 2% agarose electrophoresis, finally to use sodium hydroxide to produce single-strand DNA fragments.
OTU clustering and annotation
Operational Taxonomic Units (OTUs) were clustered with a 97% similarity cutoff using UPARSE (version 7.1 http://drive5.com/uparse/) with a novel ‘greedy’ algorithm that performs chimera filtering and OTU clustering simultaneously (Edgar, 2013). The taxonomy of each 16S rRNA gene sequence was analysed by the RDP Classifier algorithm (http://rdp.cme.msu.edu/) against the Silva (SSU123) 16S rRNA database using a confidence threshold of 70%. Microbiome data tend to be very noisy and the total number of counts per sample is highly variable because of the experimental process and quality control filtering. Normalization of reads was performed with the minimum readout of all the samples. For each representative sequence, the Silva database was used based on the RDP classifier Bayesian algorithm to annotate taxonomic information on the microbial communities at the domain, kingdom, phylum, class, order, family, genus, and species levels.
Statistical analyses
Microbiome data tend to be very noisy, and the total number of counts per sample is highly variable because of the experimental process and quality control filtering. Normalization of reads was performed with the minimum readout of all the samples.
Since R. H. Whittaker (1960), Whittaker (1972) introduced alpha diversity (α-diversity), beta diversity (β-diversity), and gamma diversity (γ-diversity) to quantify the diversity of mean species and habitats at a local scale, more indices have been developed to quantify the richness and diversity of biological communities. These include the sobs, chao, ace, jack, and bootstrap indices for community richness, the simpsoneven, shannoneven, heip, smithwilson indices for community evenness, and the Shannon, Simpson, npshannon, bergerparker, invsimpson, qstat indices for community diversity, and the coverage for community coverage. This paper selected to use the commonly used sobs, Shannon, Simpson, Chao, coverage, Shannoneven, and Simpsoneven indices.
Several ordination methods, such as the principal component analysis (PCA), the principal coordinates analysis (PCoA), and the non-metric multidimensional scaling (NMDS), are commonly used for beta diversity analysis. Gauch and Singer (1982) thought the underlined linear assumption makes PCA unsuitable for most ecological data sets. This study adopted the principal coordinate analysis (PCoA), in which the distance metric was calculated using the Bray-Curtis algorithm. The microPITA (microbiomes: Picking Interesting Taxonomic Abundance) was used to select samples with more diversity, most dissimilarity, and the most representative from the spatially distributed sample data.
Spearman’s rank correlation coefficient measures the rank correlation to assess the relationship between two variables using a monotonic function. The major difference from the Pearson correlation is that Pearson’s correlation assesses linear relationships. The Wilcoxon rank-sum test is a nonparametric test that may be used to assess whether the distributions of observations obtained between two separate groups on a dependent variable are systematically different. It is particularly advantageous when comparing the averages of two independent groups of samples of which a Gaussian type distribution cannot be assumed or unknown.
LEfSe (Linear discriminant analysis Effect Size) (Segata et al., 2011) is an algorithm that can identify high-dimensional biomarkers (genes, pathways, or taxa) and characterize the differences between two or more biological conditions. LEfSe was proven to be efficient in detecting bacterial organisms and functional characteristics differentially abundant between two or more microbial environments.
The typing analysis was based on the algorithms introduced by Arumugam and Raes (2011) and R codes released by the group. This method firstly clustered the samples based on relative abundances of taxon using the Jenson-Shannon Distance (JSD) metric and the Partitioning Around Medoids (PAM) clustering algorithm. The Calinski-Harabasz (CH) Index (Calinski and Harabasz, 1974) was used to assess the optimal number of clusters.
Software packages used in this study include the Uparse 7.0.1090 for OTU classifications, Usearch 7.0 for OTU statistics, Mothur 1.30.2 for Alpha diversity, Qiime 1.9.1 for Beta diversity and sequence deduplication filtering, sequence classification annotation, and IQ-TREE 1.6.8 for constructing the phylogenetic tree.
Spatial analysis using ArcGIS IDW tool
Although statistical analysis is efficient in characterizing the differences of microbial communities and identifying biomarkers with ecological significance, it is not able or not straightforward in displaying their spatial features. Contouring a selected parameter based on measured data across the lake would help better understand the spatial distribution of microbial communities. This study adopted the Geostatistical Analyst in ArcGIS 10. to develop the contours of the selected parameter. IDW (inverse distance weighted), spline interpolation, and kriging are commonly used tools in ArcGIS for spatial data analysis. We found IDW (Watson and Philip, 1985), which assumes that things in closer proximity are more alike, and each measured point has a local influence that diminishes with distance, was more appropriate for the open lake condition in this study.
Results and discussions
Composition of microbial community
For consistent comparison of samples from different spatial distributions, sample reads were normalized by the minimum read of 24,553. Samples were classified into the water sample group and sediment group, the sediment group, and the water group for respective sediment and water samples in the west and east divisions of the lake, as shown in Figure 1.
Through the taxonomy analysis, 70 phyla, 1382 genera, 3203 species, and 14289 OTUs were identified from all water and sediment samples (Supplementary Table S1). The composition of the microbial communities in sediment samples was distinctively different from water samples and more abundant than in water samples (Supplementary Table S1). The common phyla with an average relative abundance greater than 1% in water and sediment samples (Figures 2B,C; Supplementary Table S2) were Proteobacteria, Cyanobacteria, Actinobacteria, Bacteroidetes, Verrucomicrobia, Planctomycetes, Chloroflexi, Firmicutes, and Patescibacteria. Other phyla appeared to have a relative abundance greater than 1% only in the sediment samples including Acidobacteria, Spirochaetes, Nitrospirae, Latescibacteria, Nitrospinae, and Gemmatimonadetes. Other phyla uniquely found in the sediment samples were Crenarchaeota, WS4, Dadabacteria, Atribacteria, CK-2C2-2, Schekmanbacteria, and norank_d__Archaea. Proteobacteria was the most abundant in both water and sediment samples.
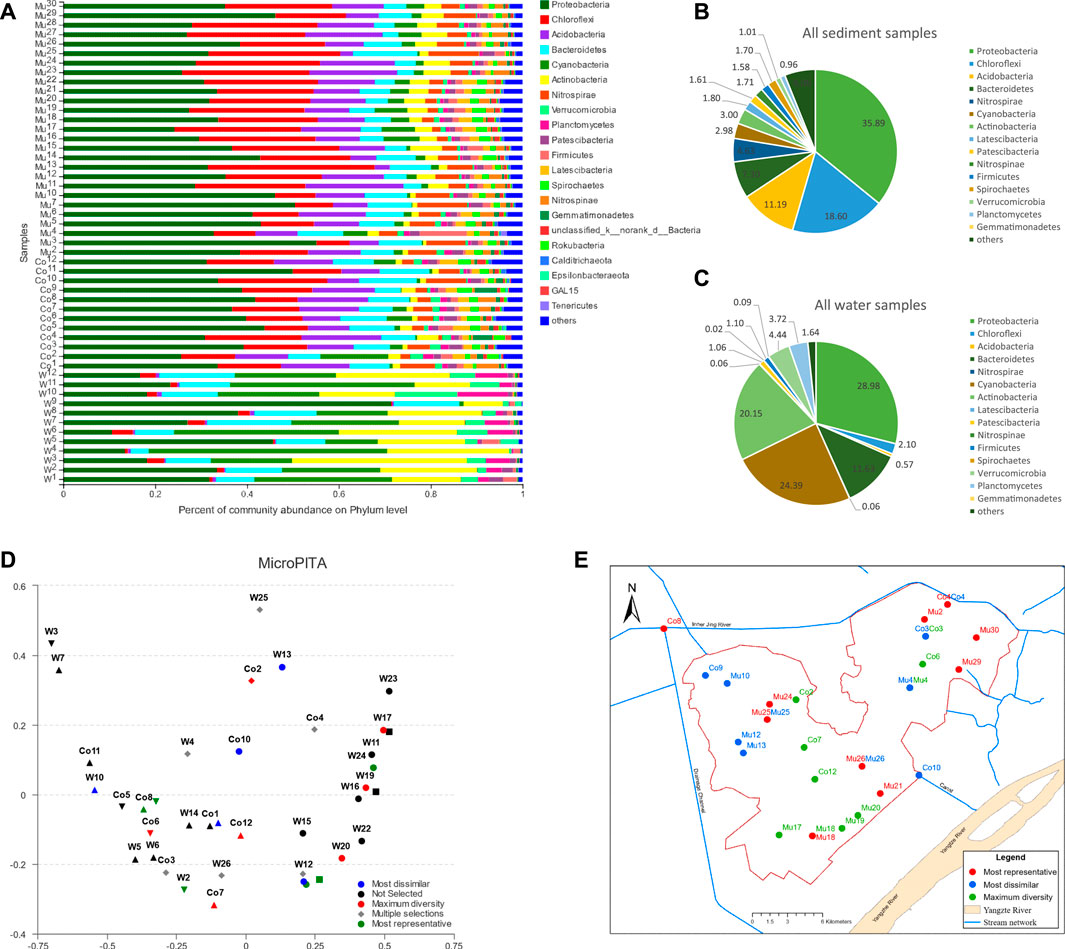
FIGURE 2. Composition of microbial communities in water and sediment samples: (A) phyla with relative abundance greater than 1% in water and sediment samples, (B) percentages of phyla with average relative abundance greater than 1% in all sediment samples, (C) percentages of phyla with average relative abundance greater than 1% in all water samples, (D) the most dissimilar, maximum diversity and most representative samples identified using MicroPITA analysis, (E) distribution of identified samples from MicroPITA analysis.
In contrast, sediment had more abundant Chloroflexi and Acidobacteria than water samples. Water samples had more Cyanobacteria and Actinobacteria than sediment samples. For sediment samples, the average relative abundance of major phyla was similar in the east and west divisions of the wetland, but in the water samples, the average relative abundances for Cyanobacteria and Actinobacteria were higher in the eastern division than in the west, which could be due to the shallower water depth and contamination of inflows in the east division. A detailed comparison of microbial abundance using the LEfSe method will be discussed later in this paper.
The microPITA analysis (Tickle et al., 2013) allows us to select samples with the most representativeness of microbial communities, samples with the most extreme microbial communities, and samples with the most diverse community. Shown in Figure 2D were the samples selected for each category through the MicroPITA analysis that was based on the Shannon index with the Bray-Curtis distance metric. The location of MicroPITA selected samples was displayed on the geographical map (Figure 2E). Samples of maximum diversity were located along the side of the lake and around the centers of the east and west divisions of the lake, which could be due to more intensive fish farming. Spatially, samples of most dissimilarity were mostly located in the northwest part of the west lake division and the north part of the east lake division, which could imply that the inflows from agriculture and industrial pollution might have had an impact on the microbial communities in addition to fish farming.
Beta diversity from water and sediment samples
Although microbial communities found in sediment samples were more abundant than in water samples, on average, the composition of microbial in sediment and water samples in the east and west divisions of the lake were similar. It is important to understand how the microbial communities would differ within each lake division. The hierarchical clustering analysis was able to show two distinctive clusters (Sed_E_C1 and Sed_E_C2) in the east lake division (Figure 3A) and two distinct major clusters (Sed_W_C1 and Sed_W_C2) and a cluster that consists of only one sample (Sed_W_C3) in the west division (Figure 3B). Overall, in both the east and west divisions, samples in cluster one (Sed_E_C1 and Sed_W_C1) were predominantly located along the southeast and east side of the lake, and cluster two (Sed_E_C2 and Sed_W_C2) samples were mostly around the center of the lake (Figure 3C). The Circos diagram in Figure 3D had the advantage of showing the relative abundance of the species in the five sample clusters and the distribution of the average proportion in different sample groups at the phylum level.
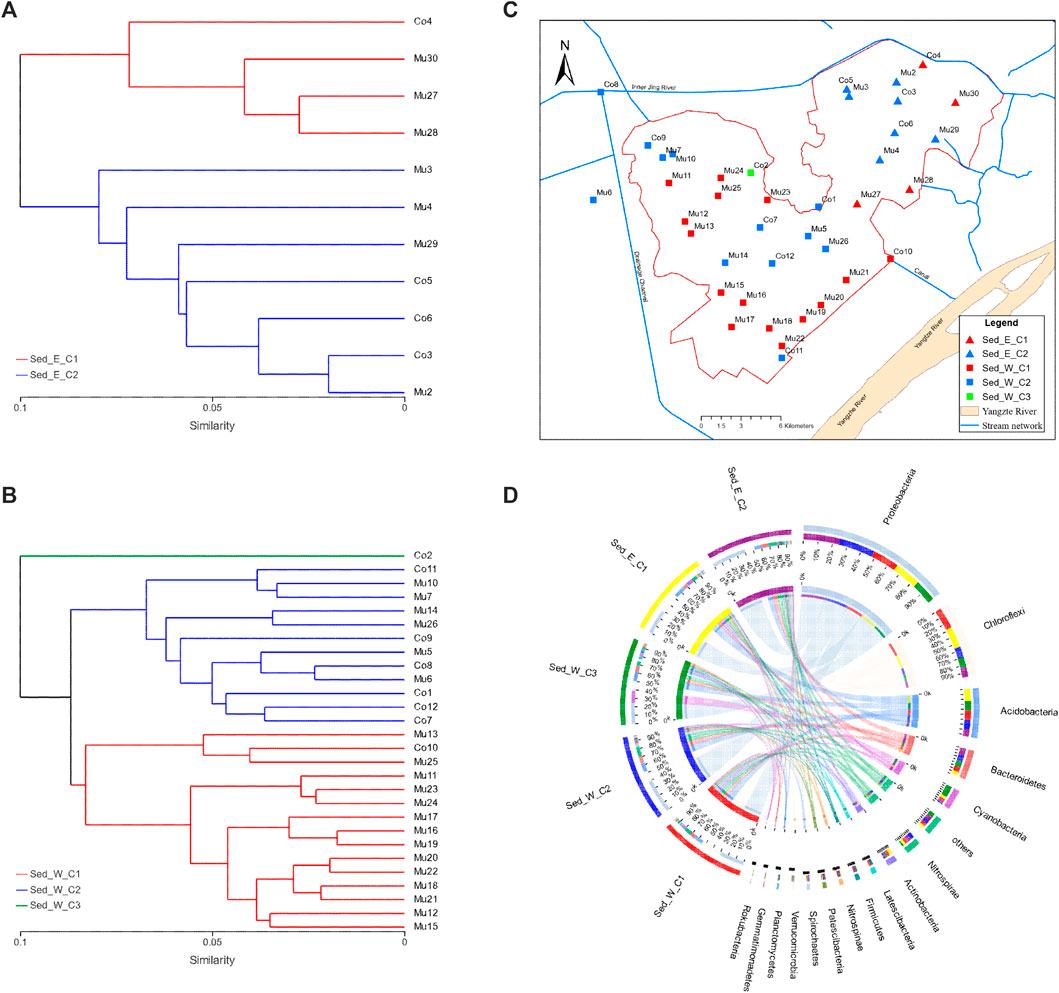
FIGURE 3. Clustering of sediment samples: (A,B) hierarchical clustering trees for sediment samples in the east and west divisions of the wetland, respectively, (C) distribution of samples in clusters showing overall samples along the edge of the wetland (Sed_E_C1 and Sed_W_C1) and around the center of the wetland (Sed_E_C2 and Sed_W_C2) belong to separate clusters in both the east and west divisions of the wetland. (D) Circos diagram for the sample and species relation for the five clusters in (A,B), the small semicircle (left semicircle) represents the species composition in the sample, The color ribbons of outer semicircle represents the sample groups, the color of the inner ribbon represents the species, and the length represents the relative abundance of the species in the corresponding sample; The outer semicircle on the right half indicates the distribution of the average proportion in different sample groups at the taxonomic level. The outer color band represents species, the inner color band represents different groups, and the length represents the distribution proportion of the sample in a certain species.
Several ordination methods such as the PCA with the Euclidian distance, PCoA, and PLS-DA based on the Bray-Curtis distance were performed to examine the beta diversity of water and sediment data. From the PCoA analysis, Figure 4A showed a distinctive difference between the water and sediment groups, with the variance explained on PCA1 as high as 55% and 16% on PCA2. For water samples (Figure 4B), the variances explained on the PCA1 and PCA2 were 61% and 16%, respectively, but there was no clear separation between samples in the east and west divisions of the wetland. Similar to water samples, although the variances (Figure 4C) explained on the PCA1 and PCA2 were 42% and 16%, there was no clear distinction between samples from the east and west divisions of the lake. However, the separation between the two clusters (Sed_E_C1 and Sed_E_C2) in the east division and between the two major clusters (Sed_W_C1 and Sed_W_C2) was evident. It was also clear that the first clusters in the east and west divisions (Sed_E_C1 and Sed_W_C1) were overlapped, and so were the second clusters (Sed_E_C2 and Sed_W_C2). The single sample in the third cluster from the west division was separated from other clusters. The same distribution pattern of sediment samples in the five clusters can be seen in Figure 4D.
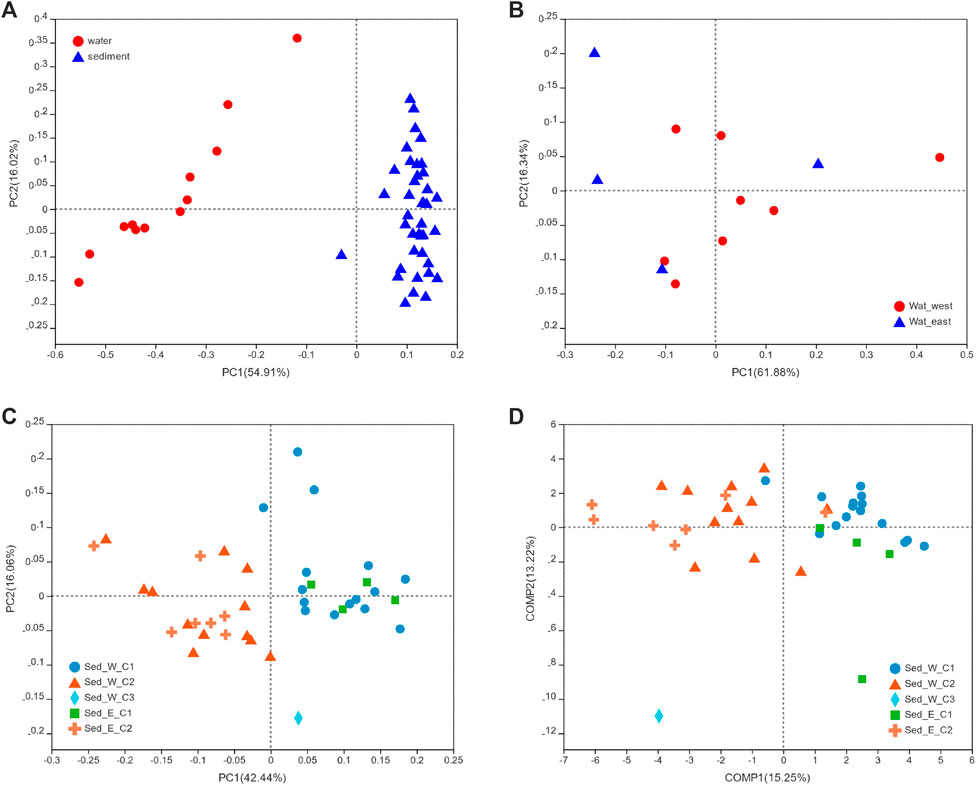
FIGURE 4. PCoA and PLS-DA analyse, in which the Bray -Curtis distance matrix was used for both methods. (A) PCoA analysis to compare water and sediment samples, (B) PCoA analysis to compare water samples from the east and west divisions of the lake, and (C, D) PCoA and PLS-DA analyses for the five clusters shown in Figure 3.
Results of typing analysis using the algorithms introduced by Arumugam and Raes (2011) on the five cluster sample groups (Supplementary Figure S1) showed that samples in the Sed_E_C1 and Sed_W_C1 groups fell in one cluster represented by Gammaproteobacteria class and samples in the Sed_E_C2 and Sed_W_C2 groups fell into another cluster with Anaerolinera be the dominant class. The typing analysis further proved that the microbial communities in the lake sediments affected by fish farming were distinctively different.
Abundance difference in sediment due to fish farming
The major interest of this study was identifying locations of lake sediments affected by the fish farming and other sources of pollution from unique biomarkers. Through hierarchical clustering, the sediment samples were classified into five clusters (Figure 3), and with the PCoA and PLS-DA analyses, it was clear the microbial communities between the two major clusters in each of the eastern and western divisions were different, but cluster one and cluster two across the east and western divisions of the lake were similar. The Kruskal-Wallis H test and the LEfSe analysis were conducted to find out which clades were significantly different in a statistical sense. While the Kruskal-Wallis H test was able to compare the difference of average proportions for a selected number of major species at a selected level and compute the statistically significant of the difference, the LEfSe analysis was able to identify all clades that are differentially abundant between the groups.
The Kruskal-Wallis H test was performed to classify the differences of phyla among the four major clusters (Sed_E_C1, Sed_E_C2, Sed_W_C1, and Sed_W_C2). Shown in Supplementary Figure S2 are phyla with a statistically significant difference (p-value ≤0.05) between the clusters. For Proteobacteria, Chloroflexi, Bacteroidetes, Actinobacteria, and Elusimicrobia, the mean proportions of phyla in cluster Sed_E_C1 and cluster Sed_W_C1 were very close and so were cluster Sed_E_C2 and cluster Sed_W_C2. However, the proportion difference across cluster one (Sed_E_C1 or Sed_W_C1) and cluster two (Sed_E_C2 or Sed_W_C2) were significantly different. For Gemmatimonadetes, Dependentiae, and Lentisphaerae, the differences between cluster one (Sed_E_C1 and Sed_W_C1) and cluster two (Sed_E_C2 and Sed_W_C2) in the east and west divisions were distinct, and the difference across cluster one and cluster two was significant.
Identification of differentially abundant biomarkers
The LEfSe analysis with “All-against-all” computation for all four clusters identified 45 differentially abundant clades of bacteria (Figures 5B,C), which includes Actinobacteria, Gemmatimonadetes, and Proteobacteria phylum in the cluster Sed_E_C1, Bacteroidetes, Dependentiae, Elusimicrobia and Lentisphaerae in the cluster Sed_E_C2, and Chloroflexi in Sed_W_C1 and Acetothermia in Sed_W_C2. Comparing the two major clusters in the west division (Supplementary Figure S3) showed there were 17 and 27differentially abundant clades in the cluster Sed_W_C1 and Sed_W_C2 in the western division, respectively, including phyla of Chloroflexi, Actinobacteria, Cyanobacteria and Firmicutes in Sed_W_C1 and Proteobacteria, Bacteroidetes, Gemmatimonadetes, Dependentiae, Acetothermia, Hydrogenedentes and Elusimicrobia in Sed_W_C2. For the east division of the lake (Supplementary Figure S3), 12 clades were differentially abundant in the Sed_E_C1 including phyla of Chloroflexi, Acidobacteria, Actinobacteria, and Synergistetes, and 30 clades in Sed_E_C2, with phyla of Proteobacteria, Bacteroidetes, Spirochaetes, Calditrichaeota, Omnitrophicaeota, Lentisphaerae, LCP_89, Margulisbacteria, and Acetothermia.
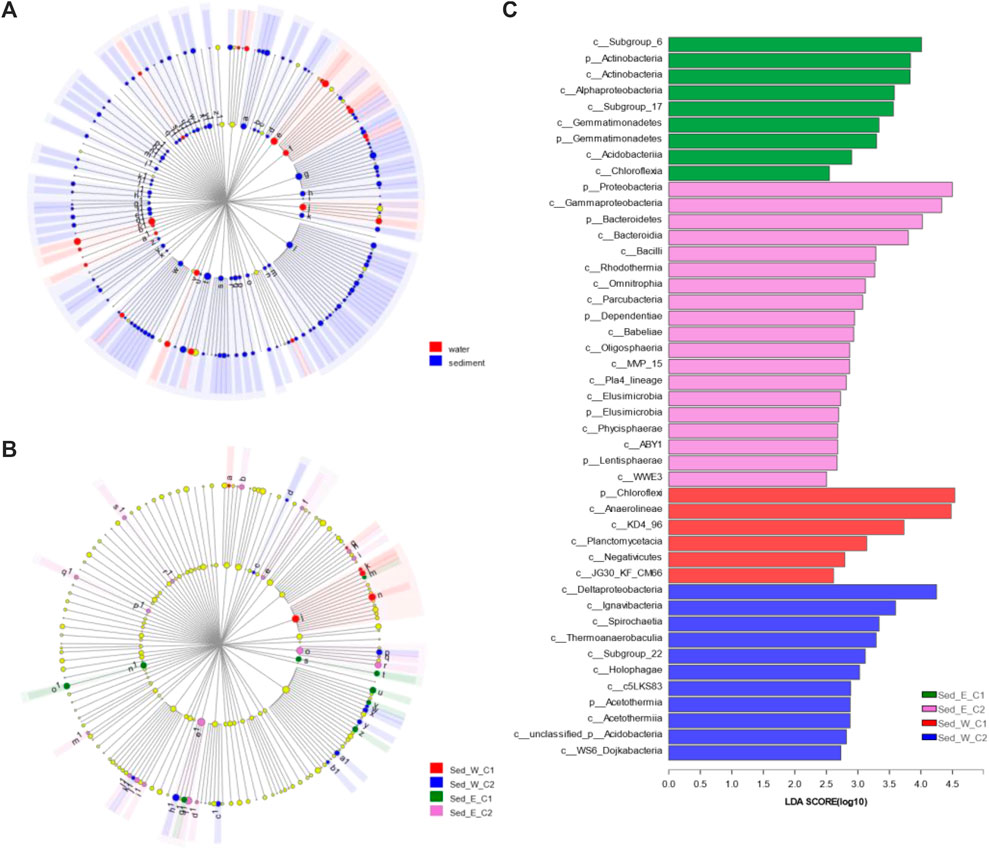
FIGURE 5. LEfSe analysis for differences of microbial communities between sample groups. (A, B) are cladograms of taxonomic representation of statistically and biologically consistent differences between water and sediment sample groups and among the four major clusters shown in Figure 3. Differences are represented in the color of the most abundant classes as shown in the legend of each figure. Each circle's diameter is proportional to the taxon's abundance. LEfSe scores can be interpreted as the degree of consistent difference in relative abundance between features in the two classes of analyzed microbial communities. The histogram in (C) thus identifies which clades among all those detected as statistically and biologically differential explain the greatest differences between communities.
For the water and sediment sample groups, the LEfSe analysis (Figure 5A) with the strict “All-against-all” computation from the phylum to class levels identified 147 differentially abundant clades in sediment samples and 25 in the water samples, out of which there were 44 phyla in sediment and 8 in water including Cyanobacteria, Actinobacteria, Bacteroidetes, Verrucomicrobia, Planctomycetes, Margulisbacteria, Deinococcus_Thermus, and Fusobacteria. Between the sample groups for the east and west divisions of the lake, the LEfSe analysis on sediment samples only identified one clade in the western division and 5 in the eastern division to be differentially abundant than the other. In contrast, for the water sample, nine clades in the west and two clades in the east were differentially abundant than the other, respectively, which could be due to the dynamic conditions of the lake water.
Impacts of environmental factors on microbial communities
A study by Ban et al. (2014) showed that the combined water quality index (CWQII) for the lake increased from 2.0 to 4.0 from the years of 2001 to 2005, then decreased from 2006 and kept a balance between 2.0 and 3.0 from 2006 to 2011, indicating the water quality in the lake deteriorated from 2001 to 2005 but gradually improved since 2006 with the implementation of water protection measure. Water quality data (Ban et al., 2014) also showed monthly changes due to the impact of both natural and human causes. Zhang and Sun (2017) estimated, on the annual average, the upper stream source areas contributed as much as 70% and 63% of the total load into the lake from nitrogen and phosphorus, respectively. The composite water quality indices computed from water quality data in this study indicated that the water quality in the east and west wetland divisions was in the Category III of the Chinese Government Standard. Besides, to stop the pollution from its upstream source areas, a major challenge for the restoration of water quality in this wetland lays heavily on the restoration of the healthy function of ecosystems to mitigate on its own. The chemical analysis showed that Ammonia, Nitrate, Total Nitrogen, and Total Phosphorus in sediment samples were 253.56, 33.78, 3.18, and 4.95 times higher than in water samples, respectively, which implies sediment could be another source of water pollution in the wetland when disturbance or resuspension of sediment by fish movement and wave dynamics and even birds.
To understand how the microbial community correlates with the environmental variables of CEC, EC, Total_N, Organic_matter, pH, and Total_P for sediment and of pH, DO, Total_N, EC, Total_P, T, and ORP for water, the redundancy analysis (RDA) of phyla in sediment samples with environmental variables (Figure 6A) showed that Proteobacteria, Acidobacteria, Nitrospirae, and Bacteroidetes had better correlation with pH and total phosphorous, Chloroflexi, on the other hand, correlate more with CEC, EC, Total_N and Organic_matter. Statistically, Organic matter had a significant correlation with microbial communities in sediment samples. For water samples shown in Figure 6B, Proteobacteria and Bacteroidetes correlated well with EC, Total_P, and Total_N, whereas Cyanobacteria, Actinobacteria, and Verrucomicrobia had a better correlation with ORP, DO, T and pH. Out of the seven environmental factors for water samples, pH, Do, EC, and Total_P had a statistically significant correlation with microbial communities (Supplementary Table S3).
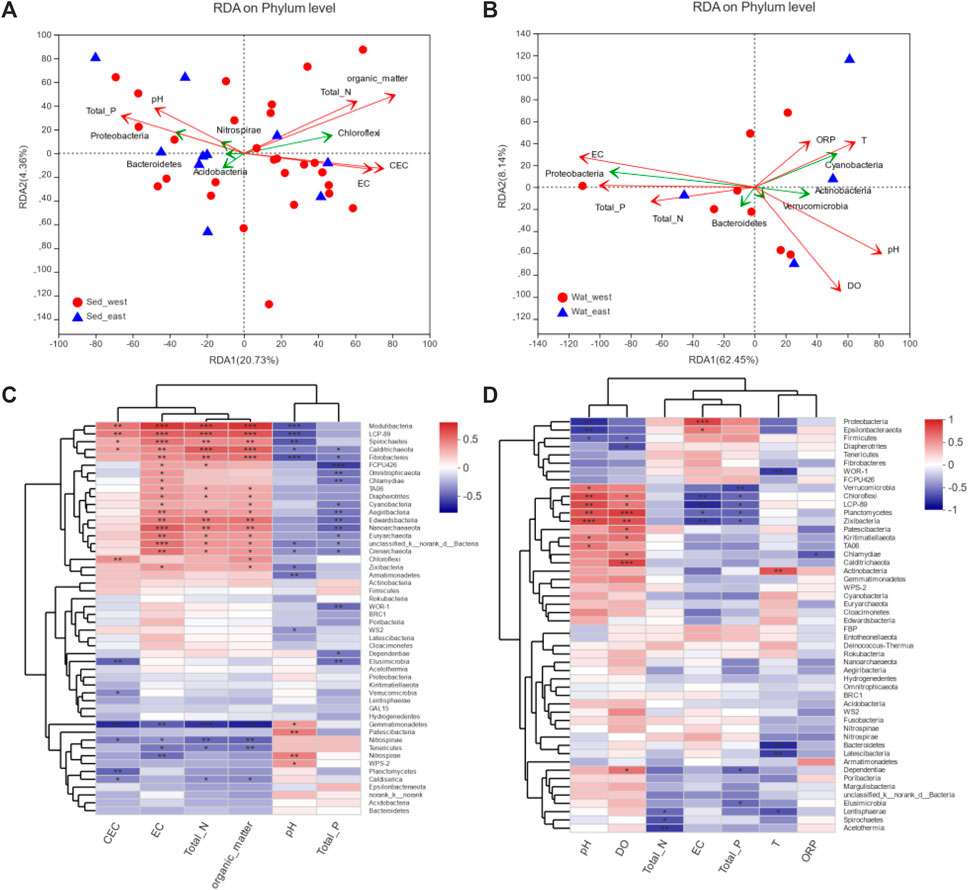
FIGURE 6. Correlation analysis of environmental variables with microbial communities: (A) RDA analysis for sediment samples, (B) RDA analysis for water samples, (C) Spearman correlation heatmap for sediment samples, (D) Spearman correlation heatmap for water samples.
Impacts of environmental variables on 50 phyla in water and sediment samples were examined through the Spearman correlation analysis. Environmental variables and phyla were clustered, respectively, based on the average distance metric. For sediment samples (Figure 6C), environmental variables were clustered into two major groups, and 55 phyla were clustered into three major groups. The cluster consists of Chloroflexi, Actinobacteria, Calditrichaeota, Fibrobacteres, Modulibacteria, LCP-89, Spirochaetes, Zixibacteria, Armatimonadetes, Chlamydiae, Omnitrophicaeota, FCPU426, Cyanobacteria, Euryarchaeota, Edwardsbacteria, Nanoarchaeaeota, Crenarchaeota, TA06, Aegiribacteria, and Diapherotrites correlated with an environmental variable cluster of pH and total phosphorus negatively but had strong positive correlations with CEC, EC, total Nitrogen and Organic material in the second environmental variable cluster. The two clusters of environmental variables had reversed impacts on the cluster of phyla, including Gemmatimonadetes, Nitrospirae, Nitrospinae, and Tenericutes, however. The correlation of environmental variables with phyla in water samples (Figure 6D) was less strong and limited to a small number of species. DO, pH, and resistance had a strong positive correlation with Chloroflexi, LCP-89, Verrucomicrobia, Planctomycetes, and Zixibacteria but a negative correlation with Proteobacteria, Epsilonbacteraeota, Firmicutes, Fibrobacteres, and Diapherotrites. However, EC and total phosphorus had a strong negative correlation with Chloroflexi, LCP-89, Verrucomicrobia, Planctomycetes, and Zixibacteria but positively correlated with Proteobacteria and Epsilonbacteraeota.
Microbial community spatial heterogeneity and environmental indication
For a lake with a surface area as large as 400 square kilometers that was used for massive fish farming for over two decades and was surrounded by agricultural land with crab farming, it would be expected the environmental condition and microbial communities would vary to a great deal. Contours of major environmental variables and phyla were developed using the Geographical Information Systems (GIS) to understand the spatial distribution patterns of environmental variables and microbial communities in the lake sediments. Overall, the total nitrogen, organic matter, and EC had similar spatial distribution patterns across the lake (Figures 7A–C), which belong to one cluster in the heatmap (Figure 6C). For CEC (Figure 7D), its high concentration area was also located in the lower southwest corner; therefore, it was clustered with the total nitrogen, organic matter, and EC. On the other hand, the small concentration areas for pH and the total phosphorous (Figures 7E,F) were in the southwestern corner. The main high concentration areas were in the northwestern part of the west division; both were grouped into one cluster. The high concentration of total nitrogen and organic matter in the southwestern part of the western division was due to the accumulation of nitrogen from wind-blown lake waves and the stagnation of water without a flow outlet. In contrast, the high concentration of the total phosphorous in the northwestern part of the west division was due to the inflow from the agricultural land.
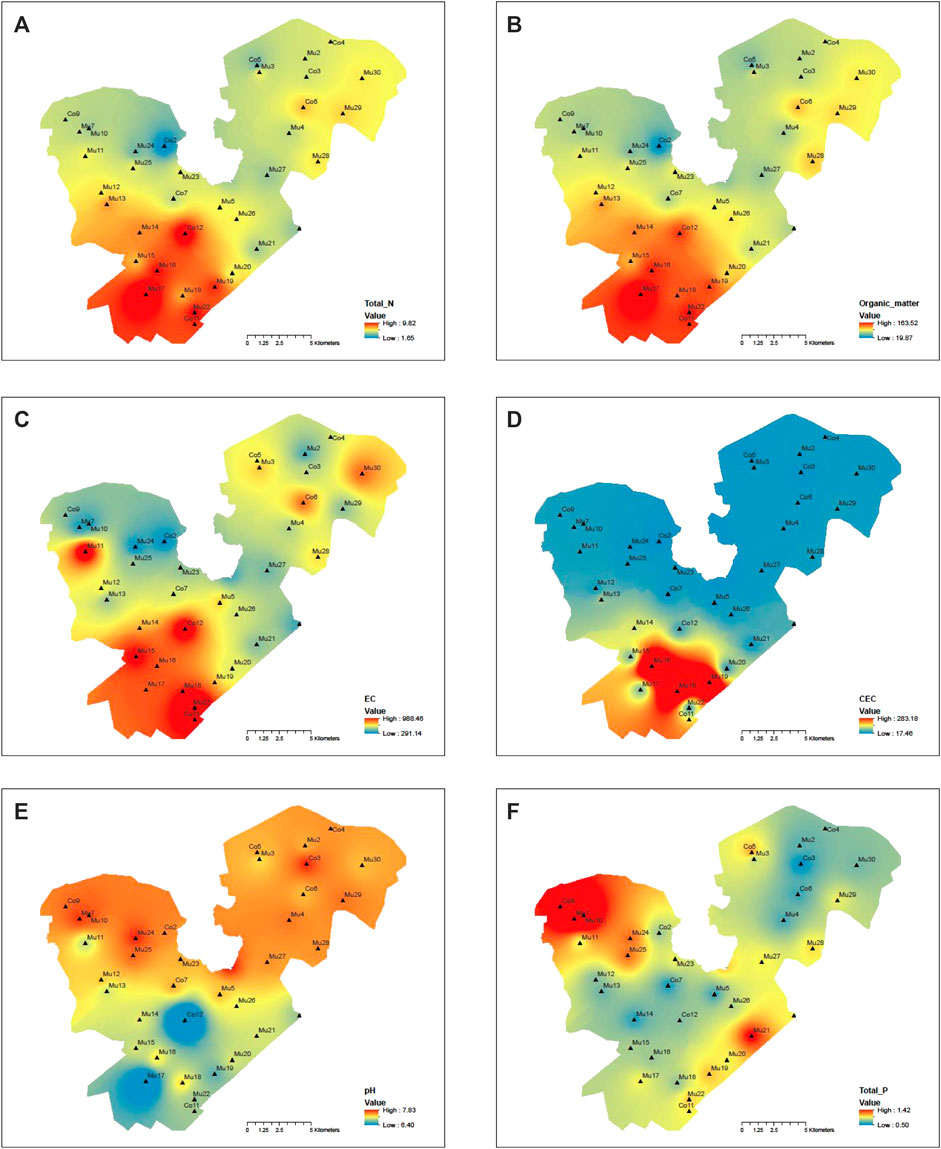
FIGURE 7. Contours of environmental variables for sediment samples: (A) total nitrogen, (B) organic matter, (C) EC (Electric conductivity), (D) CEC (Cation exchange capacity), (E) pH, (F) total phosphorous.
The Spearman correlation analysis showed the absolute abundance of some bacteria such as Nitrospinae, Gemmatimonadetes, Calditrichaeota, and Tenericutes had a significant negative correlation with cluster one variables (total nitrogen, organic matter, EC, and CEC) but positive correlation with cluster two variable (pH and total phosphorous), other bacteria such as Chloroflexi, Spirochaetes, Calditrichaeota, Modulibacteria, Aegiribacteria, Fibrobacteres, Euryarchaeota, Edwardsbacteria, Nanoarchaeaeota, Crenarchaeota, and Diapherotrites had a significant positive correlation with cluster one variables but negative correlation with cluster two variables (Figure 6C). There were other bacteria such as Epsilonbacteraeota, Rokubacteria, Elusimicrobia, and Fusobacteria, although they did not correlate well statistically with environmental variables across the lake, were significantly impacted by local sources. Overall, the hotspots with high absolute abundances of bacteria were the centers of the east and west divisions of the lake (Figures 8C–G,J,M,O), upstream inflow areas of the east and west divisions (Figures 8A–C,F,H,J,K), the southwestern part of the western division (Figures 8H,I,K), along the side of the lake (Figures 8E,I,J,L), and at the outlet of the lake (Figures 8C–E,O). It was clear that microbial information could not only serve as biomarkers to show where the sources of contaminations could be such as in Figures 8A,H,K and but also as indicators of environmental conditions as shown in Figures 8E,H–K across the lake.
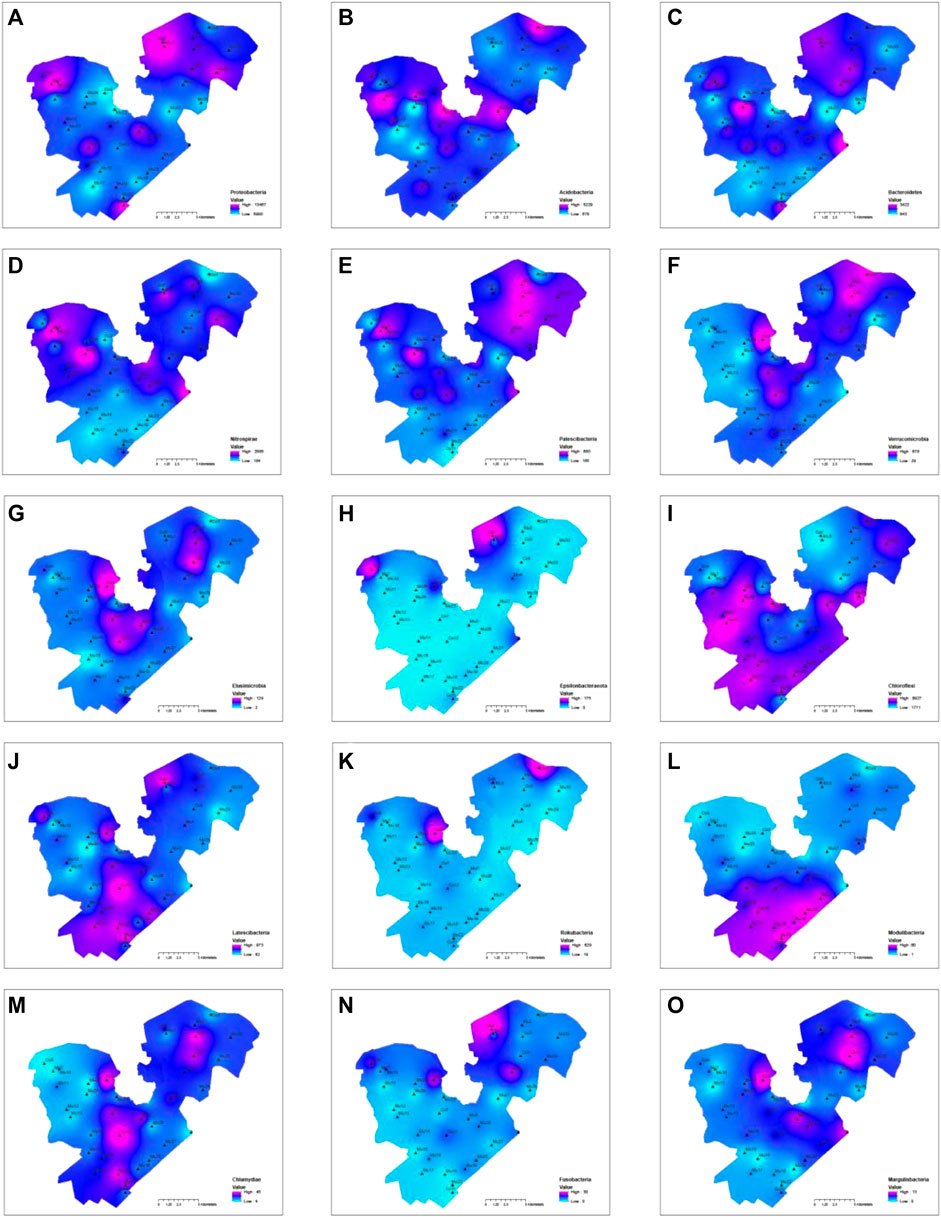
FIGURE 8. Contours of top ten most abundant phyla and five other phyla, in which the absolute abundance was used for the contouring: (A) Proteobacteria, (B) Acidobacteria, (C) Patescibacteria, (D) Bacteroidetes, (E) Nitrospirae, (F) Latescibacteria, (G) Verrucomicrobia, (H) Elusimicrobia, (I) Epsilonbacteraeota, (J) Chloroflexi, (K) Rokubacteria, (L) Modulibacteria, (M) Chlamydiae, (N) Fusobacteria, (O) Margulisbacteria.
Conclusion
The taxonomy analysis showed microbial communities in the lake sediment were more abundant with 15 more phyla, 417 genera, and 1,314 species than in the lake water, however, there were no apparent differences in microbial compositions between the west and east divisions of the lake for either sediment or water on the average. MicroPITA analysis identified samples with maximum diversity located along the side and around the centers of the lake in both divisions, which could coincide with the spatial pattern of fish farming. Samples with the most dissimilarity were mostly located in the northwest part of the west lake division and the north part of the east lake division, which could be due to the impact of inflows from agriculture and industrial pollution in addition to fish farming.
The hierarchical clustering analysis identified two distinctive clusters in each division of the wetland, the PCoA and PLS-DA analyses showed a clear separation of samples in these groupd, and the Kruskal-Wallis H test also showed the mean proportions of major phyla between these two clusters were significantly different. The differentially abundant phyla identified by the LEfSe algorithm in sample groups along the southeast and east side of lake were more related to photosysthesis, but in sample groups around the centers of both lake divisions were more anaerobic bacteria and even pathogenic bacteria. By combining the redundancy analysis (RDA) and the Spearman correlation analysis, and the spatial analysis using GIS technology, how microbial communities in sediment and water correlate with environmental variables were identified. The GIS-based spatial contouring analysis of major environmental variables and microbial showed the advantage in understanding the spatial heterogeneity of microbial communities over the entire wetland area and locating impacted areas of pollution. It is worth noting that in cases where microbial communities were affected by localized sources, microbial such as Epsilonbacteraeota, Rokubacteria, Elusimicrobia, and Fusobacteria, although did not correlate well statistically with environmental variables across the lake could be a good indicator of pollution impact by local sources.
This study showed the comprehensive biodiversity analysis, together with the spatial analysis could serve not only as biomarkers to show the footprints of contaminations but also as indicators of environmental conditions across the lake. Further study will collect more water and sediment sample for hotspots located in this study for their temporal variation and adopt the comprehensive functional gene array (GeoChip) technique to identify functional genes for effective in-situ bioremediation of the sediments.
Data availability statement
The original contributions presented in the study are included in the article/Supplementary Material, further inquiries can be directed to the corresponding author.
Author contributions
YL directed the research, conducted data analysis, and prepared the tables, figures, and manuscript. LZ and HL participated in data analysis and writing, YF, XL, YL, and XX participated in field campaigns for water sample collections and water sample analyses. All authors read the manuscript.
Funding
Funding for this research was provided by the by the National Key Research and Development Programs of China (Grant No. 2021YFC3201100), the Strategic Priority Research Program of the Chinese Academy of Sciences, Grant No. XDB40020100, and by the “Light of West China” Program of the Chinese Academy of Sciences.
Acknowledgments
Great thanks to the managing editor and reviewers for the help.
Conflict of interest
The authors declare that the research was conducted in the absence of any commercial or financial relationships that could be construed as a potential conflict of interest.
Publisher’s note
All claims expressed in this article are solely those of the authors and do not necessarily represent those of their affiliated organizations, or those of the publisher, the editors and the reviewers. Any product that may be evaluated in this article, or claim that may be made by its manufacturer, is not guaranteed or endorsed by the publisher.
Supplementary material
The Supplementary Material for this article can be found online at: https://www.frontiersin.org/articles/10.3389/fenvs.2022.1000437/full#supplementary-material
References
Arumugam, M., Raes, J., Pelletier, E., Le Paslier, D., Yamada, T., Mende, D. R., et al. (2011). Enterotypes of the human gut microbiome. Nature 473, 174–180. doi:10.1038/nature09944
Ban, X., Wu, Q., Pan, B., Du, Y., and Feng, Q. (2014). Application of composite water quality identification index on the water quality evaluation in spatial and temporal variations: a case study in Honghu Lake, China. Environ. Monit. Assess. 186 (7), 4237–4247. doi:10.1007/s10661-014-3694-9
Caliński, T., and Harabasz, J. (1974). A dendrite method for cluster analysis. Comm. Stats. - Theory &. Methods 3 (1), 1–27. doi:10.1080/03610927408827101
Chen, S., Wang, S., Yu, Y., Dong, M., and Li, Y. (2021). Temporal trends and source apportionment of water pollution in Honghu Lake, China. Environ. Sci. Pollut. Res. 28, 60130–60144. doi:10.1007/s11356-021-14828-z
Cremona, F., Koiv, T., Kisand, V., Laas, A., Zingel, P., Agasild, H., et al. (2014). From bacteria to piscivorous fish: estimates of whole-lake and component-specific metabolism with an ecosystem approach. PLoS One 9 (7), e101845. doi:10.1371/journal.pone.0101845
Dang, S. T., Petersen, A., Van Truong, D., Chu, H. T., and Dalsgaard, A. (2011). Impact of medicated feed on the development of antimicrobial resistance in bacteria at integrated pig-fish farms in Vietnam. Appl. Environ. Microbiol. 77 (13), 4494–4498. doi:10.1128/aem.02975-10
Edgar, R. C. (2013). UPARSE: Highly accurate OTU sequences from microbial amplicon reads. Nat. Methods 10, 996. doi:10.1038/nmeth.2604
Gauch, H. G., and Singer, S. B. (1982). A program for editing of community data matrices. Vegetatio 49 (3), 187–190. doi:10.1007/bf00123843
Goyal, V. C., Singh, O., Singh, R., Chhoden, K., and Malyan, S. K. (2022). Appraisal of heavy metal pollution in the water resources of Western Uttar Pradesh, India and associated risks. Environ. Adv. 8, 100230. doi:10.1016/j.envadv.2022.100230
Han, M., Dsouza, M., Zhou, C., Li, H., Zhang, J., Chen, C., et al. (2019). Agricultural risk factors influence microbial ecology in Honghu Lake. Genomics Proteomics Bioinforma. 17 (1), 76–90. doi:10.1016/j.gpb.2018.04.008
Harnisz, M., Korzeniewska, E., and Golas, I. (2015). The impact of a freshwater fish farm on the community of tetracycline-resistant bacteria and the structure of tetracycline resistance genes in river water. Chemosphere 128, 134–141. doi:10.1016/j.chemosphere.2015.01.035
Homklin, S., Wattanodorn, T., Ong, S. K., and Limpiyakorn, T. (2009). Biodegradation of 17α-methyltestosterone and isolation of MT-degrading bacterium from sediment of Nile tilapia masculinization pond. Water Sci. Technol. 59 (2), 261–265. doi:10.2166/wst.2009.868
Ivanova, A. O., and Dedysh, S. N. (2012). Abundance, diversity, and depth distribution of planctomycetes in acidic northern wetlands. Front. Microbiol. 3, 5. doi:10.3389/fmicb.2012.00005
Li, F., Qiu, Z., Zhang, J., Liu, C., Cai, Y., and Xiao, M. (2017). Spatial distribution and fuzzy health risk assessment of trace elements in surface water from Honghu Lake. Int. J. Environ. Res. Public Health 14 (9), 1011. doi:10.3390/ijerph14091011
Li, F., Xiao, M., Zhang, J., Liu, C., Qiu, Z., and Cai, Y. (2018). Spatial distribution, chemical fraction and fuzzy comprehensive risk assessment of heavy metals in surface sediments from the Honghu Lake, China. Int. J. Environ. Res. Public Health 15 (2), 207. doi:10.3390/ijerph15020207
Liu, Z., Iqbal, M., Zeng, Z., Lian, Y., Zheng, A., Zhao, M., et al. (2020). Comparative analysis of microbial community structure in the ponds with different aquaculture model and fish by high-throughput sequencing. Microb. Pathog. 142, 104101–104104. doi:10.1016/j.micpath.2020.104101
Malyan, S. K., Singh, O., Kumar, A., Anand, G., Singh, R., Singh, S., et al. (2022). Greenhouse gases trade-off from ponds: An overview of emission process and their driving factors. Water 14, 970. doi:10.3390/w14060970
Schubert, C. J., Vazquez, F., Losekann-Behrens, T., Knittel, K., Tonolla, M., and Boetius, A. (2011). Evidence for anaerobic oxidation of methane in sediments of a freshwater system (Lago di Cadagno). FEMS Microbiol. Ecol. 76 (1), 26–38. doi:10.1111/j.1574-6941.2010.01036.x
Segata, N., Izard, J., Waldron, L., Gevers, D., Miropolsky, L., Garrett, W. S., et al. (2011). Metagenomic biomarker discovery and explanation. Genome Biol. 12 (6), R60. doi:10.1186/gb-2011-12-6-r60
Stange, C., Yin, D., Xu, T., Guo, X., Schafer, C., and Tiehm, A. (2019). Distribution of clinically relevant antibiotic resistance genes in Lake Tai, China. Sci. Total Environ. 655, 337–346. doi:10.1016/j.scitotenv.2018.11.211
Tickle, T., Segata, N., Waldron, L., Weingart, U., and Huttenhower, C. (2013). Two-stage microbial community experimental design. ISME J. 7, 2330–2339. doi:10.1038/ismej.2013.139
Wang, Z., Du, Y., Yang, C., Liu, X., Zhang, J., Li, E., et al. (2017). Occurrence and ecological hazard assessment of selected antibiotics in the surface waters in and around Lake Honghu, China. Sci. Total Environ. 609, 1423–1432. doi:10.1016/j.scitotenv.2017.08.009
Wang, Z., Han, M., Li, E., Liu, X., Wei, H., Yang, C., et al. (2020). Distribution of antibiotic resistance genes in an agriculturally disturbed lake in China: Their links with microbial communities, antibiotics, and water quality. J. Hazard. Mat. 393, 122426. doi:10.1016/j.jhazmat.2020.122426
Watson, D. F., and Philip, G. M. (1985). A refinement of inverse distance weighted interpolation. Geoprocessing 2, 315–327.
Whittaker, R. H. (1972). Evolution and measurement of species diversity. Taxon 21, 213–251. doi:10.2307/1218190
Whittaker, R. H. (1960). Vegetation of the siskiyou mountains, Oregon and California. Ecol. Monogr. 30, 279–338. doi:10.2307/1943563
Wu, H., Hao, B., Cai, Y., Liu, G., and Xing, W. (2021). Effects of submerged vegetation on sediment nitrogen-cycling bacterial communities in Honghu Lake (China). Sci. Total Environ. 755, 142541. doi:10.1016/j.scitotenv.2020.142541
Xu, M., Zhang, Q., Xia, C., Zhong, Y., Sun, G., Guo, J., et al. (2014). Elevated nitrate enriches microbial functional genes for potential bioremediation of complexly contaminated sediments. ISME J. 8 (9), 1932–1944. doi:10.1038/ismej.2014.42
Yang, Y., Cao, X., Lin, H., and Wang, J. (2016). Antibiotics and antibiotic resistance genes in sediment of Honghu Lake and east dongting lake, China. Microb. Ecol. 72 (4), 791–801. doi:10.1007/s00248-016-0814-9
Yao, L., Chen, C., Liu, G., and Liu, W. (2018). Sediment nitrogen cycling rates and microbial abundance along a submerged vegetation gradient in a eutrophic lake. Sci. Total Environ. 616-617, 899–907. doi:10.1016/j.scitotenv.2017.10.230
Zhang, J., Zhu, L., Li, F., Liu, C., Qiu, Z., Xiao, M., et al. (2018). Comparison of toxic metal distribution characteristics and health risk between cultured and wild fish captured from Honghu city, China. Int. J. Environ. Res. Public Health 15 (2), 334. doi:10.3390/ijerph15020334
Zhang, L., and Sun, X. (2017). Addition of fish pond sediment and rock phosphate enhances the composting of green waste. Bioresour. Technol. 233, 116–126. doi:10.1016/j.biortech.2017.02.073
Keywords: lake sediment, microbial biomarkers, LEfSe algorithm, heterogeneity of microbial communities, fish farming, Honghu wetland
Citation: Lian Y, Zhen L, Fang Y, Li H, Li X, Li Y and Xu X (2022) Microbial biomarkers to identify areas of wetland sediments affected by massive fish farming. Front. Environ. Sci. 10:1000437. doi: 10.3389/fenvs.2022.1000437
Received: 22 July 2022; Accepted: 08 August 2022;
Published: 19 October 2022.
Edited by:
Amit Kumar, Nanjing University of Information Science and Technology, ChinaReviewed by:
Sandeep K. Malyan, National Institute of Hydrology, IndiaChangsen Zhao, Beijing Normal University, China
Xiaoxu Jia, Institute of Geographic Sciences and Natural Resources Research (CAS), China
Copyright © 2022 Lian, Zhen, Fang, Li, Li, Li and Xu. This is an open-access article distributed under the terms of the Creative Commons Attribution License (CC BY). The use, distribution or reproduction in other forums is permitted, provided the original author(s) and the copyright owner(s) are credited and that the original publication in this journal is cited, in accordance with accepted academic practice. No use, distribution or reproduction is permitted which does not comply with these terms.
*Correspondence: Yanqing Lian, eWxpYW5AaWxsaW5vaXMuZWR1
†These authors share first authorship