 Yanqing An1
 Jianzhong Xu
 Huabiao Zhao
 Shichang Kang
- 1State Key Laboratory of Cryospheric Science, Northwest Institute of Eco-Environment Resources, Chinese Academy of Sciences, Lanzhou, China
- 2Ngari Station for Desert Environment Observation and Research, Institute of Tibetan Plateau Research, Chinese Academy of Sciences, Beijing, China
Atmospheric nitrogen deposition is an important contributor to global and regional nitrogen cycles, and atmospheric nitrogen could be a critical limit nutrient for remote areas. In this study, nitrogen species compositions, deposition fluxes, and historical records in the mountains of Western China, including the Tibetan Plateau, were determined from snowpit and ice core samples collected from mountain glaciers. The mean concentration of total dissolved nitrogen (TDN) in the snowpit samples was 12.6 μmol L−1 (8.0–17.8 μmol L−1) and comprised 59% ammonium nitrogen, 35% nitrate nitrogen, and ∼6% dissolved organic nitrogen. The deposition of nitrogen species, except organic nitrogen (likely due to its low concentrations and/or different origination), varied seasonally in a similar way based on the records of the snowpit profile. Based on monthly surface sample collection in one of the glaciers, the mass concentration and composition of nitrogen species varied monthly, mainly because of melting processes. During melting, the inorganic nitrogen content could be lost significantly, whereas the dissolved organic nitrogen concentration could be enriched because of microbial activity. For the historical records, the nitrogen deposition in mountain areas of Western China after 1960s was increased by about one time of that during 1900–1950 and was dominated by ammonium-N. From the snowpit data, we estimated the total dissolved nitrogen deposition flux at 0.56–1.3 (mean 0.88) kg ha−1 a−1 in the mountain area of Western China. These results could improve our understanding of nitrogen deposition and cycle in the mountain areas of Western China.
Introduction
Nitrogen is an essential nutrient in terrestrial and aquatic ecosystems, and its cycle is a critical and dynamic component of biogeochemical processes. Anthropogenic activities have rather altered the nitrogen cycle by increasing reactive nitrogen emissions involving reduced NHx and oxidized NOy species via combustion of fossil fuels, production of nitrogen fertilizers, and other actions (Vitousek et al., 1997). Atmospheric nitrogen deposition has correspondingly increased during the last 100 years (Holtgrieve et al., 2011). For example, the total deposition flux of nitrogen in China increased by 40% from the 1980s to 2000s based on observation from a monitoring network (Liu et al., 2013; Yu et al., 2019). Enhanced nitrogen deposition on Earth’s surface could lead to positive or negative feedback on ecosystems and humans. Previous studies focusing on the ecosystem effect of deposition of nitrogen in China have been mainly conducted at forests, grasslands, croplands, and aquatic and coastal areas (Liu et al., 2011; Zhan et al., 2015), whereas there was less focus on remote areas such as arid and semi-arid regions in Western China due to limited monitoring data.
Although nationwide monitoring sites of nitrogen deposition in China have been established since the 1990s due to the high nitrogen deposition rate in the world, sporadic sites are located in Western China due to the small population and harsh natural conditions (Jia et al., 2014; Liu et al., 2015; Jia et al., 2016), where the land area accounts for about half of China (Zhu et al., 2015). Due to the wide distribution of arid and semi-arid regions with a fragile ecosystem in Western China, the sporadic monitoring sites have limited the understanding of the effect of atmospheric nitrogen deposition in Western China on ecosystems. Snow and ice deposited on high-elevation mountains in this region is an important alternative way for instrumental measurements of atmospheric particle deposition due to its high fidelity (Thompson, 2000). Historical records on the environment and climate via ice cores have been reconstructed widely during the past decades (Thompson et al., 2005 and reference therein), but there was less focus on nitrogen deposition (Kang et al., 2002; Hou et al., 2003; Zhao et al., 2011; Geng et al., 2015; Wendl et al., 2015).
With regard to chemical composition, deposited nitrogen is mainly present as inorganic nitrogen (IN) and organic nitrogen (ON). IN compounds include ammonium, nitrate, nitrite, nitric acid, and nitrous acid, and ammonium and nitrate are the dominant components (Heald et al., 2012). ON is a complex mixture that includes amino acids, nitrogen heterocycles, nitro-aromatics, urea, and oxidized compounds (Neff et al., 2002). Generally, IN dominates total nitrogen (TN = ON + IN), with ON being a relatively small contribution (5–20%) (Cape et al., 2011). Hu et al. (2014) reconstructed the TN deposition history in the southeastern Tibetan Plateau (TP) of Western China through two lake sediment cores and found unambiguous increasing nitrogen deposition since the late 19th to early 20th century. Liu et al. (2015) estimated the deposition rate of IN through precipitation samples from four sites in the TP and found that model results had been overestimated for this region. However, these two studies did not include the information on the chemical composition of nitrogen or focused only on IN. In addition, the spatial distribution of nitrogen deposition in Western China is little understood due to limited sampling sites in previous studies.
The key purposes of this study were 1) to determine the chemical compositions of the nitrogen species in snow and ice in Western China, 2) to estimate the atmospheric deposition rate of nitrogen in remote regions of Western China, and 3) to evaluate the historic variations of nitrogen deposition in this region.
Experimental procedures
Sites and sampling
Snowpit samples were collected from four widely distributed glaciers in Western China (Figure 1), namely, Musidao Glacier (MSD; 3605 m a.s.l), Muztagata Glacier (MSTG; 6365 m a.s.l), Laohugou No. 12 Glacier (LHG; 5026 m a.s.l), and Zadang Glacier (ZD; 5758 m a.s.l). The samples were collected from the accumulation zones of MSD, MSTG, LHG, and ZD during several field campaigns between 2008 and 2010 and were at a 5–10-cm resolution in the vertical direction. The details on the collection of the samples and the climates of the glaciers were described previously by Xu et al. (2012) and Yu et al. (2013). Briefly, the four glaciers are in different climate regions and are influenced by different regional air masses. For example, the MSD sampling site was located more northerly than the other sites, in an area controlled by the Asian winter monsoon during the winter and by air masses from Central Asia during other seasons. The ZD site was in the central TP, in an area influenced by air masses from South Asia. Apart from snowpit samples, surface snow/ice samples were collected in the Dongkemadi Glacier (DKMD; 5700 m a.s.l) from May to October 2015 (Liu et al., 2016). The samples were collected along the mainstream of the glacier once each month, with about 30 samples being collected each time (Figure 1). All the samples were collected following standard snow and ice collection procedures aimed at avoiding contamination of the samples, such as personnel wearing non-particulating clean suits, masks, and gloves. The samples were stored in the dark and at −18°C until analysis.
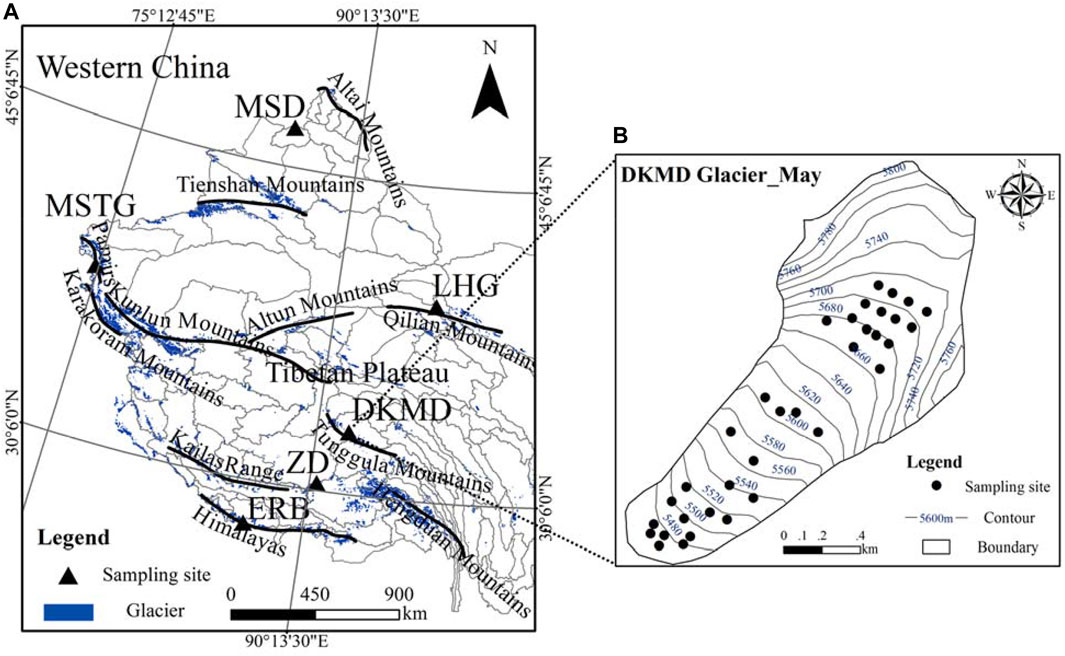
FIGURE 1. Map showing the location of sampling sites on the glaciers in Western China in this study (A) and the sampling strategy following the contour line on Dongkemadi Glacier (DKMD) in each month from May to October 2015 (B). The glaciers of snow sampling including Musidao Glacier (MSD), Muztagata Glacier (MSTG), Laohugou No. 12 Glacier (LHG), DKMD, Zadang Glacier (ZD), and East Rongbuk Glacier (ERB) are shown. The map also shows glaciers and mountains in Western China, and the glacier data were adopted from the Second Chinese Glacier Inventory (Guo et al., 2015).
Sample preparation and analysis
Snow/ice samples were melted at room temperature in a laminar flow hood to reduce contamination when they arrived at the laboratory. Once melted, the samples were then passed through 0.45-µm Acrodisc syringe filter (Pall Life Sciences, Ann Arbor, MI, United States) to remove water-insoluble particles. Two aliquots of each filtered sample were prepared in clean bottles, one for IN analysis and the other for total dissolved nitrogen (TDN) analysis.
TDN analysis
The TDN concentrations in the samples were determined using a Vario EL CN analyzer (Elementar, Hanau, Germany). The sample was firstly introduced in the instrument by an auto-sampler system, and the nitrogen-containing species were decomposed to NO in the combustion tube at 850°C in a carrier O2 gas, and then the sample was cooled and dehumidified using an electronic dehumidifier, and the NO was measured using a chemiluminescence gas analyzer. The system was calibrated using ammonium chloride and sodium nitrate standards for TDN determination. The detection limit of the instrument was 0.3 μmol/L TDN. Accuracy was determined using the same reference standards as 5%.
IN analysis
The concentrations of ammonium, nitrate, nitrite, and calcium used in this study in the samples were determined using two 881 Compact IC Pro ion chromatography (IC) systems (Metrohm, Herisau, Switzerland). One IC system was used to determine the cations and was equipped with a Metrosep C4 guard/2.0 column and a Metrosep C4 250/2.0 column (Metrohm), which were kept at 30°C during the measurements. The other IC system was used to determine the anions and was equipped with a Metrosep RP2 guard/3.6 column and a Metrosep A Supp15 250/4.0 column (Metrohm), which were kept at 45°C during the measurements. The mobile phase for the cation IC system was 1.75 mM nitric acid (made from 70% nitric acid; Sigma-Aldrich, St. Louis, MO, United States) and 0.75 mM dipicolinic acid (made from ≥99.5% pure dipicolinic acid; Sigma-Aldrich), and the flow rate was 0.3 ml min−1. The mobile phase for the anion IC system was 5 mM sodium carbonate and 0.3 mM sodium hydroxide (made from ≥98% pure sodium hydroxide; Sigma-Aldrich), and the flow rate was 0.8 ml min−1. The instruments were calibrated using standard cation and anion solutions (Dionex, Sunnyvale, CA, United States). The results of the IC analyses were evaluated in terms of the reproducibility of the peak retention times, the peak heights, and the linearity of each calibration curve. The relative standard deviations of the reproducibility for each ion were less than 5%. Based on the measurement of IN and TDN, the dissolved ON (DON) was determined by subtracting the inorganic nitrogen content, i.e., ammonium, nitrate, and nitrite (DON = TDN—IN), from the TDN content.
Results and discussions
Spatial and seasonal variations of the TDN mass concentration and chemical compositions
The mean TDN concentrations in the four snowpit samples ranged 8.0–17.8 μmol L−1 with higher values in the MSD and MSTG snowpit samples (∼17 μmol L−1) and lower values in the LHG and ZD snowpit samples (∼8 μmol L−1) (Figure 2). The high values are comparable with those in previous studies from mountain glaciers in Central Asia (∼15.5 μmol L−1) (Olivier et al., 2003; Kreutz et al., 2017) (Table 1). However, the TDN concentrations in our snowpit samples were lower than concentrations found in precipitation samples collected in the TP (∼20–30 μmol L−1) (Liu et al., 2015) and rural/urban sites in Eastern China (100–1000 μmol L−1) (Liu et al., 2013), likely due to their higher elevations and being far away from residential areas. Compared with snow/ice samples in other regions around the world, the TDN concentration in our study is significantly higher than the modern snow/ice in the polar region (1—4 μmol L−1, Legrand and Mayewski, 1997; Wendl et al., 2015 and references therein), and the values at LHG and ZD are comparable with those at mountain glaciers in South America (4—7 μmol L−1) (Thompson et al., 2013) and European Alps (5—9 μmol L−1) (Schwikowski et al., 1999; Eichler, 2000; Preunkert et al., 2003) (Table 1). Seasonal variations of the nitrogen species in the different snowpits are shown in Figure 2. The ammonium and nitrate concentrations varied seasonally in similar ways and were consistent with that of mineral dust (Ca2+) (Figure 2), but the seasonal variations in the DON concentrations did not follow any patterns, likely due to the low concentrations and/or potential different sources. The consistent trend between nitrogen and mineral dust suggests that these chemicals were transported and deposited in similar ways. However, the TDN concentrations were not proportional to the calcium concentrations. For example, the calcium concentrations were higher in the LHG snowpit samples, but the TDN concentrations in the LHG snowpit samples were at the bottom of the range of TDN concentrations in all the snowpit samples, suggesting that the sources of nitrogen and mineral dust were not the same.
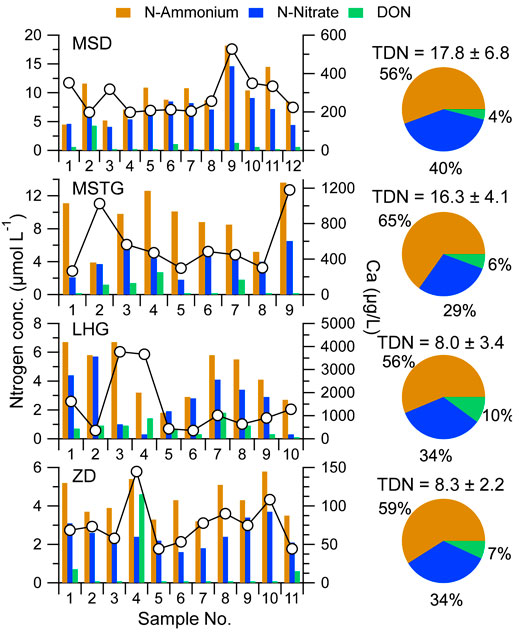
FIGURE 2. Profiles (bar charts) and mean compositions (pie charts) of the nitrogen species (N_Ammonium, N_Nitrate, and dissolved organic nitrogen (DON)) in each snowpit sample. The calcium (Ca2+) concentrations in the snowpit samples are also shown for comparison (as open circles) following the sample number from the surface to the bottom of the snowpit. The average mass concentration of total dissolved nitrogen (TDN) in each snowpit is also shown.
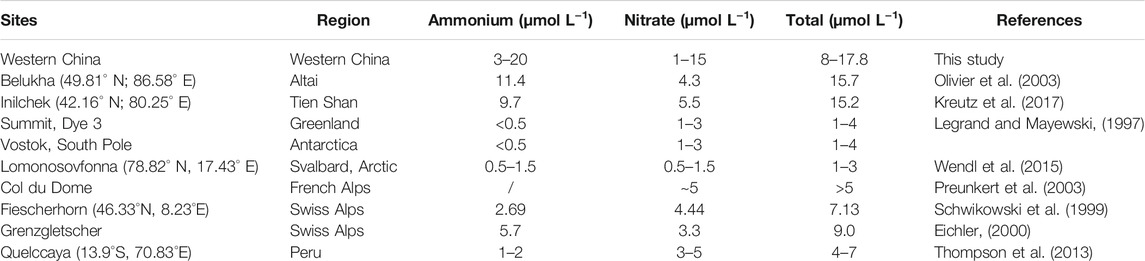
TABLE 1. Nitrogen concentration archived from modern snow/ice records around the world.
The dominant component of TDN was dissolved IN (contributing 90–95% of the mass concentration of TDN), with the mean contributions of ammonium nitrogen (N-ammonium) and nitrate nitrogen (N-nitrate) being 59 and 35%, respectively (Figure 2). The snow samples from the MSTG had the highest N-ammonium contribution (65%) and the lowest N-nitrate contribution (29%), and the N-ammonium and N-nitrate contributions in the samples from the other three glaciers were comparable (56–59% for N-ammonium and 34–40% for N-nitrate). The DON concentrations in the snow and ice samples were in the range of 0.5–1 μmol L−1 (4–10% of TDN), and they were below the detection limit for about half of the samples. The DON concentrations in the samples were several orders of magnitude lower than concentrations seen in fog water (Zhang et al., 2001) and ambient aerosol (Cape et al., 2011) in urban areas, which could be formed in clouds and aerosol water at biomass burning influenced regions or high nitrogen oxide (NOx) influenced regions (Mazzoleni et al., 2010; Lee et al., 2016).
The source of the ammonium could have been from the intensive agricultural activities near the mountains and South Asia (Clarisse et al., 2009). Nitrate is formed through the oxidation of NOx and reactions of the products with ammonium and other atmospheric components, such as mineral dust (Xu et al., 2014). NOx has relatively short lifetimes in the atmosphere (1—2 days) compared with the lifetime of sulfur dioxide (SO2), so ammonia is typically neutralized by sulfuric acid to give sulfates during long-range transport. This explains why ammonium contributed more than nitrate to the TDN concentrations in the snow samples. The large N-ammonium contributions to the TDN concentrations in the MSTG samples could have been caused by large amounts of sulfate being supplied by aerosol sources in Central Asia.
Influences of melting processing on the nitrogen species distributions
It would be important to understand the dynamic variation of nitrogen species during glacier melting because of the potential biogeochemical effects of melted glacier water on downstream ecosystems (Saros et al., 2010). We assessed the variations in the nitrogen species concentrations through the surface samples collected from the DKMD between May and October 2015. The TDN concentrations in May were higher than those in June and July (Figure 3A and Table 2), when surface melting was observed and the low TDN concentrations were likely caused by the leaching process. The DON concentration contributed 1% of the TDN concentration in May, but 18% in August and October (Figure 3B), suggesting that DON was produced as the glacier surface melted. Microbial activity has been found to increase during the ablation season on the TP glaciers (Takeuchi and Li, 2008), and microbial activities could produce DON (Feng et al., 2016; Wadham et al., 2016).
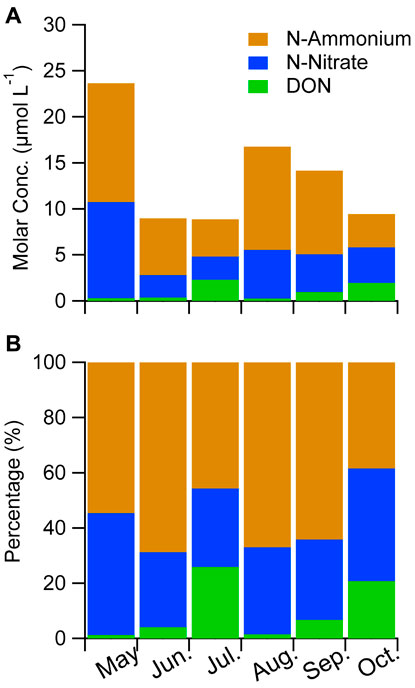
FIGURE 3. (A) Monthly mean total dissolved nitrogen concentrations (µmol L−1) and (B) molar contribution of different nitrogen species in the samples collected from the DKMD Glacier. The samples were collected from May to October in 2015 one time each month along the mainstream of the glacier.
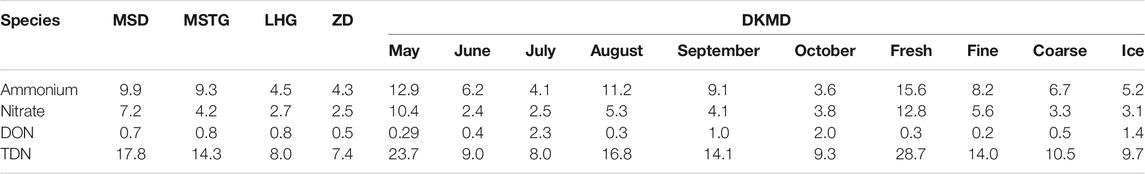
TABLE 2. The molar concentration (μmol L−1) of nitrogen species in different sites in this study.
We determined the nitrogen species concentrations in different types of snow and ice samples from the DKMD. The types of snow and ice were fresh snow, fine firn, coarse firn, and glacier ice, which represent different stages during the glacier surface melting. As shown in Figure 4A, the TDN concentration clearly decreased from fresh snow to glacier ice with a decrease by nearly a factor of 3 (28.7 ± 10.8 to 9.8 ± 4.1 μmol L−1, Table 2), suggesting that nitrogen species were lost during melting. The contributions of the species to the TDN concentrations were different for different sample categories (Figure 4B). For example, the nitrate contribution decreased significantly during melting, but the ammonium contribution changed less than the nitrate contribution. Most importantly, the DON contribution increased from 1 to 14% during melting. This is important evidence for the formation of dissolved organic matter by microbes on glaciers. This is supported by the increased dissolved organic carbon content in the same snow samples (Feng et al., 2020).
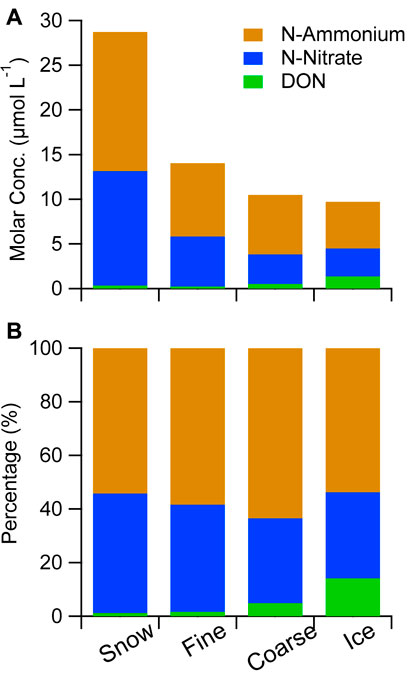
FIGURE 4. (A) Monthly mean total dissolved nitrogen concentrations (µmol L−1) and (B) molar contribution of different nitrogen species in different categories of samples collected from the DKMD Glacier as shown in Figure 3.
Historical records of nitrogen deposition in Western China
To get insight into the historical records of nitrogen deposition, two published ice core datasets are collected in this study (Hou et al., 2003; Zhao et al., 2011), which did not focus on the nitrogen deposition. These two ice cores were drilled from two typical glaciers located in the southern and northwestern edges of the TP, respectively (Figure 1). The southern ice core drilled at East Rongbuk Glacier (ERB) in 1998 covered 1843 to 1997 AD, while it was 1907–2002 AD for the northwestern ice core drilled at MSTG in 2003. The details of the dating and chemical analysis of each ice core can be found in previous publications (Kang et al., 2002; Hou et al., 2003; Zhao et al., 2011). The nitrogen deposition in each ice cores is obtained from the measurement of water-soluble ions of nitrate and ammonium. The chronological profiles of nitrogen (ammonium + nitrate) show an evidently increased trend after 1960 as like the other chemical components in these two ice cores presented in the previous papers. The total concentrations of IN before 1960s were 39.2 ± 11.3 μmol L−1 and 10.0 ± 1.1 μmol L−1 for ERB and MSTG, but these increased to 56.7 ± 11.0 μmol L−1 and 15.2 ± 4.6 μmol L−1 after that, respectively. The increase rates between these two periods were all about 1.5 times in these two sites. This increased trend was also observed for other ice cores inland of the TP, i.e., Tanggula ice core (Zheng et al., 2010), Qiangtang ice core (Wang et al., 2019), and Zangser Kangri ice core (Zou et al., 2020), but with a relatively weakly increased amplitude. All these increased trends could be attributed to the contribution of ammonium as illustrated from the dominant molar ratios of ammonium versus the total nitrogen (Figure 5) (Zou et al., 2020). The ratio of
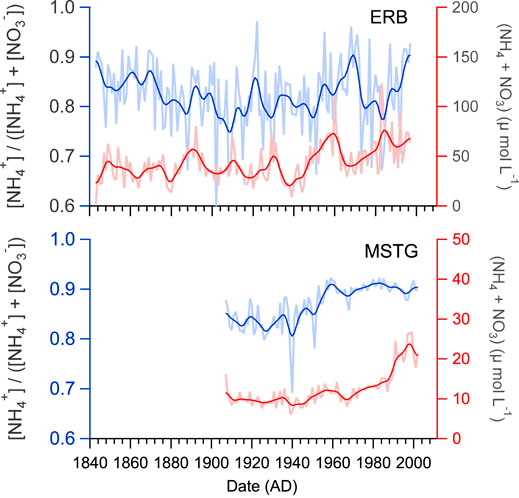
FIGURE 5. The profiles of [NH4+]/([NH4+] + [NO3−]) and (NH4+ + NO3−) in ERB and MSTG ice cores (Hou et al., 2003; Zhao et al., 2011). The light lines are original data, and the dark lines are 7-point Gaussian smoothing of the original data.
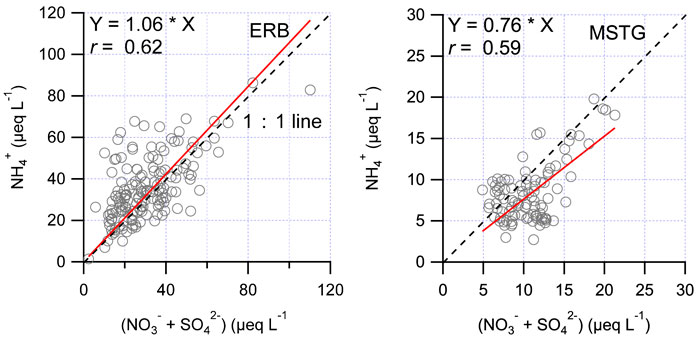
FIGURE 6. Scatter plots with best-fitting linear regression between NH4+ and (NO3− + SO42-) in equivalent concentration (µeq L−1) for ERB and MSTG. The fitting equation and Pearson’s correlation coefficient are also shown. The dashed line represents the 1:1 line.
Implications and limitations
Nitrogen compounds play crucial roles in biogeochemical cycles, especially in the sensitive ecological environments of arid and cold regions, so it is important to understand annual nitrogen deposition fluxes. In situ data for nitrogen species in pristine regions are scarce, so nitrogen deposition fluxes are commonly estimated using multiple atmospheric chemistry transport models or satellite observations (Lü and Tian, 2007; Nowlan et al., 2014), which have a large uncertainty. The snowpit samples in our study approximately represent a whole year (Xu et al., 2016), and we therefore calculated the nitrogen deposition fluxes using the equation below:
where
The mean TDN concentration in the samples from the four snowpits was 176.4 μg L−1, and the mean amount of snow/ice accumulated was about 500 mm water equivalent based on the snowpit depth and the density. We estimated the TDN deposition rates to be 0.56–1.3 kg N ha−1 a−1, with a mean value of 0.88 kg ha−1 a−1. The mean value in our study was lower than the rate of 1.58 kg N ha−1 a−1 estimated by Liu et al. (2015) using precipitation samples from five sites in the TP that are at lower elevations and a shorter distance from city centers, and more than five times lower than the modeled rate (4–7 kg N ha−1 a−1) in this region (Yu et al., 2019). For comparison, a deposition rate of 13.32 kg N ha−1 a−1 was found in Eastern China between 2005 and 2014 with 30–50% from dry deposition (Jia et al., 2016). However, this deposition in our study is close to the nitrogen deposition (0.5–0.8 kg ha−1 a−1) estimated using the same method in European Alps (Hiltbrunner et al., 2005). Assuming the same accumulation rate of snow before and after 1960s in the TP (Yao et al., 2008), the nitrogen deposition has increased by a factor of 2 since the 1960s, which is consistent with the increased anthropogenic emission.
The high nitrogen deposition flux coupled with a high glacier melting rate in High Asia due to global warming means a high exporting rate of nitrogen to downstream environments. We roughly estimated the amount of TDN exported using the TDN concentration in the snow samples (176.4 μg L−1) and the melting rate for glaciers in the high mountains of Asia (−30.6 ± 5.0 Gt N a˗−1) (Yi and Sun, 2014). The TDN release rate for glaciers in the high mountains of Asia was found to be ∼5.4 ± 0.9 Gg N a−1. For comparison, the estimated TDN flux from the Greenland Ice Sheet was 11–137 Gg N for 2012 summer (Wadham et al., 2016). Referring to the deposition flux, the release rate must have increased markedly since the 1950s. TDN release in the mountain glaciers could be an important aspect of local and regional nitrogen budgets in the future due to the accelerated glacier melting.
It is worth noting that the nitrogen deposition in this study cannot distinguish the contribution from wet or dry deposition. The results in snow/ice may include mostly wet deposition and part of dry deposition. Dry deposition could include particle and gaseous phase species. Yu et al. (2019) found an approximately equal deposition rate between dry and wet deposition during 2011–2015 in China, and the dry deposition was dominated by gaseous species (70%). This result suggests that the estimation of nitrogen deposition in our study is probably a lower limit of nitrogen deposition in this region. Furthermore, the methods from different studies give variable uncertainties in nitrogen species measurements. For example, the TDN recovery rate for high-temperature combustion technique is <95% (Watanabe et al., 2007), although the combustion temperature of the instrument we used (850°C) was higher than the combustion temperatures of many other instruments (normally 720°C). The recovery rates for most of the ON compounds were >90% except for some less volatile compounds. In addition, some types of ON can suffer significant losses (of 20–40%) when samples are stored for a long time because some ON species are unstable (Zhang et al., 2001). Therefore, measuring the DON concentration by subtracting the IN concentration from the TDN concentration probably therefore underestimates the DON concentration. Lastly, the estimation of the deposition rate and release rate of nitrogen is very approximate due to limited snow/ice samples.
Conclusion
The chemical composition and deposition of TDN in mountainous areas of Western China were analyzed using snowpit and surface snow/ice samples. The mean TDN mass concentration in the four snowpit samples was 12.6 μmol L−1, and the TDN comprised 59% ammonium nitrogen, 35% nitrate nitrogen, and ∼6% DON. The IN species concentrations varied seasonally in similar ways, and the variations were generally consistent with variations in the calcium concentrations. However, the IN species and calcium mass concentrations were not closely related, suggesting that they had different origins. The TDN mass concentrations in the surface snow/ice samples on the DKMD were significantly different in different months, i.e., higher concentrations being found in cold months and lower concentrations being found in warm months, suggesting that nitrogen species were lost during the melting of glacier. An interesting point to note was that the DON concentration increased during melting, suggesting in situ ON production because of microbial activity. From the accumulation in the snowpits, we estimated the mean TDN deposition flux in mountainous areas of Western China to be 0.88 kg ha−1 a−1 on average, which was markedly higher than the flux estimated for the 1960s. Glaciers have recently been melting rapidly, so the release of nitrogen nutrients from glaciers could have important biogeochemical effects on terrestrial and aquatic environments downstream.
Data Availability Statement
The original contributions presented in the study are included in the article/Supplementary Material; further inquiries can be directed to the corresponding author.
Author Contributions
YA and JX wrote the manuscript, YL and XL collected samples and analyzed the samples, HZ shared the ice core data, and SK designed the field campaign.
Funding
This research was supported by grants from the National Natural Science Foundation of China (41771079), the Strategic Priority Research Program of Chinese Academy of Sciences, Pan-Third Pole Environment Study for a Green Silk Road (Pan-TPE) (XDA20040501), and the Key Laboratory of Cryospheric Sciences Scientific Research Foundation (SKLCS-ZZ-2021-01).
Conflict of Interest
The authors declare that the research was conducted in the absence of any commercial or financial relationships that could be construed as a potential conflict of interest.
The handling Editor declared a past co-authorship with one of the authors SK.
Publisher’s Note
All claims expressed in this article are solely those of the authors and do not necessarily represent those of their affiliated organizations, or those of the publisher, the editors and the reviewers. Any product that may be evaluated in this article, or claim that may be made by its manufacturer, is not guaranteed or endorsed by the publisher.
References
Cape, J. N., Cornell, S. E., Jickells, T. D., and Nemitz, E. (2011). Organic Nitrogen in the Atmosphere - Where Does it Come from? A Review of Sources and Methods. Atmos. Res. 102 (1–2), 30–48. doi:10.1016/j.atmosres.2011.07.009
Clarisse, L., Clerbaux, C., Dentener, F., Hurtmans, D., and Coheur, P.-F. (2009). Global Ammonia Distribution Derived from Infrared Satellite Observations. Nat. Geosci 2 (7), 479–483. doi:10.1038/ngeo551
Eichler, A. (2000). Deposition von Spurenstoffen in Firn und Eis alpiner Gletscher, Untersuchung von Nord-Süd-Gradienten. Ph.D. thesis. Bern: Univ. ät Bern.
Feng, L., An, Y., Xu, J., Li, X., Jiang, B., and Liao, Y. (2020). Biochemical Evolution of Dissolved Organic Matter during Snow Metamorphism across the Ablation Season for a Glacier on the central Tibetan Plateau. Sci. Rep. 10, 6123. doi:10.1038/s41598-020-62851-w
Feng, L., Xu, J., Kang, S., Li, X., Li, Y., Jiang, B., et al. (2016). Chemical Composition of Microbe-Derived Dissolved Organic Matter in Cryoconite in Tibetan Plateau Glaciers: Insights from Fourier Transform Ion Cyclotron Resonance Mass Spectrometry Analysis. Environ. Sci. Technol. 50 (24), 13215–13223. doi:10.1021/acs.est.6b03971
Geng, L., Zatko, M. C., Alexander, B., Fudge, T. J., Schauer, A. J., Murray, L. T., et al. (2015). Effects of Postdepositional Processing on Nitrogen Isotopes of Nitrate in the Greenland Ice Sheet Project 2 Ice Core. Geophys. Res. Lett. 42, 5346–5354. doi:10.1002/2015gl064218
Gou, W. Q., Liu, S. Y., Xu, L., Wu, L. Z., Shangguan, D. H., Yao, X. J., et al. (2015). The Second Chinese Glacier Inventory: Data, Methods and Results. Journal of Glaciology 61, 357–372. doi:10.3189/2015JoG14J209
Heald, C. L., Collett, J. L., Lee, T., Benedict, K. B., Schwandner, F. M., Li, Y., et al. (2012). Atmospheric Ammonia and Particulate Inorganic Nitrogen over the United States. Atmos. Chem. Phys. 12 (21), 10295–10312. doi:10.5194/acp-12-10295-2012
Hiltbrunner, E., Schwikowski, M., and Körner, C. (2005). Inorganic Nitrogen Storage in alpine Snow Pack in the Central Alps (Switzerland). Atmos. Environ. 39 (12), 2249–2259. doi:10.1016/j.atmosenv.2004.12.037
Holtgrieve, G. W., Schindler, D. E., Hobbs, W. O., Leavitt, P. R., Ward, E. J., Bunting, L., et al. (2011). A Coherent Signature of Anthropogenic Nitrogen Deposition to Remote Watersheds of the Northern Hemisphere. Science 334 (6062), 1545–1548. doi:10.1126/science.1212267
Hou, S., Qin, D., Zhang, D., Kang, S., Mayewski, P. A., and Wake, C. P. (2003). A 154 a High-Resolution Ammonium Record from the Rongbuk Glacier, North Slope of Mt. Qomolangma (Everest), Tibet-Himal Region. Atmos. Environ. 37 (5), 721–729. doi:10.1016/S1352-2310(02)00582-4
Hu, Z., Anderson, N. J., Yang, X., and McGowan, S. (2014). Catchment-Mediated Atmospheric Nitrogen Deposition Drives Ecological Change in Two alpine Lakes in SE Tibet. Glob. Change Biol. 20 (5), 1614–1628. doi:10.1111/gcb.12435
Jia, Y., Yu, G., Gao, Y., He, N., Wang, Q., Jiao, C., et al. (2016). Global Inorganic Nitrogen Dry Deposition Inferred from Ground- and Space-Based Measurements. Sci. Rep. 6, 19810. doi:10.1038/srep19810
Jia, Y., Yu, G., He, N., Zhan, X., Fang, H., Sheng, W., et al. (2014). Spatial and Decadal Variations in Inorganic Nitrogen Wet Deposition in China Induced by Human Activity. Sci. Rep. 4 (4), 3763. doi:10.1038/srep03763
Kang, S., Mayewski, P. A., Qin, D., Yan, Y., Zhang, D., Hou, S., et al. (2002). Twentieth Century Increase of Atmospheric Ammonia Recorded in Mount Everest Ice Core. J. Geophys. Res. 107 (D20), 13–21. doi:10.1029/2001jd001413
Kreutz, K. J., Aizen, V. B., DeWayne Cecil, L., and Wake, C. P. (2017). Oxygen Isotopic and Soluble Ionic Composition of a Shallow Firn Core, Inilchek Glacier, Central Tien Shan. J. Glaciol. 47 (159), 548–554. doi:10.3189/172756501781831819
Lee, B. H., Mohr, C., Lopez-Hilfiker, F. D., Lutz, A., Hallquist, M., Lee, L., et al. (2016). Highly Functionalized Organic Nitrates in the Southeast United States: Contribution to Secondary Organic Aerosol and Reactive Nitrogen Budgets. Proc. Natl. Acad. Sci. USA 113 (6), 1516–1521. doi:10.1073/pnas.1508108113
Legrand, M., and Mayewski, P. (1997). Glaciochemistry of Polar Ice Cores: A Review. Rev. Geophys. 35 (3), 219–243. doi:10.1029/96RG03527
Liu, X., Duan, L., Mo, J., Du, E., Shen, J., Lu, X., et al. (2011). Nitrogen Deposition and its Ecological Impact in China: An Overview. Environ. Pollut. 159, 2251–2264. doi:10.1016/j.envpol.2010.08.002
Liu, X., Zhang, Y., Han, W., Tang, A., Shen, J., Cui, Z., et al. (2013). Enhanced Nitrogen Deposition Over China. Nature 494, 459–462. doi:10.1038/nature11917
Liu, Y. W., Wang, Y. S., Pan, Y. P., Piao, S. L., and Piao, S. L. (2015). Wet Deposition of Atmospheric Inorganic Nitrogen at Five Remote Sites in the Tibetan Plateau. Atmos. Chem. Phys. 15 (20), 11683–11700. doi:10.5194/acp-15-11683-2015
Liu, Y., Xu, J., Kang, S., Li, X., and Li, Y. (2016). Storage of Dissolved Organic Carbon in Chinese Glaciers. J. Glaciol. 62 (232), 402–406. doi:10.1017/jog.2016.47
Lü, C., and Tian, H. (2007). Spatial and Temporal Patterns of Nitrogen Deposition in China: Synthesis of Observational Data. J. Geophys. Res. 112 (D22), D22S05. doi:10.1029/2006JD007990
Mazzoleni, L. R., Ehrmann, B. M., Shen, X., Marshall, A. G., and Collett, J. L. (2010). Water-Soluble Atmospheric Organic Matter in Fog: Exact Masses and Chemical Formula Identification by Ultrahigh-Resolution Fourier Transform Ion Cyclotron Resonance Mass Spectrometry. Environ. Sci. Technol. 44 (10), 3690–3697. doi:10.1021/es903409k
Neff, J. C., Holland, E. A., Dentener, F. J., McDowell, W. H., and Russell, K. M. (2002). The Origin, Composition and Rates of Organic Nitrogen Deposition: A Missing Piece of the Nitrogen Cycle? Biogeochemistry 57 (1), 99–136. doi:10.1023/A:1015791622742
Nowlan, C. R., Martin, R. V., Philip, S., Lamsal, L. N., Krotkov, N. A., Marais, E. A., et al. (2014). Global Dry Deposition of Nitrogen Dioxide and Sulfur Dioxide Inferred from Space-Based Measurements. Glob. Biogeochem. Cycles 28 (10), 1025–1043. doi:10.1002/2014GB004805
Olivier, S., Schwikowski, M., Brütsch, S., Eyrikh, S., Gäggeler, H. W., Lüthi, M., et al. (2003). Glaciochemical Investigation of an Ice Core from Belukha Glacier, Siberian Altai. Geophys. Res. Lett. 30, 2019. doi:10.1029/2003GL018290
Preunkert, S., Wagenbach, D., and Legrand, M. (2003). A Seasonally Resolved alpine Ice Core Record of Nitrate: Comparison with Anthropogenic Inventories and Estimation of Preindustrial Emissions of NO in Europe. J. Geophys. Res. 108, 4681. doi:10.1029/2003JD003475
Saros, J. E., Rose, K. C., Clow, D. W., Stephens, V. C., Nurse, A. B., Arnett, H. A., et al. (2010). Melting Alpine Glaciers Enrich High-Elevation Lakes with Reactive Nitrogen. Environ. Sci. Technol. 44 (13), 4891–4896. doi:10.1021/es100147j
Schwikowski, M., Brütsch, S., Gäggeler, H. W., and Schotterer, U. (1999). A High-Resolution Air Chemistry Record from an Alpine Ice Core: Fiescherhorn Glacier, Swiss Alps. J. Geophys. Res. 104 (D11), 13709–13719. doi:10.1029/1998JD100112
Takeuchi, N., and Li, Z. (2008). Characteristics of Surface Dust on Ürümqi Glacier No. 1 in the Tien Shan Mountains, China. Arctic, Antarctic, Alpine Res. 40 (4), 744–750. doi:10.1657/1523-0430(07-094)[takeuchi]2.0.co;2
Thompson, L. G. (2000). Ice Core Evidence for Climate Change in the Tropics: Implications for Our Future. Quatern Sci. Rev. 19 (1), 19–35. doi:10.1016/S0277-3791(99)00052-9
Thompson, L. G., Davis, M. E., Mosley-Thompson, E., Lin, P.-N., Henderson, K. A., and Mashiotta, T. A. (2005). Tropical Ice Core Records: Evidence for Asynchronous Glaciation on Milankovitch Timescales. J. Quat. Sci. 20, 723–733. doi:10.1002/jqs.972
Thompson, L. G., Mosley-Thompson, E., Davis, M. E., Zagorodnov, V. S., Howat, I. M., Mikhalenko, V. N., et al. (2013). Annually Resolved Ice Core Records of Tropical Climate Variability over the Past ∼1800 Years. Science 340 (6135), 945–950. doi:10.1126/science.1234210
Vitousek, P. M., Aber, J. D., Howarth, R. W., Likens, G. E., Matson, P. A., Schindler, D. W., et al. (1997). Human Alteration of the Global Nitrogen Cycle: Sources and Consequences. Ecol. Appl. 7 (3), 737–750. doi:10.1890/1051-0761(1997)007[0737:haotgn]2.0.co;2
Wadham, J. L., Hawkings, J., Telling, J., Chandler, D., Alcock, J., O'Donnell, E., et al. (2016). Sources, Cycling and export of Nitrogen on the Greenland Ice Sheet. Biogeosciences 13 (22), 6339–6352. doi:10.5194/bg-13-6339-2016
Wang, C., Tian, L., Shao, L., and Li, Y. (2019). Glaciochemical Records for the Past century from the Qiangtang Glacier No.1 Ice Core on the Central Tibetan Plateau: Likely Proxies for Climate and Atmospheric Circulations. Atmos. Environ. 197, 66–76. doi:10.1016/j.atmosenv.2018.10.028
Watanabe, K., Badr, E.-S., Pan, X., and Achterberg, E. P. (2007). Conversion Efficiency of the High-Temperature Combustion Technique for Dissolved Organic Carbon and Total Dissolved Nitrogen Analysis. Int. J. Environ. Anal. Chem. 87 (6), 387–399. doi:10.1080/03067310701237023
Wendl, I. A., Eichler, A., Isaksson, E., Martma, T., and Schwikowski, M. (2015). 800-Year Ice-Core Record of Nitrogen Deposition in Svalbard Linked to Ocean Productivity and Biogenic Emissions. Atmos. Chem. Phys. 15, 7287–7300. doi:10.5194/acp-15-7287-2015
Xu, J., Wang, Z., Yu, G., Qin, X., Ren, J., and Qin, D. (2014). Characteristics of Water Soluble Ionic Species in fine Particles from a High Altitude Site on the Northern Boundary of Tibetan Plateau: Mixture of mineral Dust and Anthropogenic Aerosol. Atmos. Res. 143 (0), 43–56. doi:10.1016/j.atmosres.2014.01.018
Xu, J., Yu, G., Kang, S., Hou, S., Zhang, Q., Ren, J., et al. (2012). Sr-Nd Isotope Evidence for Modern Aeolian Dust Sources in Mountain Glaciers of Western China. J. Glaciol. 58 (211), 859–865. doi:10.3189/2012jog12j006
Xu, J. Z., Kang, S. C., Hou, S. G., Zhang, Q. G., Huang, J., Xiao, C. D., et al. (2016). Characterization of Contemporary Aeolian Dust Deposition on Mountain Glaciers of Western China. Sci. Cold Arid Regions 8 (1), 0009–0021. doi:10.3724/SP.J.1226.2016.00009
Yao, T., Duan, K., Xu, B., Wang, N., Guo, X., and Yang, X. (2008). Precipitation Record since AD 1600 from Ice Cores on the Central Tibetan Plateau. Clim. Past 4, 175–180. doi:10.5194/cp-4-175-2008
Yi, S., and Sun, W. (2014). Evaluation of Glacier Changes in High‐Mountain Asia Based on 10 Year GRACE RL05 Models. J. Geophys. Res. Solid Earth 119 (3), 2504–2517. doi:10.1002/2013JB010860
Yu, G., Jia, Y., He, N., Zhu, J., Chen, Z., Wang, Q., et al. (2019). Stabilization of Atmospheric Nitrogen Deposition in China Over the Past Decade. Nat. Geosci. 12, 424–429. doi:10.1038/s41561-019-0352-4
Yu, G., Xu, J., Kang, S., Zhang, Q., Huang, J., Ren, Q., et al. (2013). Lead Isotopic Composition of Insoluble Particles from Widespread Mountain Glaciers in Western China: Natural vs. Anthropogenic Sources. Atmos. Environ. 75, 224–232. doi:10.1016/j.atmosenv.2013.04.018
Zhan, X., Yu, G., He, N., Jia, B., Zhou, M., Wang, C., et al. (2015). Inorganic Nitrogen Wet Deposition: Evidence from the North-South Transect of Eastern China. Environ. Pollut. 204, 1–8. doi:10.1016/j.envpol.2015.03.016
Zhang, Q., and Anastasio, C. (2001). Chemistry of Fog Waters in California's Central Valley - Part 3: Concentrations and Speciation of Organic and Inorganic Nitrogen. Atmos. Environ. 35, 5629–5643. doi:10.1016/S1352-2310(01)00337-5
Zhao, H., Xu, B., Yao, T., Tian, L., and Li, Z. (2011). Records of Sulfate and Nitrate in an Ice Core from Mount Muztagata, Central Asia. J. Geophys. Res. 116 (D13), D13304. doi:10.1029/2011JD015735
Zheng, W., Yao, T., Joswiak, D. R., Xu, B., Wang, N., and Zhao, H. (2010). Major Ions Composition Records from a Shallow Ice Core on Mt. Tanggula in the Central Qinghai-Tibetan Plateau. Atmos. Res. 97 (1), 70–79. doi:10.1016/j.atmosres.2010.03.008
Zhu, J., He, N., Wang, Q., Yuan, G., Wen, D., Yu, G., et al. (2015). The Composition, Spatial Patterns, and Influencing Factors of Atmospheric Wet Nitrogen Deposition in Chinese Terrestrial Ecosystems. Sci. Total Environ. 511, 777–785. doi:10.1016/j.scitotenv.2014.12.038
Keywords: nitrogen deposition, mountain glacier, Western China, Tibetan plateau, ice core
Citation: An Y, Xu J, Liu Y, Li X, Zhao H and Kang S (2022) Concentrations, Compositions, and Deposition Rates of Dissolved Nitrogen in Western China: Insights From Snow Records. Front. Environ. Sci. 9:827456. doi: 10.3389/fenvs.2021.827456
Received: 02 December 2021; Accepted: 24 December 2021;
Published: 03 February 2022.
Edited by:
Zhiwen Dong, Chinese Academy of Sciences (CAS), ChinaReviewed by:
Ting Wei, Chinese Academy of Sciences (CAS), ChinaArijeet Mitra, Indian Institute of Science (IISc), India
Shugui Hou, Shanghai Jiao Tong University, China
Copyright © 2022 An, Xu, Liu, Li, Zhao and Kang. This is an open-access article distributed under the terms of the Creative Commons Attribution License (CC BY). The use, distribution or reproduction in other forums is permitted, provided the original author(s) and the copyright owner(s) are credited and that the original publication in this journal is cited, in accordance with accepted academic practice. No use, distribution or reproduction is permitted which does not comply with these terms.
*Correspondence: Jianzhong Xu, anp4dUBsemIuYWMuY24=