 Mihaela Simionescu
 Nicolas Schneider
 Beata Gavurova
94% of researchers rate our articles as excellent or good
Learn more about the work of our research integrity team to safeguard the quality of each article we publish.
Find out more
ORIGINAL RESEARCH article
Front. Environ. Sci., 17 January 2022
Sec. Environmental Economics and Management
Volume 9 - 2021 | https://doi.org/10.3389/fenvs.2021.817982
This article is part of the Research TopicFinancial and Trade Globalization, Greener Technologies and Energy TransitionView all 46 articles
Considering the actual debate nuclear vs renewable that divides the green transition of the EU member states, this paper investigates the dynamic interactions between two sources of decarbonized energy (renewables and nuclear) and economic growth for three distinct economies: France, Spain, and Germany, all differing in their respective long-run nuclear planning. A complex methodological framework is employed to consider stationary (Augmented Dickey-Fuller test, Phillips-Perron test, Dickey-Fuller test, Elliott-Rothenberg-Stock test, Kwiatkowski-Phillips-Schmidt-Shin test, Zivot and Andrews test with structural break), cointegration (Johansen and Juselius test of cointegration, Gregory and Hansen cointegration test with breaks based on regime-trend shifts), long-run convergence (Vector Error Correction Model), causality (Granger causality test, Toda-Yamamoto non-causality test, and variance analysis (Impulse Response Functions) Empirical results for the period 1983–2019 fail to support the existence of statistical causality between renewable energy use and economic growth in France and Spain, which is congruent with the “neutral hypothesis”. Besides, while a weak one-way link is revealed from renewable energy use to GDP in Germany only, economic growth is found to substantially trigger nuclear energy consumption in Spain but not vice versa, thus corroborating the “growth hypothesis”. Accordingly, country-specific insights are provided to deploy low-carbon sectoral facilities in Spain, enhance the channels of radioactive waste treatment in France, and secure the nuclear phase-out in Germany.
For the past decades, countries have been facing increasing energy challenges. Upon them, the deployment of secure supplies of electricity follows a need to meet the booming energy demands yet recorded everywhere. However, a few consensus has been reached on how massively upgrading power grids over the medium-term without jeopardizing their climate targets. Yet, it is admitted that, unless governments commit to comprehensive measures, global warming is expected to induce massive land and biodiversity damages, threaten coastal populations and hinder food security at the global scale (Stern, 2006; IPCC, 2014). Nobuo Tanaka, Executive Director of the International Energy Agency (IEA, 2009) highlighted that “Energy is at the heart of the problem—and so must form the core of the solution”. But to implement changes in future energy paths, a in-depth understanding of the today’s energy features and policies is required.
The development issue facing European Union (EU) countries, as well as other advanced economies is how reconcile the need for secure energy procurements to industrial and domestic sectors while avoiding unsustainable externalities (Wolde-Rufael and Menyah, 2010; Li and Jiang, 2019). In this context, both renewable and nuclear sources have emerged as a means of providing low-carbon alternatives to power-generation based-fossil fuels without boosting the energy dependence on foreign suppliers (Wolde-Rufael and Menyah, 2010; Yu et al., 2020). Following this view, shifting to renewables and nuclear is said to induce a wide range of benefits including a massive supply to energy-intensive sectors, carbon savings, and limit the fossil price volatility traditionally facing domestic importers. For instance, NEA (2002)’s estimations underlined that 10% of total carbon emissions from energy use in the OECD can be annually saved through nuclear. While numerous emerging economies have shown a keen interest for this singular source (Kakodkar, 2004; Xu, 2008; Dos Santos et al., 2013; Luqman et al., 2019), the nuclear debate continues to sharply divide EU members.
Yet, policy divergences are striking. While Europe displays an average share of nuclear of 26.4% (European Commission, 2021), national energy planning differs strongly across economies. On the one hand, France, for which nuclear power takes a central position in its electricity mix (77.6% of total electricity production in 2015), claims that the deployment of this “decarbonized” energy source may reconcile economic and environmental objectives set by the EU commission (Policy, 2017; Perrier, 2018; WDI, 2020). However, only a few is said about the effective long-run economic and ecological costs of radioactive waste disposal, decommissioning, and storage facilities. On the other hand, dealing with the numerous controversies associated with nuclear, early protest movements following the Fukushima nuclear accident1, and issues related to operational safety, Germany endorsed the decision to accelerate its phase-out from nuclear power. In May 2011, the German government announced its decision to immediately close the seven oldest nuclear power plants and to completely phase-out by 2022 (Kunz and Weight, 2014; Arlt and Wolling, 2016), later followed by Belgian (by 2025—Kunsch and Friesewinkel, 2014), and Switzerland (by 2034—Magazzino et al., 2020). Although massive deployments of renewable installed capacity are planned in Germany, the share of nuclear power still represents a non-negligible input in the total supply (14.3% of total electricity production in 2015) (WDI, 2020). Thus, Germany may face important economic and environmental challenges, starting by the choice of a cheap and climate-compatible “bridging” fuel to fill the energy gap left by nuclear over the short-run (Pattupara and Kannan, 2016). Located in between these extrema, Spain has been experiencing a long history of electricity generation based-nuclear since 1964. In consequence, nuclear became a crucial energy input which covered up until 40% of the total electricity supply in 1990s (WDI, 2020). However, in 2018, the Minister for the Ecological Transition Teresa Ribera ratified an agreement stating the progressive dismissing of 10 nuclear power plants by 2035. Given the relatively low space dedicated to renewables (24.8% of total electricity production—excluding hydroelectric), questions are ongoing on which Spanish energy choice will replace one fourth of the total power supply currently covered by nuclear (Sorman et al., 2020; WDI, 2020).
Hence, there is a point in understanding the nature of the nuclear energy-GDP relationship in Germany, France, and Spain, and analyze it comparatively with renewables. This step is necessary before asking whether maintaining a heavy reliance on nuclear would trigger economic growth in France, questioning if incoming nuclear energy conservation measures would jeopardize the German economic development, or raising interrogations about the well-established nuclear energy deployment-industrial performance defended by Spanish pro-nuclear politicians. It is thus crucial to provide an accurate and consistent knowledge on how the growth of these economies interacts with long-run changes in nuclear energy use, and the consumption of renewables.
An in-depth review of the literature highlights two important points. First, while the relationship between renewable energy and economic growth has been extensively studied (Sadorsky, 2009; Shafiei and Salim, 2014; Saidi and Omri, 2020), the domain lacks country-specific insights. Instead, large panel assessments have been conducted based on samples of heterogenous countries. Similarly, if the nuclear-GDP nexus has become the centre of a growing recent attention, panel estimations have dominated the literature (Apergis et al., 2010; Omri et al., 2015; Ozcan and Ari, 2017), placing single-country approaches relatively unexplored. Often, panel estimates have been generalized among countries presenting different energy characteristics and opposite nuclear strategies, creating general results but biased and misleading policy implications. This has recursively been the case for France, Spain, and Germany. They all give a different place to nuclear in the future but suffer from a quasi-absence of country-scale estimates and recommendations. Second, looking at the findings drawn in the empirical literature, they unfortunately contrast, and often conflict. The reason is that econometric methodologies (Augmented Mean Group (AMG); Autoregressive Distributed Lags Bounds (ARDL); Booststrap Panel Causlaity (BPC); Dynamic Ordinary Least Square (DOLS); Error Correction Model (ECM); Fully Modified Ordinary Least Square (FMOLS); Heterogenous Panel Causality (HPC), etc., … ), case studies (G-7 countries, OECD countries, heterogeneous samples of advanced and developing countries; top renewable/nuclear energy consuming countries, etc … ), and data series (quarterly or yearly series) differ sharply across papers, thus rendering the final estimates highly sensitive to the model’s specification. Besides, a wide range of past assessments have been performed using bivariate frameworks, and sometimes avoided to include standard production factors (labour, capital and exports) when data availability allowed that. This is a concern and calls for further investigations using a multivariate causality testing framework able to confirm, deny, reconcile, and more generally extend past results. Third and finally, the EU nuclear and renewable energy patterns have undergone substantial disruptions this past decade, especially because of the recursive nuclear phase out strategies endorsed by several members. More than ever, policymakers need to rely on accurate country-specific estimations to accompany these reforms, and thus, examinations using the most recent time-series data are urgent.
Accordingly, this paper fills these above-mentioned gaps in a single manner. In doing so, it contributes to the literature in two important ways (empirically and methodologically). First, to the best of our knowledge, this is the first comparative analysis of the dynamic interactions operating among renewable and nuclear energy sources, on the one hand, and economic growth on the other hand, for France, Spain, and Germany simultaneously. Second, this study contrasts with previous ones as it employs an innovative stepwise causality procedures involving a wide range of stationary, cointegration and variance analysis tests, less sensitive to the lag length selection. In addition, it displays a competitive edge with respect to standard bivariate approaches as we set-up a multivariate framework including key production factors. Finally, this assessment is thought to provide accurate findings as we rely on series covering the most recent and available period.
In sum, this paper investigates the dynamic interactions operating between two sources of decarbonized energy (renewables and nuclear) and economic growth for three distinct economies: France, Spain, and Germany, all differing in their respective long-run nuclear planning. Before conducting the comparative nexus analysis, a multivariate framework comprising production factors (GFCF, employment, and exports of goods and services), nuclear and renewable energy consumptions, and Gross Domestic Products is set with series spanning the 1983–2019 period. A complete stepwise causality analysis is then elaborated. It comprises stationary (Augmented Dickey-Fuller (ADF) test, Phillips-Perron (PP) test, Dickey-Fuller GLS (DF-GLS) test, Elliott-Rothenberg-Stock (ERS) test, Kwiatkowski-Phillips-Schmidt-Shin (KPSS) test, Zivot and Andrews test with structural break (ZA)– 1), cointegration (Johansen and Juselius (JJ) test of cointegration, Gregory and Hansen (GH) cointegration test with breaks based on regime-trend shifts—2), long-run convergence (Vector Error Correction Model (VECM)—3), causality (Granger causality (GC) test, Toda-Yamamoto non-causality (TY) test—4), and variance analysis (Impulse Response Functions (IRFs)—5) stages. Expected country-specific findings are thought to help designing adequate energy planning able to reconcile economic and climate targets in the EU zone.
Besides the Introduction, this study comprises the following Sections. Section 2 provides an in-depth review of the literature and identifies relevant empirical gaps. Section 3 shows the data and the econometric framework. Section 4 displays the empirical results which are then discussed in Section 5. In Section 6, conclusions and policy remarks are provided.
The literature examining the relationship between energy consumption and economic growth is rich and extensive. However, much less is known on the linkages operating among individual energy sources and GDP, especially when dealing with nuclear and renewables. This Section aims at providing a global overview on the main hypotheses of the literature on the nuclear-GDP, and the renewable-GDP nexuses, along with a summary of the main empirical outcomes that have been drawn on this topic so far. Finally, the main empirical gaps are highlighted, enabling us to formulate our contribution’s proposal. For an exhaustive review of this topic, see Omri (2014), and Owusu and Asumadu-Sarkodie (2016).
For many countries, the relationship between energy consumption and economic development represents a central issue because it links the constraints of the energy sector with the industrial performance, while paying deep attention to the monitoring of polluting releases (Alam, 2013; Schneider and Vallet, 2019). In the past 2 decades, researchers have commonly classified the main outcomes in four testable hypotheses, each of them being linked to far-reaching policy implications.
Above all, if a one-way causality is depicted from nuclear/renewable energy consumption to economic growth without feedback, it indicates that the studied economy is a nuclear/renewable energy-independent one. Any conservation policy aiming at reducing the share of this resource in the total supply may adversely impact the growth of the economy because this latter energy source operates as an input in the production process and plays a role alongside other factors: capital and labour. It is defined as the “growth hypothesis”, which found support in Mbarek et al. (2015) and Azam et al. (2021). Conversely, if a unidirectional causality running from GDP to nuclear/renewable energy use is revealed, it is supposed that any policy aiming at further deploying the absolute consumption of these sources would not significantly trigger the growth of the economy. However, changes in GDP are likely to affect nuclear/renewable energy consumption trends. This relationship is named as the “conservation hypothesis” and display empirical validations in Radmehr et al. (2021). Third, there is a significant bidirectional link between the variables, this refers to the “feedback hypothesis”, and associated evidence have been found in Apergis et al. (2010) and Omri et al. (2015). Fourth and finally, if no causal linkages are found among variables, then nuclear/renewable energy and GDP are considered as independent one. This refers to the “neutral hypothesis” and is congruent with the findings drawn in Ozcan and Ari (2017) and Pilatowska and Geise (2021). Therefore, it is crucial to provide an accurate knowledge on the nature of the interactions operating among energy and economic indicators in a given economy. Energy planning and economic policies should be designed accordingly to avoid unexpected adverse consequences.
A wide range of studies have examined the causal relationship between energy consumption and economic growth. However, while some studies have chosen to perform single-country analysis, others have chosen to inspect several countries simultaneously by merging the series as part of panel framework. Typically, aggregate energy consumption has been employed as a proxy for total energy consumption. Instead, other studies have opened the door to the incorporation of individual energy sources (for natural gas-GDP studies, Lee and Chiu (2011), Ewing et al. (2007), and Guo et al. (2018); for oil-GDP studies, see Zou and Chau (2006), Payne (2011), and Chu and Chang (2012); for electricity-GDP studies, see Yang (2000), Narayan and Prasad (2008), and Salahuddin and Alam (2016)). Upon them, a strand of the literature has paid a growing attention to two specific sources: nuclear and renewables. Followingly, we first review the assessments conducted on the nuclear-GDP nexus. Then, the most recent and relevant papers referring to the renewable-GDP relationship are outlined. Studies are presented chronologically. Given the explicit aim of the paper, the literature survey is rooted around the results derived from the past assessment of France, Spain, and Germany.
Seminal evidence can be traced back to Yoo and Ku (2009) who first investigated the causal relationship between nuclear energy consumption and economic growth for a sample of six nuclear economies (including Germany and France) and using series spanning the period 1960–2005. Findings derived from the Granger causality test (Granger 1969, 1988) claimed support for the existence of a one-way causality for France, which is congruent with the “growth hypothesis”. Also, results emphasized the absence of causal linkages for the case of Germany. In the same vein, Apergis and Payne (2010) provided contrasted results while inspecting the same nexus for a panel of 16 countries (including France and Spain) over the period 1980–2005. Indeed, the authors employed the Pedroni’s (1999, 2004) heterogeneous panel cointegration test and revealed the existence of a long-run equilibrium relationship between real GDP, nuclear energy consumption, real gross fixed capital formation, and the labor force. Besides, the panel Granger causality tests underlined the existence of a two-way link among variables, in line again with the “feedback hypothesis”. In practice, one plausible interpretation is that any shock in nuclear energy consumption directly affects economic growth, and that economic growth also stimulates further nuclear energy consumption (Işik et al., 2021). Therefore, they pointed out that given the carbon savings enabled by nuclear power, further deploying this energy source could generate positive spillover with environmental indicators. Using a slightly different approach, Apergis et al. (2010) examined the causal linkages operating among nuclear energy consumption, renewable energy consumption and economic growth for a group of 19 developed and developing countries (including France and Spain), and incorporated carbon emissions data within their 1984–2007 period framework. Panel results derived from the Error Correction Model (ECM) and the Granger Causality test argued in favor of a two-way link among nuclear and economic indicators, as well as between renewable energy use and GDP. Nonetheless, while economic growth enhances nuclear energy consumption, an increase in nuclear energy consumption contributes to a decrease in economic growth. Finally, nuclear is found to trigger important polluting emissions reduction on the short run, whereas renewable do not. Conversely, Wolde-Rufael and Menyah (2010) brought contrasted evidence when assessing the nuclear-GDP nexus for nine developed countries (including France and Spain) and using data series spanning the 1971–2005 period. Outcomes drawn from the Toda-Yamamoto (Toda and Yamamoto, 1995) causality procedure provided support for a one-way link running from nuclear energy use to economic growth in three countries of the sample, and without feedback. However, increases in nuclear energy consumption were found to be significantly but negatively associated with economic growth. Besides, a two-way linkage was finally depicted for both France and Spain. Lee and Chiu (2011) applied the Toda-Yamamoto causality test, followed by Impulse Response Function (IRF) and Generalized Forecast Error Variance Decomposition (GFEVD) to explore the interrelationships among nuclear energy, oil consumption and real GDP in six highly industrialized countries (including France and Germany). Associated findings provided evidence of a unidirectional causality running from real GDP to nuclear energy use in Japan, a bidirectional linkage in Canada, Germany, and the United Kingdom, while no causality emerged in France and the U.S finally. Later, Chu and Chang (2012) collected data series for G-6 economies (including France and Germany) and employed Bootstrap panel causality test over the 1971–2010 period. Related findings rejected the existence of substantial causal linkages among nuclear and economic variables, which verifies the “neutral hypothesis”. This contrasts with Omri et al. (2015)’s conclusions derived from a panel analysis of 17 advanced and developing countries ‘including France and Spain), as they claimed support for the “growth” and “feedback hypothesis” for Spain and France, respectively. Using a single-country approach, Mbarek et al. (2015) brought French-specific evidence supporting the “growth hypothesis” using quarterly data spanning the 2001:Q1-2012:Q3 period. More recently, Saidi and Ben Mbarek (2016) nurtured this lack of consensus by claiming support to the “neutral hypothesis” for nine advanced economies (including France and Spain). As a matter of fact, results drawn from Dynamic Panel Regressions (DPR) applied over the period 1990–2013 reported the absence of significant causal linkages among nuclear and economic variables. This corroborated the evidence brought in Ozcan and Ari (2017) on 13 OECD countries (including France, Spain, and Germany). Lastly, Pilatwoska et al. (2020) supplied Spanish-related evidence characterizing the presence of a bidirectional causality operating between nuclear energy consumption and economic growth. All in all, Azam et al. (2021) assessed the nexus among nuclear energy, renewables, natural gas, economic growth and carbon emissions for the 10 largest CO2 emitters worldwide (including Germany). Results derived from the Dumitrescu-Hurlin Causality test (Dumitrescu and Hurlin, 2012) confirmed the engine role of nuclear power in triggering both economic performance and carbon emissions savings. In Table 1 are summarized the main information of this conflicting evidence from the literature.
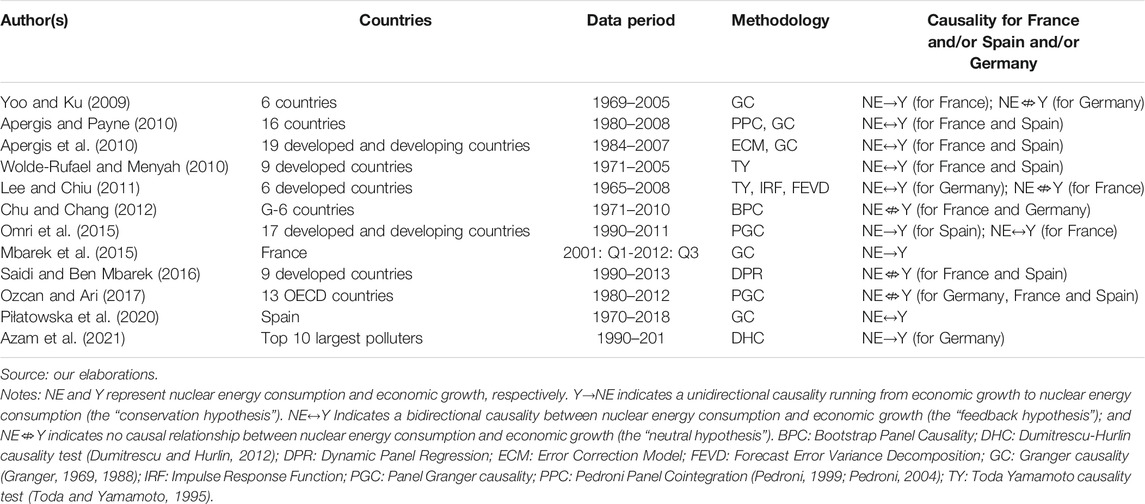
TABLE 1. Summary of previous nuclear energy-growth nexus studies.
The link among renewable energy and aggregate income has been abundantly studied. Often, environmental pollution data have been incorporated within a multi-country approach.
On this topic, Sadorsky (2009) brought seminal evidence by estimating an empirical model of renewable energy consumption for a sample of G7 countries (including France and Germany) over the 1980–2005 period. Using panel cointegration techniques, related inferences underlined that per capita GDP and CO2 emissions are two robust drivers of per capita renewable energy consumption. Indeed, a 1% increase in income implies a 8.44% increase in renewable energy consumption, which validates the existence of a one-way link among variables. Apergis et al. (2010) assessed the causal liankages between CO2 emissions, nuclear energy consumption, renewable energy use, and GDP for a sample of 14 developed and five developing countries (including France and Spain). Using data over the 1984–2007 period with a panel Error Correction Model (ECM) and the Augmented Mean Group (AMG) estimator, results emphasized a significant positive association between CO2 emissions and renewable resources use. Furthermore, the panel Granger causality tests concluded that renewable energy consumption fails to lower CO2 emissions mitigation, whereas a two-way causality is depicted between renewable energy use and the growth of the economy. Hung-Pin (2014) inspected the renewable energy-GDP nexus for nine OECD countries (including Germany and France) using data from 1982 to 2011. Outcomes obtained from the Autoregressive Distributed Lag (ARDL) model underlined the existence of causal linkages for five out of the nine countries. Regarding Germany, the “growth hypothesis” was supported. By contrast, Shafiei and Salim (2014) explored the determinants of CO2 emissions for 29 OECD countries (including France, Germany and Spain). Using data spanning the period 1980–2011 with the Stochastic Impacts by Regression on Population, Affluence, and Technology (STIRPAT) model, empirical results showed that renewable energy consumption reduces CO2 emissions. In addition, whereas non-renewable sources fail to do so. Bilgili et al. (2016) investigated the validity of the Environmental Kuznets Curve (EKC) hypothesis with CO2 emissions as dependent variables and income, quadratic income, and renewable energy consumption as independent regressors. Focusing on 17 OECD countries (including France, Germany and Spain) over the 1977–2010 period, the findings confirmed the EKC hypothesis for the whole panel, indicating that environmental degradation decreases after income reaches a turning point, and that the deployment of renewable energy triggers this dynamic. More recently, Ito (2017) examined the linkage between CO2 emissions, renewable and non-renewable energy consumption, and economic growth for 42 developed economies (including France, Germany and Spain). Using data over the 2002–2011 period with Generalized Method of Moments (GMM) and Pooled Mean Group (PMG) estimator, renewable energy use drives aggregate income. Moreover, empirical findings suggested that renewable energy consumption displays a positive and significant impact on CO2 emissions mitigation. Bhattacharya et al. (2016) collected data on top 38 renewable energy consuming countries (including France, Germany and Spain), and applied Fully Modified Ordinary Least Squares (FMOLS) methods along with Heterogenous Panel Causality (HPC) procedures. Panel findings supported the existence of a one-way link from renewable energy to GDP, which is in line with the “growth hypothesis”. Saidi and Omri (2020) extended these results and showed that renewable resources can slow down polluting emissions in 15 OECD countries (including France, Germany, and Spain) using FMOLS and VECM frameworks. Finally, Radmehr et al. (2021) used a panel spatial simultaneous equations model with generalized spatial two-stage least squares (GS2SLS) and concluded to the existence of a significant one-way causality running from renewable use to economic growth in 21 EU countries. This draws a break with respect to Piłatowska and Geise (2021)’s findings as they claimed support for the “neutral hypothesis” in France and Sweden and revealed a significant bidirectional relationship for Spain using Impulse Response Functions (IRF). In Table 2 we summarized the main information provided by this literature.
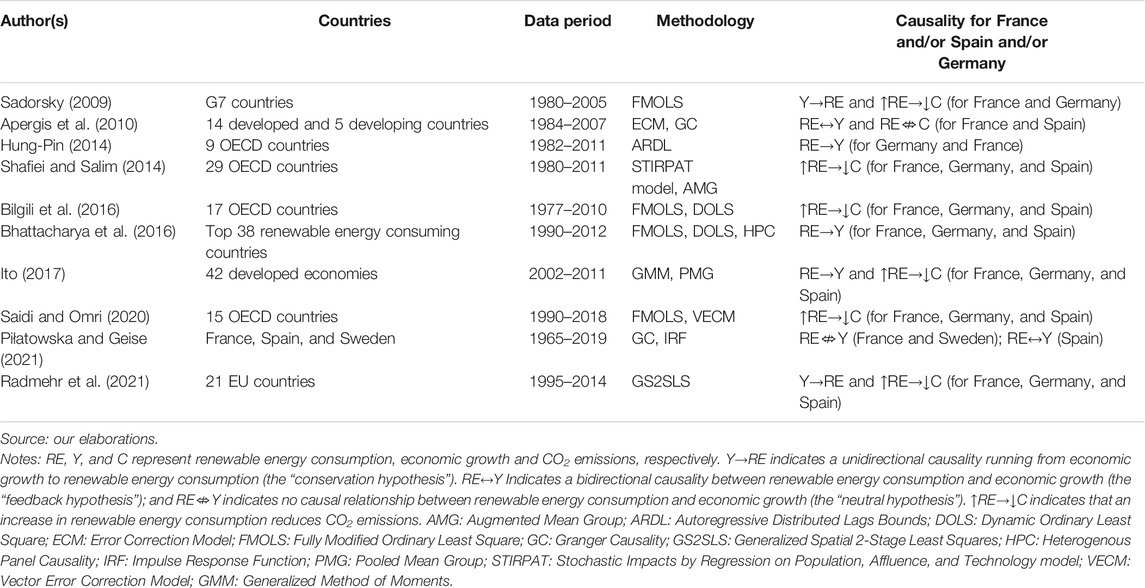
TABLE 2. Summary of previous renewable energy-GDP nexus studies.
The review of literature highlights several important points. First, there is a lack of existing literature for the single case of France, Germany, and Spain. Until now, the nuclear energy-GDP and renewable energy-GDP nexuses have only been examined within large and heterogenous panel assessments. This is critical since single-country investigations are yet assumed to display a non-negligible policy potential, especially when dealing with energy hypotheses. In addition, this turns even more central when the economies studied present contrasted (sometimes opposite) nuclear energy strategies, as it the case for France (heavy reliance), Germany (phase-out), and Spain (intermediate deployment). For all these reasons, misleading estimates may arise from incorporating and merging French, German, and Spanish data within a larger panel model. Another striking observation is that the sets of panel econometric methodologies employed in the literature, along with sample and time periods selections, strongly differ, regardless the energy source considered (renewable or nuclear). In results, related empirical findings remain conflicting, and no consensus has yet been reached on this question. Therefore, this calls for in-depth nuclear- and renewable-GDP investigations using a complete causality testing framework, designed such that, our econometric evidence are expected to confirm or deny previous findings, as well as extend the literature more generally. Third, since this assessment aims at providing high-value information for policy purposes, using a bivariate model may appear limited and sporadic. Thus, additional production function factors (i.e., capital stock and labour) must be included within a multivariate framework. Furthermore, we follow Shahbaz et al. (2013) and include exports as additional variable. Indeed, trade represented 81.8, 59.8, and 58.3% of GDP, for Germany, Spain, and France in 2020, respectively (WDI, 2020). Thus, these open economies heavily depend on their external trade (notably within the Schengen EU area), which explains why exports are easily identifiable as a non-negligible driver of their respective developments. One of the key related-mechanisms is that exports can increase the total factor productivity, improve technology transfer, enhance skills workers, and total production capacity) (Grossman and Helpman, 1990; Rivera-Batiz and Romer, 1991).
Accordingly, this paper empirically examines the interactions operating between two sources of decarbonized energy (renewables and nuclear) and economic growth for three distinct economies: France, Spain, and Germany, all differing in their respective long-run nuclear planning. Before conducting the comparative nexus analysis, a multivariate framework comprising production factors (GFCF, employment, and exports of goods and services), nuclear and renewable energy consumptions, and Gross Domestic Products is set. A complete stepwise causality analysis is then elaborated and presented in the following Section.
This Section presents the data, followed by the set-up of our econometric model.
To implement our methodology on our three case studies, namely, France, Spain and Germany, we collected data on nuclear and renewable energy consumption. Both series are expressed in ktoe and taken from the International Energy Agency (IEA, 2009)2. Gross Domestic Product (GDP) data are compiled in constant Local Currency Unit (LCU) as a proxy for economic growth and taken from the World Development Indicators (WDI, 2020)3. Also, production factors such as exports of goods and services (constant LCU) and Gross Fixed Capital Formation (GFCF—constant LCU) are taken from WDI (2020). Finally, data on labour (total employment in thousands of people—belonging to the following age category: 15–74) are compiled from Eurostat (2021), 4. For each variable, we followed the common literature (Apergis et al., 2010; Shahbaz et al., 2013) and transformed them into their natural logarithm form. For all series, data cover the largest and most recent available period: 1983–2019. Table 3 summarizes the main information about the data collection.

TABLE 3. Data information.
Followingly, relevant observations can be drawn from Figure 1. It shows the evolution of NEC, REC and Y series for each country across the past 3 decades. Nuclear energy consumption series are represented on the left-side panel, while the right panel shows renewable energy use series. Finally, the bottom panel display GDP series across time. A visual inspection of the graphs reveals an upward trend for all variables over the whole period studied. Also, slight correlation forces seem arising among renewable energy and growth variables in Germany.
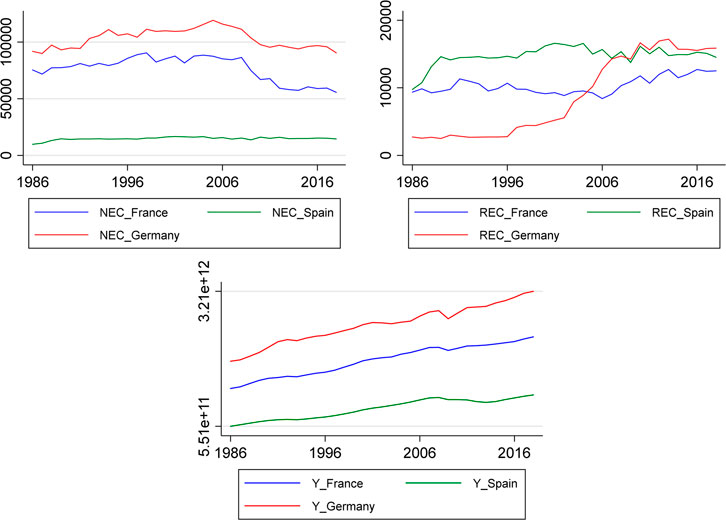
FIGURE 1. Nuclear (NEC), renewable energy consumption (REC) and economic growth (GDP) series in France, Spain and Germany (1983–2019). Nuclear energy use series for the left panel, renewable energy consumption series for the right panel, GDP series for the bottom panel. Sources: our elaborations based on IEA (2009) and WDI (2020) data.
Key descriptive statistics of the log-series are presented in Table 4. For all series except NEC and REC in Spain, the null hypothesis “the skewness and the excess kurtosis being both zero” of the Jarque-Bera (JB) test was not rejected at 1% significance level, indicating that almost all of the log-series follow a normal distribution. One striking observation is that Germany registered the highest values for mean, median and maximum GDP in the period 1983–2019. Regarding renewable energy trends, this latter country displays the highest value for maximum level of REC, but the lowest value for mean. Conversely, France displays the lowest level of REC whereas the Spanish GDP presents the lowest values of the sample.
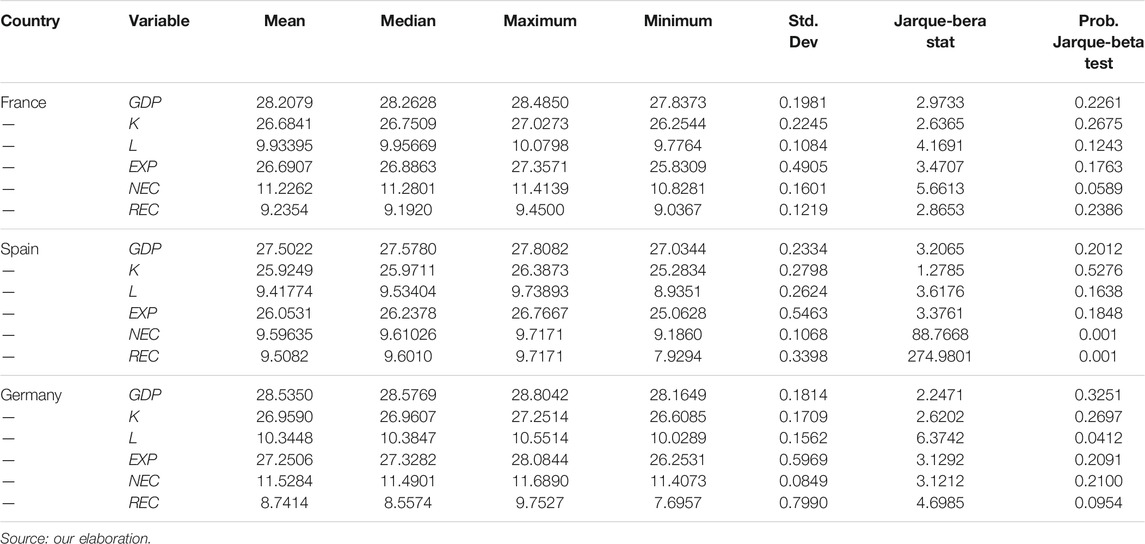
TABLE 4. Descriptive statistics (log-series).
In what follow is displayed our econometric framework, judged relevant to assess the causal relationships among renewable and nuclear energy sources on the one hand, and economic growth on the other hand, for Germany, France, and Spain. Here, we refer to Apergis and Payne (2010), Magazzino and Schneider (2020), and set up a multivariate framework incorporating capital (GFCF), labor (total employment), and exports (exports of goods and services). In doing so, we augment the conventional Cobb-Douglas production function with renewable and nuclear energy factors (Ocal and Aslan, 2013), which leads us to define our approach as follows:
Where GDP corresponds to the Gross Domestic Product, which is a proxy for economic growth. NE and RE denote the absolute consumption of nuclear and renewables, respectively. K, L, and EXP, refer to Gross Fixed Capital Formation (GFCF), total employment, and exports of goods and services, respectively. Finally, t denotes the time period. With series covering the 1983–2019 period, the log linear specification for each country is specified as follows:
Where the elasticity of nuclear energy consumption, renewable energy consumption, capital, labour and exports are indicated by αNE, αRE, αK, αL, and αEXP, respectively. When implementing such analysis, key steps should be followed prior to effectively test for causality. In first, testing the stationary properties of the series is required. It has been shown that using non-stationary data in causality can yield spurious and misleading causality results because the test will have non-standard distribution (Toda and Phillips, 1993). Our stationary testing procedure comprises the Augmented Dickey-Fuller (ADF, Dickey and Fuller, 1979) test, the Phillips-Perron (PP, Phillips and Perron, 1988) test, the Dickey-Fuller GLS (DF-GLS) test, the Elliott-Rothenberg-Stock (ERS, Elliott et al., 1992) test, and the Kwiatkowski-Phillips-Schmidt-Shin (KPSS, Kwiatkowski et al., 1992) test.
Moreover, to consider deterministic breaks in the series, the Zivot and Andrews (ZA) test (Zivot and Andrews, 2002) is conducted. It accounts for multiple endogenous breaks in both the intercept and the time trend. When identifying integration properties, it modifies the standard ADF regression and includes a dummy regressor within the specification. In doing so, the period when the time break TB occurs can be identified. Considering a series
Where the dummy variables
Once series fill the required stationarity (i.e., namely I (1) series), the cointegration properties should be examined. It corresponds to a situation where two or more time series are bound together in such way that they cannot deviate from each other in the long-run. To determine the number of cointegrating vectors among variables, we apply the Maximum Likelihood Method (MLE) of Johansen (1988), and Johansen and Juselius (1990) on our multivariate model. Consider a Vector Auto-Regressive (VAR) model:
Which can be rewritten as a Vector Error Correction Model (VECM) such that:
Where
Therefore, we subsequently employ the Gregory and Hansen (1996) cointegration test with breaks based on regime-trend shifts because it allows for the existence of endogenously determined structural breaks in the long-run cointegrating relationship. In this framework, a dummy variable is incorporated to capture a shift in the cointegrating regression. Then, the minimum ADF statistic identifies the breakpoint which is linked to a range of critical values supplied in Gregory and Hansen (1996). The statistic representation of this test is represented in Eq. 7:
Where Yt and Xit refer to the dependent and the independent variables, respectively.
According to the Granger representation theorem (Granger, 1969, 1988), if evidence of a cointegrating relationship is depicted, this implies causality at least in one direction. However, before conducting a causality analysis, one should estimate a Vector Error Correction Model (VECM). When series are cointegrated, it aims at capturing the dynamic long-run relationship operating among variables (Soytas and Sari, 2006). This model can be traced back to Sargan (1964) and aims at testing for the long-run convergence of variables and correcting for existing disequilibrium. Assuming our variables to be cointegrated, the VECM takes the form of a Vector Auto-Regressive (VAR) model which is then augmented with an Error Correction Term (ECT). This latter parameter captures the long-run speed of adjustment of the independent variables to the dependent one, and thus, can infer evidence of long-run relationship (Magazzino and Schneider, 2020).
The Granger-causality test is a common but robust approach for detecting the existence and the direction of causalities between pair of variables. It consists in detecting correlation forces between the current value of one variable and the past values of another. It is thus widely used in the literature and relevantly adequate for single-country assessments (Guilkey and Salemi, 1982). Consider a standard bivariate Vector Auto-Regressive (VAR) framework and two time series Yt and Xt; the theoretical model of the Granger causality test is as follows:
Where Δ represents the first difference operator, T is the lag length,
Nonetheless, an important critic addressed to the Granger causality test is that the estimates tend to be highly sensitive to the lag length selected. To fill this gap, Toda and Yamamoto (1995) designed a framework allowing for this inference. Unlike the Granger’s method, the Toda Yamamoto causality test can be conducted on all series, regardless their stationary properties [I (0) or I (1)]. Similarly, the cointegration properties of the series are not required to be pre-tested, thus lowering the well-known risks associated with the order’s identification’s stage (Rahman et al., 2017). In doing so, it yields robust results irrespective of the integration and cointegration properties of the variables (Zapata and Rambaldi, 1997). In practice, the TY technique artificially rises the selected lag length (k) (obtained from standard lag selection procedures) by the maximum order of integration (dmax). Therefore, the initial VAR(k) is thus augmented with the maximum order of integration of the variables, which leads to a VAR (k + dmax). Then, causality directions are inspected using a modified Wald (MWALD) test on the augmented VAR specification. This has the advantage of removing the constraints on the VAR model’s parameters without hindering its asymptotic chi-square distribution (Pittis, 1999). The standard specification of the TY test is as follows (Eq. 9):
Where yi,t indicates the response to the Granger causality of z, if
Where
Where

FIGURE 2. Stepwise causality methodology. Source: our elaboration.
To test the stationary properties of the data, we perform the Augmented Dickey-Fuller (ADF, Dickey and Fuller, 1979) test, the Phillips-Perron (PP, Phillips and Perron, 1988) test, the Dickey-Fuller GLS (DF-GLS) test, the Elliott-Rothenberg-Stock (ERS, Elliott et al., 1992) test, and the Kwiatkowski-Phillips-Schmidt-Shin (KPSS, Kwiatkowski et al., 1992) test on log-level series. Results are presented in Table 5. Notice that the optimal lag length has been selected based on the information provided by the Akaike Information Criterion (AIC). For all countries, findings failed to reject the null hypothesis of non-stationarity for log-level-scale series. Excepting ERS test, all stationary tests fail to reject the null of no stationarity at the 1% significance for series in level. In particular, excepting KPSS test for NEC and REC and ERS tests, the hypothesis of non-stationary series is supported for all variables in France. Regarding Spain, two out of the five-unit root tests fail to provide evidence supporting the stationary properties of the series K and NEC. A similar conclusion is drawn for Germany. Therefore, one should rely on a framework incorporating transformed series in first-difference levels.
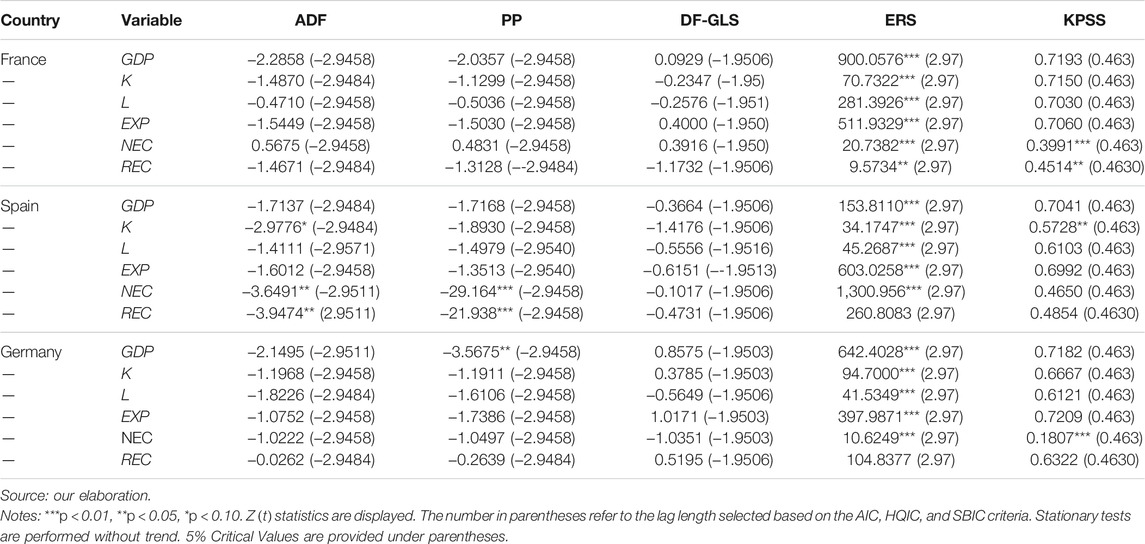
TABLE 5. Results of the unit root tests for log-level series.
As previously showed, most of the series fail to exhibit stationary properties when used in levels. In Table 6 are presented the associated results. From the set of five distinct unit root tests, one observes that the null hypothesis of non-stationarity can be rejected at the 5% level for all series. Hence, this implies that first differences series present significant stationary properties, while their level variables fail to do so. This indicates that our variables are integrated of order 1 (I (1)).
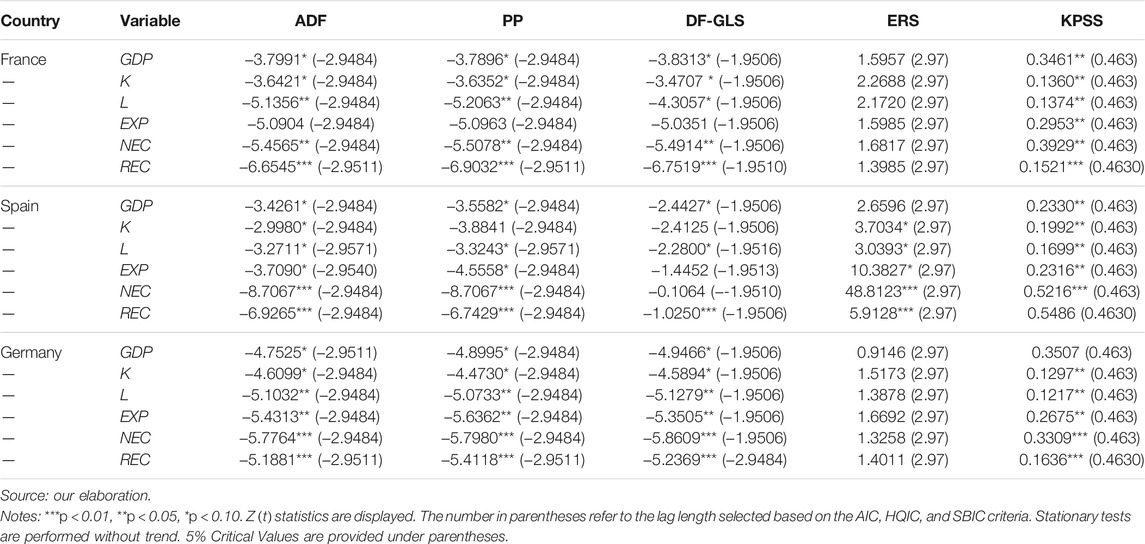
TABLE 6. Results of the unit root tests for first difference series.
To account for the existence of structural breaks in the series, we employ the Zivot-Andrews (ZA) unit root test as it allows for this inference. Associated results are presented in Table 7. By contrast to Spain, France and Germany exhibit series with strong integration properties, regardless the model specification considered (intercept, or intercept and trend). Also, endogenously breaks are recursively determined in the years 1993 and 2007–2008, indicating the occurrence of shocks in these periods, which in turn, may have modified the linear structure of the series. For all countries and both specifications, the lag length has been selected based on the AIC with a maximum allowed of 10 lags. The Zivot-Andrews unit root tests, vector error correction model and causality tests were previously applied by Işik et al. (2017) to study the relationship between economic growth, pollution, international trade, financial development, and tourism expenditures in Greece.
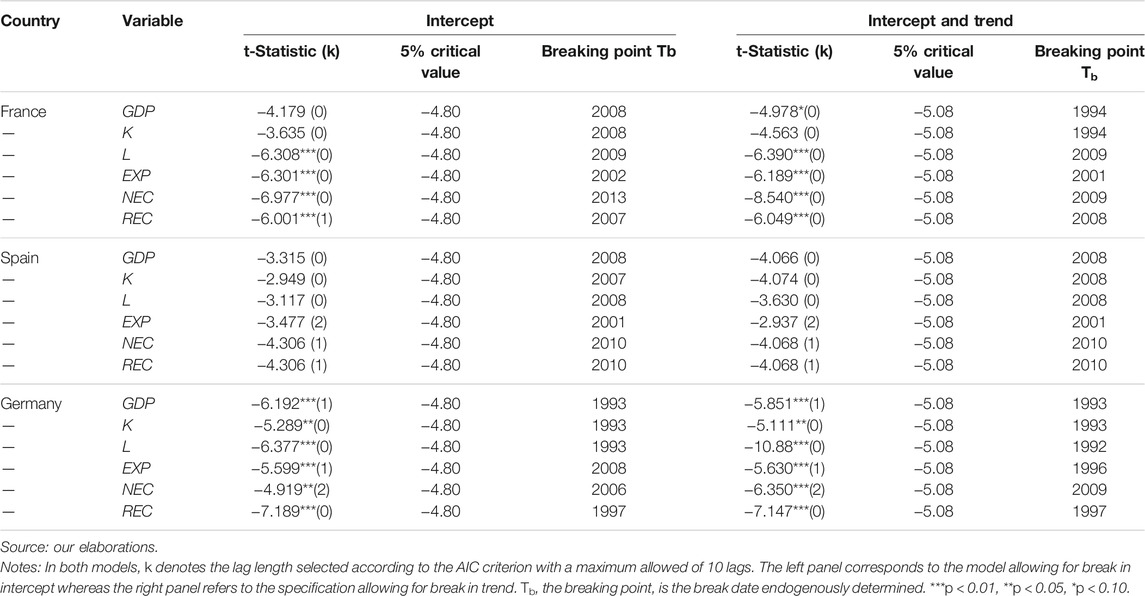
TABLE 7. results of the Zivot-Andrews (ZA) unit root test with structural breaks.
Once series fill the required stationarity (i.e., namely I (1) series), the cointegration properties can be examined. It corresponds to a situation where two or more time series are bound together in such way that they cannot deviate from each other in the long-run. To assess the existence of cointegrating relationship among variables, we apply the Maximum Likelihood Method (MLE) of Johansen (1988), and Johansen and Juselius (1990) on our multivariate model, which include trace and Max-Eigenvalue tests. Associated results presented in Table 8 support the existence of cointegration in most cases. Therefore, we can state that time series are cointegrated of order one in each country. Nonetheless, before conducting a Vector Error Correction Model (VECM) estimation, the Gregory and Hansen (GH, 1996) cointegration test with breaks based on regime-trend shifts is conducted (Gregory and Hansen, 1996).
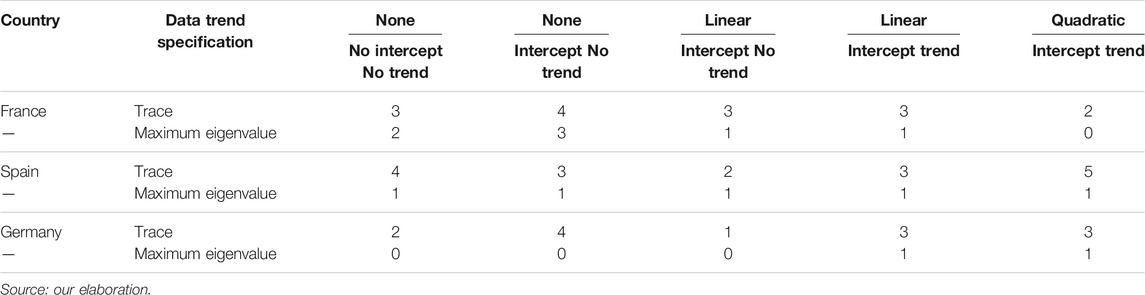
TABLE 8. Results of the Johansen and Juselius (1990) test for cointegration.
Following our ZA results, one should employ a cointegration method allowing for the presence of breaks in the series. This is where the Gregory and Hanson (1996) test for cointegration finds its contribution. The GH procedure has the advantage to consider the possibility of endogenously determined structural breaks in the long-run cointegrating relationship. It offers four different models (i.e., constant, constant and trend, constant and slope, constant, slope and trend) that are associated with the four different cointegrating vector’s assumptions. Results displayed in Table 9 unanimously support the existence of a cointegrating relationship among variables for France, Spain, and Germany. However, such findings are hardly stable for Spain and Germany, except when a break in the constant is considered for the former, and in both the constant and the trend, respectively. All in all, in general, the null hypothesis of no cointegration is rejected.
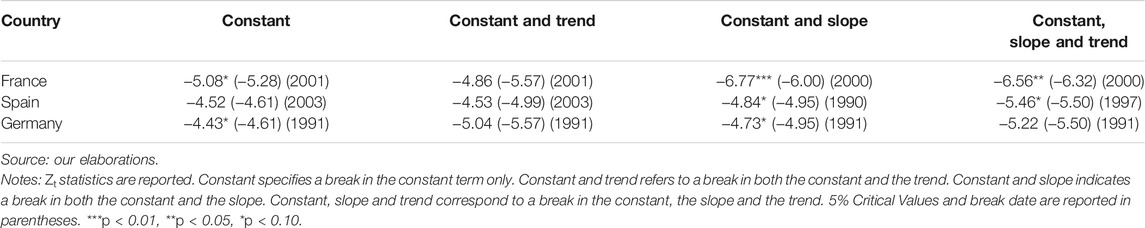
TABLE 9. Results of the Gregory and Hansen (1996) cointegration test.
Estimations of the Vector Error Correction Model (VECM) are presented in Table 10. They yield no significant negative coefficient on the ECT in the NEC, REC, K, and EXP equations at the 10% level. Instead, a negative significant ECT coefficient is exhibited in the GDP equation. For Spain, a significant negative ECT coefficient is revealed for the GDP and K equations only. The expected negative sign associated to the coefficient of lagged error term shows that NEC, REC, K, L and EXP converge to GDP: they adjust to restore the long-term equilibrium state whenever there is a deviation from the equilibrium cointegrating relationship. Finally for Germany, both REC and NEC equations display significant negative ECT coefficients, which implies that there exists a long-run convergence from the above-variables to REC and NEC, respectively. The R-square, RMSE and χ2 are displayed for each equation long-run estimation. Finally, the diagnostic testing for errors autocorrelation and normal distribution were carried out and confirmed the model’s robustness. To minimize the length of the paper, these latter results are available upon request.
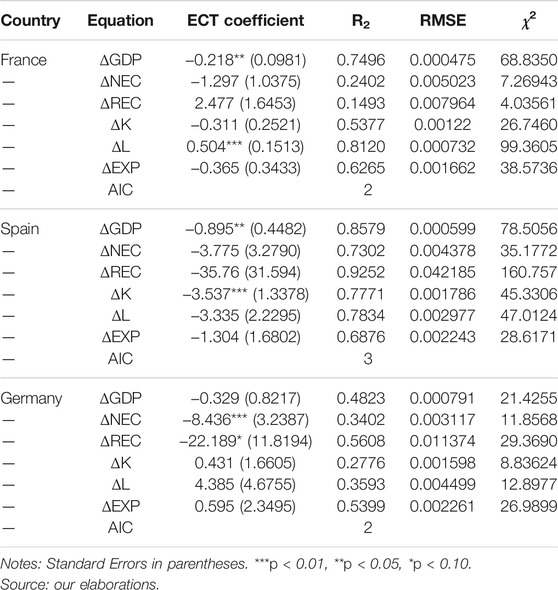
TABLE 10. VECM estimation results.
Once the presence of cointegrating properties have been depicted, the Granger causality analysis can be conducted on stationary data series. The Granger-causality test is a common but robust approach for detecting the existence and the direction of causalities between pair of variables. In line with the Granger representation theorem (1969, 1988), when evidence of a cointegrating relationship is depicted, this implies causality at least in one direction. Results derived from the causality analysis are presented in Table 11. Notice that the lag-order selection is chosen based on the information provided by the Final Prediction Error (FPE), the Hannan and Quinn Information Criterion (HQIC), and the Akaike Information Criterion (AIC). Associated results show no evidence of causal linkages among variables for France. However, regarding Germany, the hypothesis that the lagged value of economic growth does not Granger cause variation in REC can be rejected at the 10% significance level because its associated p-value is 0.062. This suggests the existence of a unidirectional Granger causality from GDP to REC in Germany, without feedback. Finally, no significant causal relationship is revealed among energy and economic indicators. Instead, a one-way causality is established from K to GDP, and from K to L.
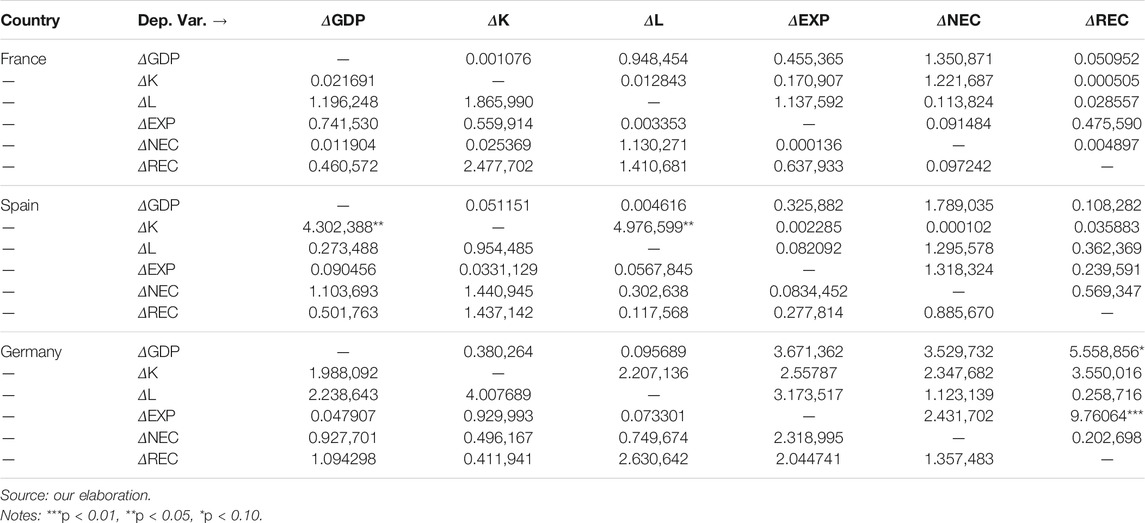
TABLE 11. Results of the Granger causality (1969, 1988) test.
An important critique addressed to the Granger causality test is that the estimates tend to be highly sensitive to the lag length selected. For robustness, Toda Yamamoto causality test is applied. Unlike the Granger’s method, the Toda Yamamoto causality test can be conducted on non-stationary series (I (0) or I (1)). Similarly, the cointegration properties of the series are not required to be pre-tested. In doing so, this methodology yields robust estimates irrespective of the integration and cointegration properties of the variables (Zapata and Rambaldi, 1997). In Table 12, results of the Toda-Yamamoto (Toda and Yamamoto, 1995) causality test are presented. The TY was applied with a maximum order to integration m equal to 1. The study of the p-values of the MWALD statistic brings fruitful insights. Above all, estimates confirm the absence of causal relationships between NEC and GDP, as well as between REC and GDP in France, which is in line with the previous Granger’s outcome. Furthermore, Spanish results fail to exhibit evidence supporting the presence of a unidirectional causality running from REC to GDP, which corroborates the Granger’s results. Nonetheless, one striking observation is that TY findings underline the existence of a one-way link from NEC to GDP significant at the 10% level, without feedback. For Germany, however, no significant link is depicted from GDP to NEC, but a significant one-way causality from NEC to GDP displays a 10% level significance. This again supports the Granger-based results drawn previously. Besides, additional causal linkages are exhibited by the TY procedure, thought to be more powerful, consistent, and reliable than the standard Granger one. They comprise one-way causalities running from GDP, EXP and REC to L in France; from GDP, L, EXP and NEC to K in Spain; from GDP, EXP and NEC to K in Germany; and in majority 1% level significant.
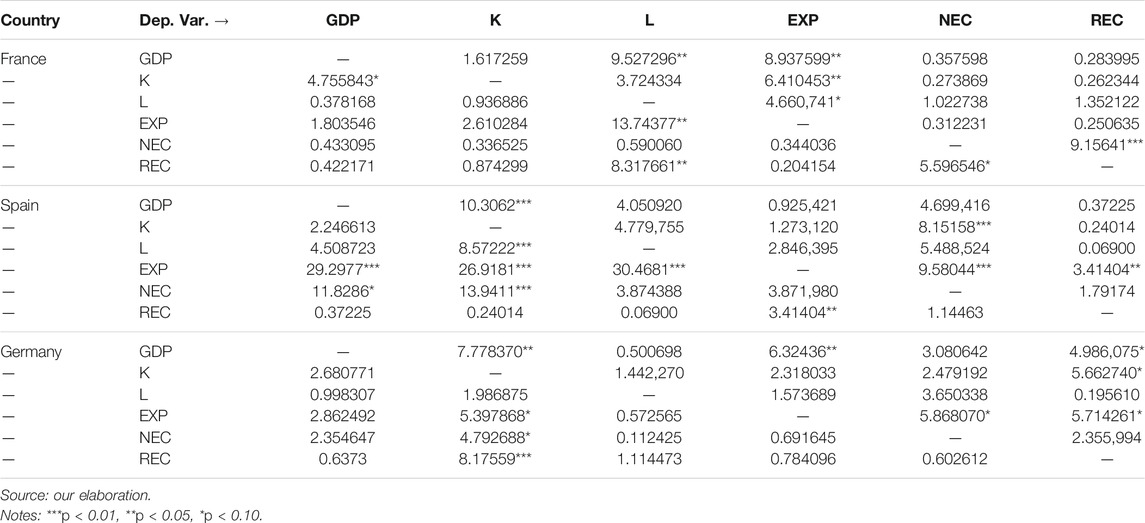
TABLE 12. Results of the Toda-Yamamoto causality (1995) test.
In a last stage, Impulse Response Functions (IRFs) are conducted, and outcomes from this variance analysis are presented in Figure 3, Figure 4, and Figure 5. In a nutshell, this procedure simulates how long and to what extent the dependent variables reacts to shock in forcing variables.
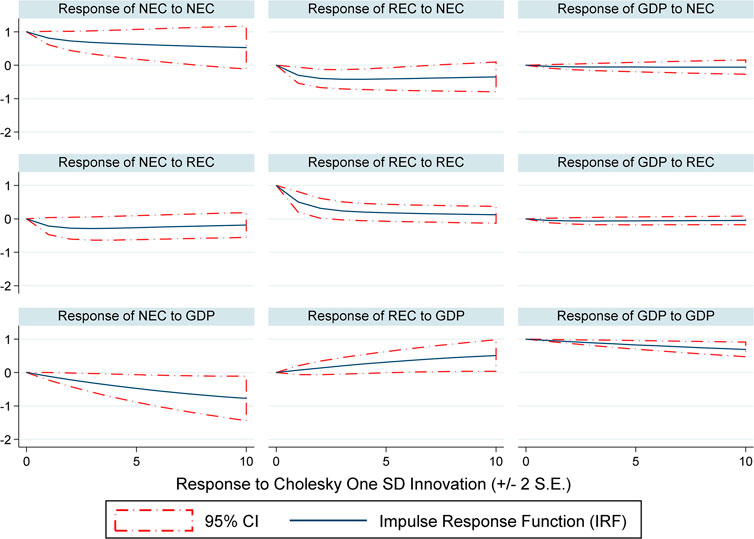
FIGURE 3. Impulse Response Functions for France. Source: our elaboration.
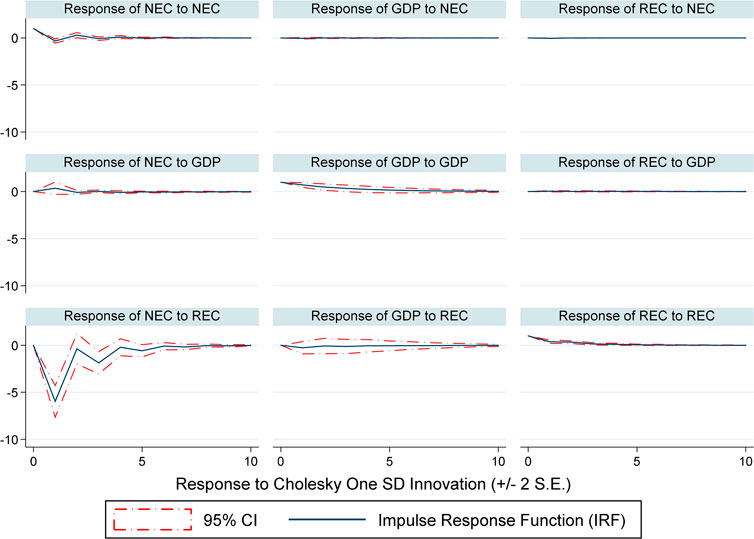
FIGURE 4. Impulse Response Functions for Spain. Source: our elaboration.
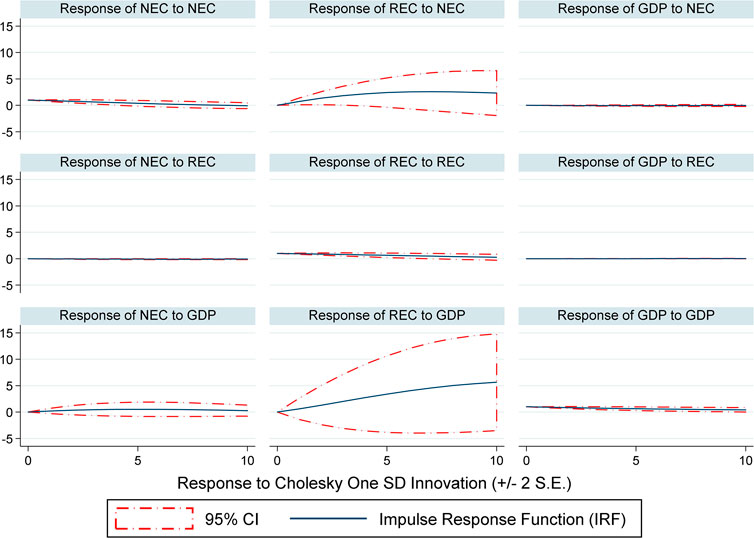
FIGURE 5. Impulse Response Functions for Germany. Source: our elaboration.
Above all, some interesting insights are the positive and negative responses of REC and NEC to GDP, respectively. However, they do not consistently relate to the causality inferences presented above. Furthermore, empirical findings fail to show a consistent and positive response of GDP to REC. In addition, the response of GDP to one standard deviation shock in NEC is weak, negligible, and dies over the 10 times horizons. These inferences are in line with those of the Granger and Toda-Yamamoto causality tests performed before, and which confirmed the absence of causal linkages among NEC and GDP variables on the one hand, and REC and GDP indicators on the other.
For the case of Spain, IRFs results fail to show evidence of consistent responses of NEC and REC to GDP, and vice versa. Again, such inferences are in line with the causality findings established above, and which failed to provide evidence supporting the existence of statistically significant causal linkages among REC and GDP variables. Instead, only a small positive response of NEC to GDP is revealed here but becomes negligible after three periods. This latter element echoes to the one-way causality from NEC to GDP revealed above by the Granger and Toda-Yamamoto tests, and which succeeded to reach the 10% significance level only.
Regarding Germany, we observe a consistent positive response of REC due to one standard deviation shock in GDP for 10 times horizons. Nonetheless, such evidence is not observed when looking at the response of NEC to GDP, GDP to REC, GDP to NEC, as these latter are weak, negligible and unsignificant. Accordingly, these findings corroborate the causality findings drew by the Granger and Toda-Yamamoto procedures, and which supported the existence of a statistically significant one-way causality running from GDP to REC only, and without feedback.
A figure summarizing these causal inferences can be found in Appendix. However, given the explicit aim of the paper, only the linkages operating among economic growth, renewable energy consumption and nuclear energy use are displayed herein.
This Section aims at discussing the obtained results by comparing them with the most recent and relevant literature. All samples of countries presented below comprise either France and/or Spain, and/or Germany. For each country, our comparative nexus analysis conducted on a multivariate framework comprising also labour force, Gross Fixed Capital Formation and exports of goods and services drew contrasted evidence. Hence, this calls for country-specific recommendations. Above all, our results confirm the absence of significant causal linkages among energy (renewable and nuclear) and economic indicators in France, which is congruent with the “neutral hypothesis” for both resources.
With respect to nuclear, our findings first contradict with the econometric outcomes depicted in Apergis and Payne (2010) for 16 countries, Apergis et al. (2010) for 19 developed and developing countries, and Wolde-Rufael and Menyah (2010) for nine developed countries, and Pilatowska et al. (2020) for the single case of Spain. As a matter of fact, all these above-mentioned assessments confirmed the presence of a bidirectional causality among nuclear energy use and economic growth, which calls for the “feedback hypothesis”. Furthermore, our conclusions differ from those of Yoo and Ku (2009) for six countries and Mbarek et al. (2015) for the single French case, as they both provided support to the “growth hypothesis”. However, our inferences are in line with those of Lee and Chiu (2011), Saidi and Ben Mbarek (2016), and Ozcan and Ari (2017) for six developed countries, nine advanced economies, and 13 OECD countries, respectively. Indeed, these studies claimed unanimously support for the “neutral hypothesis” for France, but also Spain. This echoes to Apergis et al. (2010) who showed that the inefficient use of nuclear energy associated with the relatively high capital costs and subsequent disposition of radioactive waste may explain the absence of causal relationships. Finally, our German insights supported the “conservation hypothesis” since a one-way significant causal linkage from economic growth to nuclear energy use has been revealed. To the best of our knowledge, this is the first time that evidence of this hypothesis is drawn for Germany in the literature. This contradicts with Azam et al. (2021) who highlighted that a one-way causality operates from nuclear to economic indicators in the top 10 largest polluters, but not vice versa.
Furthermore, the absence of causal relationship between renewable energy use and economic activity in France is in line with the outcomes of Pilatwoska and Geise (2021) for France and Sweden. However, the validation of the “neutral hypothesis” contradicts with a strand of the literature, including Sadorsky (2009) for G-7 countries, Apergis et al. (2010) for 14 developed and five developing countries, Hung-Pin (2014) for nine OECD countries, Ito (2017) for 42 developed economies, and Radmehr et al. (2021) for 21 EU countries. Regarding Spain, our results fail to demonstrate the existence of a strong unidirectional causality from renewable energy consumption to economic growth. Instead, a weak one-way relationship is established, in line with the “growth hypothesis”. This echoes to the panel evidence drew on the top 38 renewable energy consuming countries in Bhattacharya et al. (2016); and the non-parametric findings obtained from 40 global ranked Renewable Energy Attractive Country (RECAI)6 in Ivanovski et al. (2021). The connection between economic growth and renewable energy consumption was previously studied for France, Spain, and Germany using bootstrap panel Granger causality test for a larger sample of countries. The results indicated that renewable energy consumption generates economic growth in Spain, while economic growth is cause for renewable energy consumption (Isik et al., 2018). Unlike the common literature, one easily sees that our comparative analysis failed to provide homogeneous nexus conclusions for France, Germany, and Spain. This raises question on whether generalizing causal inferences to countries displaying similar economic characteristics remains accurate and consistent. One the one hand, the study of the nuclear-GDP nexus led to the common validation of the “feedback hypothesis” for samples of advanced countries (Apergis et al., 2010; Apergis and Payne, 2010; Wolde-Rufael and Menyah, 2010; Lee and Chiu, 2011; Omri et al., 2015; Pilatwoska et al., 2020). On the other hand, the present findings contradict with the theory that countries with comparable stages of development may adopt similar energy strategies (Dagher and Yacoubian, 2012). Indeed, Apergis and Payne (2011) categorized 88 countries into four distinct panels and according to the World Bank income classification. Based on their results, they argued that the nature of the energy use-economic growth nexus is partly determined by the country’s stage of development, although electricity was the only source considered. While the results for the low-income country panel indicated support for the “growth hypothesis” (which underlines that energy plays a crucial role in the development process), the interdependence between energy consumption and economic growth was found to shift towards a feedback channel as income grows. In this paper, we demonstrate that such statement is fragile, indicating that the nuclear energy hypotheses found above fail to be identical across Germany, France, and Spain, and thus can hardly be generalized to economies sharing comparable stages of development in Europe. Additional cofounding factors may interfere with this nexus, and notably the level of energy intensity. For instance, Aydin and Esen (2018) estimated a threshold level of energy intensity, after which energy use substantially jeopardizes growth. By implication, this study positioned itself in the vein of this literature and predicates that each country may develop its own energy strategy given its peculiar economic characteristics.
The objective of this study is to provide additional insights to the ongoing debates rooted around the potential of nuclear and renewables in supplying enough inputs to industrial sectors, while lowering the release of harmful pollutants. This paper investigates the dynamic interactions operating between two sources of decarbonized energy (renewables and nuclear) and economic growth for three distinct economies: France, Spain, and Germany, all differing in their respective long-run nuclear planning. Before conducting the comparative nexus analysis, a multivariate framework comprising production factors (GFCF, employment, and exports of goods and services), nuclear and renewable energy consumptions, and Gross Domestic Products is set with series spanning the 1983–2019 period. A complete stepwise causality analysis has been elaborated. It comprises stationary (Augmented Dickey-Fuller (ADF) test, Phillips-Perron (PP) test, Dickey-Fuller GLS (DF-GLS) test, Elliott-Rothenberg-Stock (ERS) test, Kwiatkowski-Phillips-Schmidt-Shin (KPSS) test, Zivot and Andrews test with structural breaks (ZA) - 1), cointegration (Johansen and Juselius (JJ) test of cointegration, Gregory and Hansen (GH) cointegration test with breaks based on regime-trend shifts - 2), long-run convergence (Vector Error Correction Model (VECM)), causality (Granger causality (GC) test, Toda-Yamamoto non-causality (TY) test-3), and variance analysis (Impulse Response Functions (IRFs)—4) stages.
Empirical results derived from the time-series procedure failed to support the existence of econometric causality among renewable energy use and economic growth in France and Spain, which is congruent with the “neutral hypothesis”. Besides, findings confirmed the absence of causal linkage between nuclear energy consumption and the growth of the French and Germany economies, again in line with the “neutral hypothesis”. Nonetheless, a weak one-way causality is revealed from renewable energy use to GDP in Germany whereas a substantial unidirectional linkage running from economic growth to nuclear energy consumption in Spain. While a former is said to weakly corroborate the “growth hypothesis”, the latter can be seen as a strong validation of the “conservation” one. The economic growth was previously identified as cause for renewable energy consumption by Isik et al. (2018). Based on that, country-specific recommendations can be designed, along with global implications.
To reconcile economic and climate targets in the EU zone, a temporal balance between the closure of nuclear power plants and the growth of electricity production based on renewable energy sources is required in Germany. When the power demand is growing, the deployment of a bridging fuel (i.e., coal or natural gas) becomes even more crucial to fill the electricity gap induced by the progressive abandonment of nuclear. Otherwise, if the phase-out is not sufficiently timely managed, it has been demonstrated that adverse effects may impact the growth of this economy, starting by electricity shortages, supply chain disruptions, and efficiency losses (Schneider and Vallet, 2019; Scherwath et al., 2020). However, the confirmation of the “conservation hypothesis” for Germany indicates that changes in GDP are more likely to significantly affect nuclear energy consumption trends than the opposite. If a set of conditions is reunited, implementing nuclear energy conservation measures by progressively shutting-down nuclear plants across the territory is thought to limit the expected externalities on the most productive and energy intensive sectors. For these reasons, it is also recommended for Spain to develop its electricity trade agreements with foreign suppliers, only channel able to compensate the future nuclear energy abandonment when the share of renewables in the supply mix is insufficient. As stated before, the validation of the “growth hypothesis” with respect to its renewables-GDP nexus has far-reaching policy implications for Spain. Notably, any conservation policy aiming at reducing the share of this resource in the total supply may adversely impact the growth of the economy. Conversely, because this latter energy source operates as an input in the production process and plays a role alongside other factors (capital and labour), deploying solar, wind, biomass and hydropower installed capacity might trigger GDP, which is congruent with the renewables-led-growth here validated here. Hence, since this economy is a renewable-energy dependent one, there is a point in enforcing massive public investment in the low-carbon sector. In France, the absence of causal linkages among both energy sources (renewables and nuclear) and economic growth is striking. However, such results strongly corroborate the literature on this topic, which emphasizes that the relatively high capital costs associated with the growing collection, storage and treatment of radioactive waste may trigger inefficiency losses, and, in fine, interfere with the nuclear-GDP nexus. Further investments aiming at reducing these economic and environmental costs are needed to reestablish a beneficial relationship among the nuclear and economic domains and enhance the global public awareness about this issue.
Our approach is in line with recent studies for other countries. As in the case of Spain, for India, Bandyopadhyay and Rej (2021) showed that the adoption of nuclear energy in the booming phase of the economy has a “tunnelling effect” on the economic growth. Toda-Yamamoto approach was also employed by Kirikkaleli et al. (2021) to study the causality between nuclear energy consumption and economic growth in the United Kingdom in the period 1998–2017. Moreover, wavelet coherence tests were applied and the results revealed causality from economic growth to nuclear energy consumption and a positive correlation between these indicators only in the short-run in the period 2002–2006.
In an open economy, the expansion of regional trade of renewable energy between Africa and Europe should be made faster through suitable physical electrical connections and better physical integration in European electricity grids. Spain’s interconnection with the other countries in the EU is limited and this country had excess generation capacity because of the recent economic crisis. In this context, reinforcement of electricity transmission interconnections should be a priority that could enhance economic growth in Spain and in other European countries. In the context of energy crisis determined by Covid-19 pandemic, the EU countries should consolidate the energy mix. For example, France could develop more modular nuclear reactors.
Some limitations of the study should be mentioned. First, the results are sensitive to analyzed period and to methods that were employed. One alternative method might be represented by wavelets analysis. When adequately employed, advanced Machine Learning (ML) methodologies derived from Artificial Intelligence (AI) can confirm, complement, and extend time-series econometric results. An example is the Artificial Neural Networks (ANNs) experiments conducted on the nuclear phase-out in Switzerland in Magazzino et al. (2020), or the predictive nuclear liquid-gas phase transition model from Wang et al. (2020); but much more needs to be done. If data availability allows that, regional and sectoral evidence could be provided, along with country-level forecasting. Second, other control variables could be added in the models (eg, electricity price). In a future study, electricity price will be considered in the models since the growth of these prices could enhance the use of nuclear energy. Further insights may be drawn from the study of early and relevant nuclear abandonment policies on other study case.
Publicly available datasets were analyzed in this study. This data can be found here: https://www.iea.org/reports/world-energy-balances-overview.
MS designed the research, collected data, processed data in Stata 15 and EViews 9, analyzed data, wrote sections: Introduction, Literature review, Data Collection and Econometric Framework, Discussion of the Findings, Concluding Remarks and Policy Recommendations, NS processed data in Stata 15, review the paper and wrote Literature review, Data Collection and Econometric Framework, Discussion of the Findings, Concluding Remarks and Policy Recommendations. BG wrote Introduction, Concluding Remarks and Policy Recommendations and review the paper.
This work is supported by the Scientific Grant Agency of the Ministry of Education, Science, Research, and Sport of the Slovak Republic and the Slovak Academy Sciences as a part of the research project VEGA 1/0797/20: “Quantification of Environmental Burden Impacts of the Slovak Regions on Health, Social and Economic System of the Slovak Republic”.
The authors declare that the research was conducted in the absence of any commercial or financial relationships that could be construed as a potential conflict of interest.
All claims expressed in this article are solely those of the authors and do not necessarily represent those of their affiliated organizations, or those of the publisher, the editors and the reviewers. Any product that may be evaluated in this article, or claim that may be made by its manufacturer, is not guaranteed or endorsed by the publisher.
Comments from the editor and the referees are gratefully acknowledged.
The Supplementary Material for this article can be found online at: https://www.frontiersin.org/articles/10.3389/fenvs.2021.817982/full#supplementary-material
1For an exhaustive analysis of the impact of the Fukushima nuclear accident on European energy policy, see Wittneben (2012).
2Nuclear and renewable energy consumption series are available at: https://www.iea.org/data-and-statistics.
3GDP, GFCF and exports series are available at: https://databank.worldbank.org/source/world-development-indicators.
4Employment data are available at: https://www.iea.org/data-and-statistics.
5See Kremers et al. (1992) and Gonzalo (1994) for a more exhaustive discussion on this topic.
6According to the RECAI index supplied by Ernst and Young: https://www.ey.com/en_uk/power-utilities/renewable-energy-country-attractiveness-index.
Alam, A. (2013). Nuclear Energy, CO2 Emissions and Economic Growth: the Case of Developing and Developed Countries. J. Econ. Stud 40 (6), 822–834. doi:10.1108/JES-04-2012-0044
Apergis, N., and Payne, J. E. (2011). A Dynamic Panel Study of Economic Development and the Electricity Consumption-Growth Nexus. Energ. Econ. 33 (5), 770–781. doi:10.1016/j.eneco.2010.12.018
Apergis, N., and Payne, J. E. (2010). A Panel Study of Nuclear Energy Consumption and Economic Growth. Energ. Econ. 32 (3), 545–549. doi:10.1016/j.eneco.2009.09.015
Apergis, N., Payne, J. E., Menyah, K., and Wolde-Rufael, Y. (2010). On the Causal Dynamics between Emissions, Nuclear Energy, Renewable Energy, and Economic Growth. Ecol. Econ. 69 (11), 2255–2260. doi:10.1016/j.ecolecon.2010.06.014
Arlt, D., and Wolling, J. (2016). Fukushima Effects in Germany? Changes in media Coverage and Public Opinion on Nuclear Power. Public Underst Sci. 25 (7), 842–857. doi:10.1177/0963662515589276
Aydin, C., and Esen, Ö. (2018). Does the Level of Energy Intensity Matter in the Effect of Energy Consumption on the Growth of Transition Economies? Evidence from Dynamic Panel Threshold Analysis. Energ. Econ. 69, 185–195. doi:10.1016/j.eneco.2017.11.010
Azam, A., Rafiq, M., Shafique, M., Zhang, H., and Yuan, J. (2021). Analyzing the Effect of Natural Gas, Nuclear Energy and Renewable Energy on GDP and Carbon Emissions: A Multi-Variate Panel Data Analysis. Energy 219, 119592. doi:10.1016/j.energy.2020.119592
Baek, J., and Pride, D. (2014). On the Income-Nuclear energy-CO2 Emissions Nexus Revisited. Energ. Econ. 43, 6–10. doi:10.1016/j.eneco.2014.01.015
Bandyopadhyay, A., and Rej, S. (2021). Can Nuclear Energy Fuel an Environmentally Sustainable Economic Growth? Revisiting the EKC Hypothesis for India. Environ. Sci. Pollut. Res. 28, 63065–63086. doi:10.1007/s11356-021-15220-7
Becketti, S. (2013). Introduction to Time Series Using Stata (Vol. 4905). College Station, TX: Stata Press.
Bhattacharya, M., Paramati, S. R., Ozturk, I., and Bhattacharya, S. (2016). The Effect of Renewable Energy Consumption on Economic Growth: Evidence from Top 38 Countries. Appl. Energ. 162, 733–741. doi:10.1016/j.apenergy.2015.10.104
Bilgili, F., Koçak, E., and Bulut, Ü. (2016). The Dynamic Impact of Renewable Energy Consumption on CO 2 Emissions: A Revisited Environmental Kuznets Curve Approach. Renew. Sustain. Energ. Rev. 54, 838–845. doi:10.1016/j.rser.2015.10.080
Chu, H.-P., and Chang, T. (2012). Nuclear Energy Consumption, Oil Consumption and Economic Growth in G-6 Countries: Bootstrap Panel Causality Test. Energy Policy 48, 762–769. doi:10.1016/j.enpol.2012.06.013
Dagher, L., and Yacoubian, T. (2012). The Causal Relationship between Energy Consumption and Economic Growth in Lebanon. Energy policy 50, 795–801. doi:10.1016/j.enpol.2012.08.034
Dickey, D. A., and Fuller, W. A. (1979). Distribution of the Estimators for Autoregressive Time Series with a Unit Root. J. Am. Stat. Assoc. 74 (366a), 427–431. doi:10.1080/01621459.1979.10482531
Dumitrescu, E.-I., and Hurlin, C. (2012). Testing for Granger Non-causality in Heterogeneous Panels. Econ. Model. 29 (4), 1450–1460. doi:10.1016/j.econmod.2012.02.014
Elliott, G., Rothenberg, T. J., and Stock, J. H. (1992). Efficient Tests for an Autoregressive Unit Root. Econometrica 64 (4), 813–836. doi:10.2307/2171846
Engle, R. F., and Granger, C. W. J. (1987). Co-integration and Error Correction: Representation, Estimation, and Testing. Econometrica 55, 251–276. doi:10.2307/1913236
Ewing, B. T., Sari, R., and Soytas, U. (2007). Disaggregate energy consumption and industrial output in the United States. Energy policy 35 (2), 1274–1281.
European Commission (2021). Nuclear Energy Statistics. Available at: https://ec.europa.eu/eurostat/statistics-explained/index.php?title=Nuclear_energy_statistics.
Granger, C. W. J. (1969). Investigating Causal Relations by Econometric Models and Cross-Spectral Methods. Econometrica 37, 424–438. doi:10.2307/1912791
Granger, C. W. (1988). Some Recent Development in a Concept of Causality. J. Econom. 39 (1-2), 199–211. doi:10.1016/0304-4076(88)90045-0
Gregory, A. W., and Hansen, B. E. (1996). Practitioners Corner: Tests for Cointegration in Models with Regime and Trend Shifts. Oxford Bull. Econ. Stat. 58 (3), 555–560.
Grossman, G. M., and Helpman, E. (1990). Trade, Innovation, and Growth. Am. Econ. Rev. 80 (2), 86–91.
Gonzalo, J., et al. (1994). Five alternative methods of estimating long-run equilibrium relationships. Journal of econometrics 60 (1–2), 203 –233.
Guilkey, D. K., and Salemi, M. K. (1982). Small Sample Properties of Three Tests for Granger-causal Ordering in a Bivariate Stochastic System. Rev. Econ. Stat. 64, 668–680. doi:10.2307/1923951
Guo, Z. Y., Ji, Z. Y., Chen, Q. B., Liu, J., Zhao, Y. Y., Li, F., et al. (2018). Prefractionation of LiCl from concentrated seawater/salt lake brines by electrodialysis with monovalent selective ion exchange membranes. Journal of Cleaner Production 193, 338–350.
Hung-Pin, L. (2014). Renewable Energy Consumption and Economic Growth in Nine OECD Countries: Bounds Test Approach and Causality Analysis. Scientific World J. 2014, 919167. doi:10.1155/2014/919167
Intergovernmental Panel on Climate Change (IPCC) (2014). Climate Change 2014: Synthesis Report (Geneva: IPCC,) Contribution of Working Groups I, II and III to the Fifth Assessment Report of the Intergovernmental Panel on Climate Change. Geneva, Switzerland: IPCC.
Isik, C., Dogru, T., and Turk, E. S. (2018). A Nexus of Linear and Non-linear Relationships between Tourism Demand, Renewable Energy Consumption, and Economic Growth: Theory and Evidence. Int. J. Tourism Res. 20 (1), 38–49. doi:10.1002/jtr.2151
Işik, C., Kasımatı, E., and Ongan, S. (2017). Analyzing the Causalities between Economic Growth, Financial Development, International Trade, Tourism Expenditure And/on the CO2 Emissions in Greece. Energ. Sourc. B: Econ. Plann. Pol. 12 (7), 665–673. doi:10.1080/15567249.2016.1263251
Işık, C., Ongan, S., Bulut, U., Karakaya, S., Irfan, M., Alvarado, R., and Rehman, A. (2021). Reinvestigating the Environmental Kuznets Curve (EKC) Hypothesis by a Composite Model Constructed on the Armey Curve Hypothesis with Government Spending for the US States. Environ. Sci. Pollut. Res. 2021, 1–12. doi:10.1007/s11356-021-16720-2
Ito, K. (2017). CO2 Emissions, Renewable and Non-renewable Energy Consumption, and Economic Growth: Evidence from Panel Data for Developing Countries. Int. Econ. 151, 1–6. doi:10.1016/j.inteco.2017.02.001
Ivanovski, K., Hailemariam, A., and Smyth, R. (2021). The Effect of Renewable and Non-renewable Energy Consumption on Economic Growth: Non-parametric Evidence. J. Clean. Prod. 286, 124956. doi:10.1016/j.jclepro.2020.124956
Johansen, S., and Juselius, K. (1990). Maximum Likelihood Estimation and Inference on Cointegration—With Appucations to the Demand for Money. Oxford Bull. Econ. Stat. 52 (2), 169–210.
Johansen, S. (1988). Statistical Analysis of Cointegration Vectors. J. Econ. Dyn. Control 12 (2-3), 231–254. doi:10.1016/0165-1889(88)90041-3
Kakodkar, A. (2004). Nuclear Energy in India-retrospect and Prospects. Int. J. Nucl. Power 18 (2-3), 7–12.
Kremers, J. J., Ericsson, N. R., and Dolado, J. J. (1992). The power of cointegration tests. Oxford Bull. Econ. Stat. 54 (3), 325–348.
Kirikkaleli, D., Adedoyin, F. F., and Bekun, F. V. (2021). Nuclear Energy Consumption and Economic Growth in the UK: Evidence from Wavelet Coherence Approach. J. Public Aff. 21 (1), e2130. doi:10.1002/pa.2130
Kunsch, P. L., and Friesewinkel, J. (2014). Nuclear Energy Policy in Belgium after Fukushima. Energy policy 66, 462–474. doi:10.1016/j.enpol.2013.11.035
Kunz, F., and Weigt, H. (2014). Germany’s Nuclear Phase Out: A Survey of the Impact since 2011 and Outlook to 2023. Econ. Energ. Environ. Pol. 3 (2), 13–28. doi:10.5547/2160-5890.3.2.fkun
Kwiatkowski, D., Phillips, P. C., Schmidt, P., and Shin, Y. (1992). Testing the Null Hypothesis of Stationarity against the Alternative of a Unit Root: How Sure Are We that Economic Time Series Have a Unit Root? J. Econom. 54 (1-3), 159–178. doi:10.1016/0304-4076(92)90104-y
Lee, C.-C., and Chiu, Y.-B. (2011). Nuclear Energy Consumption, Oil Prices, and Economic Growth: Evidence from Highly Industrialized Countries. Energ. Econ. 33 (2), 236–248. doi:10.1016/j.eneco.2010.07.001
Li, J., and Jiang, S. (2019). Energy Security in the Era of Transition. Glob. Energ. Interconnection 2 (5), 375–377. doi:10.1016/j.gloei.2019.11.023
Luqman, M., Ahmad, N., and Bakhsh, K. (2019). Nuclear Energy, Renewable Energy and Economic Growth in Pakistan: Evidence from Non-linear Autoregressive Distributed Lag Model. Renew. Energ. 139, 1299–1309. doi:10.1016/j.renene.2019.03.008
Magazzino, C., Mele, M., Schneider, N., and Vallet, G. (2020). The Relationship between Nuclear Energy Consumption and Economic Growth: Evidence from Switzerland. Environ. Res. Lett. 15 (9), 0940a5. doi:10.1088/1748-9326/abadcd
Magazzino, C., and Schneider, N. (2020). The Causal Relationship between Primary Energy Consumption and Economic Growth in Israel: a Multivariate Approach. Int. Rev. Environ. Resource Econ. 14 (4), 417–491. doi:10.1561/101.00000121
Mbarek, M. B., Khairallah, R., and Feki, R. (2015). Causality Relationships between Renewable Energy, Nuclear Energy and Economic Growth in France. Environ. Syst. Decis. 35 (1), 133–142. doi:10.1007/s10669-015-9537-6
Narayan, P. K., and Prasad, A. (2008). Electricity consumption–real GDP causality nexus: Evidence from a bootstrapped causality test for 30 OECD countries. Energy policy 36 (2), 910–918.
Nuclear Energy Agency (NEA) (2002). Organisation for Economic Co-operation and Development: Nuclear Energy and the Kyoto Protocol. Paris: NEA.
Ocal, O., and Aslan, A. (2013). Renewable Energy Consumption-Economic Growth Nexus in Turkey. Renew. Sustain. Energ. Rev. 28, 494–499. doi:10.1016/j.rser.2013.08.036
Omri, A. (2014). An International Literature Survey on Energy-Economic Growth Nexus: Evidence from Country-specific Studies. Renew. Sustain. Energ. Rev. 38, 951–959. doi:10.1016/j.rser.2014.07.084
Omri, A., Ben Mabrouk, N., and Sassi-Tmar, A. (2015). Modeling the Causal Linkages between Nuclear Energy, Renewable Energy and Economic Growth in Developed and Developing Countries. Renew. Sustain. Energ. Rev. 42, 1012–1022. doi:10.1016/j.rser.2014.10.046
Owusu, P. A., and Asumadu-Sarkodie, S. (2016). A Review of Renewable Energy Sources, Sustainability Issues and Climate Change Mitigation. Cogent Eng. 3 (1), 1167990. doi:10.1080/23311916.2016.1167990
Ozcan, B., and Ari, A. (2017). Nuclear Energy-Economic Growth Nexus in OECD Countries: a Panel Data Analysis. J. Econ. Manage. Perspect. 11 (1), 138–154.
Payne, J. E. (2011). On biomass energy consumption and real output in the US. Energy Sources, Part B: Economics. Planning, and Policy 6 (1), 47–52.
Pattupara, R., and Kannan, R. (2016). Alternative Low-Carbon Electricity Pathways in Switzerland and It's Neighbouring Countries under a Nuclear Phase-Out Scenario. Appl. Energ. 172, 152–168. doi:10.1016/j.apenergy.2016.03.084
Pedroni, P. (1999). Critical values for cointegration tests in heterogeneous panels with multiple regressors. Oxford Bulletin of Economics and statistics 61 (S1), 653–670.
Pedroni, P. (2004). Panel cointegration: asymptotic and finite sample properties of pooled time series tests with an application to the PPP hypothesis. Econometric theory 20 (3), 597–625.
Perrier, Q. (2018). The Second French Nuclear Bet. Energ. Econ. 74, 858–877. doi:10.1016/j.eneco.2018.07.014
Phillips, P. C. B., and Perron, P. (1988). Testing for a Unit Root in Time Series Regression. Biometrika 75 (2), 335–346. doi:10.1093/biomet/75.2.335
Piłatowska, M., and Geise, A. (2021). Impact of Clean Energy on CO2 Emissions and Economic Growth within the Phases of Renewables Diffusion in Selected European Countries. Energies 14 (4), 812. doi:10.3390/en14040812
Piłatowska, M., Geise, A., and Włodarczyk, A. (2020). The Effect of Renewable and Nuclear Energy Consumption on Decoupling Economic Growth from CO2 Emissions in Spain. Energies 13 (9), 2124. doi:10.3390/en13092124
Pittis, N. (1999). Efficient Estimation of Cointegrating Vectors and Testing for Causality in Vector Autoregressions. J. Econ. Surv. 13 (1), 1–35. doi:10.1111/1467-6419.00073
Policy, H. P. (2017). “Nuclear Politics in France,” in The Politics of Nuclear Energy in Western Europe. Editors C. Wolfgang, P. Müller, and W. Thurner (Oxford: Oxford Scholarship Online.
Radmehr, R., Henneberry, S. R., and Shayanmehr, S. (2021). Renewable Energy Consumption, CO2 Emissions, and Economic Growth Nexus: a Simultaneity Spatial Modeling Analysis of EU Countries. Struct. Change Econ. Dyn. 57, 13–27. doi:10.1016/j.strueco.2021.01.006
Rahman, M. S., Noman, A. H. M., and Shahari, F. (2017). Does Economic Growth in Malaysia Depend on Disaggregate Energy? Renew. Sustain. Energ. Rev. 78, 640–647. doi:10.1016/j.rser.2017.05.010
Rivera-Batiz, L. A., and Romer, P. M. (1991). Economic Integration and Endogenous Growth. Q. J. Econ. 106 (2), 531–555. doi:10.2307/2937946
Sadorsky, P. (2009). Renewable Energy Consumption, CO2 Emissions and Oil Prices in the G7 Countries. Energ. Econ. 31 (3), 456–462. doi:10.1016/j.eneco.2008.12.010
Saidi, K., and Mbarek, M. B. (2016). Nuclear energy, renewable energy, CO2 emissions, and economic growth for nine developed countries: Evidence from panel Granger causality tests. Progress in Nuclear Energy 88, 364–374.
Saidi, K., and Omri, A. (2020). Reducing CO2 Emissions in OECD Countries: Do Renewable and Nuclear Energy Matter? Prog. Nucl. Energ. 126, 103425. doi:10.1016/j.pnucene.2020.103425
Salahuddin, M., and Alam, K. (2016). Information and Communication Technology, electricity consumption and economic growth in OECD countries: A panel data analysis. International Journal of Electrical Power and Energy Systems 76, 185–193.
Santos, R. L. P. D., Rosa, L. P., Arouca, M. C., and Ribeiro, A. E. D. (2013). The Importance of Nuclear Energy for the Expansion of Brazil's Electricity Grid. Energy Policy 60, 284–289. doi:10.1016/j.enpol.2013.05.020
Sargan, J. D. (1964). Three-stage Least-Squares and Full Maximum Likelihood Estimates. Econometrica 32, 77–81. doi:10.2307/1913735
Scherwath, T., Wealer, B., and Mendelevitch, R. (2020). Nuclear Decommissioning after the German Nuclear Phase-Out an Integrated View on New Regulations and Nuclear Logistics. Energy Policy 137, 111125. doi:10.1016/j.enpol.2019.111125
Schneider, N., and Vallet, G. (2019). The Green Light or the Green Line? Challenges Facing the Energy Choices for Switzerland. Cahier de recherche du Creg, 2019.03 (3), 1–34. doi:10.2139/ssrn.3767108
Shafiei, S., and Salim, R. A. (2014). Non-renewable and Renewable Energy Consumption and CO2 Emissions in OECD Countries: a Comparative Analysis. Energy Policy 66, 547–556. doi:10.1016/j.enpol.2013.10.064
Shahbaz, M., Lean, H. H., and Farooq, A. (2013). Natural Gas Consumption and Economic Growth in Pakistan. Renew. Sustain. Energ. Rev. 18, 87–94. doi:10.1016/j.rser.2012.09.029
Sorman, A. H., García-Muros, X., Pizarro-Irizar, C., and González-Eguino, M. (2020). Lost (And Found) in Transition: Expert Stakeholder Insights on Low-Carbon Energy Transitions in Spain. Energ. Res. Soc. Sci. 64, 101414. doi:10.1016/j.erss.2019.101414
Soytas, U., and Sari, R. (2006). Energy Consumption and Income in G-7 Countries. J. Pol. Model. 28 (7), 739–750. doi:10.1016/j.jpolmod.2006.02.003
Stern, N. (2006). Stern Review: The Economics of Climate Change. Available at: http://www.hm-treasury.gov.uk/sternreview_index.htm.
Toda, H. Y. (1995). Finite Sample Performance of Likelihood Ratio Tests for Cointegrating Ranks in Vector Autoregressions. Econom. Theor. 11 (5), 1015–1032. doi:10.1017/s0266466600009956
Toda, H. Y., and Phillips, P. C. B. (1993). The Spurious Effect of Unit Roots on Vector Autoregressions. J. Econom. 59 (3), 229–255. doi:10.1016/0304-4076(93)90024-y
Toda, H. Y., and Yamamoto, T. (1995). Statistical Inference in Vector Autoregressions with Possibly Integrated Processes. J. Econom. 66 (1-2), 225–250. doi:10.1016/0304-4076(94)01616-8
Wang, R., Ma, Y. G., Wada, R., Chen, L. W., He, W. B., Liu, H. L., et al. (2020). Nuclear Liquid-Gas Phase Transition with Machine Learning. Phys. Rev. Res. 2 (4), 043202. doi:10.1103/physrevresearch.2.043202
Wittneben, B. B. F. (2012). The Impact of the Fukushima Nuclear Accident on European Energy Policy. Environ. Sci. Pol. 15 (1), 1–3. doi:10.1016/j.envsci.2011.09.002
Wolde-Rufael, Y., and Menyah, K. (2010). Nuclear Energy Consumption and Economic Growth in Nine Developed Countries. Energ. Econ. 32 (3), 550–556. doi:10.1016/j.eneco.2010.01.004
World Bank (WB) (2020). World Development Indicators (WDI) Database. Available at: http://data.worldbank.org.
Xu, B., and Lin, B. (2017). What Cause a Surge in China's CO2 Emissions? A Dynamic Vector Autoregression Analysis. J. Clean. Prod. 143, 17–26. doi:10.1016/j.jclepro.2016.12.159
Xu, Y.-c. (2008). Nuclear Energy in China: Contested Regimes. Energy 33 (8), 1197–1205. doi:10.1016/j.energy.2008.03.006
Yang, H. Y. (2000). A note on the causal relationship between energy and GDP in Taiwan. Energy economics, 22 (3), 309–317.
Yoo, S.-H., and Ku, S.-J. (2009). Causal Relationship between Nuclear Energy Consumption and Economic Growth: A Multi-Country Analysis. Energy Policy 37 (5), 1905–1913. doi:10.1016/j.enpol.2009.01.012
Yu, S., Yarlagadda, B., Siegel, J. E., Zhou, S., and Kim, S. (2020). The Role of Nuclear in China's Energy Future: Insights from Integrated Assessment. Energy Policy 139, 111344. doi:10.1016/j.enpol.2020.111344
Zapata, H. O., and Rambaldi, A. N. (1997). Monte Carlo Evidence on Cointegration and Causation. Oxford Bull. Econ. Stat. 59 (2), 285–298. doi:10.1111/1468-0084.00065
Zivot, E., and Andrews, D. W. K. (2002). Further Evidence on the Great Crash, the Oil-price Shock, and the Unit-Root Hypothesis. J. Business Econ. Stat. 20 (1), 25–44. doi:10.1198/073500102753410372
Zou, G., and Chau, K. W. (2006). Short-and long-run effects between oil consumption and economic growth in China. Energy policy, 34 (18), 3644–3655.
Figure A1 Summary of Causal Directions for France, Spain, and Germany. Source: our elaboration. Note: GDP, REC, and NEC refer to Gross Domestic Product, renewable energy consumption, and nuclear energy consumption, respectively. The blue line corresponds to the results related to France, the red line represents the German ones, whereas the green plot coincides with Spanish insights. SC, WC and X refer to Strong Causality, Weak Causality, and no causality, respectively. For each country, the comparative nexus analysis has been conducted on a multivariate framework comprising also labour force, Gross Fixed Capital Formation and exports of goods and services. However, given the explicit aim of the paper, only the linkages operating among economic growth, renewable energy consumption and nuclear energy use are displayed above.
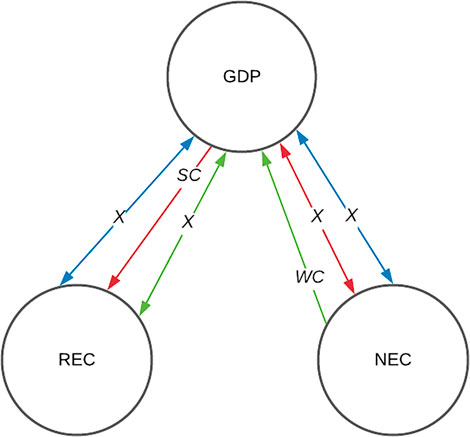
Keywords: nuclear energy consumption, economic growth, Granger causality, Toda-Yamamoto causality, cointegration
Citation: Simionescu M, Schneider N and Gavurova B (2022) Decarbonized Energies and the Wealth of Three European Nations: A Comparative Nexus Study Using Granger and Toda-Yamamoto Approaches. Front. Environ. Sci. 9:817982. doi: 10.3389/fenvs.2021.817982
Received: 18 November 2021; Accepted: 13 December 2021;
Published: 17 January 2022.
Edited by:
Magdalena Radulescu, University of Pitesti, RomaniaReviewed by:
Dalia Streimikiene, Lithuanian Energy Institute, LithuaniaCopyright © 2022 Simionescu, Schneider and Gavurova. This is an open-access article distributed under the terms of the Creative Commons Attribution License (CC BY). The use, distribution or reproduction in other forums is permitted, provided the original author(s) and the copyright owner(s) are credited and that the original publication in this journal is cited, in accordance with accepted academic practice. No use, distribution or reproduction is permitted which does not comply with these terms.
*Correspondence: Mihaela Simionescu, bWloYWVsYV9tYjFAeWFob28uY29t
Disclaimer: All claims expressed in this article are solely those of the authors and do not necessarily represent those of their affiliated organizations, or those of the publisher, the editors and the reviewers. Any product that may be evaluated in this article or claim that may be made by its manufacturer is not guaranteed or endorsed by the publisher.
Research integrity at Frontiers
Learn more about the work of our research integrity team to safeguard the quality of each article we publish.