 Bin Chen
 Yue Huang
 Jianping Huang
 Li Dong1,2
 Xiaodan Guan
 Zhiyuan Hu
94% of researchers rate our articles as excellent or good
Learn more about the work of our research integrity team to safeguard the quality of each article we publish.
Find out more
ORIGINAL RESEARCH article
Front. Environ. Sci., 08 December 2021
Sec. Atmosphere and Climate
Volume 9 - 2021 | https://doi.org/10.3389/fenvs.2021.806094
This article is part of the Research TopicAtmospheric Dust: How it affects climate, environment and life on Earth?View all 7 articles
Asian dust can be transported at least one full circuit around the globe. During the transportation, dust can interact with local air-borne dust and pollutants, and has a profound impact on the environment. A novel coronavirus (COVID-19) has been affecting human activities worldwide since early 2020. The Chinese government has implemented emergency control measures. Since April 2020, control measures to reduce anthropogenic emissions have been gradually reduced. The optical properties of aerosols during the dust transport were affected by meteorological conditions, local environmental conditions and human activities. Therefore, two dust weather processes in March 2018 and March 2020 were screened under similar meteorological fields and transportation paths, which were mainly affected by human activities. Based on lidar data, in East China, compared with 2018, the average aerosol optical depth (AOD) of all types of aerosols at 0–4 km in 2020 decreased by 55.48%, while the AOD of dust aerosols decreased by 43.59%. The average particle depolarization ratio and color ratio decreased by 40.33 and 10.56% respectively. Due to the reduction of anthropogenic emissions in China (detected by lidar), the concentration of surface PM2.5 decreased by 57.47%. This indicated that due to the decrease in human activities caused by COVID-19 control measures, the optical properties of aerosols were significantly reduced during dust weather process in eastern China. However, in the Pacific region, compared with 2018, the AOD values of 0–1 km layer and 1–6 km layer in 2020 increased by 56.4% and decreased by 29.2% respectively. The difference between the two contributions of dust aerosols was very small. Meanwhile, compared with 2018, China’s near surface pollutants decreased significantly in 2020, indicating that the near surface AOD of the Pacific in 2020 was mainly contributed by local pollutants. This study was of great significance to the study of long-range and cross regional transport of pollutants.
Atmospheric aerosols can affect the energy budget of the earth (Twomey, 1977; Albrecht, 1989; Garrett and Zhao, 2006; Zhao and Garrett, 2015). The IPCC fifth assessment report pointed out that the aerosols partially balance the radiative forcing of greenhouse gases, and they are the biggest uncertainty of anthropogenic forcing in climate change (Myhre et al., 2014). Dust aerosol is an important part of atmospheric aerosols. Its main component is mineral matter, which is closely related to particle concentration, air quality and anthropogenic health (Kanatani et al., 2010; Shao et al., 2011; Yang et al., 2021a; Yang et al., 2021b). Dust aerosols remain an important environmental pollutant in North China (Zheng et al., 2020). Model simulations have shown that the mass ratio of dust nitrate to dust aerosol can reach 10% over the Pacific Ocean (Wang et al., 2019). It was reported that the Asian dust can be transported at least one full circuit around the globe (Uno et al., 2009). Asian dust brings both the high concentration of minerals and pollutants to the downstream areas. During the transportation of dust aerosols, it carries some mineral aerosols which can interact with high-concentration sulfur dioxide (SO2), nitrogen oxides (NOx), organic matter (VOCs) and other pollutants emitted by urban coal burning and motor vehicle exhaust by anthropogenic sources (Huang et al., 2010).
Based on the space-borne lidar data, information of clouds and aerosols in the atmosphere can be retrieved (Liu et al., 2008; Chen et al., 2010; Wang et al., 2010; Chen et al., 2012, Chen et al., 2014; Wang et al., 2021). Studies have shown that the optical parameters and particle concentration of aerosols in the atmosphere are a function of the height of the boundary layer (Nicolas et al., 2019). The carbon dioxide (CO2) values in the lower atmosphere can be obtained using the space-borne Integrate Path Differential Absorption lidar (Tian et al., 2019). In addition, on the horizontal scale, the space-borne lidar can elaborate the dust transmission path by air mass transport. It can also describe the optical characteristics of the dust aerosols in the vertical direction. For example, dust aerosols in Northwest China are transported to the Pacific region by the westerly jet under the effect of the uplift of the Tibetan Plateau. By utilizing the Japanese Sunflower Meteorological Satellite data, it was found that in the situation of such high-altitude and long-distance dust transport, afforestation did not significantly improve the air quality (Guo et al., 2019). By combining the space-borne lidar data with meteorological elements and backward trajectory models, the aerosol types in the atmosphere can be distinguished (Yang et al., 2021c). The anthropogenic emissions were calculated based on satellite and land cover data for the first time, and it was 25% (Ginoux et al., 2001). The emission of dust aerosols is affected by climate change, and at the same time it will affect climate change (Ginoux et al., 2012). Many studies have investigated atmospheric aerosols using ground-based lidar data. Based on continuous observation data of ground-based lidar in China and Japan (Shimizu et al., 2004), it was found that the height of dust aerosols in Beijing could reach 4 km, and part of it was transported to Fukuoka, Japan. In East Asia, the source of natural dust aerosols is generally close to cities and industrial areas, which contains the highest anthropogenic aerosol concentration in the world (Sugimoto et al., 2014). The transport of the dust plumes over East Asia was observed in 2014 by Pan et al. (2015). The interaction between dust and anthropogenic pollution has caused air pollution in East Asia (Tian et al., 2018). Based on the data from ground-based lidar sites in the southwestern Mediterranean, the changes of aerosol scattering characteristics and PM10 concentration were analyzed during the dust transport influenced by the concentrations in the Sahara Desert (Nishizawa et al., 2017). The absorption characteristics of aerosols caused by anthropogenic activities have changed significantly. Overall, the satellite and ground-based remote-sensing measurements provide the key information for reliably evaluating the direct and indirect aerosol effects on weather and climate.
By December 31, 2020, a novel coronavirus has spread across many countries, areas or territories. Most countries have adopted various measures (e.g., shutdown factories, lockdown Wuhan city, social distancing and other government actions) to control the spread of COVID-19. These measures have reduced the anthropogenic emissions (due to the lockdown affecting to industrial operation and traffic) during this period, which affected public health, economics and the environment (Mostafa et al., 2021). Typically, the PM2.5 pollution and O3 pollution occur simultaneously during summer (Miao et al., 2021). However, the ambient PM2.5, PM10, NO2, and CO levels were reduced after the implementation of strict social distancing measures in South Korea (Ju et al., 2021). A similar study at Graz (Austria) also showed significant reduction in PM concentration (Lovric et al., 2021). In terms of O3 pollution, the lockdown has made it to increase by 36% in Wuhan. And the value in Europe was 17% (Sicard et al., 2020). In China, the PM2.5 level during heavy aerosol pollution occasions was less than 34% of that in 2017 (Zhang et al., 2020). The anthropogenic contribution accounts for about 25% of the global continental dust load (Huang et al., 2015). And the anthropogenic activities during the COVID-19 pandemic had a strong impact on the air quality (Huang et al., 2020, Huang et al., 2021). It was found that during the COVID-19 lockdown period over Greece, the levels of air pollution were significantly reduced especially over the megacity Athens (Kokkalis et al., 2021). The pandemic is anticipated to make the country more vulnerable to the effects of extreme weather events (Monasterolo et al., 2020; Mofijur et al., 2021). The air quality in China during COVID-19 had been significantly improved, with the NO2 concentration decreased by 41.7 and 61.92% in Yangtze River Delta and Wuhan respectively in February. And the PM2.5 values were decreased by 20.98% in Yangtze River Delta and 42.07% in Wuhan (Dong et al., 2021).
Existing works on various aerosols during the epidemic mainly analyzed the changes in air quality. On this basis, we screened out two dust processes in East Asia before the epidemic (March 2018) and during the epidemic (March 2020) under similar meteorological conditions. Besides the meteorological field, the transport paths of these two dust processes were similar. The changes in the process of the dust transport were closely related to anthropogenic activities. The previous studies mainly used laboratory experiments to control a single variable without considering the influence of anthropogenic effects. These studies suggested that the range and time of the environmental effects of Asia dust were closely related to the pathways and the speed of the dust plume (Li et al., 2018; Hu et al., 2020). The pollution was highly relevant to the high-pressure system over the Pacific region. During the COVID-19 epidemic, various lockdown measures have turned that period in 2020 into a natural control field. Therefore, we can determine the contribution of the anthropogenic activities to different aerosols in urban areas during the dust process.
In this study, we analyzed the optical properties of the dust aerosols along the transport path by utilizing both space-borne and ground-based lidar data. Firstly, we selected two dust processes in China before and during the COVID-19 epidemic under similar meteorological field conditions, which are from March 10th to 14th in 2018 and March 18th to 21st in 2020, respectively. These two dust processes affected most parts of East Asia. Secondly, based on the cloud-aerosol with orthogonal polarization (CALIOP) lidar on the Cloud-Aerosol Lidar and Infrared Pathfinder Satellite Observation (CALIPSO), we analyzed the vertical distribution, spatiotemporal distribution characteristics of the aerosol’s optical and physical properties. Thirdly, combined with the lidar information from the ground-based lidar, we quantitatively described the dust percent transported to the Pacific region (e.g., Japan, South Korea). Finally, we measured the impact of anthropogenic activities on the dust transport process and the contribution towards air quality based on the CALIOP space-borne lidar and ground-based lidar.
In 1998, the National Aeronautics and Space Administration (NASA) and the Centre National d’Etudes Spatiales (CNESA) started a joint mission called CALIPSO. The purpose was to gain new insight into the role of clouds and atmospheric aerosols (air-borne particles) in regulating Earth’s weather, climate, and air quality. Briefly, the CALIPSO satellite carries three payloads. The CALIOP on CALIPSO is the world’s first applied space-borne cloud and aerosol lidar with two channels (1,064 nm and 532 nm channels). The CALIOP system mainly consists of high power Nd: YAG laser and three-channel pulse. The energy is 110 mJ and the repetition frequency is 20.16 Hz (Winker et al., 2004, Winker et al., 2007).
The data employed in this paper were the attenuation backscatter coefficient products (including 532 and 1,064 nm attenuation backscatter coefficient, named ABSC532 and ABSC1064) at level 1, with a horizontal resolution of 333 m, and the vertical resolutions of 532 and 1,064 nm are 30 m below the height of 8.2 km, and the particle extinction and backscatter information in level 2 aerosol profile data, which reported at a resolution of 60 m vertically between −0.5 and 30 km. The data from −0.5 km to the surface height of each region was marked as invalid data by CALIPSO product and needed to be eliminated when analyzing the data. The aerosol optical depth (AOD) was calculated by integrating the extinction coefficient values in the vertical direction. The aerosol profile products from CALIPSO provided particle extinction coefficient and AOD data. The extinction coefficient data were used to calculate the Ångström Exponent (AE) profiles. The Particulate Volume Depolarization Ratio (PDR) is the ratio of the perpendicular and parallel ABSC532 values, which is used to judge non-sphericity of aerosol particles. The larger the PDR value, the larger the non-sphericity. And the Color Ratio (CR) value is the ratio of the ABSC1064 and the ABSC532, which mainly represents the size of aerosol particles. The larger the particle, the greater the CR value.
To analyze the vertical distribution of dust, we also utilized the Vertical Feature Mask (VFM) data products, with a horizontal resolution of 5 km. VFM data products describe the vertical and horizontal distribution of clouds and aerosol layers. The aerosol layer with PDR greater than 0.2 is divided into desert dust, which is classified as polluted dust with PDR greater than 0.075 and less than 0.2. When the PDR of aerosol layer is less than 0.075 and the top height exceeds 2.5 km, it is assumed to be smoke aerosol. When the top height is less than 2.5 km and ABSC532 is small, it is a clean continental aerosol layer. When ABSC532 is large, it is a polluted continental aerosol layer/smoke aerosol layer (Liu et al., 2004, Liu et al., 2009).
The Asian Dust Network (AD-NET) is the Asian observation part of the World Meteorological Organization (WMO) Global Atmosphere Watch Implementation Plan (GAWIP) (Sugimoto et al., 2010), with the main purpose of realizing the continuous observation of Asian dust aerosols and other types of aerosols, and understanding the impact of aerosols on the East Asian environment (Sugimoto et al., 2015, Sugimoto et al., 2016). The lidar system mainly consists of high power Nd: YAG laser, 300 mm telescope with vertical and parallel depolarization channels at two wavelengths (i.e., 532 and 1,064 nm).
In this paper, the 532 and 1,064 nm attenuation backscatter coefficient data and aerosol extinction data (of both the total aerosols and the dust aerosols) in Japan collected by AD-NET were used to analyze the vertical distribution characteristics of the dust aerosols at the ground station, compare and verify with the space-borne lidar data.
In March 2019, the European Centre for Medium-Range Weather Forecasts (ECMWF) launched the latest generation of reanalysis data, ERA5. It provides hourly estimates of the atmospheric climate variables, and combines vast amounts of historical observations into global estimates.
The data used in this paper include the air temperature, relative humidity, wind speed in vertical and horizontal directions at 500, 700, and 850 hPa.
Since 2013, after implementing the “Ambient Air Quality Standards” (GB3095-2012), the Ministry of Environmental Protection has published air quality data including PM2.5 and PM10 in more than 90 cities (about 1,600 observation sites showed in Figure 10) on its official website. The datasets can provide a comprehensive analysis of the characteristics and temporal trends of air pollution in China (Fan et al., 2020; Song et al., 2021; Chen et al., 2022).
This paper utilized the air quality data of seven indicators from 2015 to 2020, including O3, NO2, PM2.5, PM10, SO2, AQI, and CO.
The Euclidean Distance (ED) can be used to calculate the similarity among meteorological elements in different years. Smaller ED coefficient results indicate higher similarities between the real-time field and the historical sample field (Dong et al., 2021). And the ED value can be calculated by the equation below:
In the equation, i is the number of grid points in the selected area (I = 1,2 … n). And xi, yi represent the historical sample field and the selected real-time field respectively.
From 18th to March 21, 2020, a strong dust storm with a long duration and a wide range of influence occurred in East Asia. And it was under the COVID-19’s emergency control period, which reduced human emissions. The long-range transport dust can be mixed with local dust and local pollutant, and further affecting the air quality of the downstream areas. The dust process in March 2020 is a month greatly affected by the reduction of anthropogenic emissions. Considering the comparison with the air quality data, all dust transport processes in March from 2015 to 2019 were selected. Therefore, we calculated the similarity of the meteorological field with 2020 (from March 18th to 21st) from 2015 to 2019 (the screened dust process in March). And the result (Table 1) showed that March 2018 and March 2020 are the most similar in meteorological field.
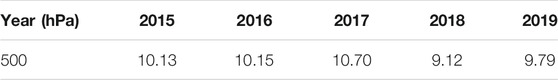
TABLE 1. The average value of Euclidean distance (Eq. 1) of all meteorological elements of 500 hPa relative to March 2020. The elements include geopotential height, relative humidity, temperature, u component of wind, v component of wind, vertical velocity and relative vorticity.
According to the result above, we screened a dust process in March 2018 (from March 10th to 14th). Finally, we found the two similar dust transport process in March 2018 (with large anthropogenic emissions) and March 2020 (with less anthropogenic emissions).
The Hybird Single Particle Lagrangian Integrated Trajectory (HYSPLIT) model can calculate and analyze the air pollution transport and diffusion trajectories (Draxler and Hess, 1997; Stein et al., 2015). Based on the HYSPLIT results, we can explain the source of aerosols in the target area. The forward trajectory of these two dust processes (Figure 1) showed that the air flow to East China and the Pacific region came from northern Xinjiang, China, and passed through Mongolia and some parts of northern China. They further affected air quality in East Asia and the Pacific region. During the two dust weather processes in 2018 and 2020, the height of the dust source reached the long-range transport conditions (Huang et al., 2008). During the two dust weather processes transportation, they were affected by local aerosol emission, and the content, composition and optical characteristics of aerosols in the downstream area were changed. The forward trajectory again proved that the main air flow sources affecting dust transportation were comparable, that is, the two dust sources and transportation paths were similar.
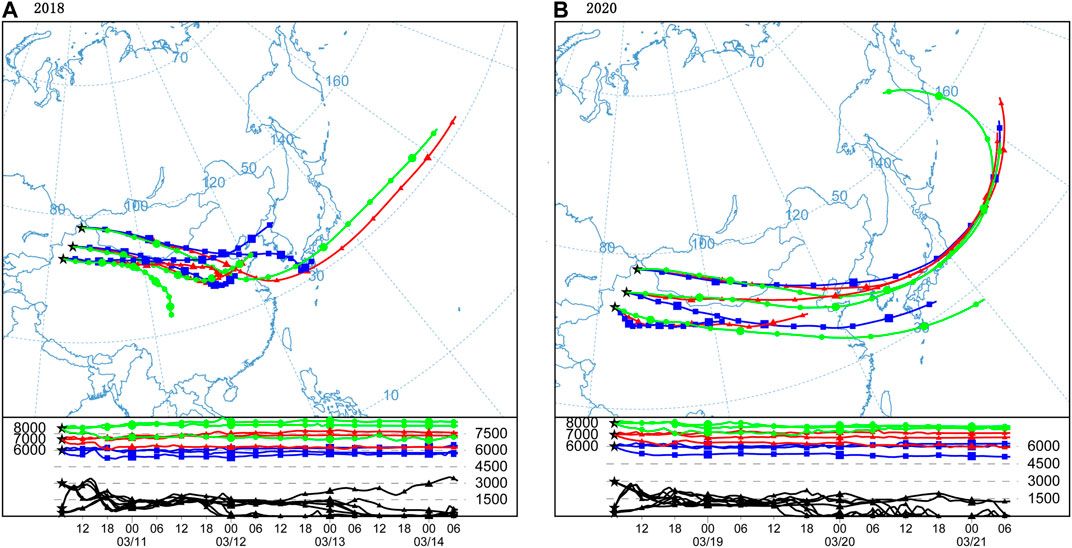
FIGURE 1. Distribution of forward trajectories on 10th March 2018 (A) and March 18, 2020 (B). (The blue, red and green colors represent altitudes of 6, 7 and 8 km above sea level).
The 500 and 700 hPa flow fields (Figure 2) in 2018 and 2020 had similar characteristics. The airflow affecting the Pacific region mainly originated from Northeast China at 500 hPa, with a small amount from Northwest China at 700 hPa.
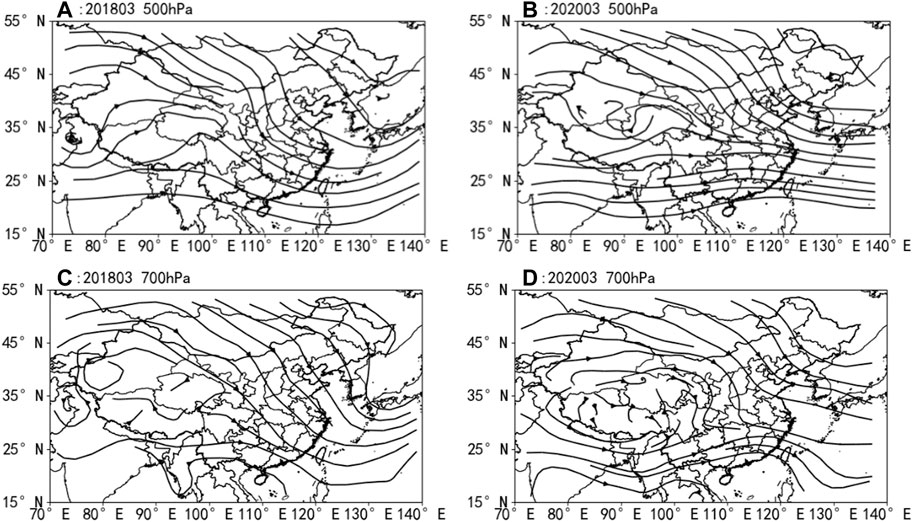
FIGURE 2. The flow field of the wind (from west China to the east Sea) at 500 and 700 hPa during the two dust processes (from March 10th to March 14th in 2018 and from March 18th to March 21st in 2020).
At the height of 500 hPa, the airflow that affected North China and the Pacific region during the two dust processes was primarily from Kazakhstan, Mongolia, Northwest China, and the central Inner Mongolia of China. While in the southern area, it was mainly a straight westerly airflow. At the height of 700 hPa, the transport path of the airflow was similar to that of 500 hPa. Based on CALIOP data, we can identify the types and the optical characteristics of the aerosols during the dust transport process. To improve the signal noise ratio of the space-borne lidar, the CALIOP data were smoothed by 2 km in the horizontal direction and 1 km in the vertical direction. Using the smoothed data, the optical characteristics and vertical distribution of aerosols in this dust weather were analyzed. Figure 3 showed the distribution of the ABSC532 values on March 10th, 12th, to 14th, 2018 and March 18th to 21st, 2020 (the time used in this article is universal time). Four orbits of each dust process were selected from the west to the east (as shown in the upper left corner of Figure 3), passing through: the dust source area in Western China, heavy industry area in Central China, eastern coastal area and Pacific region. It can be seen that high-concentration aerosols mainly appeared from the surface to 6 km in these 2 years.
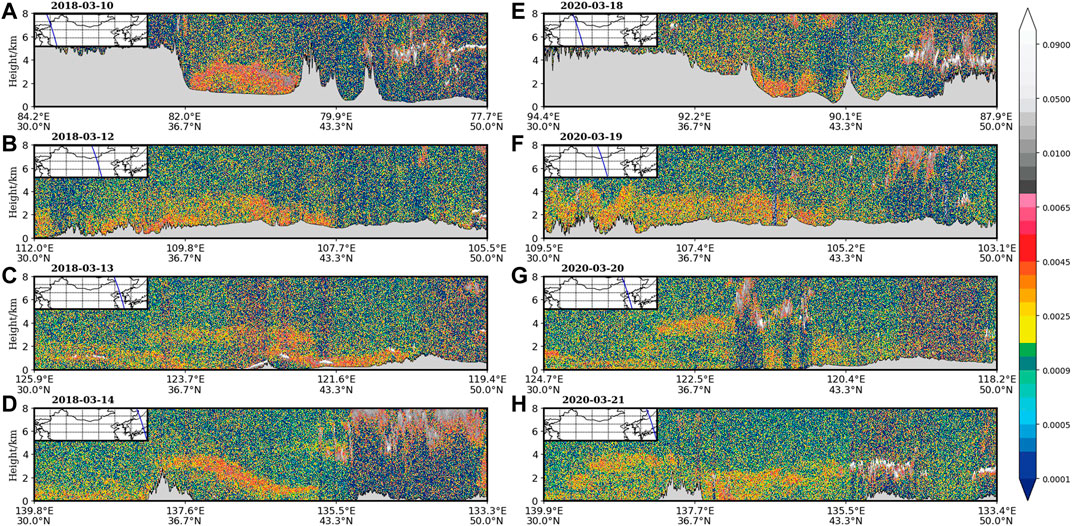
FIGURE 3. Vertical distributions of the 532 nm total attenuation backscatter coefficient from CALIOP on March 10th, 12th to 14th in 2018 (A–D), March 18th to 21st in 2020 (E–H). (Black line shows the surface elevation).
The four trajectories in 2018 were located above the Tarim Basin, Gansu and Qinghai, the Beijing-Tianjin-Hebei region and the Pacific region (for the convenience of presentation, these four trajectories from west to east are named as r1, r2, r3, and r4, respectively). The mean ABSC532 values (ranging from 0 to 8 km) of the four regions in Figure 3 were 0.0029, 0.0039, 0.0059, and 0.0038 km−1 sr−1, respectively. The mean CR value (ranging from 0 to 8 km) of pure dust was greater than 0.8, larger than that of the polluted dust. The mean PDR values (ranging from 0 to 8 km) of pure dust is greater than of the polluted dust (Zhang et al., 2019). During dust transport, the mean PDR and CR decreased by 40.33 and 10.56% from r1 to r4, respectively. The data indicate that during the dust transport process in 2018, the attenuation of the dust aerosols was large.
Compared with 2018, the four trajectories in 2020 were slightly eastward. They were located in North Xinjiang, Lanzhou, the Yellow Sea region and the East Sea region (for the convenience of presentation, these four trajectories from west to east are named as r1′, r2′, r3′, and r4′, respectively). The mean ABSC532 values in these four areas are 0.0071, 0.0049, 0.0067, and 0.0049 km−1 sr−1, respectively. During dust transport, the mean values of the PDR and CR decreased by 22.92 and 4.85%, respectively. In terms of PDR, the decline from r1′ to r4′ in 2020 was 56.83% of that in 2018. While in terms of the mean CR value, the decline was 45.93%. In other words, the change in aerosol optical properties (PDR and CR) in 2020 was about half of that in 2018.
During the transport of dust particles, due to the mixing effect of the dry sedimentation (caused by turbulent diffusion, gravitational sedimentation and molecular diffusion, which can transport the aerosols to the surface), aerosol collision and moisture absorption, the particle size and non-sphericity were reduced. Figure 4 showed the vertical distribution of aerosol types corresponding to Figure 1. It is obvious that large amount of dust aerosols was detected in all eight orbits. In r1, pure dust aerosols were located between 2 and 6 km above the Tarim Basin, China. On March 12th, a large amount of pure dust and polluted dust aerosols (distributed between the surface and 4 km above ground level) from central Inner Mongolia to Central China were detected. From r1 to r2, the dust aerosols were further transported eastward. From the northeast to the eastern of China, pure dust was mainly located in the high altitude. While on the ground, it was mixed aerosols of the polluted and pure dusts. Along the orbits above the Sea of Japan (r4), the distribution of dust aerosols was much sparser, mainly located at a height of less than 4 km.
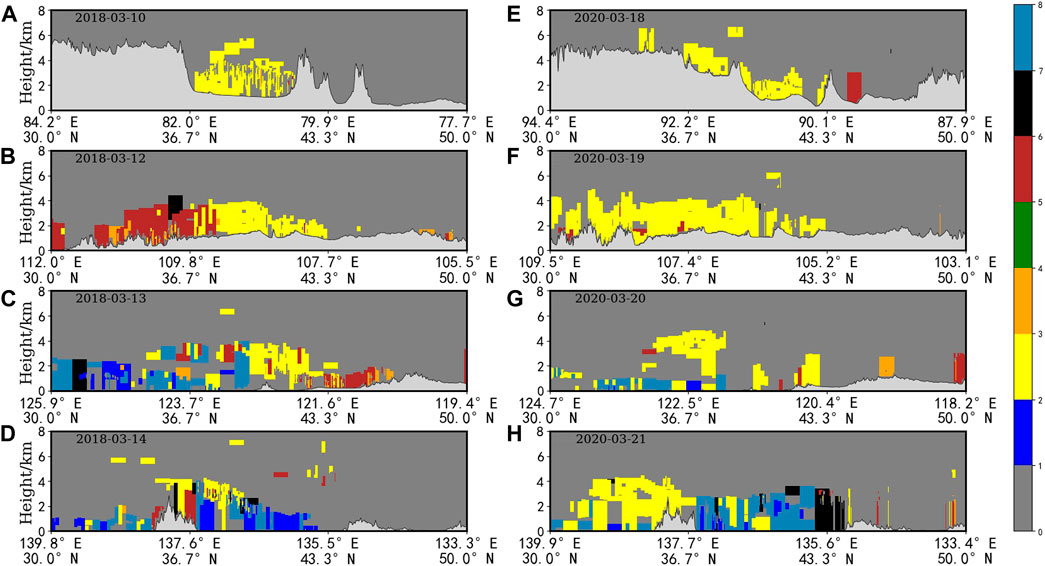
FIGURE 4. Vertical distribution of aerosol type from CALIOP on March 10th, 12th to 14th in 2018 (A–D), March 18th to 21st in 2020 (E–H), (1 = not determined, 2 = clean marine, 3 = dust, 4 = polluted continental/smoke, 5 = clean continental, 6 = polluted dust, 7 = elevated smoke, 8 = dusty marine, black line shows the surface elevation). Changes of aerosol optical characteristics during dust transport process.
Along r1′, the dust aerosols (mainly pure dust) over the Qinghai-Tibet Plateau were mainly distributed from the surface to 2 km above the ground. For r2′, from central Inner Mongolia to Lanzhou, Gansu, dust aerosols were also mainly distributed on the surface to 2 km above the ground. Extended to East China, the pure dust was mainly distributed over 2 km above the ground. From r2′ to r3′, the dust aerosols were gradually transferred eastward to Beijing-Tianjin-Hebei region, eastern coastal areas and the Sea of Japan. In addition to the long-range transport dust aerosols, in r3, r3′ in eastern China, there was a small amount of continental aerosols near the surface. For r4, there were mainly marine aerosols below 2 km; and elevated smoke between 2 and 4 km.
In 2018, r2 and r4 were dominated by a mixture of pure and polluted dust, while r2′ and r3′ were dominated by pure dust. In addition, due to the reduction of anthropogenic activities in 2020, the content of the continental aerosols (especially the polluted continental aerosols) was significantly reduced compared to 2018. The aerosols in r3 over the ocean showed that the dust aerosols in 2020 were located at a high altitude above 2 km. While in 2018, the presence of the dust aerosols was usually a mixture with other types of aerosols.
The dust percentages (the ratio of the grid numbers of the dust aerosols (including both the pure dust and polluted dust) and the total aerosols) of r3 and r4 were 47.53 and 40.60%, respectively. While in 2020, they were 73.47 and 48.16%, respectively. Compared with 2018, the proportions of pure dust increased by 32.36 and 29.82%, respectively; the proportions of polluted dust decreased by 5.46 and 9.32%, respectively.
The CR values in 2020 were significantly larger than that at 2–3.5 km of r4′ in 2018 (Figure 5), similar to the changes of the PDR values. In 2018, the CR values in all the four trajectories varied from 0 to 0.5 km. The changes of CR values in 2020 were greater than that in 2018. For r4′, the particle size was particularly large at the height of 2–3 km in the Pacific Ocean. The CR of r3′was greater at about 4 km, while the value of r4′ was larger at 2–3 km.
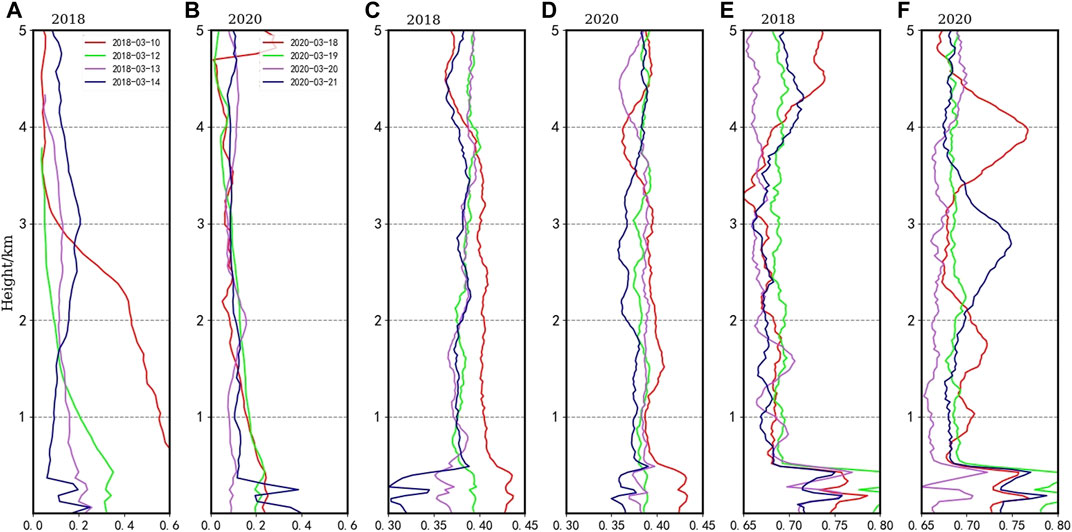
FIGURE 5. Vertical distributions of the Extinction Coefficient [unit:/km, (A,B)], the 532 nm Particulate Depolarization Ratio (C,D), and the Color Ratio (E,F) of the aerosols (clean marine, pure dust, polluted continental/smoke, clean continental, polluted dust, elevated smoke) from CALIOP on March 10th, 12th to 14th in 2018 (A,C,E), March 18th to 21st in 2020 (B,D,F).
During the eastward transport of pure dust in 2018, the PDR values of all types of aerosols changed significantly from r1 to r2. The PDR value of pure dust was greater than that of the polluted dust and other types of aerosols (Mamouri and Ansmann, 2017). The change of pure dust remained larger at the height of 0–1 km from r2 to r3. While the height exceeds 1 km, the PDR values changed little. Extending eastward, the PDR values decreased rapidly at a height more than 1 km above the surface in the Pacific region. In 2020, the changes of PDR values of each railway were relatively uniform. For r4′, the PDR value was larger at high altitude than at lower altitude (contrary to the trend in 2018).
The mean extinction coefficient value of all types of aerosols in 2018 was decreased by 28.7% from r1 to r4, while the value of dust declined by 40.81% from r1′ to r4′. The PDR value of dust increased. Relative to 2018, it increased by 1.09% in 2020. At the same time, the particle size of polluted dust increased by 2.65%, while the particle size of pure dust changed little. Compared with the previous orbit (from r1 to r4 or from r1′ to r4′), the extinction coefficients of all types of aerosols and dust aerosols were gradually reduced, the reduction range of dust aerosols was more, while other types of aerosols (such as polluted continental aerosol) showed an upward trend. In other words, during the transport of dust, aerosol particle size and aerosol optical depth (AOD) were affected by local pollutant emission.
In 2020, the average extinction coefficient of all types of aerosols calculated from CALIOP was 0.14, 0.16, 0.10, and 0.09 /km in each railway (r1′, r2′, r3′, r4′). The overall change of the extinction coefficient was relatively small, similar to the changes in the depolarization ratio and color ratio. However, the change was greater at 0–1 km height. The average extinction coefficient of aerosols in each railway (r1, r2, r3, r4) in 2018 was 0.30, 0.14 0.13, and 0.14 /km. The maximum average value was at r1 (0.62 /km), while the minimum average value was at r4 (0.11 /km). In comparison, in 2020, the minimum extinction coefficient value was at r3′, which was only 0.09 /km below 1 km. The extinction coefficient values of other tracks have limited difference, which gradually decreases from west to east with a similar value around 0.2 /km.
The extinction coefficient profile of dust aerosols indicates that the value in 2020 was significantly lower than that in 2018. The change on the entire profile was small. In 2018, the change was larger below 3 km. It can be seen that the change of aerosol extinction coefficient was closely related to dust aerosols. The CR value of the dust had little change in 2018 and 2020 above 1 km height. In other words, the CR values of all types of aerosols were mainly related to other types of aerosols in the atmosphere.
At the near-ground height (0–1 km), the extinction coefficient of r3 and r4 in 2018 changed little. In 2020, the extinction coefficient of r4′ was slightly higher than that in 2018. In addition, the extinction coefficient of dust aerosols in 2018 was also smaller, and there was little difference in 2020. This means that the value of the near-surface AOD value in the Pacific region was not related to the long-distance transport of dust, but was mostly related to local emissions.
The average AE and PDR values of pure dust particles detected by the CALIOP were 1.34 and 0.30 in 2020 (1.29 and 0.31 in 2018). According to the values calculated from CALIOP, the size of pure dust particles decreased by 3.81%, while the non-spherical effect increased by 26.10%. The particle size of pollutant dust declined by 9.54%, while the non-spherical effect dropped by 9.40%. In 2020, the continental aerosol’s content reduced significantly, with the asphericity increased by 4.59%. The size of continental aerosol particles was also in a downward trend. The particle size of marine aerosols (including both the clean marine and the polluted marine) increased by about 3.5%. However, the asphericity of the clean marine aerosols increased by 39.04%, while the polluted ocean aerosols decreased by 48.38%.
The dust aerosol’s extinction coefficient profiles (Figure 6) in 2018 and 2020 show that the extinction coefficient of the dust aerosols at 0–3 km in 2018 was significantly greater than that in 2020. According to CALIOP and the air-quality data, the size and asphericity of dust particles in 2020 had little change compared to 2018. However, the concentration of air pollutants dropped significantly in 2020. The concentrations of PM2.5 and O3 were reduced by about 50%, but the PM10 concentration changed little.
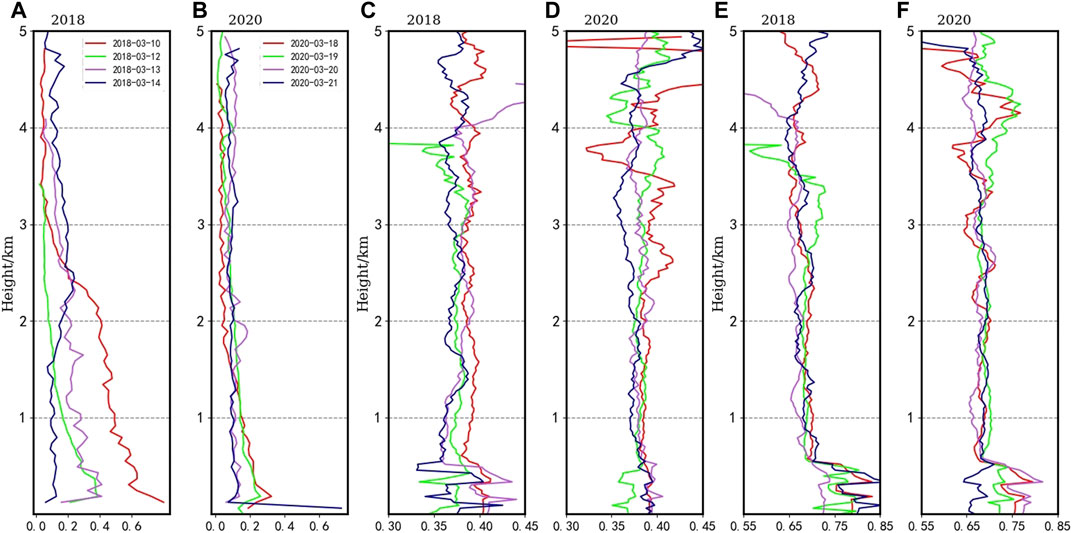
FIGURE 6. Same in Figure 5, while the aerosol includes only pure dust and polluted dust.
To eliminate the difference caused by different atmospheric molecular transmission effects between the space-borne and ground-based lidars, an apparent scattering ratio (Rapp) was proposed for comparison (Kim et al., 2008). The Rapp value can be calculated using the formula below:
In the formula, S2 (z) and S2 (zref) are the lidar return signals at the altitudes z and zref, respectively. At the altitude zref, Rapp (zref) equals to 1, which means that zref is the height of Rayleigh scattering. Overall, Rapp is only related to atmospheric aerosols and cloud particles, eliminating the difference caused by different atmospheric molecular transmission effects between space-borne and ground-based lidars.
Figures 7,8 compare the Rapp values between the CALIOP data and the ground-based (AD-NET) lidars in 2018 and 2020, respectively. The nearest AD-NET station from r4 and r4′ is the Toyama lidar station in Japan, with a distance within 80 km. Apparently, the Rapp value from the AD-NET was much smoother than that from the CALIOP. From the perspective of the attenuated backscatter coefficient, both space-borne and ground-based lidars had sudden change at altitudes below 1 km in 2018 because of the influence of terrain. At altitudes 3 km, the attenuated backscatter coefficients detected by ground-based and space-borne lidars were similar in magnitude. At the altitudes above 3 km, the signal detected by the space-borne lidar was significantly stronger than that of the AD-NET. The Rapp value was slightly larger than that of the space-borne lidar at the altitude below 3 km. At other altitudes, the Rapp values of both lidars were basically similar. The Rapp value from the ground-based lidar was basically within the range of the space-borne lidar.
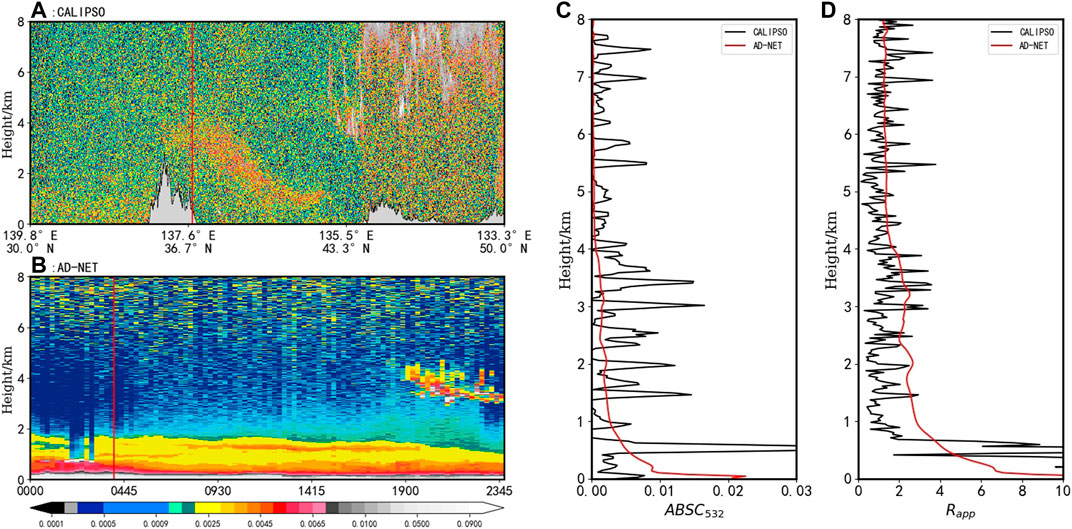
FIGURE 7. The attenuated backscatter coefficient profile from CALIOP (A) and the AD-NET (B), and the comparison of the ABSC532 value (C) and the Rapp value (D) from CALIOP and the AD-NET ground-based lidar in northern Japan on March 14th, 2018 UTC (the solid black line in (A) and (B) shows the nearest position against the ground-based station and the closest time to the CALIPSO transit time, respectively).
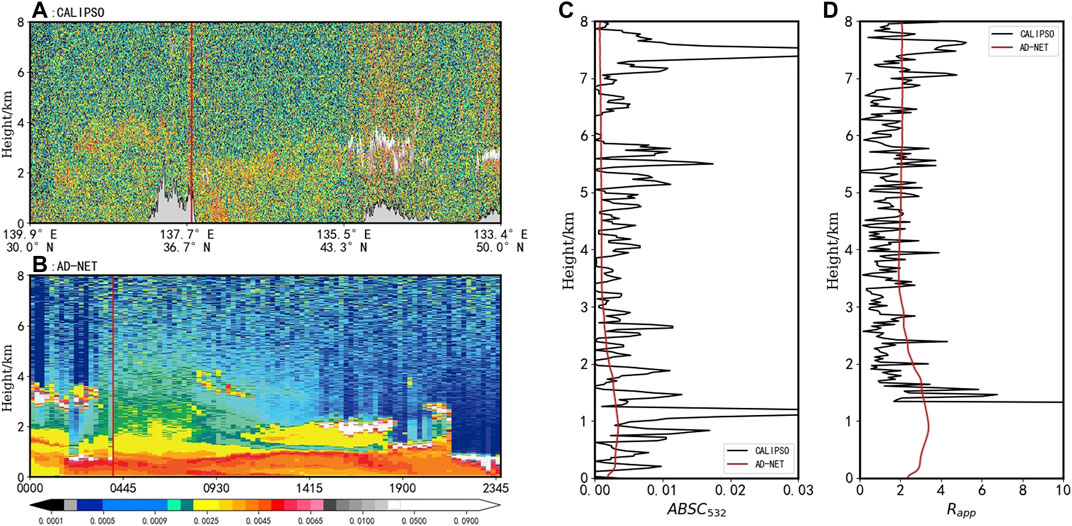
FIGURE 8. Same in Figure 7, while the date is on March 21st, 2020.
In Figure 8, the space-borne lidar profile had detected a relatively high-concentration aerosol layer. In addition, due to the influence of terrain, the Rapp calculated below 1 km caused some errors. At high aerosol concentrations, the Rapp calculated from the AD-NET was basically in the range of the space-borne lidar.
From the ground-based lidar, the AOD and dust AOD reduced significantly in 2020. As displayed in Figure 9, the AOD values of all types of aerosols dropped by 63.21%, and AOD values of the dust aerosols declined by 57.29%. The reduction of the dust aerosols accounted for 34.92% of the total reduction. The proportion of dust reflects that the change in dust between 2020 and 2018 was small. The 4-day average value in 2020 was about 3.76% higher. In 2020, the mean depolarization value of the aerosols was also significantly higher than in 2018. The asphericity of aerosols in 2020 increased by 40.30%, which was consistent with the trend that the overall PDR value in 2020 from the CALIOP data increased by 26.10%. The data of space-borne lidar show the AOD, dust optical depth, dust percent value was all significantly lower than those of the ground-based lidar in 2018. By calculating the dust percent value from the two lidars, it increased by 20% from 2018 to 2020.
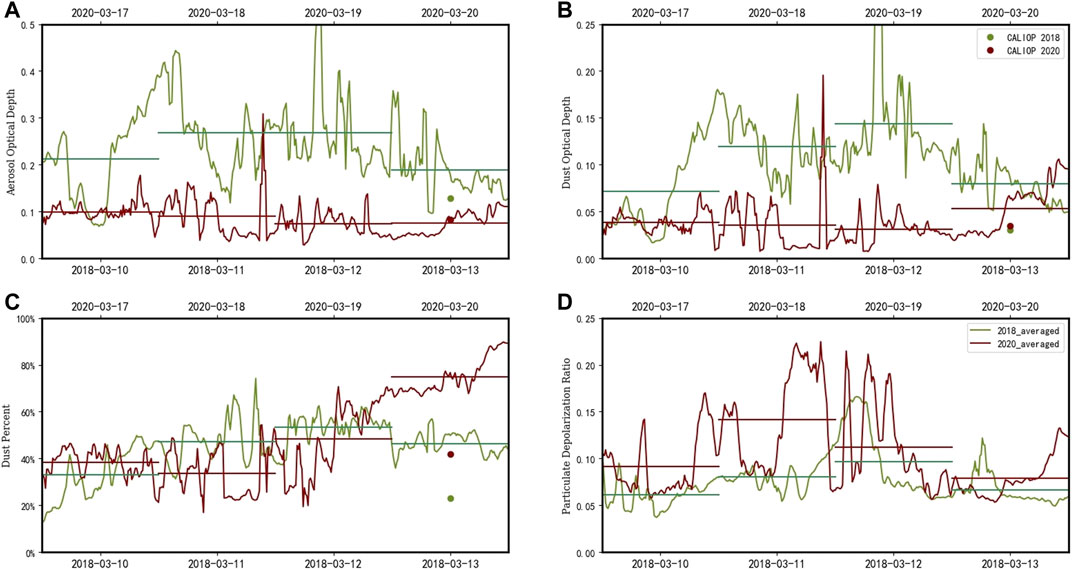
FIGURE 9. The AOD (A), the dust optical depth (B), the percentage of the dust (C) and the particulate depolarization ratio (D) detected by the ground-based lidar (green in 2018 and red in 2020), the horizontal solid line shows the daily mean value respectively in different years. (The green and red dots in the figure indicate the corresponding data obtained from CALIOP in 2018 and 2020. The distance between the railway and the ground-based station is within 100 km)
In 2018 and 2020, the changes in the vertical profile of the extinction coefficient (Figure 10) during the dust process demonstrated that the height with increased aerosol extinction coefficient was mainly below 3 km. At higher altitudes, the extinction coefficient caused by long-range transport changed little, mainly showing a slight downward trend. While near the ground, the AOD values trended upward, especially on the second day of the dust process. Combined with the data of CALIOP, it can be inferred that the increase of AOD was closely related to local emissions and near-surface transmissions such as from the ocean.
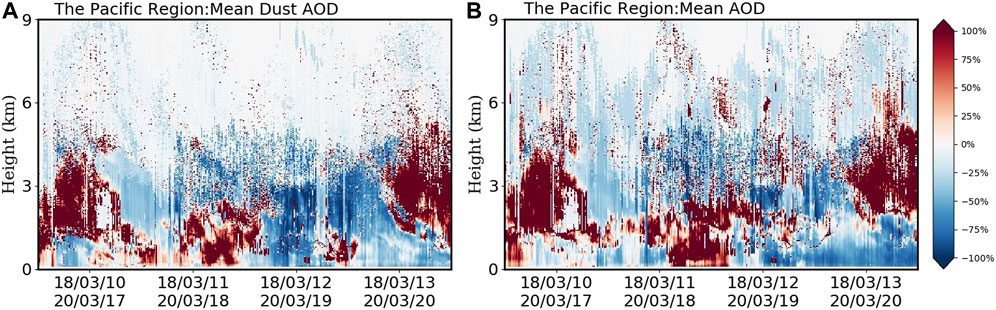
FIGURE 10. The dust and all types of aerosols extinction coefficient changes in 4 days after the break of the dust storm in China between 2018 and 2020.
Many studied on the air quality changes during COVID-19 showed that, during the control period, the content of the main pollutants (including SO2, NOx, PM2.5) had declined significantly (Li et al., 2020; Fan et al., 2021; Travaglio et al., 2021). As shown in Figure 11, the locations of r2 and r2′, r3 and r3′ were similar. Ground air stations and orbits were matched with a radius of 100 km. It was found that the third orbit matches the most stations, with 50 and 125 stations in 2018 and 2020 respectively. Therefore, considering the matching number of ground air quality stations and the full mixing of long-range transport dust with local aerosols, the aerosol optical characteristics observed by the third trajectory from CALIOP were used to analyze.
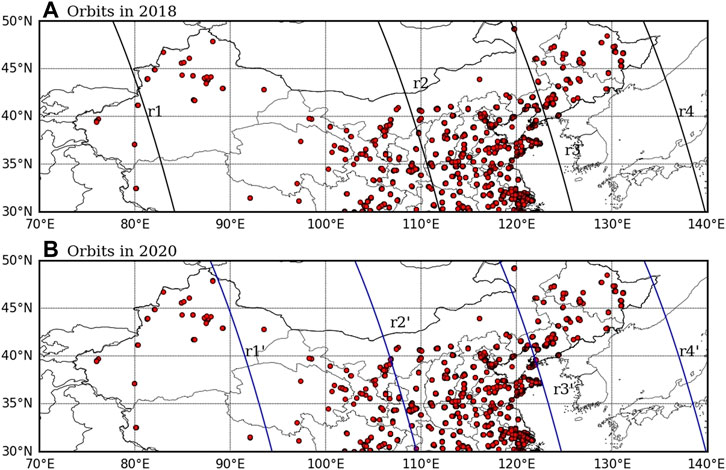
FIGURE 11. The orbits and the distribution of ground air quality observation sites in 2018 (A) and 2020 (B).
In 2018, the correlation between AOD and PM10 above 1 km was positive, and the correlation between polluted dust and pure dust and PM10 was 0.53 and 0.80 respectively. As shown in Table 2, the PDR and CR of dust aerosol changed little in 2020 compared with 2018, and PM10 is also similar. PM2.5, O3, CO, and NO2 decreased by 57.47, 47.54, 29.14, and 8.8% respectively.
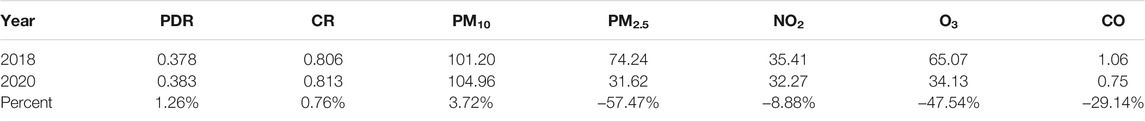
TABLE 2. Changes in the optical properties of the dust aerosols and the local air quality in East China on March 18, 2018 and March 20, 2020.
Figure 12 showed the occurrence frequency and contribution to total AOD of various types of aerosols in 2018 and 2020. Compared with 2018, the polluted dust aerosol decreased significantly and the pure dust increased in 2020.
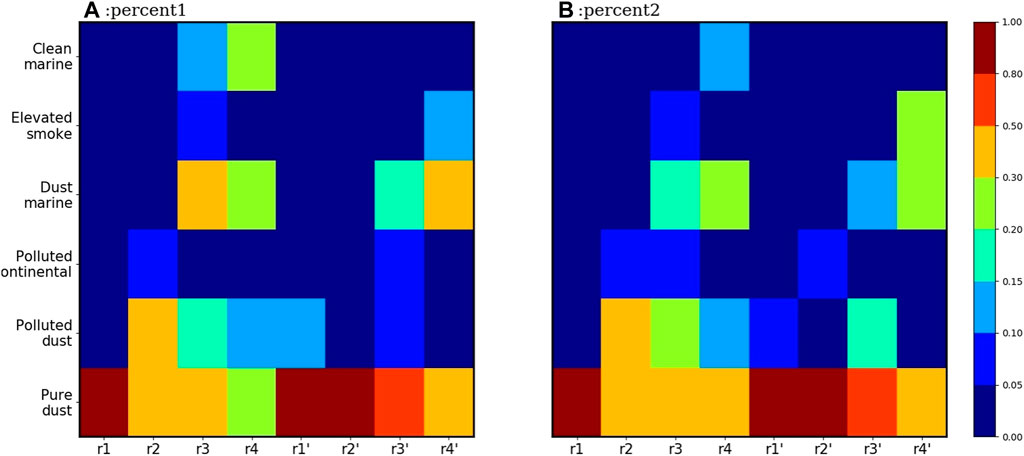
FIGURE 12. The changes in the percent of different types of aerosols calculated by grid numbers (percent1) and AOD values (percent2) on March 10th, 12th to 14th in 2018 (r1, r2, r3, r4), March 18th to 21st in 2020 (r1′, r2′, r3′, r4′).
In summary, for countries in the Pacific region (r4 and r4′), the values of percent1 and percent2 declined in 2020, while the average extinction coefficient increased. During the eastward transport of dust, the increase of polluted dust and polluted continental aerosol was mainly caused by local emission. In 2020, the average extinction coefficient in China decreased, and the difference of extinction coefficient was the largest on r3 and r3′. In the Pacific region, both the values of percent1 and percent2 had little change. The main change is the extinction coefficient, which is twice as much in 2020 as in 2018. That is, the contribution to AOD in the Pacific region was more local aerosol emissions. The change of marine aerosols in 2020 was mainly reflected in the increase of percent1. Another major difference was that the elevated smoke increased significantly in percent1 and percent2.
Space-borne lidar can obtain the AOD values of distinctive types of aerosols at different altitudes. Therefore, we matched the 50 km data of the track attachment. According to CALIOP, in East China, compared with 2018, the average AOD of all types of aerosols at 0–4 km in 2020 decreased by 55.48%, while the AOD of dust aerosols decreased by 43.59%. We assumed that the AOD change rate in 2020 compared to 2018 is r2018, and the dust AOD change is rdust2018. In the two dust weather processes, the meteorological conditions and dust transmission paths were similar. It was assumed that the change of aerosol optical characteristics was caused by human activities under these similar conditions. Therefore, we can calculate the anthropogenic contribution (ANc) using the following equation:
That is, the reduction of anthropogenic activities reduced aerosols of r3′ by 11.90%. Vertically, the reduction of other types of aerosols (except dust aerosol) was 10–25%.
Figure 13 showed the proportion of various aerosols at different altitudes in 2018 and 2020. In general, in 2020, the dust aerosol can reach an altitude of 5 km above the ground. Near the surface and above 3 km, the frequency of dust occurrence is much higher than that in 2018. The increment varied from 2 to 15% below 1 km. The maximum increment was at r2′, followed by r4′. In addition, the proportion of dust increased at r3′. At r4, the dust percent increased by about 10% below 5 km (except for 2–3 km).
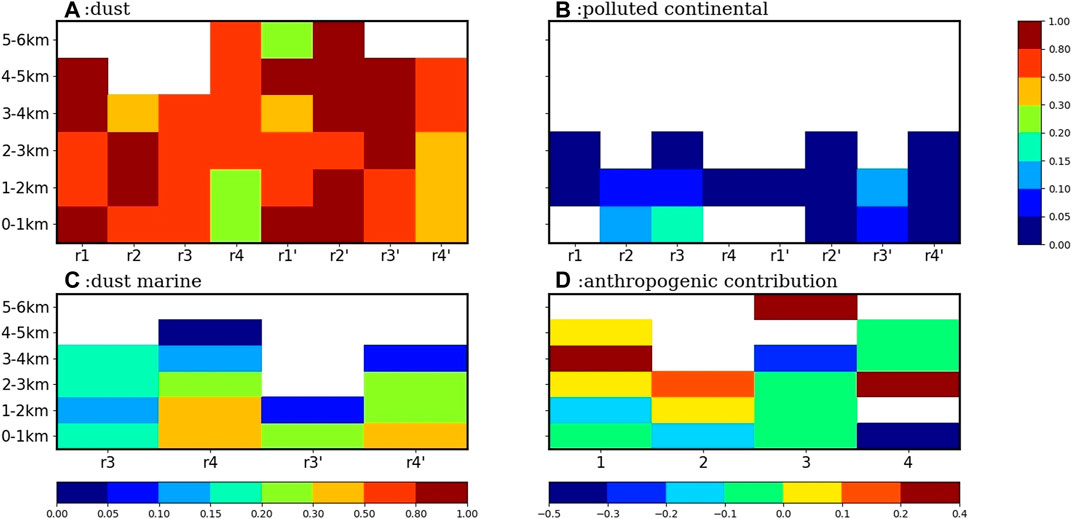
FIGURE 13. Changes in the percent of the dust aerosols (A), polluted continental (B), dust marine (C) and elevated smoke (D) at different height in 2018 (r1, r2, r3, r4) and 2020 (r1′, r2′, r3′, r4′). And the abscissa in Figure (D) represents the four orbits from west to east.
The proportion of polluted continental aerosol decreased significantly. It changed from 2 to 0.5% at r1′, and dropped from 10% to about 0.8% at r2′. At r3′, the location of the polluted continental aerosol was lower. The values at r4 did not change much (accounting for about 1.5% in both years). In 2020, the aerosols located at below 3 km, while it was only located at below 2 km in 2018.
In this article, we compared the changes of aerosol optical properties during two dust weather processes under similar meteorological conditions in March 2018 and 2020. In response to COVID-19 in early 2020, China had implemented many policies to reduce anthropogenic emissions, thereby significantly reducing the emission of local aerosols.
In this context, the size of the pure dust was relatively stable in 2020, while varied widely in 2018 (especially above 2 km). In 2018, the PDR values of the pure dust detected by CALIPSO in the four trajectories changed significantly (i.e., the non-asphericity changed greatly). In contrast, the optical depth of pure dust did not change much in 2020. In terms of particle size, the polluted dust in 2020 was less than that in 2018. The average values of the PDR and CR values in 2018 decreased by 40.33 and 10.56%, respectively, and these values in 2020 were 22.92 and 4.85%, respectively. The changes of AOD values in 2018 and 2020 were mainly reflected in that. Compared with 2018, 2020 was reduced by half. The near-surface AOD value of r4′ was greater than that in 2018. Compared with long-range transportation aerosols, local emissions in the Pacific region contribute more to AOD values. The AE and PDR scatter diagrams of various types of aerosols showed that the distribution of pure dust and polluted dust was more concentrated in 2018, that is, the mixing effect of dust and local aerosol was small in 2020.
In terms of the PDR, CR, and AE values of aerosol particles, the changes in PDR of pure dust in 2018 and 2020 were mainly concentrated at r3, r3′ and r4, r4′, and the change in 2020 was 1.6 times of that in 2018. The change in PDR of polluted dust in 2020 was smaller than that in 2018. The reduction in local emissions in 2020 reduced the mixing effect of pure dust and pollutants. The decay process of the polluted dust from the west also contributed less to the PDR values compared to that in 2018. The change of polluted continental aerosols was similar to the change in pure dust. There was an upward trend in 2018 and a significant downward trend in 2020. It was primarily driven by the reduction in local emissions in 2020 and the main reduction in the mixing process with dust, which was affected by the upstream transmission.
The changes in optical properties of the dust obtained were closely related to the air quality. The increase of the PDR and CR values of dust aerosols reduced the concentrations of PM10 and PM2.5 to a certain extent. The concentration of PM2.5 was reduced by 57.47%. The results also showed that during the dust process in 2020, the dust content in the Pacific Region escalated by 24.29%. The aerosol extinction coefficient value in 2020 in the range of 0–9 km also turned smaller. The increment of the dust concentration from the surface to 4 km was up to 20%. Generally speaking, the two dust weather processes in 2018 and 2020 had similar meteorological fields and transmission paths. The biggest difference was that COVID-19’s control measures in China resulted in a significant reduction in pollutant emissions in 2020, thus further reducing the mixing effect of dust and other types of aerosols during transportation. The reduction of PDR of clean continental aerosol and AOD of polluted dust aerosol also indirectly confirmed the reduction of local pollutant emission.
By analyzing the changes in AOD values of r3 and r3′, anthropogenic activities contributed to an 11.90% reduction. For r4 and r4′, the proportion of the dust did not change much relative to 2018. The reduction contribution of dust aerosols’ AOD values to all types of aerosols’ AOD values was 34.92%. For the AOD values of total aerosols on r4 and r4′, the AOD of 0–1 km layer were 0.078 and 0.122 respectively, an increase of 56.4%, and the AOD of 1–6 km layer was 0.593 and 0.42 respectively, a decrease of 29.2% (Supplementary Table S1). Meanwhile, compared with 2018, China’s near surface pollutants decreased significantly in 2020, indicating that the AOD of the Pacific near surface (0–1 km) in 2020 is mainly contributed by local pollutants.
Based on the observation of spaceborne lidar (CALIOP) and Ground Lidar (AD-NET), combined with the data of ground air quality, we compared the changes in the optical characteristics of various aerosols under similar meteorological background conditions during the dust transport process between 2018 (without anthropogenic control) and 2020 (with anthropogenic control). It demonstrated that due to the reduction of anthropogenic activities caused by COVID-19, the aerosol optical characteristics in the dust weather process were significantly reduced.
The original contributions presented in the study are included in the article/Supplementary Material, further inquiries can be directed to the corresponding authors.
Design and conception, CB and YH; methodology, CB, YH, and JH; calculation, YH; formal analysis, YH and LD; writing—original draft preparation, YH, CB, and LD; writing—review and editing, YH, CB, JH, JG, XG, and ZH. All authors have read and agreed to the published version of the manuscript.
Supported by the National Key Research and Development Program of China (Grant number 2019YFA0606800), the National Natural Science Foundation of China (Grant 41775021), the Fundamental Research Funds for the Central Universities (Grant lzujbky-2019-43).
The authors declare that the research was conducted in the absence of any commercial or financial relationships that could be construed as a potential conflict of interest.
The handling editor declared a past co-authorship with one of the authors ZH.
All claims expressed in this article are solely those of the authors and do not necessarily represent those of their affiliated organizations, or those of the publisher, the editors and the reviewers. Any product that may be evaluated in this article, or claim that may be made by its manufacturer, is not guaranteed or endorsed by the publisher.
The authors would like to express their gratitude to the NASA Langley ASDC center for the CALIOP data; the State Environmental Protection Administration for the air quality data; the National Oceanic and Atmospheric Administration of the United States for the HYSPLIT dispersion model (http://ready.arl.noaa.gov/HYSPLIT.php); the European Center for the ERA-Interim analyzes data; and the AD-NET team for the ground-based lidar data (https://www-lidar.nies.go.jp/AD-Net).
The Supplementary Material for this article can be found online at: https://www.frontiersin.org/articles/10.3389/fenvs.2021.806094/full#supplementary-material
Albrecht, B. A. (1989). Aerosols, Cloud Microphysics, and Fractional Cloudiness. Science 245 (4923), 1227–1230. doi:10.1126/science.245.4923.1227
Chen, B., Huang, J., Minnis, P., Hu, Y., Yi, Y., Liu, Z., et al. (2010). Detection of Dust Aerosol by Combining CALIPSO Active Lidar and Passive IIR Measurements. Atmos. Chem. Phys. 10 (9), 4241–4251. doi:10.5194/acp-10-4241-2010
Chen, B., Song, Z., Pan, F., and Huang, Y. (2022). Obtaining Vertical Distribution of PM2.5 from CALIOP Data and Machine Learning Algorithms. Sci. Total Environ. 805, 150338. doi:10.1016/j.scitotenv.2021.150338
Chen, B., Zhang, P., Zhang, B., Jia, R., Zhang, Z., Wang, T., et al. (2014). An Overview of Passive and Active Dust Detection Methods Using Satellite Measurements. J. Meteorol. Res. 28 (6), 1029–1040. doi:10.1007/s13351-014-4032-4
Chen, Y., Liu, Q., Geng, F., Zhang, H., Cai, C., Xu, T., et al. (2012). Vertical Distribution of Optical and Micro-physical Properties of Ambient Aerosols during Dry Haze Periods in Shanghai. Atmos. Environ. 50, 50–59. doi:10.1016/j.atmosenv.2012.01.002
Dong, L., Chen, B., Huang, Y., Song, Z., and Yang, T. (2021). Analysis on the Characteristics of Air Pollution in China during the COVID-19 Outbreak. Atmosphere 12 (2), 205. doi:10.3390/atmos12020205
Draxler, R. R., and Hess, G. (1997). Description of the HYSPLIT_4 Modeling System. NOAA Technical Memorandum ERL ARL-224. Air Resources Laboratory. Maryland: Silver Spring, 1–24.
Fan, H., Wang, Y., Zhao, C., Yang, Y., Yang, X., Sun, Y., et al. (2021). The Role of Primary Emission and Transboundary Transport in the Air Quality Changes during and after the COVID-19 Lockdown in China. Geophys. Res. Lett. 48 (7), e2020GL091065. doi:10.1029/2020GL091065
Fan, H., Zhao, C., and Yang, Y. (2020). A Comprehensive Analysis of the Spatio-Temporal Variation of Urban Air Pollution in China during 2014–2018. Atmos. Environ. 220, 1352–2310. doi:10.1016/j.atmosenv.2019.117066
Garrett, T. J., and Zhao, C. (2006). Increased Arctic Cloud Longwave Emissivity Associated with Pollution from Mid-latitudes. Nature 440, 787–789. doi:10.1038/nature04636
Ginoux, P., Chin, M., Tegen, I., Prospero, J. M., Holben, B., Dubovik, O., et al. (2001). Sources and Distributions of Dust Aerosols Simulated with the GOCART Model. J. Geophys. Res. 106 (D17), 20255–20273. doi:10.1029/2000jd000053
Ginoux, P., Prospero, J. M., Gill, T. E., Hsu, N. C., and Zhao, M. (2012). Global-scale Attribution of Anthropogenic and Natural Dust Sources and Their Emission Rates Based on MODIS Deep Blue Aerosol Products. Rev. Geophys. 50, 36. doi:10.1029/2012rg000388
Guo, P., Yu, S., Wang, L., Li, P., Li, Z., Mehmood, K., et al. (2019). High-altitude and Long-Range Transport of Aerosols Causing Regional Severe Haze during Extreme Dust Storms Explains Why Afforestation Does Not Prevent Storms. Environ. Chem. Lett. 17 (3), 1333–1340. doi:10.1007/s10311-019-00858-0
Hu, Z., Huang, J., Zhao, C., jin, Q., Ma, Y., and Yang, B. (2020). Modeling Dust Sources, Transport, and Radiative Effects at Different Altitudes over the Tibetan Plateau. Atmos. Chem. Phys. 20, 1507–1529. doi:10.5194/acp-2019-431
Huang, J., Liu, X., Zhang, L., Zhao, Y., Wang, D., Gao, J., et al. (2021). The Oscillation-Outbreaks Characteristic of the COVID-19 Pandemic. Natl. Sci. Rev. 8, nwab100. doi:10.1093/nsr/nwab100
Huang, J., Minnis, P., Chen, B., Huang, Z., Liu, Z., Zhao, Q., et al. (2008). Long‐range Transport and Vertical Structure of Asian Dust from CALIPSO and Surface Measurements during PACDEX. J. Geophys. Res. Atmospheres 113 (D23). doi:10.1029/2008jd010620
Huang, J. P., Liu, J. J., Chen, B., and Nasiri, S. L. (2015). Detection of Anthropogenic Dust Using CALIPSO Lidar Measurements. Atmos. Chem. Phys. 15 (20), 11653–11665. doi:10.5194/acp-15-11653-2015
Huang, J., Zhang, L., Liu, X., Wei, Y., Liu, C., Lian, X., et al. (2020). Global Prediction System for COVID-19 Pandemic. Sci. Bull. 65 (22), 1884–1887. doi:10.1016/j.scib.2020.08.002
Huang, K., Zhuang, G., Li, J., Wang, Q., Sun, Y., Lin, Y., et al. (2010). Mixing of Asian Dust with Pollution Aerosol and the Transformation of Aerosol Components during the Dust Storm over China in spring 2007. J. Geophys. Res. 115, 13. doi:10.1029/2009jd013145
Ju, M. J., Oh, J., and Choi, Y.-H. (2021). Changes in Air Pollution Levels after COVID-19 Outbreak in Korea. Sci. Total Environ. 750, 141521. doi:10.1016/j.scitotenv.2020.141521
Kanatani, K. T., Ito, I., Al-Delaimy, W. K., Adachi, Y., Mathews, W. C., Ramsdell, J. W., et al. (2010). Asian Desert Dust AsthmaDesert Dust Exposure Is Associated with Increased Risk of Asthma Hospitalization in Children. Am. J. Respir. Crit. Care Med. 182 (12), 1475–1481. doi:10.1164/rccm.201002-0296OC
Kim, S.-W., Berthier, S., Raut, J.-C., Chazette, P., Dulac, F., and Yoon, S.-C. (2008). Validation of Aerosol and Cloud Layer Structures from the Space-Borne Lidar CALIOP Using a Ground-Based Lidar in Seoul, Korea. Atmos. Chem. Phys. 8 (13), 3705–3720. doi:10.5194/acp-8-3705-2008
Kokkalis, P., Soupiona, O., Papanikolaou, C.-A., Foskinis, R., Mylonaki, M., Solomos, S., et al. (2021). Radiative Effect and Mixing Processes of a Long-Lasting Dust Event over Athens, Greece, during the COVID-19 Period. Atmosphere 12, 318. doi:10.3390/atmos12030318
Li, L., Li, Q., Huang, L., Wang, Q., Zhu, A., Xu, J., et al. (2020). Air Quality Changes during the COVID-19 Lockdown over the Yangtze River Delta Region: An Insight into the Impact of Human Activity Pattern Changes on Air Pollution Variation. Sci. Total Environ. 732, 139282. doi:10.1016/j.scitotenv.2020.139282
Li, W., Wang, W., Zhou, Y., Ma, Y., Zhang, D., and Sheng, L. J. A. (2018). Occurrence and Reverse Transport of Severe Dust Storms Associated with Synoptic Weather in East Asia. Atmosphere 10 (1), 4. doi:10.3390/atmos10010004
Liu, D., Wang, Z., Liu, Z., Winker, D., and Trepte, C. (2008). A Height Resolved Global View of Dust Aerosols from the First Year CALIPSO Lidar Measurements. J. Geophys. Res. 113 (D16). doi:10.1029/2007jd009776
Liu, Z., Vaughan, M. A., Winker, D. M., Hostetler, C. A., Poole, L. R., Hlavka, D., et al. (2004). Use of Probability Distribution Functions for Discriminating between Cloud and Aerosol in Lidar Backscatter Data. J. Geophys. Res. Atmospheres 109 (D15). doi:10.1029/2004jd004732
Liu, Z., Vaughan, M., Winker, D., Kittaka, C., Getzewich, B., Kuehn, R., et al. (2009). The CALIPSO Lidar Cloud and Aerosol Discrimination: Version 2 Algorithm and Initial Assessment of Performance. J. Atmos. Oceanic Tech. 26 (7), 1198–1213. doi:10.1175/2009jtecha1229.1
Lovrić, M., Pavlović, K., Vuković, M., Grange, S. K., Haberl, M., and Kern, R. (2021). Understanding the True Effects of the COVID-19 Lockdown on Air Pollution by Means of Machine Learning. Environ. Pollut. 274, 115900. doi:10.1016/j.envpol.2020.115900
Mamouri, R.-E., and Ansmann, A. (2017). Potential of polarization/Raman Lidar to Separate fine Dust, Coarse Dust, Maritime, and Anthropogenic Aerosol Profiles. Atmos. Meas. Tech. 10 (9), 3403–3427. doi:10.5194/amt-10-3403-2017
Miao, Y., Che, H., Zhang, X., and Liu, S. (2021). Relationship between Summertime Concurring PM2.5 and O3 Pollution and Boundary Layer Height Differs between Beijing and Shanghai, China. Environ. Pollut. 268, 115775. doi:10.1016/j.envpol.2020.115775
Mofijur, M., Fattah, I. M. R., Alam, M. A., Islam, A. B. M. S., Ong, H. C., Rahman, S. M. A., et al. (2021). Impact of COVID-19 on the Social, Economic, Environmental and Energy Domains: Lessons Learnt from a Global Pandemic. Sustainable Prod. Consumption 26, 343–359. doi:10.1016/j.spc.2020.10.016
Mostafa, M. K., Gamal, G., and Wafiq, A. (2021). The Impact of COVID 19 on Air Pollution Levels and Other Environmental Indicators - A Case Study of Egypt. J. Environ. Manage. 277, 111496. doi:10.1016/j.jenvman.2020.111496
Nicolás, J. F., Castañer, R., Galindo, N., Yubero, E., Crespo, J., and Clemente, A. (2019). Analysis of Aerosol Scattering Properties and PM10 Concentrations at a Mountain Site Influenced by mineral Dust Transport. Atmos. Environ. 213, 250–257. doi:10.1016/j.atmosenv.2019.06.017
Nishizawa, T., Sugimoto, N., Matsui, I., Shimizu, A., Hara, Y., Itsushi, U., et al. (2017). Ground-based Network Observation Using Mie-Raman Lidars and Multi-Wavelength Raman Lidars and Algorithm to Retrieve Distributions of Aerosol Components. J. Quantitative Spectrosc. Radiative Transfer 188, 79–93. doi:10.1016/j.jqsrt.2016.06.031
Pan, X., Uno, I., Hara, Y., Kuribayashi, M., Kobayashi, H., Sugimoto, N., et al. (2015). Observation of the Simultaneous Transport of Asian mineral Dust Aerosols with Anthropogenic Pollutants Using a POPC during a Long‐lasting Dust Event in Late spring 2014. Geophys. Res. Lett. 42 (5), 1593–1598. doi:10.1002/2014gl062491
Shao, Y., Wyrwoll, K.-H., Chappell, A., Huang, J., Lin, Z., McTainsh, G. H., et al. (2011). Dust Cycle: An Emerging Core Theme in Earth System Science. Aeolian Res. 2 (4), 181–204. doi:10.1016/j.aeolia.2011.02.001
Shimizu, A., Sugimoto, N., Matsui, I., Arao, K., Uno, I., Murayama, T., et al. (2004). Continuous Observations of Asian Dust and Other Aerosols by Polarization Lidars in China and Japan during ACE-Asia. J. Geophys. Res. 109 (D19), 14. doi:10.1029/2002jd003253
Sicard, P., De Marco, A., Agathokleous, E., Feng, Z., Xu, X., Paoletti, E., et al. (2020). Amplified Ozone Pollution in Cities during the COVID-19 Lockdown. Sci. Total Environ. 735, 139542. doi:10.1016/j.scitotenv.2020.139542
Song, Z., Chen, B., Huang, Y., Dong, L., and Yang, T. (2021). Estimation of PM2.5 Concentration in China Using Linear Hybrid Machine Learning Model. Atmos. Meas. Tech. 14, 5333–5347. doi:10.5194/amt-14-5333-2021
Stein, A. F., Draxler, R. R., Rolph, G. D., Stunder, B. J. B., Cohen, M. D., and Ngan, F. (2015). NOAA's HYSPLIT Atmospheric Transport and Dispersion Modeling System. Bull. Am. Meteorol. Soc. 96 (12), 2059–2077. doi:10.1175/bams-d-14-00110.1
Sugimoto, N., Matsui, I., Shimizu, A., Nishizawa, T., Hara, Y., and Uno, I. (2010), Lidar Network Observation of Tropospheric Aerosols, paper presented at Lidar Remote Sensing for Environmental Monitoring XI.doi:10.1117/12.869900
Sugimoto, N., Nishizawa, T., Shimizu, A., Matsui, I., and Jin, Y. (2014). “Characterization of Aerosols in East Asia with the Asian Dust and Aerosol Lidar Observation Network (AD-Net),” in paper presented at Conference on Lidar Remote Sensing for Environmental Monitoring XIV, 2014 Oct 14-15 (Beijing: PEOPLES R CHINA). doi:10.1117/12.2069892
Sugimoto, N., Nishizawa, T., Shimizu, A., Matsui, I., and Kobayashi, H. (2015). Detection of Internally Mixed Asian Dust with Air Pollution Aerosols Using a Polarization Optical Particle Counter and a Polarization-Sensitive Two-Wavelength Lidar. J. Quantitative Spectrosc. Radiative Transfer 150, 107–113. doi:10.1016/j.jqsrt.2014.08.003
Sugimoto, N., Shimizu, A., Matsui, I., and Nishikawa, M. (2016). A Method for Estimating the Fraction of mineral Dust in Particulate Matter Using PM2.5-To-PM10 Ratios. Particuology 28, 114–120. doi:10.1016/j.partic.2015.09.005
Tian, P., Zhang, L., Ma, J., Tang, K., Xu, L., Wang, Y., et al. (2018). Radiative Absorption Enhancement of Dust Mixed with Anthropogenic Pollution over East Asia. Atmos. Chem. Phys. 18 (11), 7815–7825. doi:10.5194/acp-18-7815-2018
Tian, X., Ma, H., Liu, D., Wang, Y., Wang, Z., Wang, B., et al. (2019). Optimized Weighting Function for IPDA Lidar Concerning the Lower Layer CO2 Concentration Fluctuation. J. Quantitative Spectrosc. Radiative Transfer 224, 120–124. doi:10.1016/j.jqsrt.2018.11.009
Travaglio, M., Yu, Y., Popovic, R., Selley, L., Leal, N. S., and Martins, L. M. (2021). Links between Air Pollution and COVID-19 in England. Environ. Pollut. 268, 115859. doi:10.1016/j.envpol.2020.115859
Twomey, S. (1977). The Influence of Pollution on the Shortwave Albedo of Clouds. J. Atmos. Sci. 34 (7), 1149–1152. doi:10.1175/1520-0469(1977)034<1149:tiopot>2.0.co;2
Uno, I., Eguchi, K., Yumimoto, K., Takemura, T., Shimizu, A., Uematsu, M., et al. (2009). Asian Dust Transported One Full Circuit Around the globe. Nat. Geosci 2 (8), 557–560. doi:10.1038/ngeo583
Wang, W., Huang, J., Minnis, P., Hu, Y., Li, J., Huang, Z., et al. (2010). Dusty Cloud Properties and Radiative Forcing over Dust Source and Downwind Regions Derived from A‐Train Data during the Pacific Dust Experiment. J. Geophys. Res. Atmospheres 115 (D4). doi:10.1029/2010jd014109
Wang, W., Luo, C., Sheng, L., Zhao, C., Zhou, Y., and Chen, Y. (2021). Effects of Biomass Burning on Chlorophyll-A Concentration and Particulate Organic Carbon in the Subarctic North Pacific Ocean Based on Satellite Observations and WRF-Chem Model Simulations: A Case Study. Atmos. Res. 254, 105526. doi:10.1016/j.atmosres.2021.105526
Wang, Z., Uno, I., Yumimoto, K., Pan, X., Chen, X., Li, J., et al. (2019). Dust Heterogeneous Reactions during Long-Range Transport of a Severe Dust Storm in May 2017 over East Asia. Atmosphere 10 (11), 680. doi:10.3390/atmos10110680
Winker, D. M., Hunt, W. H., and Hostetler, C. A. (2004). Status and Performance of the CALIOP Lidar. Laser Radar Tech. Atmos. Sensing 5575, 8–15. doi:10.1117/12.571955
Winker, D. M., Hunt, W. H., and McGill, M. J. (2007). Initial Performance Assessment of CALIOP. Geophys. Res. Lett. 34 (19), 5. doi:10.1029/2007gl030135
Yang, X., Wang, Y., Zhao, C., Fan, H., Yang, Y., Chi, Y., et al. (2021b). Health Risk and Disease burden Attributable to Long-Term Global fine-mode Particles. Chemosphere 287 (Pt4), 132435. doi:10.1016/j.chemosphere.2021.132435
Yang, X., Zhao, C., Yang, Y., and Fan, H. (2021a). Long-term Multi-Source Data Analysis about the Characteristics of Aerosol Optical Properties and Types over Australia. Atmos. Chem. Phys. 21, 3803–3825. doi:10.5194/acp-21-3803-2021
Yang, Y., Zhao, C., Wang, Q., Cong, Z., Yang, X., and Fan, H. (2021c). Aerosol Characteristics at the Three Poles of the Earth as Characterized by Cloud-Aerosol Lidar and Infrared Pathfinder Satellite Observations. Atmos. Chem. Phys. 21, 4849–4868. doi:10.5194/acp-21-4849-2021
Zhang, T., Che, H., Gong, Z., Wang, Y., and Yang, Y. J. A. P. R. (2020). The Dominant Mechanism of the Explosive Rise of PM2.5 after Significant Pollution Emissions Reduction in Beijing from 2017 to the COVID-19 Pandemic in 2020. Atmos. Pollut. Res. 12 (2), 272–281.
Zhang, Z., Huang, J., Chen, B., Yi, Y., Liu, J., Bi, J., et al. (2019). Three‐Year Continuous Observation of Pure and Polluted Dust Aerosols over Northwest China Using the Ground‐Based Lidar and Sun Photometer Data. J. Geophys. Res. Atmos. 124 (2), 1118–1131. doi:10.1029/2018jd028957
Zhao, C., and Garrett, T. J. (2015). Effects of Arctic Haze on Surface Cloud Radiative Forcing. Geophys. Res. Lett. 42, 557–564. doi:10.1002/2014GL062015
Keywords: lidar, dust, anthropogenic control, COVID-19, historical similar meteorological fields
Citation: Chen B, Huang Y, Huang J, Dong L, Guan X, Ge J and Hu Z (2021) Using Lidar and Historical Similar Meteorological Fields to Evaluate the Impact of Anthropogenic Control on Dust Weather During COVID-19. Front. Environ. Sci. 9:806094. doi: 10.3389/fenvs.2021.806094
Received: 31 October 2021; Accepted: 23 November 2021;
Published: 08 December 2021.
Edited by:
Qinjian Jin, University of Kansas, United StatesReviewed by:
Chuanfeng Zhao, Beijing Normal University, ChinaCopyright © 2021 Chen, Huang, Huang, Dong, Guan, Ge and Hu. This is an open-access article distributed under the terms of the Creative Commons Attribution License (CC BY). The use, distribution or reproduction in other forums is permitted, provided the original author(s) and the copyright owner(s) are credited and that the original publication in this journal is cited, in accordance with accepted academic practice. No use, distribution or reproduction is permitted which does not comply with these terms.
*Correspondence: Zhiyuan Hu, aHV6aGl5dWFuQG1haWwuc3lzdS5lZHUuY24=
Disclaimer: All claims expressed in this article are solely those of the authors and do not necessarily represent those of their affiliated organizations, or those of the publisher, the editors and the reviewers. Any product that may be evaluated in this article or claim that may be made by its manufacturer is not guaranteed or endorsed by the publisher.
Research integrity at Frontiers
Learn more about the work of our research integrity team to safeguard the quality of each article we publish.