 Hui Liu
 Liyuan Wei1,2†
 Chang Chen
 Zhen Wang
- 1College of Resources and Environment, Huazhong Agricultural University, Wuhan, China
- 2School of Resource and Environmental Sciences, Wuhan University, Wuhan, China
The increasingly urbanized population and corresponding consumption changes are causing the household water footprint to rise. However, the quantity of these changes remains to be determined. Here, we combine a two-stage factor reversible structural decomposition analysis with multi-regional input-output analysis to explore the hidden driving forces of the changes in the household water footprint and the impacts of urbanization and consumption patterns on the cross-regional water footprint from 2012 to 2017. The results show that the national household water footprint dropped from 292.33 billion m3 to 291.18 billion m3 and exhibited a decreasing trend in the east and an increasing trend in the west; the driving factors were classified and ranked as technological level (−75.6 billion m3), consumption patterns (52.6 billion m3) and population (21.8 billion m3). Among all driving factors, both urbanization and the associated consumption pattern transformation caused an increase in the cross-regional water footprint, except in several developed provinces, such as Shanghai and Guangdong, which suggested that decoupling might exist between economic development and the water footprint. Overall, heterogeneous policies were suggested to be made according to local water resource endowments and their positions in the production chain. Our results clarify the effects of different socio-economic factors on the cross-regional water footprint during the process of urbanization and provide refined insights for future water conservation.
1 Introduction
China has been experiencing rapid urbanization and modernization. The urbanization rate increased from 35% in 2000 to 60.6% in 2019, with an average annual growth rate of 1.3%, and it is expected to reach 70% in 2030 (The State Council, 2016). Water is regarded as a vital strategic resource (Deng et al., 2021). Nevertheless, China is facing serious water scarcity and more than 300 Chinese cities are short of water (Dong et al., 2014). Statistics show that water resources are unevenly distributed in China. For example, North China supports 50% of the Chinese population with only 20% of the total water resources (Guan et al., 2014). Urbanization has a significant proven impact on regional water consumption (Gober and Kirkwood, 2010; Ren et al., 2018). Research shows that the direct water consumption per capita of urban residents is twice that of rural residents (Feng et al., 2012). The urbanization process not only directly influences water use locally, but may also indirectly affect water use in other regions through the increased goods and services sourced from other regions. To provide these goods and services, those regions would use water during the production process. In other words, urbanization may have an unexpected cross-regional water footprint (Xiong et al., 2020). With the improvement in infrastructure and the implementation of domestic and international dual circulation policies, commodities and services will circulate more smoothly, such that the impact of urbanization on the cross-regional water footprint might be magnified, which could affect the regional balance between the supply and demand of water resources, even worsening the regional water scarcity (Zhang et al., 2019). In this context, determining the cross-regional water footprint caused by urbanization and consumption patterns is of great significance to national water security and sustainable development.
The water footprint concept was proposed by Hoekstra et al. (2011), which was usually considered as a consumption-based environmental indicator and refers to the total volume of water resources required in the production process of products and services by individual, region and country over some time, measured at the place where the product was virtually produced (Zhang et al., 2017). Virtual water flow is essentially the water footprint of the goods or services that are imported or exported between regions by trade. The water footprint combined with environmental input-output analysis (EIOA) can identify the “hidden” water consumption along the whole supply chain. Many scholars have studied the impact of trade in commodities and services on the water footprint of single regions in China, such as the provincial level (Zhang et al., 2011; Han et al., 2015), basin level (Feng et al., 2012; Okadera et al., 2014; White et al., 2015), national level (Feng et al., 2011; Dong et al., 2014; Xu et al., 2020) and global level (Mekonnen and Hoekstra, 2011; Mekonnen and Gerbens-Leenes, 2020). Other scholars focused on virtual water flows between multiple regions. For example, Feng et al. (2014) introduced water stress index and analyzed virtual scarce water flows among 30 provinces in 2007. Zhao et al. (2018) assessed the scarce water transferred through interprovincial trade of China in 2010. Zhang et al. (2018) clarified the water footprint and inter-regional virtual water flow relationship of China in both year 2007 and 2010. However, most of these studies only conducted static snapshot of multi-regional water footprint accounting. Relatively fewer studies explore the drivers of water footprint dynamics in different years. Particularly, current studies overlooked the driving effect of local socioeconomic drivers on cross-regional water footprint changes.
More recently, growing literatures tend to applied the Gravity-law Model (Duarte et al., 2019), Decomposition Analysis (Duarte et al., 2014), Multivariate Regression Analyses (Konar et al., 2011), Commonality Analysis (Tamea et al., 2014), and other methods (Tuninetti et al., 2017; Sun et al., 2021) to excavate the driving factors of water footprint. Notably, Structural Decomposition Analysis (SDA) is recognized as a useful technique to quantify the economic influence on changes in an aggregate indicator during the period (Yang et al., 2016). It is usually combined with input-output (IO) tables and analyses the effect of indirect demand, production structure and final demand on water footprint (Yang et al., 2015). Wang et al. (2016) revealed that technology and economic structure were the main driving forces of China’s water footprint from 1997 to 2007, and Yang et al. (2016) developed a dynamic SDA method to quantify the determinants of the growing water use in China. The results indicated that the consumption level is the dominant factor influencing China’s water use growth, and water-saving technology and final demand pattern transformation can largely offset the water use growth. Fan et al. (2019) used SDA to drug out the driving factors of three types of final demands and found that GDP per capita played a decisive role in the rise in water use. In general, the driving factors can be classified as relating to the economy (such as GDP, industrial structure and technology, etc.) (Duarte et al., 2019), society (such as population, urbanization, and institution (Tamea et al., 2014), ecology (such as water availability, productivity potential, and climate) (Konar et al., 2013) and geography (such as distance) (Tuninetti et al., 2017). Few studies explicitly focused on urbanization as an individual factor driving the water footprint, except for aspects of energy and carbon emissions. For example, Poumanyvong & Kaneko, (2010) studied the impact of urbanization on the energy consumption of economies at different levels of development; Wang et al. (2019) studied the impact of consumption patterns and urbanization on China’s carbon emissions. Furthermore, Hong et al. (2020) clarified the spatial spillover characteristics of urbanization on cross-regional energy consumption.
Regarding the previous review, there are still several limitations: 1) the existing multi-regional input-output studies were mainly snapshot-based single year studies, or fewer studies paid attentions to drivers of cross-regional water footprint; 2) when scholars dug out the water footprint diving forces, they always paid attention to the population, industrial structure and other economic determinates, but have not explicitly examined urbanization as an individual driving factor.
Based on the above, this paper proposes a two-stage factor-reversible structural decomposition methodological framework to quantify the impact of urbanization and consumption patterns on the cross-regional water footprint. We especially focus on the migrating population from rural to urban areas and the corresponding changes in the consumption pattern at the provincial level. To the best of our knowledge, this is the first paper to study the effect of urbanization on the regional water footprint, which provides new policy insights and policy support to alleviate water use unbalance in China. The rest of the paper is organized as follows: Section 2 introduces the methodology and data sources, Section 3 describes the results, Section 4 provides relevant discussions (including policy recommendations), and Section 5 gives the main conclusions.
2. Methodology and Data
2.1 Environmentally Extended Multi-Regional Input-Output (EE-MRIO) Model
The input-output (IO) model, which is based on the Leontief model, is recognized as an analysis tool to explain the relationships between different sectors from an economic perspective. However, the traditional single region input-output table can explain trade flow only in a single region. To elaborate interregional flows of goods and services, a multiregional input-output (MRIO) model is developed, which can fully reflect the economic connections between sectors in the same and different regions. Typically, the raw balance in the MRIO model can be expressed as:
where
To solve formula 2, we can obtain the following:
where I, A, L, and Y represent the identity matrix, technical coefficient matrix (intermediate use divided by the total output, representing the direct input in sectors required by unit of output), Leontief inverse matrix (the production structure, representing the direct and indirect input in sectors required by unit of output), and final demand (including household consumption, government expenditures, investment, and net export), respectively.
An environmentally extended MRIO (EE-MRIO) model extends the MRIO by calculating the environmental flows of each sector. A water use extended MRIO model can comprehensively characterize the water footprint relationship between different regional economies. It can be used to quantify the water footprint of each region from the consumption of specific goods or services, as well as the transfer of the water footprint through interregional trade. With further extension by environmental factors, the following equation is obtained:
where W represents each province’s sectoral water consumption and d is regarded as the direct water intensity, namely, water withdrawal per unit output). Here, we focus on the effect of urbanization on total water use. Therefore, rural and urban household consumption is considered in Eq. 3:
where
2.2 Two-Stage Structural Decomposition Analysis
We propose a two-stage structural decomposition model to reveal the drivers of the household water footprint in China. Several methods are usually contained in SDA, such as traditional ad hoc decomposition, the D&L method (Dietzenbacher and Los, 1998), the S/S method (Shapley, 1953), and the MRCI method (Chung and Rhee, 2001). Additive decomposition is the most common form of SDA. The result of D&L is cumbersome when the number of main factors is larger than 5. S/S and MRIC leave a residual term in the results and fail the factor-reversal test (Wei et al., 2020).To solve the problem of factor irreversibility, Sun, (1998) proposed a complete structural decomposition method that distributed the residuals evenly among the factors. Based on our previous studies (Wang et al., 2019; Wei et al., 2020), we developed a two-stage complete decomposition method to identify drivers of the household water footprint in China.
In the first stage, the household water footprint over the period [0,t] can be decomposed as follows:
Then, the contributions of changes in d, L and
However, the effects of urbanization and consumption patterns remain unclear. Then, in the second stage, we further decompose
where
Thus, using Eqs 5–9, the increment in the household water footprint can be further decomposed as follows:
where
2.3 Data Sources
Three types of data are needed in this study: MRIO tables in 2012 and 2017, the annual water footprint of the sectors of each province, and the rural-to-urban migration data of each province.
The 2012 and 2017 MRIO tables were collected from the CEADs dataset (CEADs, 2021). We adjusted the 2017 MRIO table to constant 2012 prices to eliminate the impact of inflation. Price indexes from 2012 to 2017 were collected from provincial statistical yearbooks (National Bureau of Statistics of China, 2018).
Water withdrawal data and water use data were collected from various sources. In this study, we focused on “blue water” as defined in Yang et al. (2015). For agriculture, water use data of each province were obtained from the China Statistical Yearbook (Ministry of Water Resources: National Bureau of Statistics, 2013; National Bureau of Statistics of China, 2018). Provincial water withdrawals in the industry with detailed sectoral data for 2012 and 2017 were estimated from China Economic Census Yearbook (National Bureau of Statistics of China, 2008) in proportion to sectoral water withdrawal data, considering the economic effect on the sector structure by multiplying GDP rates and checking for accuracy with the gross industrial water use data in the current year. Water use data in the construction and service industries were collected from the Bulletin of the First National Census for Water conducted by the Ministry of Water Resources of China in 2011 and estimated by allocating the water use in a production activity based on the proportions of intermediate inputs from the “water production and supply” sector to different economic sectors in the input-output tables. Sector abbreviations can be found in the Supplementary Table S1.
It is worth noting that rural-to-urban migration cannot be directly obtained from statistical yearbooks. Therefore, we need to estimate the natural birth rates of the urban and rural populations and then extrapolate rural-to-urban migration from the statistical data. Limited by the availability of relevant data, we hypothesize that the rural birth rate is 0.4% higher than the urban birth rate of reference, according to the study of (Cui, 2011). The migrating population can be calculated by the difference between natural population data and statistical data. In addition, the natural birth rate, death rate and total population of urban and rural areas were obtained from the Statistical Yearbook.
Due to data availability, we targeted our study at the provincial scale. The study area includes 22 provinces, five autonomous regions, four municipalities directly under the Central Government, Hong Kong, Macau, and Taiwan. For convenience, we refer to all of these as provinces in the rest of the paper.
3 Results
3.1 Overall Changes in Household Water Footprint, Urbanization, and Consumption Patterns
We calculated the changes in the water footprint in the household sector from 2012 to 2017. Overall, the household water footprint in mainland China dropped from 292.33 billion m3 in 2012 to 291.18 billion m3 in 2017, showing a slight decrement of approximately 1.15 billion m3. However, Figure 1 reveals that different provinces represented different household water footprint changes. Most provinces displayed an increasing household water footprint trend during the study period, in which Jiangsu and Hubei ranked at the top, with increments of 5.6 and 5.5 billion m3 of household water, respectively. In addition, 12 provinces showed a decreasing trend, in which Guangdong, Shanghai and Shandong obtained the largest water footprint decrements of approximately 14.5, 13.5, and 9.1 billion m3, respectively. In general, household water footprint values showed a downward trend in the eastern coastal region and an upward trend in the central and western regions. In addition, household water footprint of sectors in each province can be found in Supplementary Table S2.
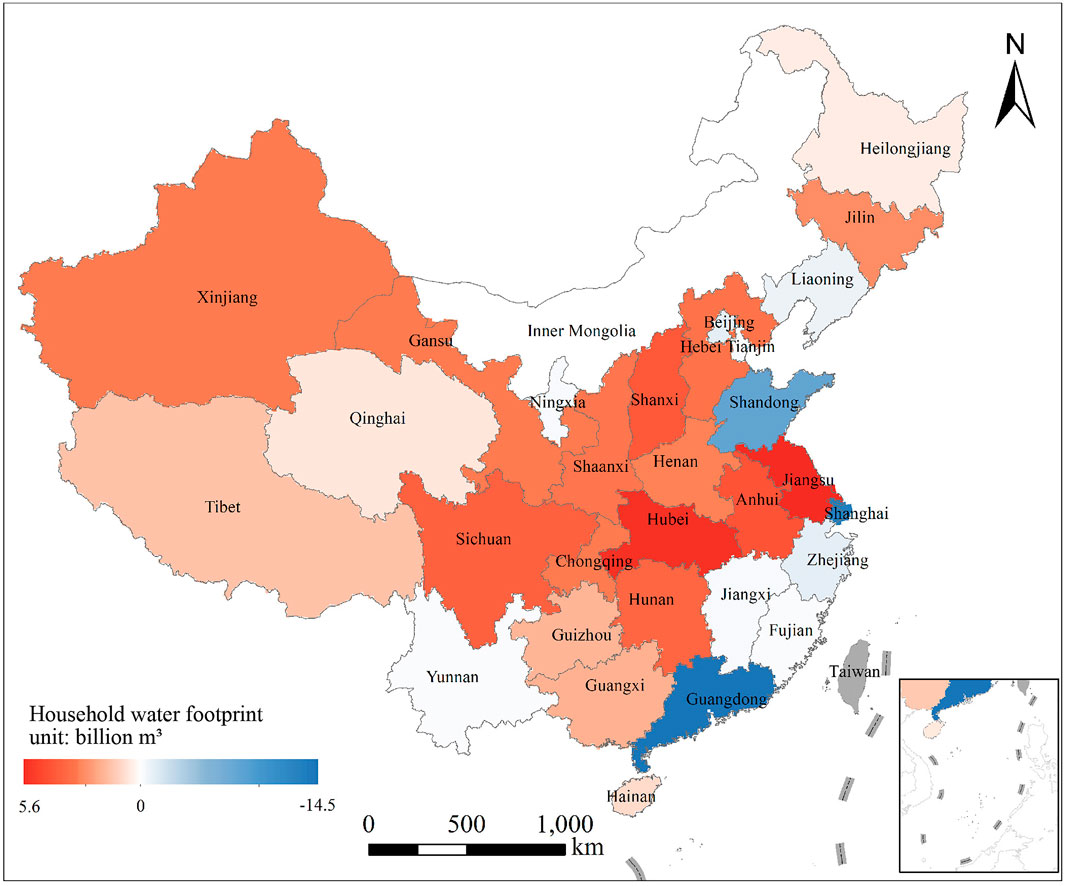
FIGURE 1. The changes in the household water footprints among provinces.
Over the studied period, China’s urbanization rate rose from 53% in 2012 to 59% in 2017, with a 1.2% annual growth rate, which was significantly higher than 0.37%, the value of the world average growth rate (Department of economic and social affairs of United nation, 2018). A total of 101.65 million people moved from rural to urban areas from 2012 to 2017. Figure 2 shows the urbanization rates among provinces, and the dots represent the annual gradient of the urbanization rate. Most provinces exhibited increasing urbanization rates, except for Shanghai, which exhibited a “counter-urbanization” phenomenon, with the urbanization rate dropping from 89.3 to 87.7%. The urbanization rates of provinces exhibited obvious polarization. Eastern coastal provinces showed a higher urbanization rate than inland provinces. Nevertheless, inland provinces had a more rapid urbanization process than coastal provinces, which meant that the disparities in the urbanization process among provinces were diminishing, and China’s economic development was becoming more balanced.
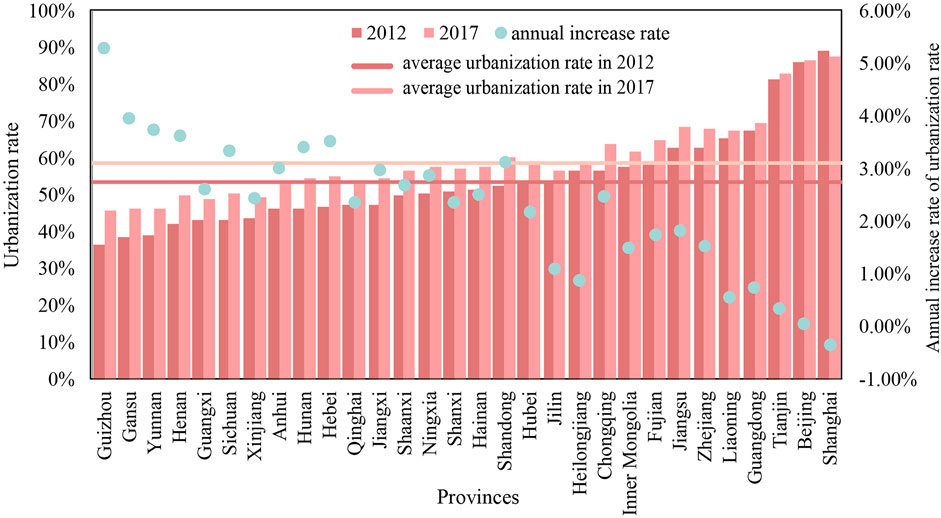
FIGURE 2. The changes in urbanization rates among provinces from 2012 to 2017.
Consumption patterns change when people migrate from rural to urban areas because of the significant differences in infrastructure, income distribution, material basis and lifestyle. Taking the consumption level as an example, Figure 3 shows that obvious growth occurred in both rural and urban areas from 2012 to 2017, while the per capita rural consumption level increased from 1,159 dollars in 2012 to 1,927 dollars in 2017, with an annual growth rate of 13.2%, and the per capita urban consumption level increased from 2,837 dollars to 3,993 dollars, with an annual growth rate of 8.1%. In addition, the gaps between rural and urban consumption levels (calculated by urban per capital consumption level minus the rural per capital consumption level) exhibited obvious regional differences. The value of the gaps among provinces ranged from −83.4 to 55.9%, with an average of −28.6% during the study period. Overall, the gaps were enlarging in most provinces, except for developed provinces (such as Shanghai and Guangdong) and less-developed provinces (such as Jilin), where obvious declines can be observed in Figure 3C.
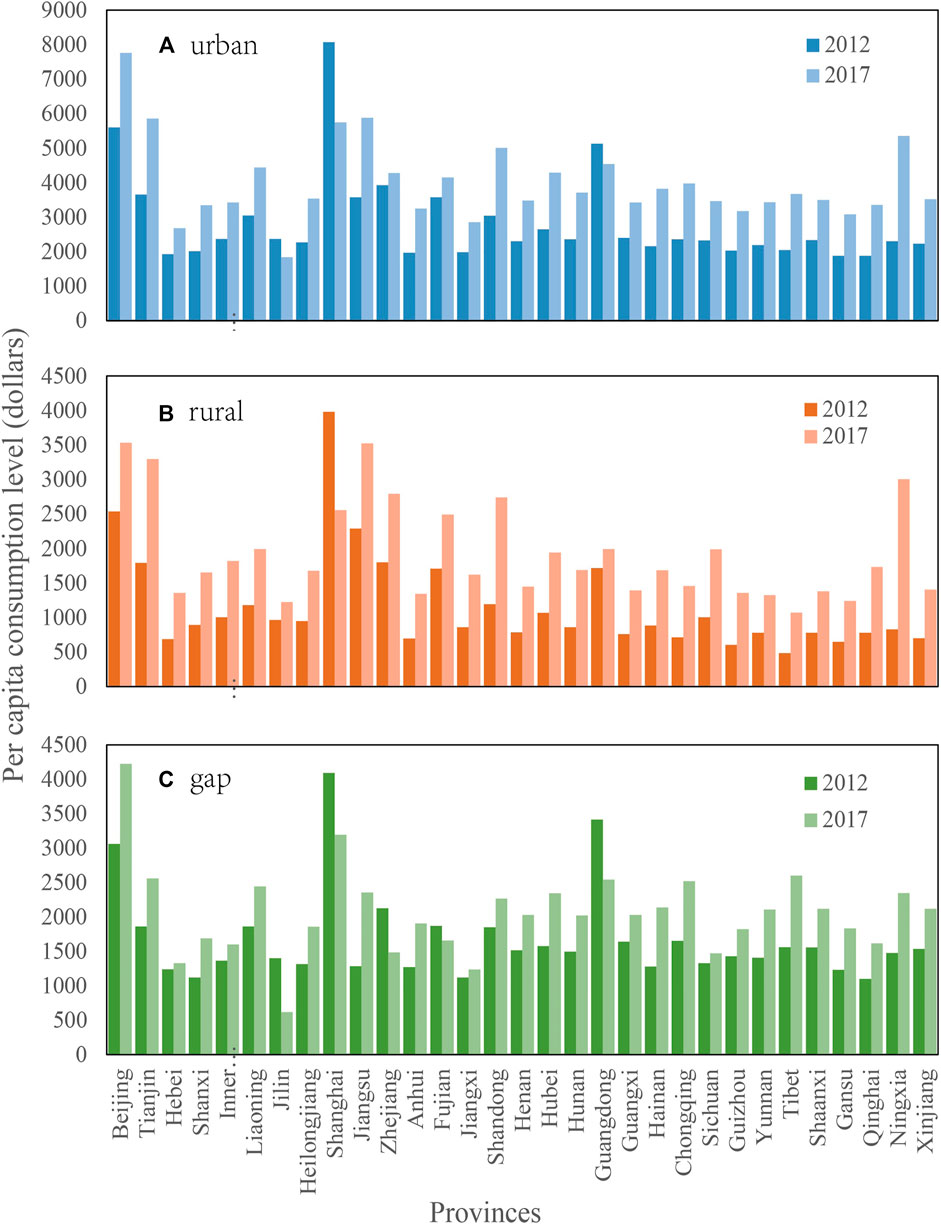
FIGURE 3. Per capita urban consumption levels among provinces in 2012 and 2017(A), per capita rural consumption levels among provinces in 2012 and 2017(B), and the gaps between urban and rural per capita consumption levels in 2012 and 2017(C).
3.2 Contributions of Driving Factors to the Household Water Footprint
Figure 4 shows the contributions of the various driving factors to the household water footprints of the provinces; the dots represent the total changes. Here, we divide the driving factors into three categories: technological level (water use intensity, production structure), consumption patterns (rural consumption pattern, urban consumption pattern), and population (rural population, urban population, and urbanized population). The contributions of these three categories were ranked as technological level (−75.6 billion m3), consumption patterns (52.6 billion m3), and population (21.8 billion m3).
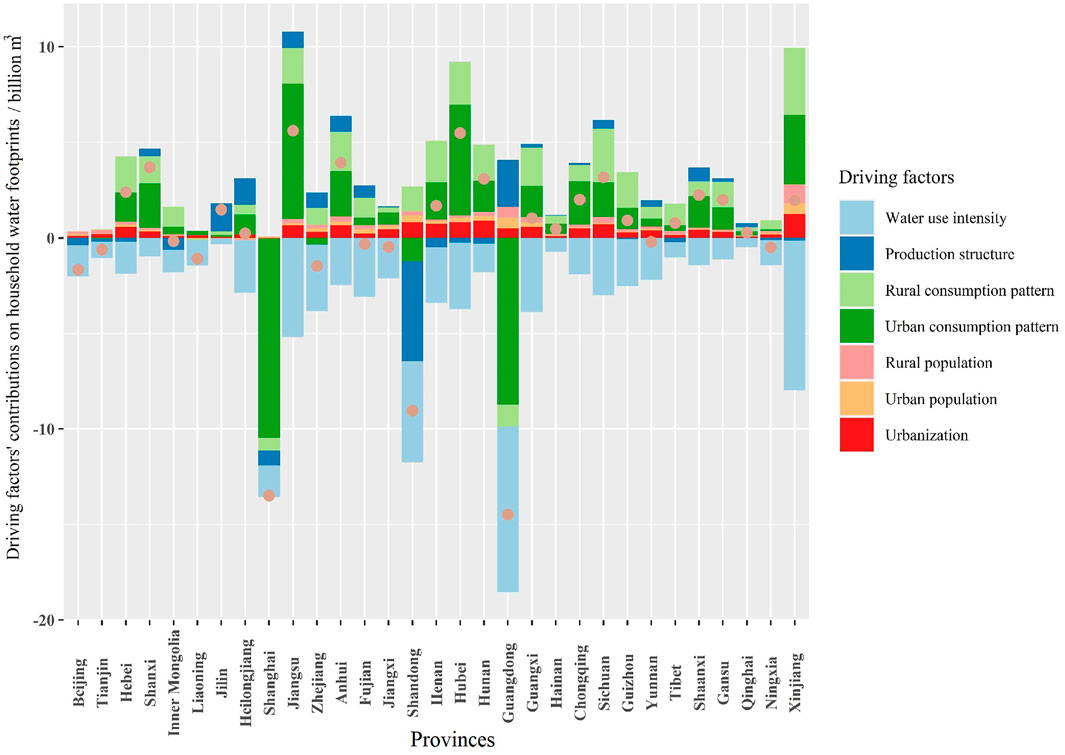
FIGURE 4. The contribution of driving factors to the provincial household water footprints.
At the technological level, the water use intensity of each province showed a downward trend, indicating that the water efficiency of each province improved during the study period. The greatest reductions can be seen in several relatively developed provinces, such as Guangdong (−8.6 billion m3), Shandong (−5.3 billion m3), Jiangsu (−5.2 billion m3) and Zhejiang (−3.5 billion m3), and agricultural provinces, such as Xinjiang (−7.8 billion m3) and Guangxi (−3.9 billion m3). On the whole, water intensity had a greater impact on the south than on the north because the rich water resources in the south led to a more water-intensive lifestyle and a greater potential for water-saving. The production structure contributed to a relatively slight impact but showed marked regional differences. The negative effect basically played a role in the northern provinces, such as Shandong (−5.2 billion m3), Inner Mongolia (−0.63 billion m3), Henan (−0.50 billion m3), and Beijing (−0.37 billion m3). That is, the water-saving performance of the industrial structure of northern provinces is better than that of southern provinces, possibly because the high water shortage rate in these provinces forces industries to make structural changes that support water saving. Shanghai also demonstrated a considerable reduction of −0.78 billion m3. Overall, there is a high water-saving capacity at the technological level.
Consumption patterns are identified to have positive effects. It is interesting to find that the household consumption patterns of developed provinces tend to be more water-friendly while developing provinces tend to be more water-intensive as the economy grows. Therefore, the consumption patterns had different impacts on the water footprints in regions at different stages of economic development. The consumption patterns in western regions, where developing provinces were concentrated, had positive impacts on the changes in the household water footprint. The eastern coastal developed regions, such as Shanghai (−11.1 billion m3), Guangdong (−9.9 billion m3), and Tianjin (−0.02 billion m3), demonstrated slight declines, which implied that the developed provinces might have crossed the threshold of the environmental Kuznets curve and that continued economic growth might help save water and reduce pollution. Hence, there probably exists a decoupling relationship between the water footprint and economic growth in the case of consumption pattern transformation. From the perspective of rural and urban consumption patterns the water use increments due to changes in the urban consumption pattern were approximately 1.4 times the increments in rural areas. The obvious distinction between urban and rural consumption impacts indicates that a high water demand arises when people move from rural areas to urban areas.
Population is another vital driving force of the water footprint, and additional virtual water demand is required when the population grows. The influence of the total population ranked third but is still worthy of attention. Urbanization (namely, the migrated population) presented a positive impact in almost all provinces, except for Shanghai (−0.04 billion m3), due to local counter-urbanization. The contribution of urban population change was relatively small but represented a positive impact in most provinces, except for some north-eastern provinces, such as Heilongjiang (−0.06 billion m3), Liaoning (−0.05 billion m3) and Jilin (−0.02 billion m3), whose results hinted that urban population outflow existed. The rural population change has an effect similar to the urban population change, i.e., it positively increased the water footprint in most provinces except for north-eastern provinces.
Overall, the technological level can bring considerable changes through policy guidance and technological innovation, which the government can control or guide easily. Generally, consumption patterns and population change contributed continuously to the household water footprint and were not easy to control; thus, more attention to these factors is needed, especially in the context of China’s rapid urbanization and transformation to a consumption-driven economy. In this regard, it is essential to investigate the impact of urbanization and lifestyle change on cross-regional water use to formulate more water-efficient policies to tackle regional water shortages.
3.3 Effect of Consumption Patterns on the Cross-Regional Water Footprint
The consumption patterns had a positive impact overall and increased the cross-regional water footprint by 15.4 billion m3 during the study period. Figure 5 highlights the changes in the cross-regional water footprint driven by consumption patterns. The horizontal axes show the water footprint caused by changes in consumption patterns of commodities transferred from other provinces (influencing provinces) to the focal provinces, and the vertical axes show the water footprint transferred from the focal provinces to the other provinces (influenced provinces).
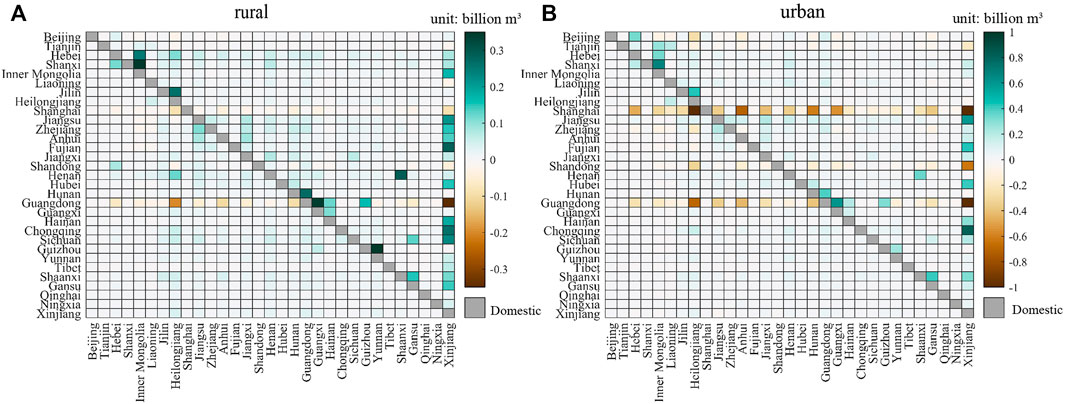
FIGURE 5. The effects of rural consumption pattern on cross-regional provincial water footprints (A), and the effects of urban consumption pattern on cross-regional provincial water footprint (B).
From the perspective of influencing provinces, Shanghai and Guangdong exhibited obvious water decrements for other provinces of 0.49 billion m3 and 0.55 billion m3, respectively. To further determine the reason, we present the per capita urban consumption in the sectors of the two provinces in Figure 6, which display similar trends regarding the water-use structure change. Namely, both provinces spend less on water-intensive sectors, such as agriculture (AGR), food processing and tobacco (FPT), the chemical industry (CHE), metal products (MEP), and electrical equipment (EIE), while more expenditures are made in water-friendly sectors, such as real estate (TRE), education (EDU), and health and social work (HSW). According to our results, the appropriate consumption pattern can help provinces save water as the economy grows.
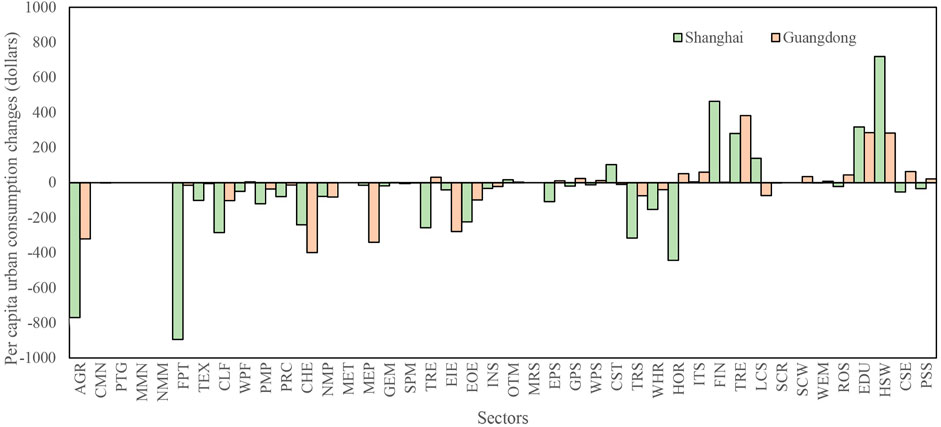
FIGURE 6. Urban consumption changes during the study period in Shanghai and Guangdong.
From the perspective of influenced provinces, Xinjiang was the most influenced province, where agriculture was the largest product-exporting sector and contributed to an increase in the water footprint of 6.83 billion m3, accounting for 95.5% of the total water footprint increment. Cai et al. (2019) also recognized that agriculture was the most water-intensive sector and contributed approximately 70% of the water footprint. For both rural and urban consumption patterns, Guangdong, Shanghai and Shandong exerted obvious negative impacts on Xinjiang, while Jiangsu, Fujian and Chongqing had obvious positive impacts, which implies that Xinjiang’s main export destination gradually changed from developed coastal provinces to provinces with faster urbanization.
Our results indicate that owing to the larger proportion of agriculture in their industrial structure, inland regions usually face considerable water use stress due to their contributions to national supply chains, especially in the trade with developed regions. We also found that the most obvious water footprint transfers occurred between neighbouring provinces, and this phenomenon partly confirms a more frequent commercial intercourse between neighbouring provinces from an environmental perspective. Generally, the eastern and coastal regions, usually with prosperous tertiary industries, were able to save their water footprint from their positions in national supply chains by trading of goods and services with inland regions.
3.4 Effect of Urbanization on the Cross-Regional Water Footprint
Urbanization, the largest driving factor of the population, plays an important role in the water footprint. Figure 7 highlights the changes in the cross-regional water footprint driven by urbanization, adding up to an increment of 4.6 billion m3. The effect of urbanization should be the combined result of changes in the consumption level and the migrant population between rural and urban areas, which distinguishes this study from other studies. Figure 8A denotes the change in the consumption pattern driven by urbanization, and Figure 8B shows the migrant population in each province.
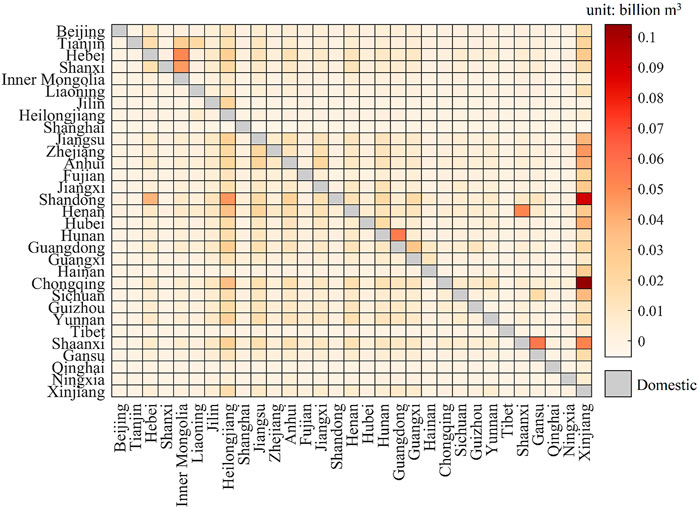
FIGURE 7. Urbanization effects on the household water footprints of provinces.
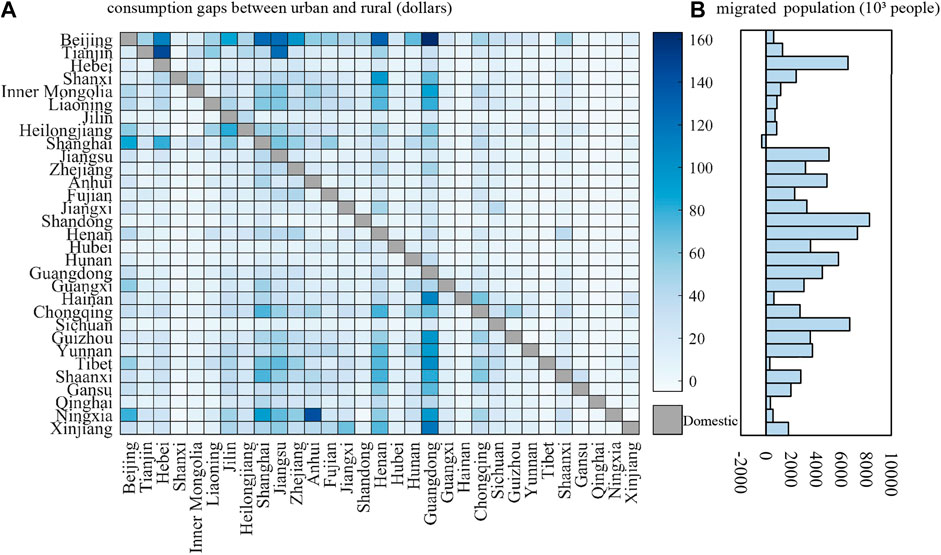
FIGURE 8. The gaps between per capita urban and rural consumption levels during 2012 to 2017 (A), and the population migrated from rural to urban during 2012 to 2017 (B).
Urbanization mainly led to positive cross-regional water flow, except for Shanghai. In addition, the changes in the water footprints in Heilongjiang and Xinjiang were affected by the urbanization process. What is evident in Figure 8 is that the eastern region had a larger migrant population than other regions; however, Shanghai is the only province showing negative migration because of local counter-urbanization. We find that the provinces most affected by urbanization often showed prominent gaps in consumption levels between urban and rural areas, high migration, or both (Figure 8), as usually observed in developed areas. Hence, we deduced that the cross-regional impact of urbanization may be closely related to local development. Less-developed provinces, such as Jilin, Tibet, Qinghai, and Xinjiang, displayed relatively small changes in their cross-regional water footprints, with slight gaps between local urban and rural areas and less migration. Developed provinces, such as Jiangsu and Shandong, exhibited growing water footprint trends with urbanization mainly because of the local rapid urbanization process, as shown in Figure 2. From the perspective of affected provinces, Xinjiang was the most affected province, which indicates that the rest of China had an increasing demand for water-intensive products from Xinjiang to satisfy the needs of urbanization. Similarly, Heilongjiang, as the “granary of China”, also showed a significant increase in its water footprint. Generally, agriculture-dominated provinces are more affected by other provinces in the process of urbanization because urbanization leads to an increase in food demand, which is transmitted through a cross-regional supply chain to agricultural provinces and results in an increase in the local water footprint.
4 Discussion
During the study period, the household water footprint in the eastern region decreased, while that in the western region increased. The differences in water footprints across provinces are a manifestation of China’s long-term unbalanced regional development. The decline in the water footprints of developed provinces reflects the possibility of decoupling economic growth and water footprint. Although studies have suggested that it might be feasible to solve water shortages through development (Schwarz et al., 2019), we believe that the cross-regional water footprint transfer caused by development should not be ignored, as it might lead to a more severe water imbalance and shortage in less developed regions. Since economic reforms started in 1978, coastal regions have gradually developed service industries as well as high-tech and other advanced manufacturing industries. They then transferred their water-intensive and “backward” industries to the inland regions, which aggravated these less-developed regions’ water shortages. Our results revealed that the trends of the environment Kuznets curve in developed coastal regions were obtained to some extent at the cost of the environment of low-income regions. Therefore, the cross-regional water footprint should be taken into account when the government formulates local water policies.
Consumption patterns and population changes are certain to increase the water footprint and influence the cross-regional water footprint through commodities trade. It is necessary to rechoose an appropriate development pathway by considering regional water endowments. For water footprint exporters, such as Xinjiang, which was short of water and exported water-intensive products, crop types need to be considered. For instance, high-value but low-water-demand crops (such as cotton, grapes and sweet melons) should be encouraged locally. And specific agricultural water-saving technologies, such as drip irrigation, should be applied to save, recycle and reuse water (Zhang et al., 2020). Water footprint importers, such as Shanghai and Guangdong, which were rich in water, are proposed to import water-intensive products from water-rich provinces and undertake more production tasks involving water-intensive products. Adjusting the trade structure promptly can further mitigate regional water imbalance and lead to appropriate water allocation in the nation. Furthermore, the eastern developed provinces should transfer technology and financial support to western developing provinces to stimulate the application of water-saving technologies and equipment. Other efforts, such as advocating for water-saving activities and water management, can also play a part in reducing the total water footprint. In view of the cross-regional transfer of water resources, evaluating regional water resource endowments and comparative advantages could help in the adjustment of trade strategies and in the development of policies that are more effective in optimizing the allocation of water resources and trade structures.
The urbanization process of eastern developed provinces played an essential role in the cross-regional water footprint. In developing provinces, the urbanization expansion rates were faster and the cross-regional water use impact potential cannot be ignored. On the one hand, the citizens of eastern higher-urbanized regions would like to consume more water due to their higher incomes. Thus, local governments need to educate their citizens to change their water footprint behaviours through various publicity activities, such as TV promotions, newspapers and websites. Moreover, economic instruments that use high water prices to prevent water-wasting behaviours should be adopted so that water resources can be reallocated more productively. On the other hand, inland regions in which the urbanization process is developing more rapidly should consider supporting water-friendly industries, such as service industries, while at the same time relocating some of their water-intensive industries to water-rich regions. Consequently, further efforts should be made to ensure that urbanization will not aggravate the regional water imbalance and will improve the overall water resource efficiency.
Our study has limitations regarding accuracy. First, we applied four‰ as the difference in birth rates between the rural and urban areas of each province, referring to the Statistical Yearbook of 2001. However, the gaps in the birth rate differ across regions. Therefore, we conducted a Monte Carlo simulation and found that when the difference in birth rates between urban and rural areas ranges between two‰ and 6‰, the change in the urbanization contribution index ranges within 6.6% (Supplementary Figure S1), which is under control, and the overall conclusion does not change. Second, in terms of urban and rural consumption, the MRIO data issued by CEADs are inconsistent with the data in the statistical yearbook. Due to the lack of sector-specific data in the statistical yearbook, the data in the MRIO table are selected from national macro statistics. However, it should be noted that the approach is under systematic deviation. Third, as the decomposition factors increase, the decomposition process becomes more complicated. When multiple factors play a role, the contributions of the factors are distributed in equal proportions. The adoption of a more accurate distribution method may yield slightly different results. In general, these three main sources of error might subtly affect the final data results, but as they are under control, they will not change the overall conclusions.
5 Conclusion
We developed a two-stage reversible structural decomposition method to determine the factors driving the household water footprint from 2012 to 2017 in China, with an emphasis on population migration from rural to urban areas and the corresponding transformation of consumption patterns in the process of urbanization. During the study period, the household water footprint decreased in the east and increased in the west, which is different from the distribution of China’s water endowment. The results suggested that decoupling might exist between economic consumption and the water footprint; however, we deduced that the environmental Kuznets curve trends of developed coastal regions might be achieved at the cost of environmental damage in low-income inland regions. The SDA results showed that water intensity had a negative impact on the household water footprint of each province, indicating that the water use efficiency and technical level improved during the study period. The contribution of the production structure was slight among most provinces, except Shanghai, Shandong and Inner Mongolia. In addition, the effect of urban and rural consumption patterns on the water footprint is second only to that of technological level. Affluent provinces (such as Guangdong and Shanghai) showed a marked downward trend in the household water footprint due to their optimized water-saving consumption patterns. The contribution of population showed a positive change among provinces, except for less-developed provinces concentrated in Northeast China. For urbanization, the overall impact on the water footprint was smaller than the impact brought by consumption patterns, but it still brought a water increment of 4.6 billion m3. Except for Shanghai, which had local counter-urbanization, all regions showed positive changes. Generally, the government should apply appropriate policies according to local water resource endowments. For inland water-scarce regions, improving local irrigation techniques and planting lower-water intensity agricultural products can help save water in water-exporting provinces. Meanwhile, ecological compensation, financial support and technical assistance from the eastern coastal areas can help water-deficient provinces use water more efficiently. Other efforts, such as trade structure changes and industrial structure changes can also play a role. For eastern water-rich regions, water-saving education and appropriate water prices will prevent the wasting of water. Addressing the cross-regional water footprint caused by the transformation of consumption patterns accompanying urbanization could not only promote a deeper understanding of the contradiction between the supply and demand of regional water resources but can also provide a basis for determining each province’s responsibility for saving water. Such efforts would assist in the promotion of water resource management policies and the optimization of cross-regional supply chains and guarantee the safety of local water resources. As the largest developing country, China’s solutions and experiences with such water supply and demand imbalance may help pave the way for other rapidly emerging economies facing similar problems.
Data Availability Statement
The raw data supporting the conclusions of this article will be made available by the authors, without undue reservation.
Author Contributions
HL:Conceptualization, Methodology, Writing; CC: Writing- Reviewing and Editing; LW: Writing- Reviewing and Editing; ZW:Conceptualization, Methodology, Supervision and Funding acquisition.
Funding
This study is financially supported by the National Natural Science Foundation of China (42077060) and the Startup Fund for Distinguished Professors of Huazhong Agricultural University to ZW.
Conflict of Interest
The authors declare that the research was conducted in the absence of any commercial or financial relationships that could be construed as a potential conflict of interest.
Publisher’s Note
All claims expressed in this article are solely those of the authors and do not necessarily represent those of their affiliated organizations, or those of the publisher, the editors and the reviewers. Any product that may be evaluated in this article, or claim that may be made by its manufacturer, is not guaranteed or endorsed by the publisher.
Supplementary Material
The Supplementary Material for this article can be found online at: https://www.frontiersin.org/articles/10.3389/fenvs.2021.792423/full#supplementary-material
References
Cai, B., Zhang, W., Hubacek, K., Feng, K., Li, Z., Liu, Y., et al. (2019). Drivers of Virtual Water Flows on Regional Water Scarcity in China. J. Clean. Prod. 207, 1112–1122. doi:10.1016/j.jclepro.2018.10.077
CEADs (2021). Carbon Emission Accounts& Datasets. Available at: https://ceads.net/data/input_output_tables/.
Chung, H.-S., and Rhee, H.-C. (2001). A Residual-free Decomposition of the Sources of Carbon Dioxide Emissions: A Case of the Korean Industries. Energy 26, 15–30. doi:10.1016/S0360-5442(00)00045-1
Cui, W. (2011). Analyze the Reason and Countermeasure of the Difference of Birth Rate between Urban and Rural Areas in China. Reg. Econ. 637, 82–83. (in Chinese)
Deng, J., Li, C., Wang, L., Yu, S., Zhang, X., and Wang, Z. (2021). The Impact of Water Scarcity on Chinese Inter-provincial Virtual Water Trade. Sustainable Prod. Consumption 28, 1699–1707. doi:10.1016/j.spc.2021.09.006
Department of economic and social affairs of United nation (2018). World Urbanization Prospects. Available at: https://population.un.org/wup/Publications/Files/WUP2018-Report.pdf.
Dietzenbacher, E., and Los, B. (1998). Structural Decomposition Techniques: Sense and Sensitivity. Econ. Syst. Res. 10, 307–324. doi:10.1080/09535319800000023
Dong, H., Geng, Y., Fujita, T., Fujii, M., Hao, D., and Yu, X. (2014). Uncovering Regional Disparity of China's Water Footprint and Inter-provincial Virtual Water Flows. Sci. Total Environ. 500-501, 120–130. doi:10.1016/j.scitotenv.2014.08.094
Duarte, R., Pinilla, V., and Serrano, A. (2019). Long Term Drivers of Global Virtual Water Trade: A Trade Gravity Approach for 1965-2010. Ecol. Econ. 156, 318–326. doi:10.1016/j.ecolecon.2018.10.012
Duarte, R., Pinilla, V., and Serrano, A. (2014). The Effect of Globalisation on Water Consumption: A Case Study of the Spanish Virtual Water Trade, 1849-1935. Ecol. Econ. 100, 96–105. doi:10.1016/j.ecolecon.2014.01.020
Fan, J.-L., Wang, J.-D., Zhang, X., Kong, L.-S., and Song, Q.-Y. (2019). Exploring the Changes and Driving Forces of Water Footprints in China from 2002 to 2012: A Perspective of Final Demand. Sci. Total Environ. 650, 1101–1111. doi:10.1016/j.scitotenv.2018.08.426
Feng, K., Chapagain, A., Suh, S., Pfister, S., and Hubacek, K. (2011). Comparison of Bottom-Up and Top-Down Approaches to Calculating the Water Footprints of Nations. Econ. Syst. Res. 23, 371–385. doi:10.1080/09535314.2011.638276
Feng, K., Hubacek, K., Pfister, S., Yu, Y., and Sun, L. (2014). Virtual Scarce Water in China. Environ. Sci. Technol. 48, 7704–7713. doi:10.1021/es500502q
Feng, K., Siu, Y. L., Guan, D., and Hubacek, K. (2012). Assessing Regional Virtual Water Flows and Water Footprints in the Yellow River Basin, China: A Consumption Based Approach. Appl. Geogr. 32, 691–701. doi:10.1016/j.apgeog.2011.08.004
Gober, P., and Kirkwood, C. W. (2010). Vulnerability Assessment of Climate-Induced Water Shortage in Phoenix. Proc. Natl. Acad. Sci. 107, 21295–21299. doi:10.1073/pnas.0911113107
Guan, D., Hubacek, K., Tillotson, M., Zhao, H., Liu, W., Liu, Z., et al. (2014). Lifting China's Water Spell. Environ. Sci. Technol. 48, 11048–11056. doi:10.1021/es501379n
Han, M. Y., Chen, G. Q., Mustafa, M. T., Hayat, T., Shao, L., Li, J. S., et al. (2015). Embodied Water for Urban Economy: A Three-Scale Input-Output Analysis for Beijing 2010. Ecol. Model. 318, 19–25. doi:10.1016/j.ecolmodel.2015.05.024
Hoekstra, A., Chapagain, A., Aldaya, M., and Mekonnen, M. (2011). The Water Footprint Assessment Manual: Setting the Global Standard.
Hong, J., Gu, J., He, R., Wang, X., and Shen, Q. (2020). Unfolding the Spatial Spillover Effects of Urbanization on Interregional Energy Connectivity: Evidence from Province-Level Data. Energy 196, 116990. doi:10.1016/j.energy.2020.116990
Konar, M., Dalin, C., Suweis, S., Hanasaki, N., Rinaldo, A., and Rodriguez-Iturbe, I. (2011). Water for Food: The Global Virtual Water Trade Network. Water Resour. Res. 47, W05520. doi:10.1029/2010WR010307
Konar, M., Hussein, Z., Hanasaki, N., Mauzerall, D. L., and Rodriguez-Iturbe, I. (2013). Virtual Water Trade Flows and Savings under Climate Change. Hydrol. Earth Syst. Sci. 17, 3219–3234. doi:10.5194/hess-17-3219-2013
Mekonnen, M. M., and Gerbens-Leenes, W. (2020). The Water Footprint of Global Food Production. Water 12, 2696. doi:10.3390/w12102696
Mekonnen, M. M., and Hoekstra, A. Y. (2011). The green, Blue and Grey Water Footprint of Crops and Derived Crop Products. Hydrol. Earth Syst. Sci. 15, 1577–1600. doi:10.5194/hess-15-1577-2011
Ministry of Water Resources; National Bureau of Statistics (2013). Bulletin of First National Cencus for Water. Beijing: China Water Power Press. Available at: http://slpc.mwr.gov.cn/.
National Bureau of Statistics of China (2008). China Economic Census Yearbook. Beijing: Chinese Statistical Press. Available at: http://www.stats.gov.cn/tjsj/pcsj/jjpc/2jp/left.htm.
National Bureau of Statistics of China (2018). China Statistical Yearbook. Beijing: Chinese Statistical Press. Available at: http://www.stats.gov.cn/tjsj/ndsj.
Okadera, T., Okamoto, N., Watanabe, M., and Chontanawat, J. (2014). Regional Water Footprints of the Yangtze River: an Interregional Input-Output Approach. Econ. Syst. Res. 26, 444–462. doi:10.1080/09535314.2014.934324
Poumanyvong, P., and Kaneko, S. (2010). Does Urbanization lead to Less Energy Use and Lower CO2 Emissions? A Cross-Country Analysis. Ecol. Econ. 70, 434–444. doi:10.1016/j.ecolecon.2010.09.029
Ren, D., Yang, Y., Yang, Y., Richards, K., and Zhou, X. (2018). Land-Water-Food Nexus and Indications of Crop Adjustment for Water Shortage Solution. Sci. Total Environ. 626, 11–21. doi:10.1016/j.scitotenv.2018.01.071
Schwarz, J., Mathijs, E., and Maertens, M. (2019). A Dynamic View on Agricultural Trade Patterns and Virtual Water Flows in Peru. Sci. Total Environ. 683, 719–728. doi:10.1016/j.scitotenv.2019.05.118
Shapley, L. S. (1953). A Value of N-Person Games. In Contributions to the Theory of Games. Ann. Math. Stud. 28, 307–318. Princet. Univ. Press. doi:10.1515/9781400881970-018
Sun, J. W. (1998). Changes in Energy Consumption and Energy Intensity: A Complete Decomposition Model. Energ. Econ. 20, 85–100. doi:10.1016/S0140-9883(97)00012-1
Sun, J. X., Yin, Y. L., Sun, S. K., Wang, Y. B., Yu, X., and Yan, K. (2021). Review on Research Status of Virtual Water: The Perspective of Accounting Methods, Impact Assessment and Limitations. Agric. Water Manag. 243, 106407. doi:10.1016/j.agwat.2020.106407
Tamea, S., Carr, J. A., Laio, F., and Ridolfi, L. (2014). Drivers of the Virtual Water Trade. Water Resour. Res. 50, 17–28. doi:10.1002/2013WR014707
The State Council (2016). Circular of the State Council on Printing and Distributing the National Population Development Plan (2016-2030). Available at: http://www.gov.cn/zhengce/content/2017-01/25/content_5163309.htm.
Tuninetti, M., Tamea, S., Laio, F., and Ridolfi, L. (2017). To Trade or Not to Trade: Link Prediction in the Virtual Water Network. Adv. Water Resour. 110, 528–537. doi:10.1016/j.advwatres.2016.08.013
Wang, X., Huang, K., Yu, Y., Hu, T., and Xu, Y. (2016). An Input-Output Structural Decomposition Analysis of Changes in Sectoral Water Footprint in China. Ecol. Indicators 69, 26–34. doi:10.1016/j.ecolind.2016.03.029
Wang, Z., Cui, C., and Peng, S. (2019). How Do Urbanization and Consumption Patterns Affect Carbon Emissions in China? A Decomposition Analysis. J. Clean. Prod. 211, 1201–1208. doi:10.1016/j.jclepro.2018.11.272
Wei, L., Li, C., Wang, J., Wang, X., Wang, Z., Cui, C., et al. (2020). Rising Middle and Rich Classes Drove China's Carbon Emissions. Resour. Conservation Recycling 159, 104839. doi:10.1016/j.resconrec.2020.104839
White, D. J., Feng, K., Sun, L., and Hubacek, K. (2015). A Hydro-Economic MRIO Analysis of the Haihe River Basin's Water Footprint and Water Stress. Ecol. Model. 318, 157–167. doi:10.1016/j.ecolmodel.2015.01.017
Xiong, Y., Tian, X., Liu, S., and Tang, Z. (2020). New Patterns in China's Water Footprint: Analysis of Spatial and Structural Transitions from a Regional Perspective. J. Clean. Prod. 245, 118942. doi:10.1016/j.jclepro.2019.118942
Xu, X., Zhang, Y., and Chen, Y. (2020). Projecting China's Future Water Footprint under the Shared Socio-Economic Pathways. J. Environ. Manage. 260, 110102. doi:10.1016/j.jenvman.2020.110102
Yang, Z., Liu, H., Xu, X., and Yang, T. (2016). Applying the Water Footprint and Dynamic Structural Decomposition Analysis on the Growing Water Use in China during 1997-2007. Ecol. Indicators 60, 634–643. doi:10.1016/j.ecolind.2015.08.010
Yang, Z., Liu, H., Yang, T., and Xu, X. (2015). A Path-Based Structural Decomposition Analysis of Beijing's Water Footprint Evolution. Environ. Earth Sci. 74, 2729–2742. doi:10.1007/s12665-015-4484-6
Zhang, S., Taiebat, M., Liu, Y., Qu, S., Liang, S., and Xu, M. (2019). Regional Water Footprints and Interregional Virtual Water Transfers in China. J. Clean. Prod. 228, 1401–1412. doi:10.1016/j.jclepro.2019.04.298
Zhang, W., Fan, X., Liu, Y., Wang, S., and Chen, B. (2020). Spillover Risk Analysis of Virtual Water Trade Based on Multi-Regional Input-Output Model -A Case Study. J. Environ. Manage. 275, 111242. doi:10.1016/j.jenvman.2020.111242
Zhang, Y., Chen, Y., and Huang, M. (2018). Water Footprint and Virtual Water Accounting for china Using a Multi-Regional Input-Output Model. Water 11, 34. doi:10.3390/w11010034
Zhang, Y., Huang, K., Yu, Y., and Yang, B. (2017). Mapping of Water Footprint Research: A Bibliometric Analysis during 2006-2015. J. Clean. Prod. 149, 70–79. doi:10.1016/j.jclepro.2017.02.067
Zhang, Z., Yang, H., and Shi, M. (2011). Analyses of Water Footprint of Beijing in an Interregional Input-Output Framework. Ecol. Econ. 70, 2494–2502. doi:10.1016/j.ecolecon.2011.08.011
Keywords: multi-regional input-output analysis, urbanization, consumption patterns, water footprint, structure decomposition analysis
Citation: Liu H, Wei L, Chen C and Wang Z (2022) The Impact of Consumption Patterns and Urbanization on the Cross-Regional Water Footprint in China: A Decomposition Analysis. Front. Environ. Sci. 9:792423. doi: 10.3389/fenvs.2021.792423
Received: 11 October 2021; Accepted: 10 December 2021;
Published: 20 January 2022.
Edited by:
Huiyu Dong, Research Center for Eco-environmental Sciences (CAS), ChinaCopyright © 2022 Liu, Wei, Chen and Wang. This is an open-access article distributed under the terms of the Creative Commons Attribution License (CC BY). The use, distribution or reproduction in other forums is permitted, provided the original author(s) and the copyright owner(s) are credited and that the original publication in this journal is cited, in accordance with accepted academic practice. No use, distribution or reproduction is permitted which does not comply with these terms.
*Correspondence: Zhen Wang, c2lub29AbWFpbC5oemF1LmVkdS5jbg==
†These authors contributed to the work equally and share first authorship