 Huihui Feng
 Ying Ding
 Bin Zou1,2*
 Chuanfeng Zhao
- 1School of Geosciences and Info-Physics, Central South University, Changsha, China
- 2Key Laboratory of Metallogenic Prediction of Nonferrous Metals and Geological Environment Monitoring of Chinese Ministry of Education, Changsha, China
- 3State Key Laboratory of Earth Surface Processes and Resource Ecology, College of Global Change and Earth System Science, Beijing Normal University, Beijing, China
The aerosol at the previous time (initial aerosol) and climate conditions control the next step annual variation of global air pollution through the complex aerosol-climate interaction. However, the individual influences remain unclear, leaving a great gap for understanding the mechanism of air pollution evolution and supporting the environment management. We estimate the annual variation using statistical methods and satellite observations at global scale from 2001 to 2016 Results show that significant variation of annual aerosol occurs over 13.6% of land areas, in which a perturbation of aerosol may cause 0.58 ± 0.45 times change in the next phase. Initial aerosol and climate influences contribute 48.4–51.6% of the total variation, respectively. Specifically, the influences of precipitation, air temperature and surface temperature represent 0.1, 18.3 and 33.2% of the total variation. Physically, the observed variation is strongly correlated with fine mode aerosols, radiative scattering and warm/hot summers in temperate and cold zones. The environmental management therefore should implement cause-oriented strategies for emission control or climatic adaption.
Introduction
Aerosol variation in response to a perturbation is one of the key issues in studies on global climate and environmental changes (Carslaw et al., 2010; Andreae and Rosenfeld, 2008; Gettelman et al., 2016; Rosenfeld et al., 2014). Essentially, the variation comes from the aerosol at the previous time step (initial aerosol) and the corresponding climate influence. The initial aerosol provides the sources of air pollution evolution, while the climate conditions act as drivers of the evolution. Furthermore, the two influencing factors show complex interaction. Specifically, the initial aerosols affect the climate (particularly the temperature) through direct (Bellouin et al., 2005), indirect (Twomey, 1977; Garrett and Zhao, 2006) and semidirect (Allen and Sherwood, 2010) aerosol radiative forcing, which subsequently exerts a significant feedback effects on the aerosol evolution in the next phase (Shindell et al., 2009; Feng and Zou, 2019a). It is necessary to clarify the mechanism of aerosol variation for climate predictions and environmental management (Scott et al., 2017). However, the current results are still controversial, and the contributions of initial aerosol and climate condition remain unclear (Bonan and Doney, 2018; Carslaw et al., 2013). Although numerous models have been used to evaluate the impacts and responses of aerosols by comparing scenario predictions with and without the potential driving factors, unavoidable uncertainties originate from the initial conditions, model errors, and prediction scenarios (Bonan and Doney, 2018). Considering these uncertainties, researchers have suggested that direct observations, particularly satellite remote sensing observations, are needed to accurately capture aerosol impacts and forcing (Seinfeld et al., 2016).
Here, we estimate the driving factors of aerosol variation using statistical methods based on satellite observations. Methodologically, the aerosol variation was first identified as the initial aerosol, climate condition and their interactions. A stepwise multiple linear regression (MLR) model was then adopted to estimate the sign and magnitude of the contributions of the different components. The methods and corresponding datasets are described in Section 2. The results and discussion are presented in Section 3. The conclusions are provided in Section 4. The results of this study will help clarify the mechanism of global aerosol change, which will support relative climate adaption and environmental management.
Materials and Methods
Theory and Method
As described above, the aerosol variation originates from initial aerosol and climate condition with their complex interactions. The interactions are shown in Figure 1. Specifically, aerosols affect the climate (particularly temperature and precipitation) through direct, indirect and semidirect radiative forcing, which in turn influences the aerosol change. Therefore, two main loops of “initial aerosol perturbation → temperature response → aerosol change” (ATA) and “initial aerosol perturbation → precipitation response → aerosol change” (APA) can be identified. Because aerosol forcing exerts influences on both air temperature (Ta) and land surface temperature (Ts) (Feng and Zou, 2019b; Feng et al., 2019a), the ATA loop can be further divided into the interactions between aerosol and Ta (ATaA) and between aerosol and Ts (ATsA).
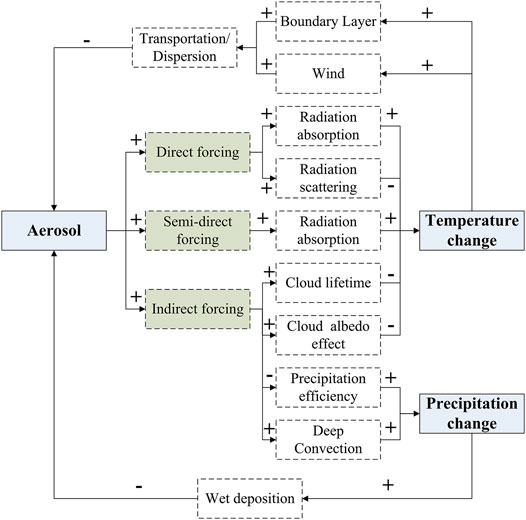
FIGURE 1. Framework of aerosol-climate interaction. The blue and green blocks refer to the state variables and their influences. The white blocks are the auxiliary variables that connect the state variables. The “+” and “−” symbols represent positive and negative correlations, respectively. Positive or negative feedback cycles can be identified by the even or odd occurrence of “−”.
A stepwise MLR model is then used to assess the contributions of the initial aerosol and climate condition, which had been proven to be an effective and reliable way to capture the driving factors in the previous studies (Li et al., 2019; Feng and Zou, 2020). Mathematically, it firstly calculates correlation coefficient matrix and F-test statistics between aerosol evolution and each factor of initial aerosol and climate condition. Certain factors could enter the MLR model and act as the independent variables under significant F-test statistics (p < 0.05). Otherwise, the factors should be excluded from the model.Specifically, the influences of initial aerosol and climate are firstly identified by whether the variables enter the MLR model, while the sign and magnitude are estimated by measuring the response of aerosol change to the initial perturbation. Mathematically, the aerosol at next phase (At+1) is a function of the initial aerosol (At), precipitation (Pt), temperature (Tt), and their interactions, which can be written as:
where At, Tt and Pt are the aerosols, temperature and precipitation at time t, respectively, and I(At,Tt,Pt) is their interaction. Our previous studies demonstrated that aerosol affects both TA and TS, which should be considered in this study (Feng and Zou, 2019b; Feng et al., 2019a). In this study, we carry out the research at annual scale to capture the general characteristics of aerosol variation. Therefore, the time step of t refers to the year.
The MLR model was used to execute the function, as this model has been widely used to capture the aerosol influences and drivers in previous studies (Li et al., 2019; Feng and Zou, 2020). The interaction terms (for example, the interaction of the ith and jth parameters, xixj)) are up to second-order terms. Therefore, At+1 can be written as follows:
where the series of
where
The stepwise method allows limited variables to enter the MLR model. Therefore, the patterns of variables and the corresponding coefficients may vary at the pixel scale over land. The contribution of each component is calculated by taking the area coverage into consideration:
where
Data Sources and Preprocessing
To carry out the investigation, global aerosol and climate data sets are used. Aerosol optical depth (AOD), which is obtained from the Clouds and the Earth’s Radiant Energy System (CERES) (https://ceres.larc.nasa.gov/), is adopted to present the aerosol amount, with average relative error of 10% over land (Kato et al., 2018). The data is from an aerosol transport model MATCH, that assimilates the NASA-GSFC MODIS MOD04-L2/MYD04_L2 products. The precipitation data are obtained from the Global Precipitation Climatology Centre (GPCC) Full Data Monthly Product Version 2018 (ftp://ftp-anon.dwd.de/pub/data/gpcc/html/downloadgate.html). The data are based on 67,200 ground site measurements and are interpolated across the global land surface at a spatial resolution of 0.5° from 1891 to 2016. Ta data are obtained from the Global Historical Climatology Network version two and the Climate Anomaly Monitoring System (GHCN_CAMS) Gridded 2 m Temperature (Land) https://www.esrl.noaa.gov/psd/data/gridded/data.ghcncams.html) from 1948 to 2019 at a spatial resolution of 0.5°. The Ts data are obtained from the CERES_SYN1deg_Ed4A dataset (https://ceres.larc.nasa.gov/) with a spatial resolution of 1 × 1 at a monthly scale. All the datasets are resampled to a spatial resolution of 1° at an annual scale from 2001 to 2016.
Results and Discussions
Using the MLR model, the variation is first identified by examining the variables entering the model. We first execute the model at global scale, while no variables enter the model (Supplementary Table S1). Results suggests that it is difficult to build a universal model between aerosol and its driving factors at a large scale. In contrast, various variables and their interactions enter the model in only some parts of the global grid cell (Figure 2). Therefore, significant aerosol variation is more likely to be observed at the regional scale. Specifically, the variables of initial aerosol, precipitation, Ta and Ts that entered the model cover 6.6%, 4.3%, 3.0% and 4.9% of the land, respectively, indicating the relatively primary influence of initial aerosol. Furthermore, the patterns of the coefficients are spatially inconsistent, suggesting the heterogeneity of the forcing due to the nonlinear relationship with aerosol (Feichter et al., 2004).
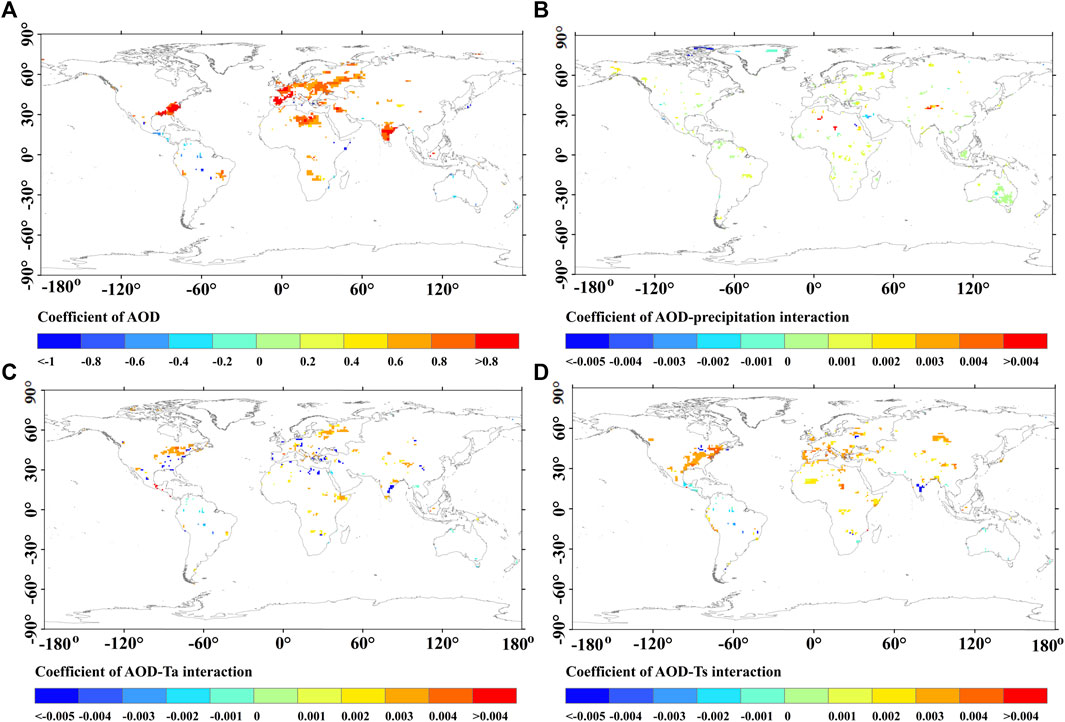
FIGURE 2. Coefficients of (A) initial aerosol and (B) precipitation (C) Ta and (D) Ts. The blank regions indicate that the variables do not enter the stepwise MLR model and therefore suggest nonsignificant changes in aerosols.
Based on the coefficients of Eqs. 2, 3, the multi-year aerosol variation is subsequently estimated using the data sets of precipitation (P) and temperature (Ta and Ts) from 2001 to 2016 (see Methods). The mean value is 0.58 ± 0.45 in the regions labeled with significant variation, suggesting that the perturbation of aerosol may cause smaller change to the coming phase. Spatially, the significant variation covers 13.6% of the land area (Figure 3A). The positive variation is mainly in southeastern North America, western Europe, northern Africa and India. The negative variation occurs in only southeastern Australia due to the precipitation influence (Figure 3C). Our results detail the variation over different local sites. Several researchers have reported aerosol-climate loops at global or regional scales. Zhao et al (Zhao et al., 2006) presented a positive feedback of “more aerosol→ less precipitation→ more aerosol” over eastern central China. Yang et al (Yang et al., 2016) and Wang et al (Wang et al., 2014) reported a clear positive feedback between aerosol and downwelling solar radiation, winds and the planetary boundary layer in Beijing, while Miao et al (Miao et al., 2016) showed both positive and negative feedback between aerosols and the boundary layer. The results of this study clearly show that the estimation of variation over a large scale may conceal natural evolution at local scale. Therefore, we suggest that it should be estimated at a finer scale to capture the spatial details and support local environmental management.
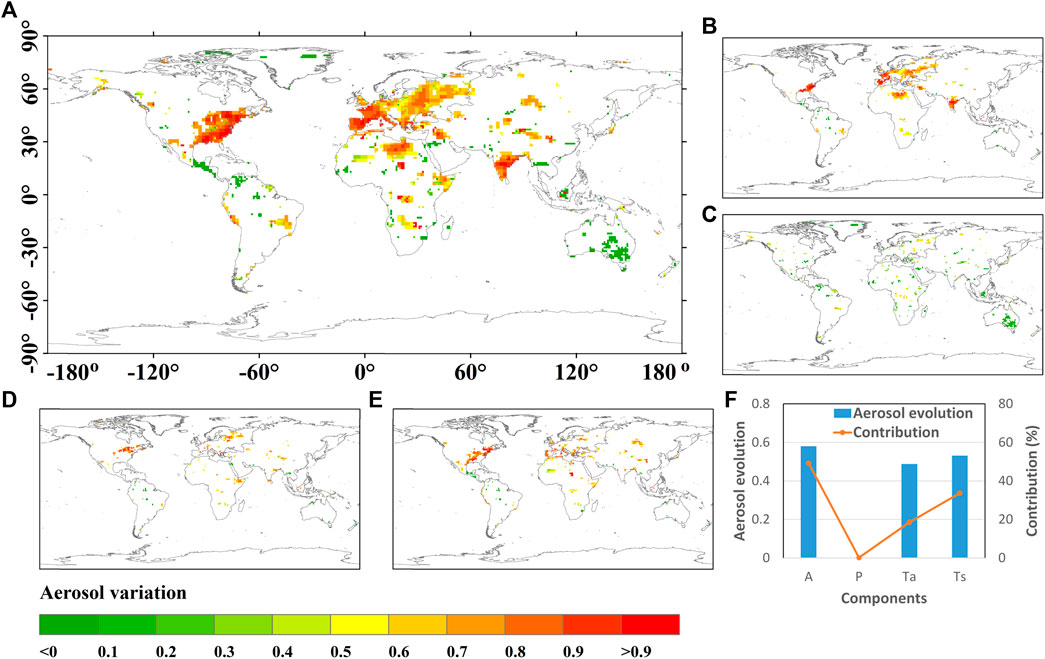
FIGURE 3. Spatial patterns of the global aerosol variation (A), the components of (B) initial aerosol (C) precipitation (D) air temperature and (E) surface temperature and the contribution to global variation (F). The blank regions indicate that no variables enter the stepwise MLR model.
To explore the driving factors and physical mechanisms, we further estimate the contributions of the initial aerosol, precipitation, air temperature and surface temperature components by considering the area weights (see Methods). The results show that variations of the four components are 0.58 ± 0.34, 0.003 ± 0.371, 0.49 ± 0.42 and 0.53 ± 0.39, contributing 48.4, 0.1, 18.3 and 33.2% of the total variation, respectively (Figure 3B-F). The initial aerosol contributes the greatest portion. The temperature influence contributes to 51.4% of the variation, which is the most dominant impact on the climate influence when compared to the precipitation. The weak precipitation influence might be attributed to the indirect cloudy forcing that weakens the magnitude of the aerosol impacts (Supplementary Figure S1). Meanwhile, the contribution of surface temperature (Ts) is much greater than that of air temperature. The main reason for this difference is that the aerosol-Ta interaction is much more complex, which depends on how the direct, indirect, and semidirect effects are coupled. In contrast, the aerosol forcing on Ts is simple and clear because both absorption and scattering reduce the solar radiation reaching the surface and result in a net cooling effect (Feng and Zou, 2019b; Feng et al., 2019a). Our results are similar with several observational studies (i.e., Cheng et al. (2019) and Zhang et al. (2020)), which demonstrated that both emissions and meteorology contribute greatly to PM2.5. Further subjective studies would be also carried out to support the results above in our future researches.
Our study further reveals that aerosol variation strongly correlates with aerosol characteristics and climate conditions (Rosenfeld et al., 2014; Andreae and Rosenfeld, 2008; Carslaw et al., 2010; Seinfeld et al., 2016). Figure 4 shows the characteristics of variation and aerosols in different climate zones. Moderate Resolution Imaging Spectroradiometer (MODIS) data on the Angstrom exponent (AE) and the single scattering albedo (SSA) are applied to explore the aerosol characteristics (Supplementary Figure S2). The AE provides basic information on the aerosol size, where AE ≤ 1 indicates coarse aerosol, and AE > 1 indicates fine aerosol. The SSA measures the scattering of particles, where SSA = 1 represents 100% scattering, and SSA = 0 indicates 100% absorption. The results demonstrate that strong variation mainly correlates with high AE and SSA. Physically, fine mode aerosols (high AE) can increase cloud droplets and decrease cloud droplet sizes by serving as cloud condensation nuclei (CNN), reducing the precipitation efficiency (Twomey, 1977). The scattering aerosol (high SSA) enhances the direct forcing, which tends to cool the surface and warm the top atmosphere and helps to form a stable atmosphere (Yang et al., 2016). On the other hand, the greatest positive variation is mainly observed in the temperate and cold climate zones with hot or warm summers. Specifically, the influence of initial aerosol dominates the variation in a warm summer (Cfb and Dfb), while surface temperature (Ts) acts as the primary factor in a hot summer (Csa and Dfa). It is very interesting that summer climate plays a crucial role in variation, which is mainly attributed to its impact on high solar radiation and, subsequently, monsoon and aerosol transportation (Pausataa et al., 2016; Lau et al., 2017).
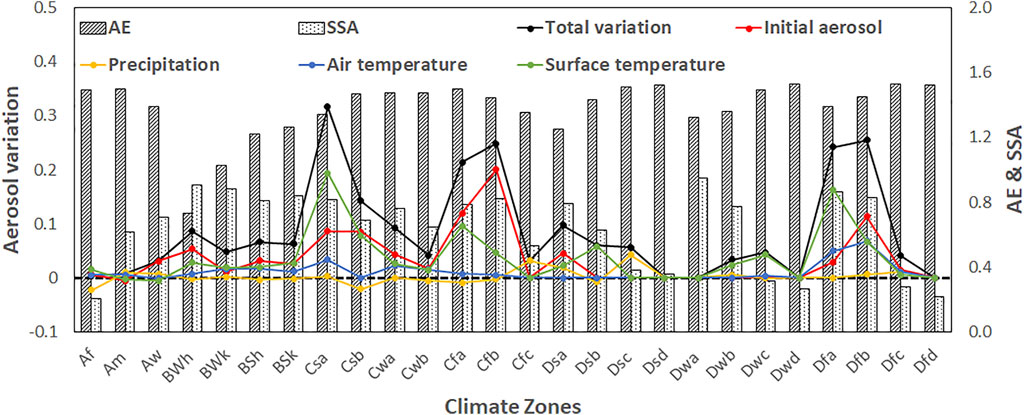
FIGURE 4. Statistics of aerosol variation and characteristics in different climate zones. The pixelwise variation is upscaled by the area weighted in each climate zone (
The aerosol variation and the associated components play a significant role in global climate and environmental changes. The spatial extent of aerosol variation is consistent with the internal trend of aerosols (Supplementary Figure S3), which supports the paradigm of “Polluting in Polluted and Cleaning in Clean” (Feng et al., 2019b). Therefore, the result suggests that the recent aerosol reduction in North America and western Europe might cause substantial future decreases (Feng and Zou, 2019b), which will profoundly improve the air quality and public health. However, the net warming effects of aerosol reduction may offset the cooling effects of greenhouse gas emission restrictions, which will exert a serious burden on the global or regional eco-environment under a warming climate (Najafi et al., 2015). On the other hand, there is serious air pollution in India, which faces a risk of worsening pollution due to the great and positive aerosol variation (Guttikunda et al., 2014). Furthermore, the results of this study clearly show that the variation is affected by initial aerosol, air temperature and surface temperature in North America and western Europe (Figure 3B,D, and E, suggesting the combined influences of aerosol-climate interaction. In India, the variation is mainly dominated by the initial aerosol factor (Figure 3C). Thus, we suggest that India should pay close attention to the influences of aerosol emissions and aerosol-climate interactions in North America and western Europe under the changing global climate, while emission control strategies might be the main way to improve air quality in India.
Conclusion
Overall, we show that aerosol variation can be observed at the regional scale rather than at the global scale. Although the initial aerosol accounts for the greatest contribution to the total variation, the influences of climate conditions (precipitation (P), air and surface temperature (Ta and Ts)) are nonnegligible. Therefore, the combined influences and their interactions should be taken into consideration to fully evaluate the aerosol variation. Accurate estimations of the signs and magnitudes of variation will provide useful information for predicting climatic responses. For example, great efforts have been made to control aerosol emissions to improve global air quality in recent decades (Feng and Zou, 2019b), which is expected to substantially reduce aerosols due to positive variation. Based on the results of this study, we suggest a full investigation of climatic and environmental responses to regional variation in future studies.
Data Availability Statement
The original contributions presented in the study are included in the article/Supplementary Material further inquiries can be directed to the corresponding authors.
Author Contributions
HF: Conceptualization, Methodology, Software, Writing—Original draft preparation. YD: Data curation, Visualization. BZ and CZ: Investigation, Supervision, Reviewing and Editing.
Funding
This work was supported in part by the National Natural Science Foundation of China (Grant No. 42071378) and the Natural Science Foundation of Hunan Province (No. 2020JJ3045).
Conflict of Interest
The authors declare that the research was conducted in the absence of any commercial or financial relationships that could be construed as a potential conflict of interest.
Publisher’s Note
All claims expressed in this article are solely those of the authors and do not necessarily represent those of their affiliated organizations, or those of the publisher, the editors and the reviewers. Any product that may be evaluated in this article, or claim that may be made by its manufacturer, is not guaranteed or endorsed by the publisher.
Supplementary Material
The Supplementary Material for this article can be found online at: https://www.frontiersin.org/articles/10.3389/fenvs.2021.790357/full#supplementary-material
References
Allen, R. J., and Sherwood, S. C. (2010). Aerosol‐cloud Semi‐direct Effect and Land‐sea Temperature Contrast in a GCM. Geophys. Res. Lett. 37, L07702. doi:10.1029/2010gl042759
Andreae, M. O., and Rosenfeld, D. (2008). Aerosol-cloud-precipitation Interactions. Part 1. The Nature and Sources of Cloud-Active Aerosols. Earth-Science Rev. 89, 13–41. doi:10.1016/j.earscirev.2008.03.001
Bellouin, N., Boucher, O., Haywood, J., and Reddy, M. S. (2005). Global Estimate of Aerosol Direct Radiative Forcing from Satellite Measurements. Nature 438, 1138–1141. doi:10.1038/nature04348
Bonan, G. B., and Doney, S. C. (2018). Climate, Ecosystems, and Planetary Futures: The challenge to Predict Life in Earth System Models. Science 359, eaam8328. doi:10.1126/science.aam8328
Carslaw, K. S., Boucher, O., Spracklen, D. V., Mann, G. W., Rae, J. G. L., Woodward, S., et al. (2010). A Review of Natural Aerosol Interactions and Feedbacks within the Earth System. Atmos. Chem. Phys. 10, 1701–1737. doi:10.5194/acp-10-1701-2010
Carslaw, K. S., Lee, L. A., Reddington, C. L., Pringle, K. J., Rap, A., Forster, P. M., et al. (2013). Large Contribution of Natural Aerosols to Uncertainty in Indirect Forcing. Nature 503, 67–71. doi:10.1038/nature12674
Cheng, N., Cheng, B., Li, S., and Ning, T. (2019). Effects of Meteorology and Emission Reduction Measures on Air Pollution in Beijing during Heating Seasons. Atmos. Pollut. Res. 10, 971–979. doi:10.1016/j.apr.2019.01.005
Feichter, J., Roeckner, E., Lohmann, U., and Liepert, B. (2004). Nonlinear Aspects of the Climate Response to Greenhouse Gas and Aerosol Forcing. J. Clim. 17, 2384–2398. doi:10.1175/1520-0442(2004)017<2384:naotcr>2.0.co;2
Feng, H., and Zou, B. (2019a). A Greening World Enhances the Surface-Air Temperature Difference. Sci. Total Environ. 658, 385–394. doi:10.1016/j.scitotenv.2018.12.210
Feng, H., Zou, B., and Ding, Y. (2019a). Satellite Detection of Aerosol-Produced Temperature Change. Remote Sensing Lett. 10, 854–863. doi:10.1080/2150704x.2019.1629707
Feng, H., and Zou, B. (2019b). Satellite-based Estimation of the Aerosol Forcing Contribution to the Global Land Surface Temperature in the Recent Decade. Remote Sensing Environ. 232, 111299. doi:10.1016/j.rse.2019.111299
Feng, H., and Zou, B. (2020). Satellite-based Separation of Climatic and Surface Influences on Global Aerosol Change. Int. J. Remote Sensing 41, 5443–5456. doi:10.1080/01431161.2020.1731934
Feng, H., Zou, B., Wang, J., and Gu, X. (2019b). Dominant Variables of Global Air Pollution-Climate Interaction: Geographic Insight. Ecol. Indicators 99, 251–260. doi:10.1016/j.ecolind.2018.12.038
Garrett, T. J., and Zhao, C. (2006). Increased Arctic Cloud Longwave Emissivity Associated with Pollution from Mid-latitudes. Nature 440, 787–789. doi:10.1038/nature04636
Gettelman, A., Lin, L., Medeiros, B., and Olson, J. (2016). Climate Feedback Variance and the Interaction of Aerosol Forcing and Feedbacks. J. Clim. 29, 6659–6675. doi:10.1175/jcli-d-16-0151.1
Guttikunda, S. K., Goel, R., and Pant, P. (2014). Nature of Air Pollution, Emission Sources, and Management in the Indian Cities. Atmos. Environ. 95, 501–510. doi:10.1016/j.atmosenv.2014.07.006
Kato, S., Rose, F. G., Rutan, D. A., Thorsen, T. J., Loeb, N. G., Doelling, D. R., et al. (2018). Surface Irradiances of Edition 4.0 Clouds and the Earth's Radiant Energy System (CERES) Energy Balanced and Filled (EBAF) Data Product. J. Clim. 31, 4501–4527. doi:10.1175/jcli-d-17-0523.1
Lau, W. K. M., Kim, K.-M., Shi, J.-J., Matsui, T., Chin, M., Tan, Q., et al. (2017). Impacts of Aerosol-Monsoon Interaction on Rainfall and Circulation over Northern India and the Himalaya Foothills. Clim. Dyn. 49, 1945–1960. doi:10.1007/s00382-016-3430-y
Li, K., Jacob, D. J., Liao, H., Shen, L., Zhang, Q., and Bates, K. H. (2019). Anthropogenic Drivers of 2013-2017 Trends in Summer Surface Ozone in China. Proc. Natl. Acad. Sci. USA 116, 422–427. doi:10.1073/pnas.1812168116
Miao, Y., Liu, S., Zheng, Y., and Wang, S. (2016). Modeling the Feedback between Aerosol and Boundary Layer Processes: a Case Study in Beijing, China. Environ. Sci. Pollut. Res. 23, 3342–3357. doi:10.1007/s11356-015-5562-8
Najafi, M. R., Zwiers, F. W., and Gillett, N. P. (2015). Attribution of Arctic Temperature Change to Greenhouse-Gas and Aerosol Influences. Nat. Clim Change 5, 246–249. doi:10.1038/nclimate2524
Pausata, F. S. R., Messori, G., and Zhang, Q. (2016). Impacts of Dust Reduction on the Northward Expansion of the African Monsoon during the Green Sahara Period. Earth Planet. Sci. Lett. 434, 298–307. doi:10.1016/j.epsl.2015.11.049
Peel, M. C., Finlayson, B. L., and Mcmahon, T. A. (2007). Updated World Map of the Köppen-Geiger Climate Classification. Hydrol. Earth Syst. Sci. 11, 1633–1644. doi:10.5194/hess-11-1633-2007
Rosenfeld, D., Sherwood, S., Wood, R., and Donner, L. (2014). Climate Effects of Aerosol-Cloud Interactions. Science 343, 379–380. doi:10.1126/science.1247490
Scott, C. E., Arnold, S. R., Monks, S. A., Asmi, A., Paasonen, P., and Spracklen, D. V. (2017). Substantial Large-Scale Feedbacks between Natural Aerosols and Climate. Nat. Geosci 11, 44–48. doi:10.1038/s41561-017-0020-5
Seinfeld, J. H., Bretherton, C., Carslaw, K. S., Coe, H., DeMott, P. J., Dunlea, E. J., et al. (2016). Improving Our Fundamental Understanding of the Role of Aerosol−cloud Interactions in the Climate System. Proc. Natl. Acad. Sci. USA 113, 5781–5790. doi:10.1073/pnas.1514043113
Shindell, D. T., Faluvegi, G., Koch, D. M., Schmidt, G. A., Unger, N., and Bauer, S. E. (2009). Improved Attribution of Climate Forcing to Emissions. Science 326, 716–718. doi:10.1126/science.1174760
Twomey, S. (1977). The Influence of Pollution on the Shortwave Albedo of Clouds. J. Atmos. Sci. 34, 1149–1152. doi:10.1175/1520-0469(1977)034<1149:tiopot>2.0.co;2
Wang, J., Wang, S., Jiang, J., Ding, A., Zheng, M., Zhao, B., et al. (2014). Impact of Aerosol-Meteorology Interactions on fine Particle Pollution during China's Severe Haze Episode in January 2013. Environ. Res. Lett. 9, 094002. doi:10.1088/1748-9326/9/9/094002
Yang, X., Zhao, C., Guo, J., and Wang, Y. (2016). Intensification of Aerosol Pollution Associated with its Feedback with Surface Solar Radiation and Winds in Beijing. J. Geophys. Res. Atmos. 121, 4093–4099. doi:10.1002/2015jd024645
Zhang, W., Wang, H., Zhang, X., Peng, Y., Zhong, J., Wang, Y., et al. (2020). Evaluating the Contributions of Changed Meteorological Conditions and Emission to Substantial Reductions of PM2.5 Concentration from winter 2016 to 2017 in Central and Eastern China. Sci. Total Environ. 716, 136892. doi:10.1016/j.scitotenv.2020.136892
Keywords: aerosol variation, natural evolution, climate change, contribution analysis, satellite
Citation: Feng H, Ding Y, Zou B and Zhao C (2021) Annual Variation of Global Air Pollution: Initial Aerosol Effect or Climate Interaction?. Front. Environ. Sci. 9:790357. doi: 10.3389/fenvs.2021.790357
Received: 06 October 2021; Accepted: 22 November 2021;
Published: 14 December 2021.
Edited by:
Yang Gao, Ocean University of China, ChinaReviewed by:
Jiumeng Liu, Harbin Institute of Technology, ChinaGuangxing Lin, Institute of Atmospheric Physics (CAS), China
Copyright © 2021 Feng, Ding, Zou and Zhao. This is an open-access article distributed under the terms of the Creative Commons Attribution License (CC BY). The use, distribution or reproduction in other forums is permitted, provided the original author(s) and the copyright owner(s) are credited and that the original publication in this journal is cited, in accordance with accepted academic practice. No use, distribution or reproduction is permitted which does not comply with these terms.
*Correspondence: Bin Zou, MjEwMDEwQGNzdS5lZHUuY24=; Chuanfeng Zhao, Y3poYW9AYm51LmVkdS5jbg==