- 1College of Harbour, Coastal and Offshore Engineering, Hohai University, Nanjing, China
- 2School of Materials Engineering, Yancheng Institute of Technology, Yancheng, China
Ports are an important node of a country’s external goods circulation, as well as large consumers of energy consumption. This paper uses the STIRPAT (Stochastic Impacts by Regression on Population, Affluence, and Technology) model to study the trend of carbon emissions under different scenarios based on the energy consumption data of Chinese ports from 2010 to 2019 and analyzes the possibility of the peak carbon dioxide emission of Chinese ports. The results show that the carbon emissions of Chinese ports have peaked in 2013 under most scenarios, with CO2 emission of 9,213,500 tons and carbon emission intensity of 0.783 tons of CO2/103-tons of throughput. In addition, considering other scenarios, carbon emission action strategies should be formulated according to the differences of carbon emission peaking conditions of specific ports.
1. Introduction
According to the report released by the Intergovernmental Panel on Climate Change (IPCC) in 2014, the global climate problem has become the biggest challenge for the future development of the world, and human activities are the main factor causing the global climate problem. As a responsible major country in the world, as well as the largest energy consumer and carbon dioxide emitter, China is playing a key role in tackling global climate change.
The Chinese government has pledged to achieve the peak of carbon emissions around 2030 and will do its best to reach the peak as soon as possible (Mo et al., 2018). Due to the large differences in the social economy development, energy structure, and carbon emission characteristics of regions in China (Liu et al., 2015; Ye et al., 2017), the Chinese government has set the target of differentiated peak emission by region and industry, and the eastern region of China, transportation and other service industries should be the first to peak carbon emission (Chai, 2015). Transportation is the service industry with the highest carbon emissions in China, accounting for 9.2% of the national carbon emissions. Port is a relatively centralized and manageable link in the transportation industry with carbon emissions. Therefore, the peak of port industry carbon emissions is very important for the country to achieve as soon as possible.
At present, many experts and scholars are focused on the issues of carbon emission peak at the level of administrative regions. Particularly some studies emphasized the promotion of green technology to reduce environmental emissions (Zhao et al., 2020; Zhao et al., 2021). Moreover, the negative impacts of environmental pollution on human health were also determined (Gu et al., 2019; Gu et al., 2020). Others optimized inputs at the farm level to reduce the negative impacts of emissions on human health and the environment (Elahi et al., 2019a; Elahi et al., 2019b). Some scholars determined the socio-psychological factors for the adoption of technology and strategies (Woldegebrial et al., 2018; Elahi et al., 2021). However, until now limited studies focused on carbon emission in specific industries. Therefore, it is of great practical significance to study the future trend of carbon dioxide emissions from Chinese ports and formulate targeted strategies to provide a scientific basis for peaking national overall carbon emissions and a new focus for improving the comprehensive development capacity of ports.
The research steps are as follows: first, calculate the energy emission of Chinese ports from 2010 to 2019; second, the STIRPAT model was used to select port throughput, port container throughput, 10,000-ton berth number, and carbon emission intensity of port throughput as influencing factors to build a prediction model of carbon emission of Chinese ports through regression fitting. Third, different scenarios are set to predict the future carbon emission trend of Chinese ports; fourth, analyze the trend of carbon emissions from Chinese ports and provide policy suggestions for the green development of Chinese ports.
2. Materials and Methods
Chinese ports are widely distributed, and there are great differences in port development and carbon emissions. This paper studies the peak carbon emissions of ports in China, including the total of coastal ports and inland ports.
2.1 Data Sources
The data used in this paper are from China Statistical Yearbook (2010–2020), China Port Yearbook (2010–2020), Provincial and Municipal Statistical Yearbook (2010–2020), and China Energy Statistical Yearbook (2010–2020). The basic data of carbon emission impact analysis of Chinese ports are shown in Table 1.
2.2 Carbon Emission Accounting
Carbon emissions of one port are mainly composed of two parts. One is the direct energy emissions, which mainly refers to fossil fuels such as diesel, gasoline, natural gas, and other emissions. The second is indirect energy emissions, which mainly refers to the resources from the pipe network such as electricity and hot water. Although there are no direct emissions of carbon dioxide, the production of these resources also consumes energy and releases carbon dioxide. According to IPCC guidelines, the calculation formula of energy-related carbon dioxide emissions from Chinese ports is shown in .
where
2.3 Stochastic Impacts by Regression on Population, Affluence, and Technology Model Construction
The traditional STIRPAT model was developed from IPAT (I=Human Impact, P=Population, A = Affluence, T = Technology) model. The IPAT model has been widely applied since it was proposed in the 1970s. This model can be used to study the impact of population, and economic and technological factors on environmental pressure, and its expression is shown in Formula (2):
where I is environmental pressure, including resource and energy emissions and greenhouse gas emissions, etc.; P represents population size; A is the degree of wealth, that is, the level of economic development; and T is the technical level.
However, the IPAT model has certain limitations. It assumes that different factors contribute the same to environmental pressure, which is inconsistent with the hypothesis of the environmental Kuznets curve (Xu et al., 2016). To overcome the limitations of this model, York proposed the STIRPAT model on the basis of the IPAT model (Huang et al., 2021), and its expression is shown in :
where I is environmental pressure; P represents population size; A is the degree of wealth; and T is defined as the technical level. A is the model coefficient; b, c, and d, respectively, represent the elastic coefficient of P, A, and T, and e is the random error term.
In the empirical analysis, the logarithm of both sides of Eq. 3 can be expressed as .
where
The STIRPAT model rejects the assumption of unit elasticity and adds randomness, which is convenient for empirical analysis (Xu et al., 2020; Chai et al., 2021). According to existing research, when studying carbon emissions from ports, the four factors including throughput, container throughput, the number of 104-ton wharf, and intensity of energy consumption per unit throughput of the port are widely applied in the studies related to port carbon (Ge and Wang, 2021), and can significantly affect carbon emissions (Zheng et al., 2018; Wu et al., 2020; Zhou et al., 2020; Guo et al., 2020a; Guo et al., 2020b). Therefore, the four factors are selected in this article as the influence factors of carbon emissions to build the extended STIRPAT model, and its expression is
where I is the emission of standard coal (tons of carbon dioxide); P is port throughput (109 tons); A is the port container throughput (106 TEU); T is the number of 104-ton wharves of the port (unit); GT is the energy consumption intensity of port throughput (the amount of standard coal consumed per ton of throughput, t/103t); b, c, d, and f, respectively, show the elastic coefficient of each variable,
3. Results and Discussion
3.1 Model Regression Fitting and Result Analysis
The throughput, container throughput, 10,000-ton berth number, and energy consumption intensity in the basic data of influencing factors analysis of carbon emissions of Chinese ports were taken as explanatory variables, and the carbon emissions of Chinese ports were taken as explained variables. The linear regression analysis of the model was conducted by using SPS-26 software. During the analysis, the statistical data were first logarithmically processed and then input into SPSS software. In linear regression, due to the multicollinearity among all the influencing factors, the collinear statistical VIF (variance inflation factor) is relatively large. The results of linear regression analysis after logarithmic processing of basic port data are shown in Table 2.
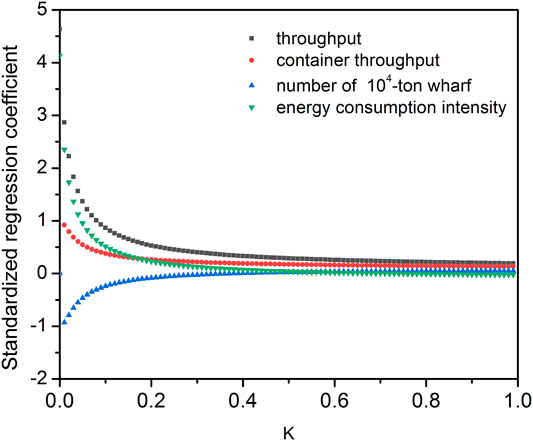
It can be seen from Table 2 that VIF values are all greater than 100, indicating collinearity among variables. In order to avoid multicollinearity, this paper adopts ridge regression analysis to fit carbon emissions and various influencing factors based on the extended STIRPAT model to build the carbon emissions model of Chinese ports. The correlation ridge trace diagram is shown in Figure 1.
The ridge trace diagram shows that the data are convergent, and the suggested K value is 0.01 < 0.05, a small K value indicates good fitting degree, and the regression model is suitable for analysis. After the value of K = 0.01 is determined, ridge regression operation is carried out, and the obtained regression results are shown in Table 3.
The adjusted R2 value of the regression equation after ridge regression treatment was 0.925, indicating a high degree of fitting of the equation. In addition, the F value of the regression equation was 15.319, and the p value was 0.005 < 0.05, indicating that the equation passed the overall significance test. The regression equation is shown as :
Through the regression fitting result of carbon emissions of the target port, it can be concluded that port throughput, container throughput, and port throughput carbon emission intensity have a positive impact on port carbon emissions, while the number of 10,000-ton docks has a negative impact.
3.2 Future Carbon Emission Trend Analysis of Chinese Ports
3.2.1 Carbon Emission Scene Setting of Chinese Ports
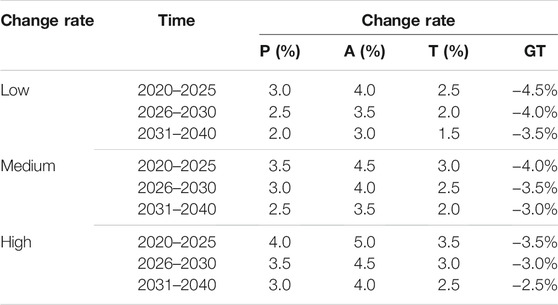
In the prediction model of Chinese port carbon emissions, the change rates of throughput, container throughput, 104-ton berth number, and energy consumption intensity are set at low, medium, and high values. Among them, the median value is set according to the relevant policies and historical data trends of the above four quantities. In the setting of low value and high value, the change rate of each influencing factor is adjusted based on the median value. At the same time, the future change rate of the four related factors also comprehensively considers the impact of the new situation, such as COVID-19 and economic anti-globalization, on each factor (Corinne et al., 2020). Among these factors, COVID-19 will have a long-term impact on port throughput and container throughput, while other factors are less affected. Therefore, the rate of change in port throughput and container throughput has decreased based on trends set by relevant policies and historical data. The values listed in Table 4 are the change rates of influencing factors of ports in China.
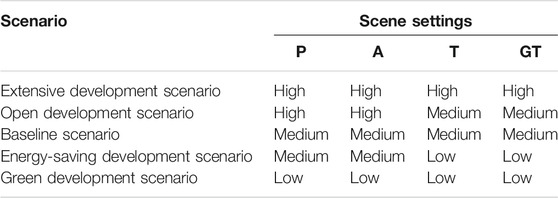
According to the change rates of three influencing factors of ports in China, five development scenarios are established, namely, completely extensive development scenario, optimized development scenario, baseline scenario, energy-saving development prospect and green development prospect, and the trend of carbon emission of each province is predicted. Table 5 shows the detailed settings for the five scenarios.
Extensive development prospect (Q1): All the influencing factors are taken as high values. This scenario reflects that the port takes development as the main goal and pays less attention to carbon emissions and climate change. The port development is a relatively extensive way. In this scenario, rapid port development will inevitably lead to high energy emission and high environmental pollution, and the influencing factors of carbon emission of each port will remain at a high level.
Open development scenario (Q2): Two throughput rates are high, but each berth number and energy consumption per unit throughput rate is moderate, the situation is each berth number and throughput per unit energy consumption to maintain the existing rate unchanged, under the condition of port throughput to maintain rapid growth, so the port’s carbon emissions will remain in a higher position.
Baseline scenario (Q3): All influencing factors are removed from the median. This scenario reflects that the development of the port will maintain the current speed of steady development and the port’s carbon emissions will also maintain a moderate level.
Energy saving development prospect (Q4): Two throughput indicators of the port maintain the current development rate, and the remaining two indicators maintain a low rate of change. In this scenario, carbon emission of each port will remain at a relatively low level.
Green development outlook (Q5): All the factors are low, the scene not only reflects the port’s throughput of port development as the main target, but attaches great importance to the green development, the port will give full consideration to the society, environment, climate, and so on demand, to realize green development, so the prospects for the port’s carbon emissions will be significantly lower than the benchmark scenario port of carbon emissions.
3.2.2 Carbon Emission Trend Analysis of Chinese Port
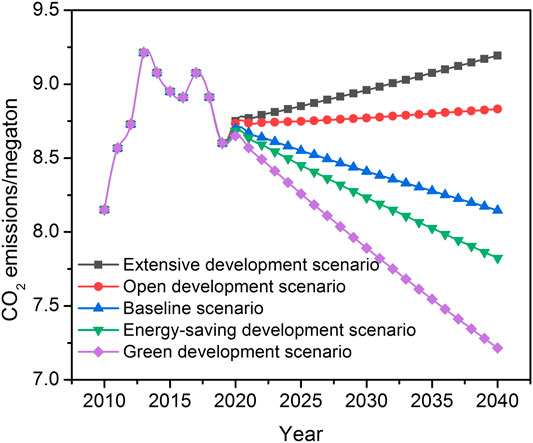
According to the prediction model of Chinese port carbon emissions, and combining with five scenarios, the carbon emissions of each target port during 2020–2040 under different scenarios are calculated (Figure 2), and the carbon peak situation of this port under different scenarios is estimated.
In the Q1 scenario, the carbon emissions of Chinese ports cannot reach the peak and will continue to increase after 2020. In Q2, the carbon emission of Chinese ports will grow slowly, but it should not peak again. In Q3, the carbon emission of Chinese ports will decline again from 2020. Under this scenario, the peak of carbon emissions of Chinese ports is 9.2135 million tons in 2013, and the carbon emission intensity of port throughput in this year is 0.783 tons of carbon dioxide/thousand tons of throughput. In Q4 and Q5 scenarios, the peak of Chinese port carbon emissions is consistent with the baseline scenario, but the decline of carbon emissions is faster.
According to the above analysis, it can be concluded that carbon emissions will peak earlier and at a low peak level if paying attention to the green development of ports. On the contrary, if the extensive development of ports is completely abandoned and the pollution emission control is not strong enough, it will inevitably lead to a large amount of energy emissions. Port energy conservation and emission reduction should not be at the expense of port development. Therefore, based on the baseline scenario, it is supposed to effectively improve port operation efficiency and reduce coal power ratio along with energy consumption per unit throughput in order to effectively reduce port carbon emissions and promote the peak of port carbon emissions in advance.
4. Policy Suggestions
Through the analysis of statistical data and forecast data, it is highly likely that China’s port carbon emissions will reach the peak in 2013, but there is still a lot of work to be done in order to achieve zero port carbon emissions.
In order to realize the dual carbon goal proposed by the state as soon as possible, the Chinese port industry needs to take measures to strengthen the recommendation of energy conservation and emission reduction. Specific suggestions are as follows.
First, the government has issued policies to promote port enterprises to start from port operation and production, increase technological input, improve operation efficiency, and strive to reduce the carbon emission intensity of unit throughput.
Second, we should guide port enterprises to rapidly increase the proportion of electric energy in total energy consumption and reduce direct energy consumption such as gasoline and diesel. For example, offshore electricity is used for berthed ships and oil is used for related operating machinery and vehicles.
Third, guide port enterprises to make use of their unique advantages of being close to the sea to build distributed power stations using wind and solar power to provide clean energy for port production and life.
Fourth, the government should coordinate the development of ports in different regions. Ports in the more developed areas of the Yangtze River Delta and Pearl River Delta should strengthen cooperation with ports in less developed areas to promote technological progress in energy conservation and emission reduction.
The above policy suggestions are put forward under the existing data analysis and technical conditions, which may not fully conform to the future development trend. With the deepening of environmental protection awareness and the progress of energy-saving technology, the application of green energy technology and the construction of energy storage technology will become the research trend in the future.
Data Availability Statement
The original contributions presented in the study are included in the article/Supplementary Material, further inquiries can be directed to the corresponding authors.
Author Contributions
All authors contributed equally to collation of relevant information from extensive literature search. FS analysed the data and wrote and edited the manuscript. LZ prepared, edited and submitted the manuscript. All authors have read and agreed to the published version of the manuscript.
Conflict of Interest
The authors declare that the research was conducted in the absence of any commercial or financial relationships that could be construed as a potential conflict of interest.
Publisher’s Note
All claims expressed in this article are solely those of the authors and do not necessarily represent those of their affiliated organizations, or those of the publisher, the editors, and the reviewers. Any product that may be evaluated in this article, or claim that may be made by its manufacturer, is not guaranteed or endorsed by the publisher.
References
Chai, Z., Simayi, Z., Yang, Z., and Yang, S. (2021). Examining the Driving Factors of the Direct Carbon Emissions of Households in the Ebinur Lake Basin Using the Extended STIRPAT Model. Sustainability 13 (3), 1339–1352. doi:10.3390/su13031339
Corinne, L. Q., Robert, B. J., Matthew, W. J., Adam, J. P. S., Sam, A., Robbie, M. A., et al. (2020). Temporary Reduction in Daily Global CO2 Emissions during the COVID-19 Forced Confinement. Nat. Clim. Change 10 (7), 647–653. doi:10.1038/s41558-020-0797-x
Elahi, E., Weijun, C., Zhang, H., and Abid, M. (2019). Use of Artificial Neural Networks to rescue Agrochemical-Based Health Hazards: A Resource Optimisation Method for Cleaner Crop Production. J. Clean. Prod. 238 (C), 117900–117912. doi:10.1016/j.jclepro.2019.117900
Elahi, E., Weijun, C., Zhang, H., and Nazeer, M. (2019). Agricultural Intensification and Damages to Human Health in Relation to Agrochemicals: Application of Artificial Intelligence. Land Use Policy 83, 461–474. doi:10.1016/j.landusepol.2019.02.023
Elahi, E., Zhang, H., Lirong, X., Khalid, Z., and Xu, H. (2021). Understanding Cognitive and Socio-Psychological Factors Determining Farmers’ Intentions to Use Improved Grassland: Implications of Land Use Policy for Sustainable Pasture Production. Land Use Policy 102, 105250–105261. doi:10.1016/j.landusepol.2020.105250
Ge, Y. Y., and Wang, S. S. (2021). Analysis of Port Total Factor Productivity and its Influencing Factors Considering Carbon Emissions. Transportation Syst. Eng. Inf. 21 (2), 22–29. doi:10.16097/j.cnki.1009-6744.2021.02.004
Gu, H., Cao, Y., Elahi, E., and Jha, S. K. (2019). Human Health Damages Related to Air Pollution in China. Environ. Sci. Pollut. Res. Int. 26 (13), 13115–13125. doi:10.1007/s11356-019-04708-y
Gu, H., Yan, W., Elahi, E., and Cao, Y. (2020). Air Pollution Risks Human Mental Health: an Implication of Two-Stages Least Squares Estimation of Interaction Effects. Environ. Sci. Pollut. Res. 27 (2), 2036–2043. doi:10.1007/s11356-019-06612-x
Guo, J., Kuang, H. B., and Yu, F. P. (2020). Study on the Formation Mechanism of Low-Carbon Ports Based on Gamma: A Case Study of Rizhao Port. Sci. Res. Manag. 41 (5), 240–249. doi:10.19571/j.cnki.1000-2995.2020.05.024
Guo, J., Kuang, H. B., and Yu, F. P. (2020). Study on Port Carbon Footprint Measurement and Drive Factors from the Perspective of Energy Consumption. Management Eeview 32 (08), 40–51. doi:10.14120/j.cnki.cn11-5057/f.2020.08.004
Huang, Y., Duan, M. J., Yang, J., and Wei, Y. L. (2021). Research on Spatial Effects of Environmental Ethics in Provinces of China Based on Improved STIRPAT. J. Stat. Inf. 36 (3), 95–106. doi:10.3969/j.issn.1007-3116.2021.03.008
Liu, Z., Guan, D., Moore, S., Lee, H., Su, J., and Zhang, Q. (2015). Climate Policy: Steps to China's Carbon Peak. Nature 522 (7556), 279–281. doi:10.1038/522279a
Mo, J. L., Duan, H. B., Fan, Y., and Wang, S. Y. (2018). Chinese Energy and Climate Policy Objectives in the Paris Agreement: Comprehensive Evaluation and Policy Options. Econ. Res. 53 (9), 168–181.
Woldegebrial, Z., Guido, V. H., Girmay, T., Hossein, A., and Stijn, S. (2018). Impacts of Socio-Psychological Factors on Actual Adoption of Sustainable Land Management Practices in Dryland and Water Stressed Areas[J]. Sustainability 10 (9), 2963–2985. doi:10.3390/su10092963
Wu, J. N., Lu, J., and Lin, Y. (2020). Research on Port Emission Reduction Strategy Based on Three-Stage Game Model under the Condition of Ship Using Shore Power. Maths. Pract. Cogn. 50 (7), 27–37.
Xu, B., Luo, L., and Lin, B. (2016). A Dynamic Analysis of Air Pollution Emissions in China: Evidence from Nonparametric Additive Regression Models. Ecol. Indicators 63, 346–358. doi:10.1016/j.ecolind.2015.11.012
Xu, F., Huang, Q., Yue, H., He, C., Wang, C., and Zhang, H. (2020). Reexamining the Relationship between Urbanization and Pollutant Emissions in China Based on the STIRPAT Model. J. Environ. Manage. 273, 111134–111143. doi:10.1016/j.jenvman.2020.111134
Ye, B., Jiang, J., Li, C., Miao, L., and Tang, J. (2017). Quantification and Driving Force Analysis of Provincial-Level Carbon Emissions in China. Appl. Energ. 198, 223–238. doi:10.1016/j.apenergy.2017.04.063
Zhao, X., Peng, B., Elahi, E., Zheng, C., and Wan, A. (2020). Optimization of Chinese Coal-Fired Power Plants for Cleaner Production Using Bayesian Network. J. Clean. Prod. 273, 122837–122849. doi:10.1016/j.jclepro.2020.122837
Zhao, Y., Peng, B., Elahi, E., and Wan, A. (2021). Does the Extended Producer Responsibility System Promote the green Technological Innovation of Enterprises? an Empirical Study Based on the Difference-In-Differences Model. J. Clean. Prod. 319, 128631–128643. doi:10.1016/j.jclepro.2021.128631
Zheng, Y., Jiang, X. H., Xue, L., and Yu, W. (2018). Study on Carbon Emission Quantification Method of Container Port Equipment: A Case Study of PORT A. Logistics Technol. 37 (12), 67–71. doi:10.3969/j.issn.1005-152X.2018.12.014
Keywords: peak carbon dioxide emission, STIRPAT model, scenario analysis, Chinese ports, container throughput
Citation: Fan S and Lu Z (2022) Research on the Peak Carbon Dioxide Emission Strategy of Chinese Port Based on Carbon Emission Estimation. Front. Environ. Sci. 9:789970. doi: 10.3389/fenvs.2021.789970
Received: 09 October 2021; Accepted: 30 November 2021;
Published: 28 January 2022.
Edited by:
Xander Wang, University of Prince Edward Island, CanadaReviewed by:
Vijay Bhaskar Bojan, Madurai Kamaraj University, IndiaEhsan Elahi, Shandong University of Technology, China
Copyright © 2022 Fan and Lu. This is an open-access article distributed under the terms of the Creative Commons Attribution License (CC BY). The use, distribution or reproduction in other forums is permitted, provided the original author(s) and the copyright owner(s) are credited and that the original publication in this journal is cited, in accordance with accepted academic practice. No use, distribution or reproduction is permitted which does not comply with these terms.
*Correspondence: Shenghai Fan, ZGFoYWkwMDRAMTYzLmNvbQ==; Ziai Lu, aGh1bHphQDE2My5jb20=
 Shenghai Fan
 Ziai Lu1*


