
94% of researchers rate our articles as excellent or good
Learn more about the work of our research integrity team to safeguard the quality of each article we publish.
Find out more
ORIGINAL RESEARCH article
Front. Environ. Sci., 14 December 2021
Sec. Atmosphere and Climate
Volume 9 - 2021 | https://doi.org/10.3389/fenvs.2021.788115
This article is part of the Research TopicAir Pollution Remote Sensing and the Subsequent Interactions with Ecology on Regional ScalesView all 31 articles
In order to investigate the chemical composition distributions and pollution characteristics of Total water-soluble inorganic ions (TWSII) in the rain period (Meiyu) in the East Asian summer monsoon season, including the impact of Meiyu on air pollution in the Yangtze River Delta, East China, the gaseous pollutant concentrations, the 9 sizes segregated particles, and water-soluble inorganic ions of aerosols were measured on the north shore of Taihu Lake from June 4 to July 5, 2016. Results show that the mass concentrations of atmospheric particulate matters (PM2.5 and PM10) and main gaseous pollutants (SO2, NO2, CO, and O3) decrease during the Meiyu period, with the largest decline in PM10 and the smallest in CO. TWSII in atmospheric particles are mainly concentrated in fine particles during the Meiyu period. The values of ρ (TWSII) for PM1.1, PM1.1–2.1, and PM2.1–10 before the Meiyu onset are generally greater than those during the Meiyu period. During the first pollution process, the ρ(TWSII) for PM1.1 and PM1.1–2.1 first increase to the peak values, and then decrease during the moderate rainfall period, when the ρ(TWSII) in PM2.1–10 increase to its maximum before the Meiyu onset. The mass concentrations for anions, cations, and total ions at different particle-size sections all exhibit bimodal distributions before and after the Meiyu onset. The mass concentration peaks at a particle size of 1.1–2.1 μm for fine particles, while at 5.8–9.0 μm (before the Meiyu onset) and 9.0–10.0 μm (during the Meiyu period) for coarse particles, respectively. The peak particle size for mass concentration of coarse particles moves toward larger sizes during the Meiyu period. The mass concentrations of SO42− at different particle-size sections show a bimodal distribution before the Meiyu onset and a multi-modal distribution during the Meiyu period. The mass concentrations of NO3− at different particle-size sections show a bimodal distribution before the Meiyu onset and a unimodal distribution during the Meiyu period. The mass concentrations of NH4+ at different particle-size sections present a bimodal distribution before and after the Meiyu onset, with the particle-size for peak concentrations distributing in 1.1–2.1 and 5.8–9.0 μm before the Meiyu onset, and 9.0–10.0 μm during the Meiyu period. The mean value of nitrogen oxidation ratio (NOR) is higher before the Meiyu onset than after, indicating that the secondary conversion of NO2 before the Meiyu onset is enhanced. The sulfur oxidation ratio (SOR) values are greater than NOR values, but the concentrations of NO2 in the same period during the Meiyu period are higher than those of SO2, which indicates that the secondary conversion of SO2 during the Meiyu period on the north bank of Taihu Lake is stronger than that of NO2. During the whole observation, the contribution of stationary sources mainly contributed to the atmospheric particulate matters during the Meiyu period. The contributions of vehicle exhaust and coal combustion to fine particles are more obviously affected by the changes in meteorological conditions during the Meiyu period, and the vehicle emissions contribute more to PM1.1–2.1 than to PM1.1.
In recent years, the negative impact of particulate matter on air quality, climate, and human health in China has attracted more and more public attention (Huang et al., 2018; Zhou et al., 2018; Liu et al., 2019; Zhang et al., 2019; Gu et al., 2020; Gui et al., 2020; Zhang et al., 2020; Wang et al., 2021). Atmospheric particulate matter includes primary particulate matter and secondary particulate matter (Dai et al., 2013; Wang S. et al., 2019). Primary particulate matter is usually produced by direct emissions of pollutant sources, such as soil dust from the ground, roads, and construction sites, biomass burning, and sea salt particles transported from the ocean. The secondary particulate matter is generally formed by the oxidation reaction of SO2 (sulfur dioxide), NOX (nitrogen dioxide), NH3(ammonia), and other gases (Yao et al., 2020).
Long-term exposure to fine particulate matter (PM2.5) is one of the risk factors for excess deaths in China, with heavy smog significantly increasing the risk of acute death among residents (Wang et al., 2015, 2020). Previous studies have found that WSII accounts for 30–80% of urban particulate matter (Shen, et al., 2009; Tan, et al., 2009; Wang et al., 2015). It can be seen that WSII is an important component of particulate matter, and the study of characteristic changes of WSII helps us to have a deeper understanding of the physical and chemical properties, sources, and formation mechanism of particulate matter (Guo et al., 2020; Wang et al., 2019 b). Some studies have found that there are significant seasonal differences in WSII concentration (Qiao et al., 2015). Gao, et al. (2016) found that NO3−, SO42-, and NH4+ (SNA) in WSII were characteristic ions of secondary pollution. The proportion of SNA mass concentration in PM2.5 ranges from 20 to 70%, and even exceeds 70% (He et al., 2017). Guo et al. (2010) and Zhang et al. (2018) studied that the ion mass concentration spectrum can be used to investigate the formation mechanism of WSII. Some studies have found that the concentration of NO3− and SO42- in droplet modes increases significantly in the process of pollution, and their peak particle sizes move towards larger particle sizes (Sun et al., 2013; Tian et al., 2016).
Located on the north bank of Taihu Lake, Wuxi is one of the central cities in the Yangtze River Delta region with a dense population, large industrial volume, and a high level of urbanization. With the rapid development of the regional economy, a large amount of energy consumption and the continuous growth of motor vehicle ownership, the air quality of Wuxi presents complex air pollution dominated by PM2.5, PM10, O3, and NO2 (Guo et al., 2013). Meiyu in Jianghuai Region is an important weather phenomenon in eastern China, and the meiyu rainy season precipitation is a product of interactions between the East Asian summer monsoon system and the Eurasian mid-high-latitude circulation (Xia et al., 2021). Due to the prevailing wind direction and precipitation in the monsoon climate, the air quality in Wuxi is relatively clean in summer compared with winter. However, in the summer harvest and planting stage in June, the particulate matter emitted from straw burning will lead to haze pollution events in Wuxi (Guo et al., 2013; Wang et al., 2021).
In this study, we collected size-segregated aerosol samples in Wuxi during an intensive sampling campaign from June to July 2016. The primary motivation of this study is to determine the chemical composition distributions and pollution characteristics of the TWSII species in the nine size segregated particles in the season changing period, including evolution in the components and particle size changes in the pollution process. Furthermore, the correlation of sulfur and nitrogen oxidation rates with the meteorological conditions were investigated to clarify the dominant meteorological factors affecting the secondary formation of sulfate and nitrate in different size fractions. The results would improve our understanding of the secondary formation of haze pollutions in the economically developed area during the Meiyu period and can also provide insight for the investigation of the human health effects of urban particulate matter in different sizes.
First, the instruments, experiments, data, and analysis methods are described in Experiments and Data. We analyze the meteorological conditions pollutions features, spectral distribution, and ionic species of aerosol in Results and discussion. Concluding is made in Conclusion.
Wuxi is located in the middle of the Yangtze River Delta, on the northern shore of Taihu Lake. In this study, we selected Wuxi meteorological observational station (WMOS, 31.6127°N, 120.3544°E, altitude: 3.2 m) as the sampling site (Figure 1). All the measurements were conducted on June 4 to July 5, 2016 (Guo et al., 2013; Liu et al., 2018). The monitoring site is surrounded by farms and is located on the ground. Thus, the observations at this site could help further understand the atmospheric pollution condition in the Yangtze River Delta Cities Group Area (YRDCGA) and the influences from the inland or upwind polluted areas and the Taihu Lake in a regional air quality perspective.
The observation of aerosol particles was conducted by using a 9-stage Anderson-type aerosol sampler (Anderson 2000 Inc., United States). 31 batches of aerosol samples were gathered across the Meiyu period in Wuxi. The sampling was conducted on the Meteorological observation field. 24 h size-fractioned PM samples were taken continuously for 1 month (begin at 8:00 am the first day and end at 08:00 the next day) at the flow rate of 28.3 L/min. The particle size range of the nine stages are <0.43, 0.43–0.65, 0.65–1.1, 1.1–2.1, 2.1–3.3, 3.3–4.7,4.7–5.8, 5.8–9.0, and 9.0–10.0 µm for water-soluble ionic components.
The sampling instrument was using the 80 mm Teflon filter (Whatman, Clifton, England) for water-soluble inorganic ionic components, and the membranes were weighted by Mettler Toledo MX-5 microbalance after constant temperature (25°C) and humidity (50%) treatment for 48 h before and after sampling, the microbalance was calibrated using standard weight. The weight difference before and after sampling is particle weight (Wang et al., 2015; Liu et al., 2018).
The 850 professional Ion Chromatography (IC) (Metrohm, Switzerland) was used to analyze the water-soluble inorganic ions, NO3−, SO42-, NH4+, Ca2+, Mg2+, Na+, K+, Cl−, F−, and NO2− were measured. Chromatography includes a conductivity detector, column oven, with an 858 auto-injector, and MagIC Net chromatography workstation (Metrohm, Switzerland); Detailed information can be referred to Wang et al. (2015).
In this study, monitoring instruments (Thermo-Fisher Scientific, United States) were selected to analyze gaseous pollutants, including CO (48i), NO2 (42i), O3 (49i), and SO2 (43i), and the particulate matters, including PM10 and PM2.5 during the sampling times. The meteorological parameters, including relative humidity (RH), pressure, vapor pressure, precipitation, dew point temperature (Td), temperature (T), visibility, wind direction (WD), and wind speed (WS). All the data were obtained hourly from the Wuxi meteorological observational station (MOS) worked synchronously on the observation site.
Meiyu (rainy period of East Asian monsoon season) is a weather phenomenon with regional and temporal characteristics in the middle and lower reaches of the Yangtze River in China (Xiang et al., 2016). It is the product of the transition season of east Asian atmospheric circulation from spring to summer. There is always a persistent precipitation stage of Meiyu from June to July every year, which is called Meiyu period for the middle and lower reaches of the Yangtze River. During the Meiyu periods, precipitation shows obvious interannual variabilities (Xia et al., 2021).
Based on the observation of the Meiyu period lasting from June 19, 2016, to July 11 on the north bank of Taihu Lake, the periods from June 4, 2016, to June 18, 2016, and from June 19, 2016, to July 5, 2016, are defined respectively before and after the onset of Meiyu in this study. The total precipitation during the Meiyu period is 404.5 mm, which is much greater than that (105.4 mm) before the Meiyu onset.
The changes of meteorological conditions on the north bank of Taihu Lake during the observation period are shown in Table 1 and Figure 2. The surface pressure, wind speed, and temperature change little around the onset of Meiyu. During the observation period, the average wind speed maintains about 2.0 m s−1, while the air temperature keeps in the range of 19.0°C–33.0°C with an average of 25.2°C. The frequency and amount of precipitation increase significantly after the Meiyu onset, with the precipitation increasing from 105.4 mm (from June 4 to June 18) to 404.5 mm (from June 19 to July 11). The precipitation increase leads to significant increases in surface water-vapor pressure, relative humidity, and dew-point temperature. Specifically, the average surface water-vapor pressure is 25.3 hPa before the Meiyu onset, which is significantly lower than that (29.8 hPa) during the Meiyu period. The average dew-point temperatures (relative humidity) before and after the onset of Meiyu are 21.2 and 23.9°C (82.9 and 90.7%), respectively. Comparatively, the relative humidity after the onset of Meiyu is closer to saturation than before. Moreover, the wind direction changes obviously and frequently during the Meiyu period on the north bank of Taihu Lake.
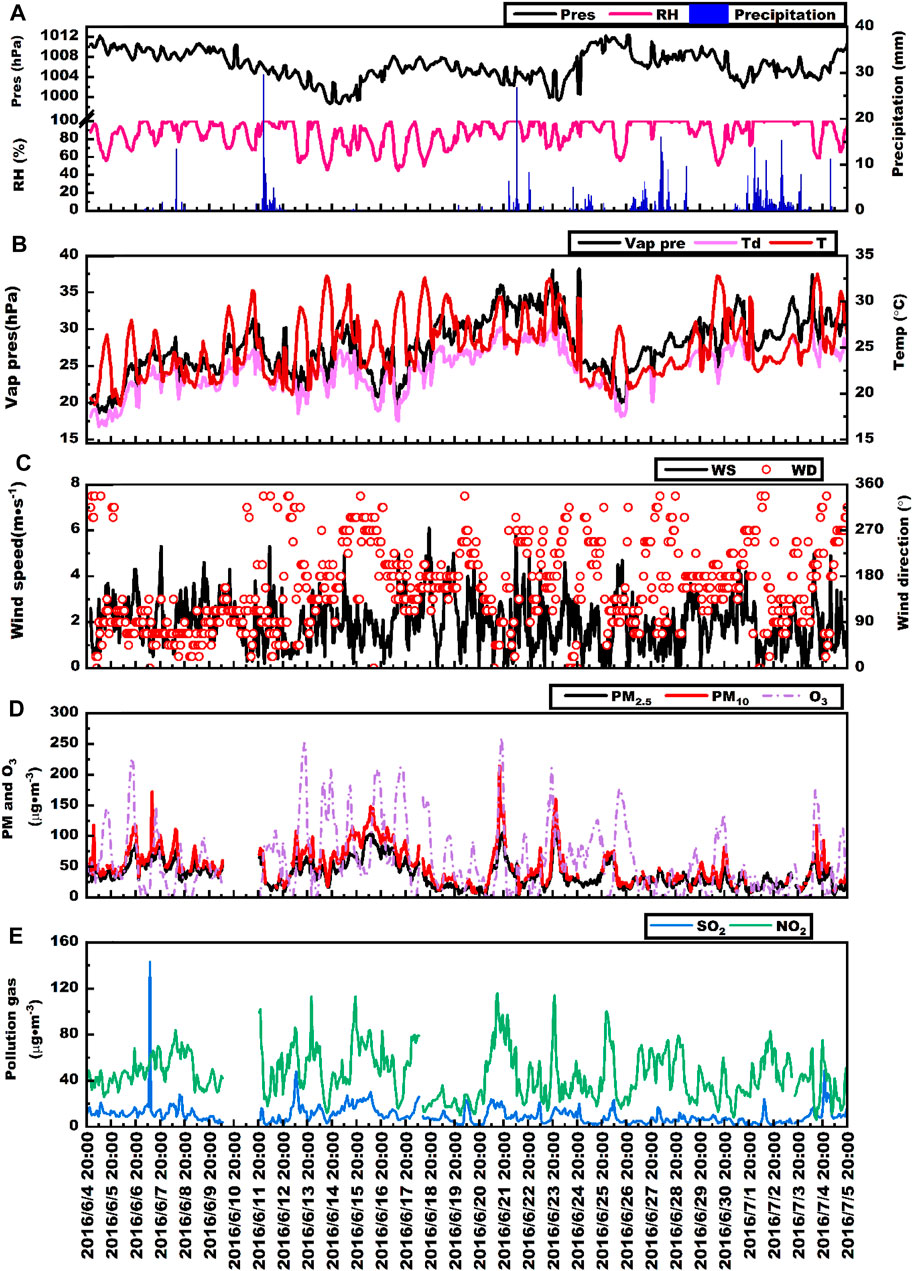
FIGURE 2. Changes of meteorology, gaseous pollutants records, PM2.5 and PM10 concentrations in sampling periods.
Table 2 shows the daily mean concentrations of PM2.5, PM10, and main gaseous pollutants before and after the onset of Meiyu. The mass concentrations of five main air pollutants after the onset of Meiyu significantly decrease due to the rainfall influence. Specifically, the mass concentrations of PM10 and PM2.5 are 65.36 and 50.20 μg m−3 before the onset of Meiyu, which respectively drop to 38.27 and 29.05 μg m−3 after the Meiyu onset. For gaseous pollutants, the mass concentrations of SO2, NO2, and O3 decrease from 12.10, 51.77, and 77.83 μg m−3 to 7.91, 41.51, and 51.89 μg m−3, respectively.
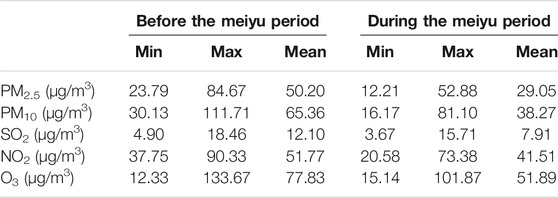
TABLE 2. The daily average concentration of PM2.5, PM10, and gaseous pollutants before and during the Meiyu period.
Before the Meiyu onset, the north bank of Taihu Lake experienced two pollution processes. The first process lasted from 0800 Beijing Time (BJT) on June 6 to 2000 BJT on June 9, and the second process lasted from 2000 BJT on June 12 to 2000 BJT on June 18. The mass concentrations of PM2.5 and PM10 peaked at 112 and 172 μg m−3 in the first process, and peaked at 103 and 148 μg m−3 during the second process (Figures 2D,E). Although the pollution process during the Meiyu period is not as long as that before the Meiyu onset, the mass concentrations of air pollutants during this period also experienced short fluctuations, where the mass concentrations of PM2.5 reached 106 and 120 μg m−3 at 2000 BJT on June 21 and 2300 BJT on June 23, respectively (Figures 2D,E). According to the hourly precipitation (Figure 2) in the Meiyu period, these two fluctuations occurred during the intermittent period of precipitation. While the mass concentrations of air pollutants were significantly lower during other periods, which maintained below 30 μg m−3 for PM2.5. The precipitation increase and changeable wind direction could be the reasons for the decline of air pollutants.
Table 3 depicts the differences between the concentrations of water-soluble inorganic ions before and after the onset of Meiyu. The average concentration of total water-soluble inorganic ions (ρ(TWSII)) in PM10 is (28.59 ± 7.27) μg m−3, while the average ρ(TWSII) in PM1.1, PM1.1–2.1 and PM2.1–10 are (11.22 ± 3.90) μg m−3 (5.18 ± 2.77) μg m−3 and (12.19 ± 2.89) μg m−3, respectively. Before the onset of Meiyu, the average ρ(TWSII) in PM1.1, PM1.1–2.1 and PM2.1–10 are 13.36 ± 4.84, 6.55 ± 3.46, and 12.3 ± 3.46 μg m−3, and they are 9.34 ± 3.72, 3.98 ± 2.19, and 12.10 ± 5.3 μg m−3 after the onset of Meiyu, with the ρ(TWSII) decreasing by 30, 39 and 2%, respectively. The values of ρ (TWSII) in fine and coarse particles before the Meiyu onset are higher than those during the Meiyu period.

TABLE 3. The average concentrations (μg/m3) of WSII in particulate matters before and during the Meiyu period.
As shown in Figure 3A, the total proportions of four major water-soluble inorganic ions (NH4+, Ca2+, SO42− and NO3−) in PM1.1 and PM1.1–2.1 are 82 and 87%, respectively. The major water-soluble inorganic ions for PM2.1–10 areCa2+, NH4+, SO42− and Na+, accounting for 72% of the total. The anion with the largest proportion in PM1.1, PM1.1–2.1, and PM2.1–10 is SO42−. Besides, the cation with the largest proportion in PM1.1 and PM1.1–2.1 is NH4+, but it is Ca2+ in PM2.1–10. It indicates that NH4+ mainly exists in fine particles, while Ca2+ mainly in coarse particles. Furthermore, the concentration of NH4+ decreases with the increase of particle size before and after the onset of Meiyu (Figure 3B).
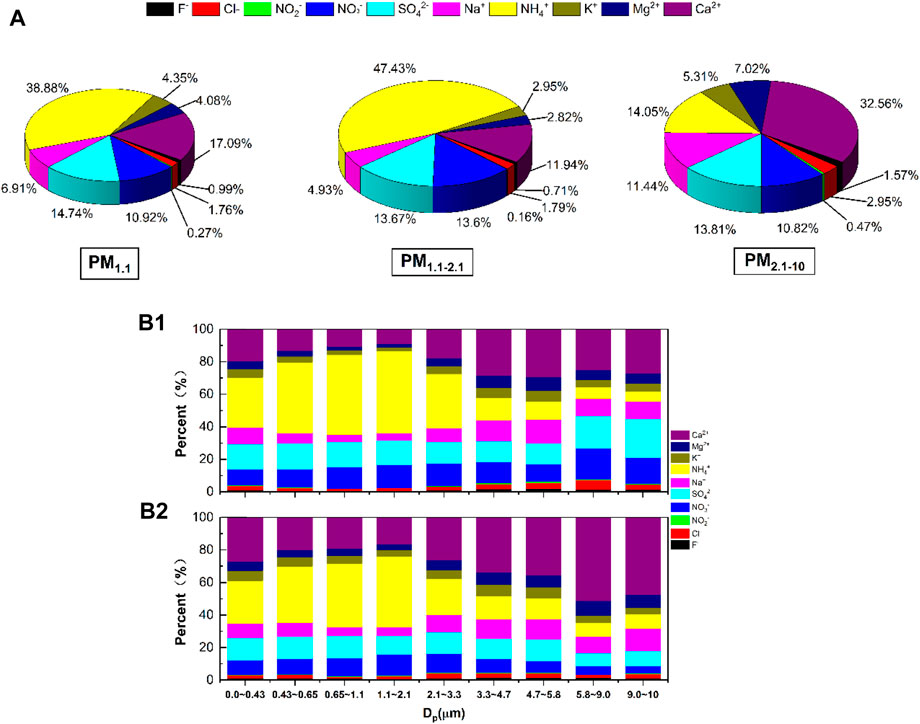
FIGURE 3. Mass percentage of (A) major ions in the PM1.1, PM1.1-2.1 and PM2.1-10, and rations distribution of WSII mass concentration in different size distribution and period (b1: before the Meiyu period, b2: during the Meiyu period).
The concentrations of NH4+, Ca2+, SO42− and NO3− rank top four in submicron particles, fine particles, or coarse particles before the Meiyu onset (Table 3 and Figure 3). The average concentrations of ten kinds of ions in PM1.1 are in decreasing order of NH4+>SO42−>Ca2+>NO3−>Na+>K+>Mg2+>Cl−>F−>NO2−, while those in PM1.1–2.1 follow the order of NH4+>SO42−>NO3−>Ca2+>Na+>K+>Mg2+>Cl−>F−>NO2−. For PM2.1–10, the average concentrations are in order of Ca2+>NH4+>SO42−>Na+>NO3−>Mg2+>K+> Cl−>F−>NO2−.
The concentrations of NH4+, Ca2+, SO42−and NO3− are still the highest four after the Meiyu onset, with slight changes in the concentrations of different ions. The concentration of Ca2+ increases after the Meiyu onset, which is related to the road construction around the observation site (Wang et al., 2021). The concentrations of NH4+, SO42− and NO3− decrease significantly, while the concentrations of Na+, K+, Mg2+, Cl−, F− and NO2− change little. During the Meiyu period, the average concentrations of ten kinds of ions follow the order of NH4+>Ca2+>SO42−>NO3−>Na+>K+>Mg2+>Cl−>F−>NO2− in PM1.1, the order of NH4+>Ca2+>NO3−>SO42−>Na+>K+>Mg2+>Cl−>F−>NO2− in PM1.1–2.1, and the order of Ca2+>NH4+>SO42−>Na+>NO3−>Mg2+>K+>Cl−>F−>NO2− in PM2.1–10.
The changes of the mass concentrations of water-soluble inorganic ions in PM1.1, PM1.1–2.1, and PM2.1–10 with time during the Meiyu period on the north bank of Taihu Lake are depicted in Figure 4. The ρ(TWSII) in PM1.1, PM1.1–2.1, and PM2.1–10 before the Meiyu onset are generally greater than those during the Meiyu period, but there are some differences in the concentration changes. The ρ(TWSII) in PM1.1–2.1 changes most obviously before and after the Meiyu onset, followed by PM1.1, while the ρ(TWSII) changes little in PM2.1–10. This indicates the effect of frequent precipitation during the Meiyu period on the removal of PM1.1, PM1.1–2.1, and PM2.1–10, especially for PM1.1–2.1.
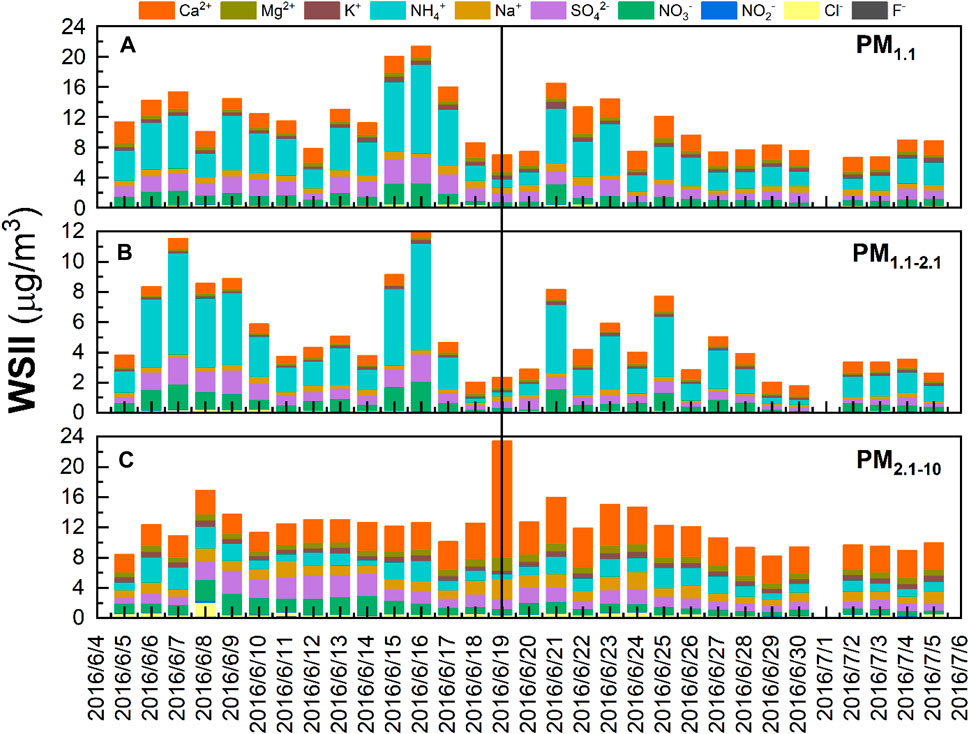
FIGURE 4. Time series of major inorganic ions in (A) PM1.1, (B) PM1.1-2.1, (C) PM2.1-10 during the sampling period.
Figure 4 also shows that the changes of ρ(TWSII) in PM1.1, PM1.1–2.1, and PM2.1–10 with time are generally consistent, but there are some differences in some periods. During June 18–20, 2016, the ρ(TWSII) in PM1.1 decreased first and then increased, while the change of ρ(TWSII) in PM2.1–10 was opposite, and the ρ(TWSII) in PM1.1–2.1 presented a consistent increase. Besides, the concentrations varied little in fine particles but changes drastically for coarse particles. This changing trend may be related to the compositions and formation mechanisms of water-soluble inorganic ions of different sizes.
Corresponding to the pollution processes mentioned in Concentration variations of PM2.5, PM10, and gaseous pollutants, the ρ(TWSII) in PM1.1 and PM1.1–2.1 increased obviously from June 5 to June 7 before the Meiyu onset, and the ρ(TWSII) in PM1.1 and PM1.1–2.1 decreased from June 7 to June 8, while the ρ(TWSII) in PM2.1–10 increased to a maximum value before the Meiyu onset. From June 14 to June 16, the ρ(TWSII) in PM1.1 and PM1.1–2.1 increased to their maximums of 21.34 and 12.05 μg m−3 during the observation period, respectively. Meanwhile, the ρ (TWSII) of PM2.1–10 decreased from June 14 to June 15 and increased from June 15 to June 16.
During the first process of air pollution (from 0800 BJT on June 6 to 2000 BJT on June 9) before the Meiyu onset, the mass concentrations of NH4+, SO42− and NO3− in PM1.1, PM1.1–2.1 and PM2.1–10 increased, especially the concentrations of NH4+ in PM1.1 and PM1.1–2.1. During the second process (from 2000 BJT on June 12 to 2000 BJT on June 18), the concentrations of NH4+, SO42− and NO3− in PM1.1 and PM1.1–2.1 increased, while the concentrations of these ions in PM2.1–10 had no change, which is different from those in the first process. What is the reason for this?
Moreover, the two short fluctuations at 2000 BJT on June 21 and 2300 BJT on June 23 are only reflected as the increases in the concentrations of NH4+, SO42− and NO3− in PM1.1 and PM1.1–2.1. The above four fluctuations may be related to the change of SO2 concentration before and after the Meiyu onset. On the one hand, the increase of SO42− concentration in PM1.1–2.1 during the Meiyu period is due to the gas-to-particle conversion of smaller particles; on the other hand, the SO42− converts to larger-size particles.
The particle-size distribution of water-soluble ions can characterize the source and formation mechanism of ions (Zhang et al., 2018). Figure 5A indicates that the mass concentration spectrums of total anions, total cations, and total ions within different particle-size sections present bimodal distributions before and after the Meiyu onset. The mass concentrations of fine particles peak at the particle-size of 1.1–2.1 μm, while the mass concentrations of coarse particles respectively peak at particle-size of 5.8–9.0 and 9.0–10.0 μm before and after the Meiyu onset, indicating that the particle-size corresponding to peak concentrations in coarse particles moves toward the larger particle sizes after the Meiyu onset. The variation characteristics for mass concentrations of anions, cations, and total ions are similar during the observation period, with the ions mainly concentrating in the section of fine particles. The peak concentration of ions in fine particles before the Meiyu onset is higher than that during the Meiyu period. While in coarse particles, the peak concentration of anions before the Meiyu onset is higher. Meanwhile, the peak concentrations of total cations and total ions before the Meiyu onset are lower than those during the Meiyu period.
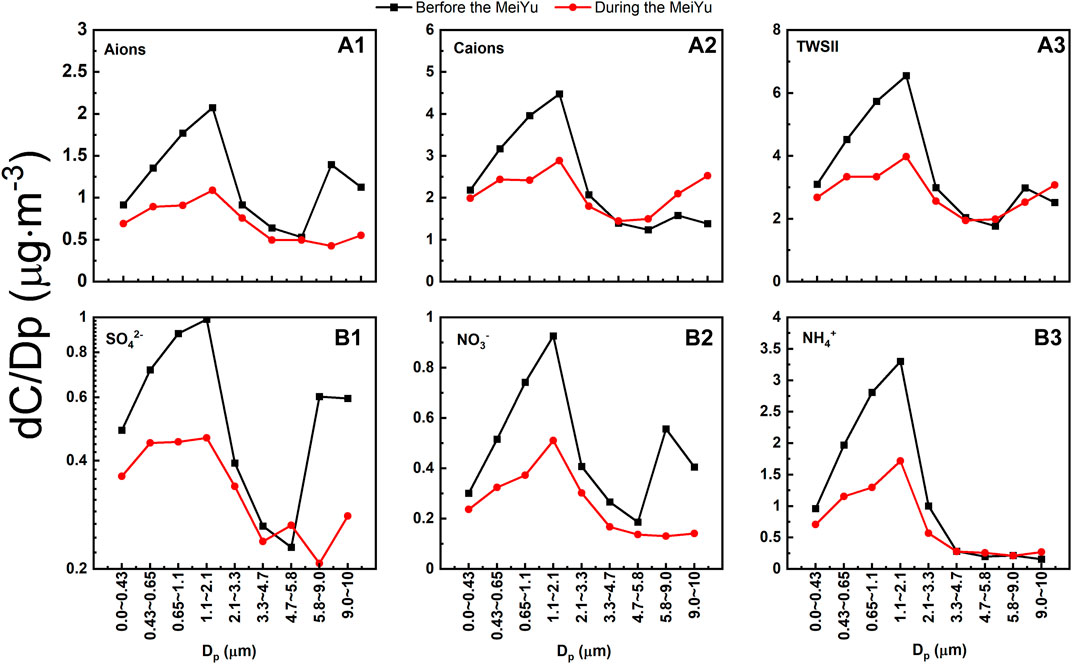
FIGURE 5. Spectral distributions of water-soluble inorganic (a1) Aions (a2) caions (a3) ionic (b1) SO42- (b2) NO3−, and (b3) NH4+ at different periods.
Figure 6 displays the variations of the particle-size distributions of total anions, total cations, and total ions in water-soluble inorganic ions overtime during the observation. Before June 19, 2016, the total anions, total cations, and total ions in fine particles grew rapidly and reached their peak concentrations. During June 8–15 before the Meiyu onset, the concentration of total anions with the particle sizes of 4.5– and 0.65–1.1 µm in coarse particles increased more rapidly than those in other particle sizes (Figure 6A). The particle sizes for the peak of mass concentrations of total ions in coarse particles moved toward larger particle sizes after the Meiyu onset. The period with an increasing concentration for total anions with the particle size of 9–10 µm in coarse particles accounted for 47% of the total Meiyu period, while the concentration of the total anions at the particle size of 5.8–9.0 µm decreased during the same period. Meanwhile, the environmental relative humidity was greater than 90% (Figure 2C), indicating an obvious effect of the hygroscopic growth of the total anions in coarse particles. As shown in Figure 6B, the concentrations of total cations and total ions in coarse particles during the Meiyu period were higher than those before the Meiyu onset, with the maximum concentrations of total cations and total ions in coarse particles being 0.81 (0.95) and 3.28 μg m−3 (10.56 μg m−3) before (after) the Meiyu onset, respectively. The maximum concentration during the Meiyu period was 3.2 times that before the Meiyu onset. The main reason for the sharp increase in the peak concentration during the Meiyu period was that the concentrations of the cations at 5.8–9.0 and 9.0–10.0 μm increased sharply on June 19, and the changes of total cation concentrations in coarse particles were roughly the same on both June 18 and June 19, indicating the same source for the total cations on June 18 and 19. Figure 2 shows that the winds on June 18 and 19 were both southerly, and the daily means of temperature, relative humidity, and surface wind speed were 27.6°C (28.4°C), 75.6% (77.9%), and 3.0 m s−1 (2.6 m s−1) on June 18 (June 19), indicating no significant changes in meteorological elements. While the local anthropogenic emissions near the observation site have a more obvious effect on the concentration of total cations than meteorological factors do. During the observation period, the particle size of total ions has a more consistent distribution with that of total cations than total anions. It indicates that the cations in water-soluble inorganic ions in atmospheric particulate matters on the north bank of Taihu Lake played an important role in the chemical composition of ions during the Meiyu period in 2016 (Wang et al., 2021).
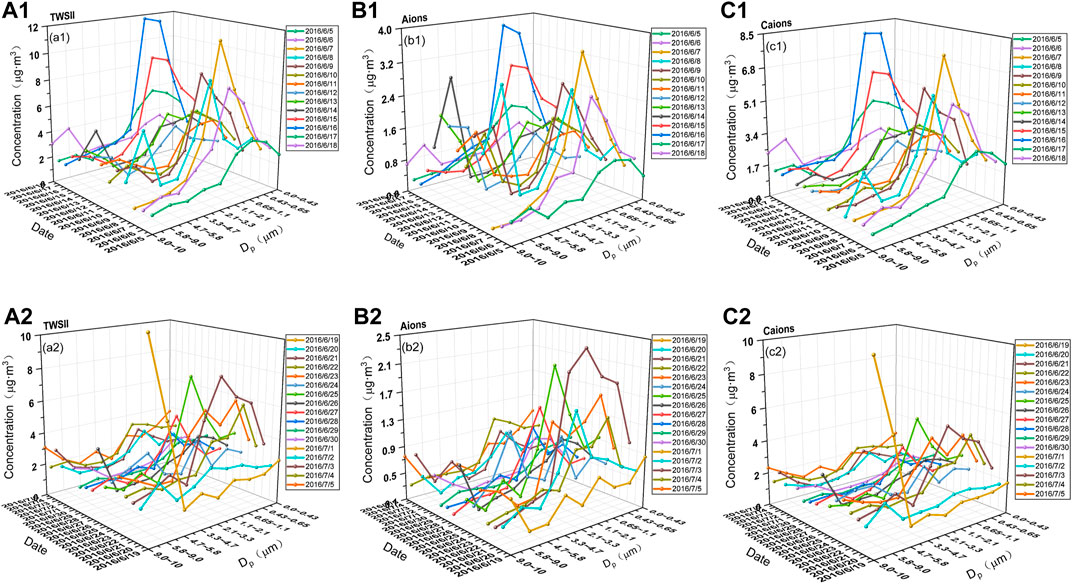
FIGURE 6. Daily variations in spectral distribution of water-soluble inorganic (a1, a2) ionic (b1, b2) aions and (c1, c2) caions at different period ((a1, b1, c1) before the Meiyu period and (a2, b2, c2) during the Meiyu period).
The particle-size distribution characteristics of different ions and their sources are further analyzed, with the size distributions of each ion before and after the Meiyu onset shown in Figure 7, and the time series for different particle-size distributions shown in Figure 5B. The particle size of SO42− shows a bimodal distribution before the Meiyu onset and a multi-modal distribution during the Meiyu period. Before the Meiyu onset, the mass concentration of SO42− peaks at a particle size of 1.1–2.1 μm in fine particles, while at 5.8–9.0 μm in coarse particles. After the Meiyu onset, the mass concentration of SO42− presents a bimodal distribution with its peaks at particle-size of 0.43–0.65 μm and 1.1–2.1 μm in fine particles, and particle-size of 4.7–5.8 and 9.0–10.0 μm in coarse particles. As indicated in the sequence variation (Figure 7), before the Meiyu onset, the mass concentration of SO42− in fine particles peaks at particle-size of 0.43–2.1 μm and the proportions for the frequencies in three different particle-size sections are 36, 21, and 43%, respectively. During the Meiyu period, the mass concentration of SO42− in fine particles peaks at particle-size of 0–2.1 μm, and the proportions for the frequencies in different particle sizes are 19, 25, 6, and 40%, respectively. It indicates that SO42− in fine particles is mainly generated by the reactions in the cloud and the gas-phase reaction. While the two reactions during the Meiyu period are weaker than those before the Meiyu onset. The particle size for the peak concentration of SO42− in coarse particles moves toward larger particle sizes during the Meiyu period. This may be related to higher environmental humidity during the Meiyu period, resulting in the hygroscopic growth of sulfates in coarse particles.
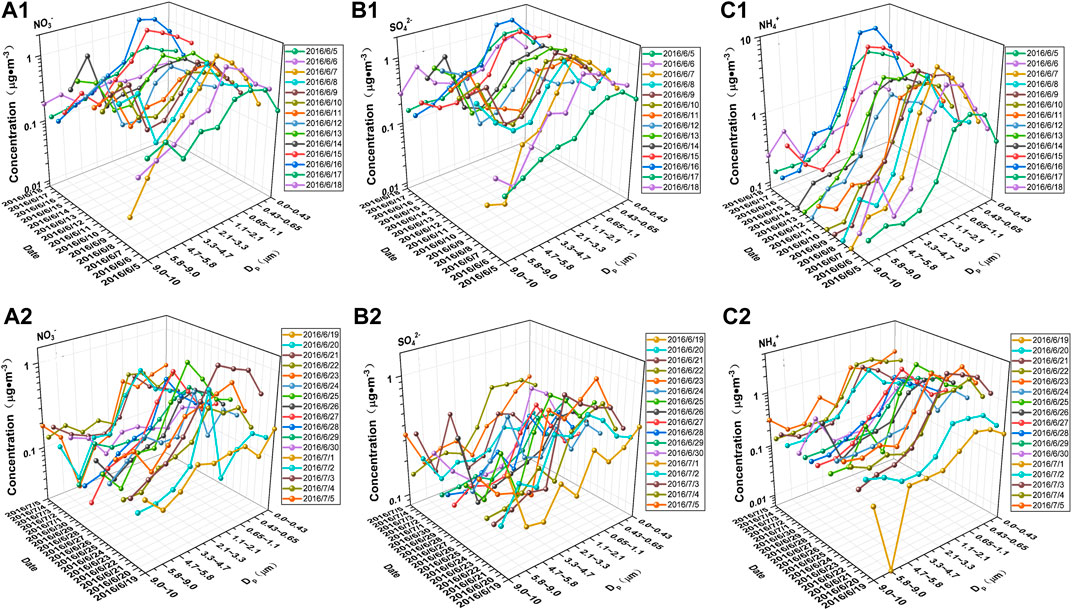
FIGURE 7. Daily variations in spectral distribution of water-soluble inorganic (a1, a2) NO3− (b1, b2) SO42−and (c1, c2) NH4+ at different period.
The mass concentration of NO3− at different particle-size sections shows a bimodal distribution before the Meiyu onset, and a unimodal distribution after the Meiyu onset. The mass concentration of NO3− in fine particles peaks at particle-size of 1.1–2.1 μm, while at 5.8–9.0 μm in coarse particles. Figure 5B shows that before the Meiyu onset, the mass concentration of NO3− in fine particles peaks at particle-size of 0.43–2.1 μm, with the proportions of frequencies for particle-size in four particle-size sections accounting for 13, 25, 6, and 56%, respectively. The effect of gas-phase conversion (liquid-phase reaction) during Meiyu is stronger (weaker) than that before Meiyu. Before the Meiyu onset, the mass concentration of NO3− in coarse particles peaks at particle-size of 2.1–3.3 and 5.8–10.0 μm, and the proportions of frequencies for particle-size within the three particle-size sections account for 36, 57, and 7%, respectively. The peak particle-size of NO3− distributes in all five particle-size sections of 2.1–10 μm after the Meiyu onset, with the proportions of frequencies accounting for 50, 6, 6, 13, and 25%, respectively. It can be concluded that the sources of NO3− in coarse particles after the Meiyu onset are more complex than before. The proportion for NO3− having particle-size within 5.8–9.0 μm decreases significantly, which may be attributed to the removal effect of increasing rainfall during the Meiyu period. The concentration of NH4+ at different particle-size sections presents a bimodal distribution before and unimodal distribution during the Meiyu, with the particle-size of peak concentration distributing in 1.1–2.1 and 5.8–9.0 μm (before the Meiyu), and 9.0–10.0 μm (during the Meiyu). NH4+ is mainly found in fine particles, with the mass fraction accounting for 79.2% (Figure 5B).
The sulfur oxidation ratio (SOR) and nitrogen oxidation ratio (NOR) are often used to characterize the conversion degree of SO2 and NO2 to SO42− and NO3−, respectively (SOR = [SO42-]/([ SO42-]+[SO2]),NOR = [NO3−]/([ NO3−]+[NO2]), where the [SO42-], [SO2], [NO3−], and [NO2] are the molar concentrations (μmol m−3) in the particulate matters and gas phase.) (Guo et al., 2020). Higher SOR or NOR values indicate that more secondary aerosol particulates are converted from SO2 and NO2 (Liu et al., 2016; Wang et al., 2019a,b). It has been found that when the SOR and NOR values are greater than 0.1, the photochemical reaction occurs in the atmosphere (Ohta and Okita 1990). Figure 8 shows the time series for the NOR, SOR, and concentrations of SO2, NO2, SO42− and NO3− during the Meiyu period on the north bank of Taihu Lake. It can be found that the NOR values during the observation are below 0.1, and the average NOR value before the Meiyu onset is higher, indicating that the secondary conversion of NO2 before the Meiyu onset is greater than after.
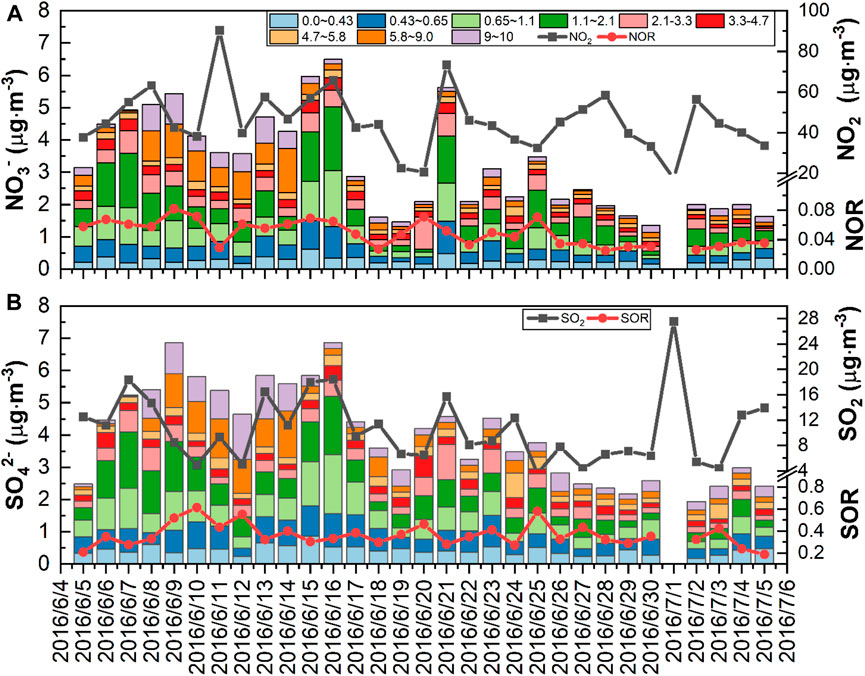
FIGURE 8. Time series of (A) size distribution of NO3−, NO2 concentration and NOR, and (B) size distribution of SO42-, SO2 concentration and SOR during the sampling period.
Table 4 shows the correlation coefficients of the SOR and NOR with O3, temperature, relative humidity, and daily precipitation in different particle-size sections. It can be seen that the NOR in PM1.1 is positively correlated with the O3 concentration (R2 = 0.58) and negatively correlated with the daily precipitation (R2 = −0.49), indicating that the O3 concentration has a more obvious impact on the NOR in PM1.1. The NOR in PM1.1–2.1 is negatively correlated with the temperature, where high-temperature results in disassociation of and volatilization of NH4NO3 to form gaseous HNO3 (Zhao et al., 2018). As the average temperature during the Meiyu period is higher than that before the Meiyu onset, the NOR decreases during the Meiyu period.
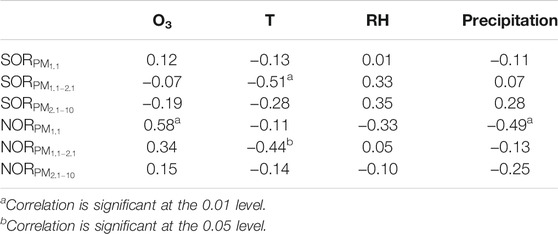
TABLE 4. Correlation coefficient of NOR and SOR between O3 concentrations, Temperature, Relative humidity and Precipitation in particulate matters.
During the Meiyu period, the SOR values in PM2.1–10 are all above 0.1, the SOR values in PM1.1 are generally above 0.1 in most periods, while the SOR values in PM1.1–2.1 are the smallest among the three particle-size sections. For PM1.1, PM1.1–2.1 and PM2.1–10, the SOR values are greater than the NOR values, but the concentration of NO2 in the same period during the Meiyu period is higher than that of SO2, indicating that the secondary conversion of SO2 during the Meiyu period on the north bank of Taihu Lake is stronger than that of NO2.
The mass ratio of NO3−/SO42− can be used to qualitatively analyze the relative importance of mobile sources (vehicle exhaust) and stationary sources (coal combustion) to particle matters of sulfur and nitrogen in the atmosphere. A higher ratio indicates the predominance of mobile sources over stationary sources of pollutants (Chang et al., 2015). Figure 9 shows that the mass ratios of NO3−/SO42− in PM1.1, PM1.1–2.1 and PM2.1–10 before the Meiyu onset range in 0.13–0.38 (the mean ratio is 0.29), 0.22–0.55 (the mean ratio is 0.36) and 0.21–0.67 (the mean ratio is 0.36), respectively. While during the Meiyu period, the mass ratios of NO3−/SO42− in PM1.1, PM1.1–2.1 and PM2.1–10 range in 0.12–0.58 (the mean ratio is 0.29), 0.05–0.78 (the mean ratio is 0.43) and 0.17–0.31 (the mean ratio is 0.26), respectively. The mass ratios of NO3−/SO42− during the whole observation period are less than 0.80, indicating that compared with mobile sources, the stationary sources contribute more to the relative contribution of atmospheric particulate matter on the north bank of Taihu Lake.
The variation ranges for the mass ratio of NO3−/SO42− before the Meiyu onset are smaller than those during the Meiyu period in PM1.1 and PM1.1–2.1, while the situation is quite the reverse in PM2.1–10. It indicates that the contributions of vehicle exhaust and coal combustion to fine particles are more obviously affected by the changes in meteorological conditions during the Meiyu period. Figure 9 reveals that the mean ratio of NO3−/SO42− in PM1.1–2.1 before Meiyu onset is smaller than that during the Meiyu period, and it is higher than that in PM1.1, indicating that the vehicle emissions contribute more to PM1.1–2.1 than to PM1.1. Moreover, the contribution of vehicle exhaust increases during the Meiyu period, which is the same as the result from a case study in Wuxi in 2014 (Liu et al., 2018).
In order to investigate the chemical composition distributions and the impact of Meiyu on air pollution in the Yangtze River Delta, East China, the gaseous pollutant concentrations, the nine sizes segregated particles, and water-soluble inorganic ions of aerosols were measured on the north shore of Taihu Lake from June 4 to July 5, 2016. This observational study is concluded as follows:
The mass concentrations of atmospheric particulate matters (PM2.5 and PM10) and main gaseous pollutants (SO2, NO2, CO, and O3) decrease during the Meiyu period, with the largest decline in PM10 and the smallest in CO, which could be regulated by meteorological changes before and after Meiyu onset. Water-soluble inorganic ions in atmospheric particles are mainly concentrated in fine particles during the Meiyu period on the north bank of Taihu Lake. The values of ρ(TWSII) for PM1.1, PM1.1–2.1, and PM2.1–10 before the Meiyu onset are generally greater than those during the Meiyu period. During the first pollution process, the ρ(TWSII) for PM1.1 and PM1.1–2.1 first increase to the peak values, and then decrease during the moderate rainfall period, when the ρ(TWSII) in PM2.1–10 increase to its maximum before the Meiyu onset.
The mass concentrations for anions, cations, and total ions at different particle-size sections all exhibit bimodal distributions before and after the Meiyu onset. The mass concentration peaks at a particle size of 1.1–2.1 μm for fine particles, while at 5.8–9.0 μm (before the Meiyu onset) and 9.0–10.0 μm (during the Meiyu period) for coarse particles, respectively. The peak particle size for mass concentration of coarse particles moves toward larger particle sizes during the Meiyu period. The mass concentrations of SO42− at different particle-size sections show a bimodal distribution before the Meiyu onset and a multi-modal distribution during the Meiyu period. The mass concentrations of NO3− at different particle-size sections show a bimodal distribution before the Meiyu onset and a unimodal distribution during the Meiyu period. The mass concentrations of NH4+ at different particle-size sections present a bimodal distribution before and after the Meiyu onset, with the particle-size for peak concentrations distributing in 1.1–2.1 and 5.8–9.0 μm before the Meiyu onset, and 9.0–10.0 μm during the Meiyu period.
The mean value of NOR is higher before the Meiyu onset than after, indicating that the secondary conversion of NO2 before the Meiyu onset is greater. The SOR values are greater than NOR values, but the concentrations of NO2 in the same period during the Meiyu period are higher than those of SO2, which indicates that the secondary conversion of SO2 during the Meiyu period on the north bank of Taihu Lake is stronger than that of NO2. During the whole observation, the relative contribution of stationary sources to atmospheric particulate matter on the north bank of Taihu Lake is more than the relative contribution of mobile sources. The contributions of vehicle exhaust and coal combustion to fine particles are more obviously affected by the changes in meteorological conditions during the Meiyu period, and the vehicle emissions contribute more to PM1.1–2.1 than to PM1.1.
As the crop residue burning ban was issued in 2015, the air quality before and after the Meiyu has improved a lot, further studies are needed to determine the effect of meiyu on the removal of air pollutants.
The raw data supporting the conclusions of this article will be made available by the authors, without undue reservation.
Author Contributions: Conceptualization, DL; methodology, TZ; software, ZW and BZ; validation, DL; formal analysis, ZW; investigation, ZW and YS; resources, DL, and YS; data curation, ZW and BZ; writing—original draft preparation, DL and ZW; writing—review and editing, DL and TZ; visualization, ZW and BZ; supervision, DL and ZW; project administration, DL; funding acquisition, DL.
This work was jointly supported by the National Key Research and Development Program of China (No. 2019YFC0214604), the Postgraduate Research and Practice Innovation Program of Jiangsu Province (Grant Nos. KYCX21_0972), the National Natural Science Foundation of China (42075063), Open fund by Jiangsu Key Laboratory of Atmospheric Environment Monitoring and Pollution Control (KHK 2005), and the Jiangsu Meteorological Bureau General project (KZ201902).
The authors declare that the research was conducted in the absence of any commercial or financial relationships that could be construed as a potential conflict of interest.
All claims expressed in this article are solely those of the authors and do not necessarily represent those of their affiliated organizations, or those of the publisher, the editors and the reviewers. Any product that may be evaluated in this article, or claim that may be made by its manufacturer, is not guaranteed or endorsed by the publisher.
Chang, Q., Yang, F., Li, X., Cao, Y., Wang, H., and Tian, M. (2015). Characteristics of Mass and Chemical Species Size Distributions of Particulate Matter during Haze Pollution in the winter in Beijing. Acta Scientiae Circumstantiae 35, 363–370. (In Chinese).
Dai, W., Gao, J., Cao, G., and Ouyang, F. (2013). Chemical Composition and Source Identification of PM2.5 in the Suburb of Shenzhen, China. Atmos. Res. 122, 391–400. doi:10.1016/j.atmosres.2012.12.004
Gao, J., Peng, X., Chen, G., Xu, J., Shi, G.-L., Zhang, Y.-C., et al. (2016). Insights into the Chemical Characterization and Sources of PM2.5 in Beijing at a 1-h Time Resolution. Sci. Total Environ. 542, 162–171. doi:10.1016/j.scitotenv.2015.10.082
Gu, P., Qian, J., Liu, D., Wang, K., Dai, Z., Peng, X., et al. (2020). Cold Fronts Transport Features of North China Pollutant over Jiangsu Province, China. Atmos. Pollut. Res. 11 (10), 1785–1796. doi:10.1016/j.apr.2020.07.015
Gui, K., Che, H., Zeng, Z., Wang, Y., Zhai, S., Wang, Z., et al. (2020). Construction of a Virtual PM2.5 Observation Network in China Based on High-Density Surface Meteorological Observations Using the Extreme Gradient Boosting Model. Environ. Int. 141. doi:105801. doi:10.1016/j.envint.2020.105801
Guo, H., Simpson, I. J., Ding, A. J., Wang, T., Saunders, S. M., Wang, T. J., et al. (2010). Carbonyl Sulfide, Dimethyl Sulfide and Carbon Disulfide in the Pearl River Delta of Southern China: Impact of Anthropogenic and Biogenic Sources. Atmos. Environ. 44 (31), 3805–3813. doi:10.1016/j.atmosenv.2010.06.040
Guo, W., Zhang, Z., Zheng, N., Luo, L., Xiao, H., and Xiao, H. (2020). Chemical Characterization and Source Analysis of Water-Soluble Inorganic Ions in PM2.5 from a Plateau City of Kunming at Different Seasons. Atmos. Res. 234. doi:104687. doi:10.1016/j.atmosres.2019.104687
Guo, Y. F., Liu, D. Y., Zhou, B., Xia, J., Wu, Y., and Hu, Y. H. (2013). Study on Haze Characteristics in Wuxi and its Impact Factors. Meteorol. Monthly 39, 1314–1324. (in Chinese).
He, J., Gong, S., Yu, Y., Yu, L., Wu, L., Mao, H., et al. (2017). Air Pollution Characteristics and Their Relation to Meteorological Conditions during 2014-2015 in Major Chinese Cities. Environ. Pollut. 223, 484–496. doi:10.1016/j.envpol.2017.01.050
Huang, X., Wang, Z., and Ding, A. (2018). Impact of Aerosol‐PBL Interaction on Haze Pollution: Multiyear Observational Evidences in North China. Geophys. Res. Lett. 45 (16), 8596–8603. doi:10.1029/2018gl079239
Liu, C., Hua, C., Zhang, H., Zhang, B., Wang, G., Zhu, W., et al. (2019). A Severe Fog-Haze Episode in Beijing-Tianjin-Hebei Region: Characteristics, Sources and Impacts of Boundary Layer Structure. Atmos. Pollut. Res. 10 (4), 1190–1202. doi:10.1016/j.apr.2019.02.002
Liu, D., Su, Y., Peng, H., Yan, W., Li, Y., Liu, X., et al. (2018). Size Distributions of Water-Soluble Inorganic Ions in Atmospheric Aerosols during the Meiyu Period on the North Shore of Taihu Lake, China. Aerosol Air Qual. Res. 18, 2997–3008. doi:10.4209/aaqr.2018.04.0123
Liu, Z., Hu, B., Zhang, J., Yu, Y., and Wang, Y. (2016). Characteristics of Aerosol Size Distributions and Chemical Compositions during Wintertime Pollution Episodes in Beijing. Atmos. Res. 168, 1–12. doi:10.1016/j.atmosres.2015.08.013
Ohta, S., and Okita, T. (1990). A Chemical Characterization of Atmospheric Aerosol in Sapporo. Atmos. Environ. A. Gen. Top. 24, 815–822. doi:10.1016/0960-1686(90)90282-r
Qiao, T., Zhao, M., Xiu, G., and Yu, J. (2015). Seasonal Variations of Water Soluble Composition (WSOC, Hulis and WSIIs) in PM1 and its Implications on Haze Pollution in Urban Shanghai, China. Atmos. Environ. 123, 306–314. doi:10.1016/j.atmosenv.2015.03.010
Shen, Z., Cao, J., Arimoto, R., Han, Z., Zhang, R., Han, Y., et al. (2009). Ionic Composition of TSP and PM2.5 during Dust Storms and Air Pollution Episodes at Xi'an, China. Atmos. Environ. 43 (18), 2911–2918. doi:10.1016/j.atmosenv.2009.03.005
Sun, Y., Wang, Z., Fu, P., Jiang, Q., Yang, T., Li, J., et al. (2013). The Impact of Relative Humidity on Aerosol Composition and Evolution Processes during Wintertime in Beijing, China. Atmos. Environ. 77, 927–934. doi:10.1016/j.atmosenv.2013.06.019
Tan, J.-H., Duan, J.-C., Chen, D.-H., Wang, X.-H., Guo, S.-J., Bi, X.-H., et al. (2009). Chemical Characteristics of Haze during Summer and winter in Guangzhou. Atmos. Res. 94 (2), 238–245. doi:10.1016/j.atmosres.2009.05.016
Tian, S. L., Pan, Y. P., and Wang, Y. S. (2016). Size-resolved Source Apportionment of Particulate Matter in Urban Beijing during Haze and Non-haze Episodes. Atmos. Chem. Phys. 16 (1), 1–19. doi:10.5194/acp-16-1-2016
Wang, B., Luo, X., Liu*, D., Su, Y., and Wu, Z. (2021). The Effect of Construction Dust and Agricultural Fertilization on the Precipitation Chemical Composition during Summer in the Yangtze River Delta Area, China. Atmos. Pollut. Res. 12 (7). doi:101121. doi:10.1016/j.apr.2021.101121
Wang, H., Zhu, B., Shen, L., Xu, H., An, J., Xue, G., et al. (2015). Water-soluble Ions in Atmospheric Aerosols Measured in Five Sites in the Yangtze River Delta, China: Size-Fractionated, Seasonal Variations and Sources. Atmos. Environ. 123, 370–379. Part B. doi:10.1016/j.atmosenv.2015.05.070
Wang, S., Yin, S., Zhang, R., Yang, L., Zhao, Q., Zhang, L., et al. (2019a). Insight into the Formation of Secondary Inorganic Aerosol Based on High-Time-Resolution Data during Haze Episodes and Snowfall Periods in Zhengzhou, China. Sci. Total Environ. 660, 47–56. doi:10.1016/j.scitotenv.2018.12.465
Wang, X., Wei, W., Cheng, S., Yao, S., Zhang, H., and Zhang, C. (2019b). Characteristics of PM2.5 and SNA Components and Meteorological Factors Impact on Air Pollution through 2013-2017 in Beijing, China. Atmos. Pollut. Res. 10, 1976–1984. doi:10.1016/j.apr.2019.09.004
Wang, Y., Wild, O., Chen, H., Gao, M., Wu, Q., Qi, Y., et al. (2020). Acute and Chronic Health Impacts of PM2.5 in China and the Influence of Interannual Meteorological Variability. Atmos. Environ. 229. doi:117397. doi:10.1016/j.atmosenv.2020.117397
Xia, Y., Qian, H., Yao, S., and Sun, T. (2021). Multiscale Causes of Persistent Heavy Rainfall in the Meiyu Period over the Middle and Lower Reaches of the Yangtze River. Front. Earth Sci. 9. doi:700878. doi:10.3389/feart.2021.700878
Xiang, Y., Lu, P., Cheng, T., Xie, Z., and Wang, W. (2016). Evolution Characteristics of the Jiangsu Plum Rain in Recent 54 Years and its Monitoring Analysis in 2014. J. Meteorol. Sci. 36 (5), 681–688. (In Chinese).
Yao, Q., Liu, Z., Han, S., Cai, Z., Liu, J., Hao, T., et al. (2020). Seasonal Variation and Secondary Formation of Size-Segregated Aerosol Water-Soluble Inorganic Ions in a Coast Megacity of North China Plain. Environ. Sci. Pollut. Res. Int. 27 (21), 26750–26762. doi:10.1007/s11356-020-09052-0
Zhang, J., Tong, L., Huang, Z., Zhang, H., He, M., Dai, X., et al. (2018). Seasonal Variation and Size Distributions of Water-Soluble Inorganic Ions and Carbonaceous Aerosols at a Coastal Site in Ningbo, China. Sci. Total Environ. 639, 793–803. doi:10.1016/j.scitotenv.2018.05.183
Zhang, L., Guo, X., Zhao, T., Gong, S., Xu, X., Li, Y., et al. (2019). A Modelling Study of the Terrain Effects on Haze Pollution in the Sichuan Basin. Atmos. Environ. 196, 77–85. doi:10.1016/j.atmosenv.2018.10.007
Zhang, W., Wang, H., Zhang, X., Peng, Y., Zhong, J., Wang, Y., et al. (2020). Evaluating the Contributions of Changed Meteorological Conditions and Emission to Substantial Reductions of PM2.5 Concentration from winter 2016 to 2017 in Central and Eastern China. Sci. Total Environ. 716. doi:136892. doi:10.1016/j.scitotenv.2020.136892
Zhao, Q. Y., Jiang, N., Yan, Q. S., Wang, S. B., Han, S. J., Yang, L. M., et al. (2018). Size Distribution Characteristics of Water-Soluble Inorganic Ions during Summer and Autumn in Zhengzhou. Huan Jing Ke Xue 39, 4866–4875. (In Chinese). doi:10.13227/j.hjkx.201803102
Keywords: fine particles, meiyu, size distribution, taihu lake, water-soluble inorganic ions, the Yangtze River Delta
Citation: Wu Z, Liu D, Zhao T, Su Y and Zhou B (2021) Size Distributions of Water-Soluble Inorganic Ions in Atmospheric Aerosols During the Meiyu Period in the Yangtze River Delta, China. Front. Environ. Sci. 9:788115. doi: 10.3389/fenvs.2021.788115
Received: 01 October 2021; Accepted: 21 October 2021;
Published: 14 December 2021.
Edited by:
Lijuan Shen, University of Toronto, CanadaReviewed by:
Yi Li, Intel, United StatesCopyright © 2021 Wu, Liu, Zhao, Su, and Zhou. This is an open-access article distributed under the terms of the Creative Commons Attribution License (CC BY). The use, distribution or reproduction in other forums is permitted, provided the original author(s) and the copyright owner(s) are credited and that the original publication in this journal is cited, in accordance with accepted academic practice. No use, distribution or reproduction is permitted which does not comply with these terms.
*Correspondence: Duanyang Liu, bGl1ZHVhbnlhbmcyMDAxQDEyNi5jb20=
Disclaimer: All claims expressed in this article are solely those of the authors and do not necessarily represent those of their affiliated organizations, or those of the publisher, the editors and the reviewers. Any product that may be evaluated in this article or claim that may be made by its manufacturer is not guaranteed or endorsed by the publisher.
Research integrity at Frontiers

Learn more about the work of our research integrity team to safeguard the quality of each article we publish.