 Maxime Logez1,2*
 Bernadette Bounket1Pierre Gibert1Georges Carrel1Virginie Diouloufet1
 Xavier Colombet1Fabien Morat3,4
- 1INRAE, RECOVER, Aix Marseille Univ, Aix-en-Provence, France
- 2INRAE, UR RiverLy, Villeurbanne Cedex, France
- 3PSL Research University: EPHE-UPVD-CNRS, USR 3278 CRIOBE, Université de Perpignan, Perpignan, France
- 4Laboratoire d’Excellence Corail, Perpignan, France
Long-term surveys confirm the rapidity of environmental and biological changes undergone by endangered species but that also concerned relatively “tolerant” species, especially common rheophilic species such as European chub (Squalius cephalus, Linnaeus 1758). As many organisms, fish are highly vulnerable during their first life stages. Body size is a determinant factor for ecosystem functioning and for fish to survive to predators or to winter conditions. While numerous studies has already demonstrated the large variability of autumnal size of fish hatched during the year, few have focused on the factors explaining these interannual variations and on the growth patterns underlying these distributions. Using otoliths of young-of-the-year (YOY), we studied how the interannual variability in fall sizes of chub might be related to varying phenology, temperature, hydrology and growth patterns. YOY were sampled in three sections of the same reach of the Rhône River with contrasted hydrological regime: an artificial deep lotic channel (the tailrace of Bollène), a bypassed section with both lotic and lentic areas (former river channel before dam construction) and a reservoir with lentic deep waters. Sampling was performed on each sector during two thermally distinct years. Temperature had an important effect on both phenology and growth rate but it was not expressed similarly among river sections. Fish hatched earlier in the warmer year. Fish sizes were positively correlated with growing degree-days, but with distinct relationships between years and sections. The growth was faster in the warmer year, and in the warmer section, but differences in growth patterns varied between sections. In the bypassed section, the difference was slight, almost not significant, even if temperatures were very different between the 2 years considered. Autumnal variations in size could be explained either by an earlier phenology or by a faster growth due to higher temperatures occurring during the final part of the growing period. Our results were in accordance with general theory’s predictions relating individual growth to temperature, but they also showed that other factors might mitigate the influence of temperature on fish early life stages.
Introduction
Organism size has been widely studied, because of its impact on organism internal functioning (metabolism, thermoregulation of ectotherms) (West and Brown, 2005), on the life-history traits (survival, longevity, fecundity) (Roff, 1992; Winemiller and Rose, 1992), on ecology (ontogenetic shift in habitat use) (Werner and Gilliam, 1984), and more broadly because of the consequences of organism size on ecosystem functioning (food web) (Barnes et al., 2010).
The “bigger is better hypothesis” suggest the body size is determinant for young fish survival (Miller et al., 1988) and particularly for the winter survival of fish larvae and juveniles (Sogard, 1997). Indeed, the acquisition of a “refuge size” allows to escape to predation and to be less sensible at environmental stressors (e.g. temperature, starvation) (Sogard, 1997; Hurst, 2007). For young-of-the-year (YOY) fish, the recruitment depends to first winter survival (Hurst, 2007). However, YOY generally show a large variability in size at the end of the growing period (e.g. Nunn et al., 2003). The knowledge of causes of this size variability (differences in spawning date or in the growth capacity, for example) is crucial as the survival of YOY at the first winter influence the population dynamics.
Long-term surveys have revealed high variation of freshwater fish body size at the same location, but between years (Nunn et al., 2003; 2010). Between 1984 and 1998, Nunn et al. (2003) have observed important variation in roach (Rutilus rutilus (Linnaeus, 1758)), dace (Leuciscus leuciscus (Linnaeus, 1758) and chub (Squalius cephalus (Linnaeus, 1758)) sizes, especially for young of the year. Abiotic factors such as discharge, water temperature and climate regime (Konečná et al., 2009; Nunn et al., 2010) and biotic factors such as species phenology have been suggested to influence YOY size (Nunn et al., 2010). Indeed, temperature can influence the growth of YOY (through the metabolism) but also fish species phenology. In warmer conditions, fish would spawn earlier (e.g. Nunn et al., 2010) which could potentially lead to a longer growing period than during cooler years, leading to larger YOY in early winter.
While numerous studies have focused on endangered species and their potential loss regarding global changes (Ceballos et al., 2020) and/or the multiple anthropogenic pressures impacting temperate rivers (Dudgeon, 2010; Harrison et al., 2018), it is also important to focus on “common species.” Indeed, the analysis of long-term surveys confirms the rapidity of environmental and biological changes, that also concernced relatively “tolerant” species, especially rheophilic species (Mueller et al., 2018; Santos et al., 2021). This is the case of the European chub, a widespread species in Europe and a dominant leuciscid in French rivers. Chub is a potamodromous, lithophilic species that can live in a wide variety of habitats (lentic or lotic), even altered (Philippart and Vranken, 1983; Cowx et al., 2004), and that can move on great distances during the spawning period to find gravel-bed spawning grounds in lotic areas (Fredrich et al., 2003; Benitez and Ovidio, 2018). Chub larvae and YOY are mostly observed in groups in shallow shoreline habitats of lotic channels (Mann, 1976; Copp and Peňáz, 1988).
Our current knowledge on the spawning periodicity, growth patterns and size of YOY is mostly inferred from surveys of 0+ year size distributions (e.g. Mills and Mann, 1985; Nunn et al., 2007), but only rare studies have compared the growth pattern of YOY under different hydrological regimes and thermal contexts. Using otoliths collected on YOY chub, we aimed to assess the phenology and the growth pattern of YOY in three nearby sections of the same reach that are typical of the run-of-river hydropower development along the Rhône River: bypassed section, tailrace and reservoir. Fish were studied during two thermally contrasted years (2013: cool and 2015: warm). Our objectives were to estimate the hatching date of eggs and to model the fish daily growth curves (with a Bayesian hierarchical non-linear model), in order to assess how YOY growth could be related to phenological shifts and/or to environmental conditions (temperature).
Materials and Methods
Study Area
The reach of Caderousse is located in the middle of the lower Rhône and combines the hydraulic components of two hydropower schemes: Donzère-Mondragon and Caderousse. The headrace of the Donzère-Mondragon hydroelectric power plant has been receiving cooling water from the Tricastin nuclear power plant since 1980. After complete mixing of the heated effluent downstream of the hydroelectric plant, the mean daily temperature increment of the tailwater was +1.6°C for the period 2002–2006 (Hartmann et al., 2014).
The reach of Caderousse includes three main contrasting sections (Figure 1). First, the tailrace of Bollène (TAIL), an artificialized deep lotic channel with a trapezoidal cross-section with alternating concrete and riprap riverbanks. Its flow is controlled by the Bollène hydroelectric power plant. The bypassed section (BPS) corresponds to the old river channelized during the 19th century with low submersible dikes. It has both lentic and lotic areas and is characterised by the presence of a riparian forest, residual backwaters. The third section is the reservoir (RES) created by the Caderousse dam. This is a large area of lentic, deep waters and the shoreline habitats mainly consist of ripraps and large macrophyte beds.
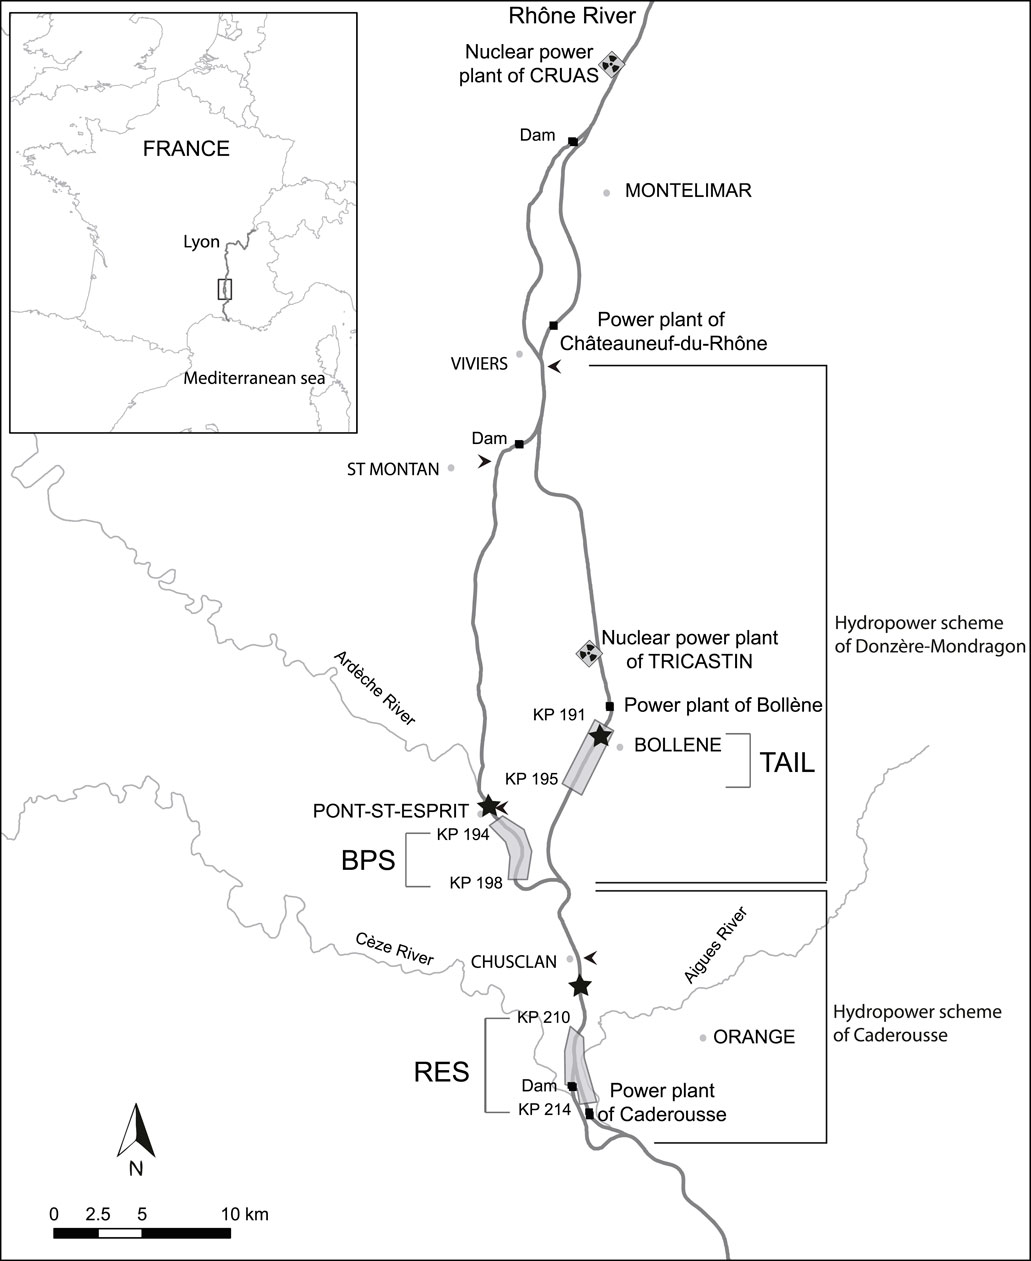
FIGURE 1. Map of the Caderousse reach on the lower Rhône River. Chub were sampled in the bypassed section (BPS), in the reservoir (RES) of the Caderousse dam and power plant, and in the tailrace (TAIL) of the Bollène power plant. The gray areas represent the sampling sites. The arrows locate the four gauging stations and the stars locate the hobo thermometers.
The Compagnie Nationale du Rhône provided us with the daily flow data of the Rhône River recorded near Pont-Saint-Esprit for the BPS and near Chusclan for the RES. The daily discharge in the tailrace was obtained by subtracting from the total river flow measured in the upstream gauging station near Viviers, the instream flow of the bypassed section near Saint-Montan (Figure 1). The daily average temperature of the Rhône waters was obtained from data recorded every 15 min by HOBO® thermometers set up in the three sections.
Fish Sampling
YOY chub were collected from Sept. 24 to 26, 2013 and from Sept. 14 to 17, 2015. Fish were sampled by electrofishing using the point abundance sampling method (Nelva et al., 1979), a strategy suitable to take into account the habitat diversity on both sides of each section. Following eugenol anaesthesia, they were put on ice, and kept frozen until dissection. Prior to dissection, size (total length - TL) was measured to the nearest millimetre. In 2013 and 2015, 139 YOY (81 in the BPS, 41 in the RES, and 17 in the TAIL) and 124 YOY (44 for BPS, 45 in the RES, and 35 in the TAIL) were recorded respectively. The size classes (TL) of the collected individuals were ranged between 20 and 80 mm. The lapilli, the most appropriate otoliths in cyprinid species to assess fish growth (Bounket et al., 2019), were extracted, immediately cleaned in distilled water and placed to dry in plastic tubes.
Research Involving Animals
All relevant international, national, and/or institutional guidelines for the care and use of animals were followed. Fish were sacrificed using anaesthetic overdose (eugenol) in accordance with the European Directive 2010/63/EU. Fish were collected in accordance with the authorisation numbers: 2013-203-0005 and 2015-229-DDTSE01 delivered by the prefecture.
Hatching Date and Daily Otolith Growth
Otoliths were embedded in CrystalbondTM resin and polished on the frontal plane with abrasive paper and diamond solutions (Ø 10, 3, 0.25 μm, Escil, Chassieu, France). Each otolith was observed and digitized at ×1,000 magnification using a light microscope (Leica DM 2500, Solms, Germany) combined with a camera (Leica MC 170HD). Age was estimated by counting the daily increments (Bounket et al., 2019) between the hatching check and the edge of the otolith along the maximum growth axis from the core to the anterior face. The hatching check was similar to those previously observed in other cyprinids (Smith and Walker, 2003; Li et al., 2009). Three independent readers performed the age estimations three times. The degree of agreement between readings was assessed by determining the coefficient of variation (3.3 ± 1.0% and 3.1 ± 0.9% in mean for 2013 and 2015, respectively) (Panfili et al., 2002). The distance between the nucleus and each daily growth increment was measured using the software ImageJ. Hatching dates were estimated by subtracting the age of YOY from the date of capture.
Streamflow and Growing Degree-Day (GDD)
To characterise the hydrological conditions faced by YOY during their growth period, we computed the median of the daily discharge (
The growing degree-day is a thermal integral used to calculate the heat accumulation above a minimum temperature threshold. It is a good predictor of fish growth (Neuheimer and Taggart, 2007) mainly used to characterize the thermal regime experienced by fish during their growing period. GDDs were computed for each fish as the sum of the degree-days above the threshold of 12°C (Mills and Mann, 1985) from the estimated hatching date to the day of capture.
We assessed the link between
Back-Calculation of Fish Daily Growth
The daily otolith growth increments were back-transformed into daily sizes to reconstruct the growth pattern for individual fish. In line with Vigliola and Meekan (2009), we used the Modified Fry model (MF) to infer fish size-at-age from otolith growth. We followed the MF procedure, which is composed of five steps. The first two steps consist in estimating the size of the fish at the first increment, L0p, and the size of the radius at the first increment, R0p. These two parameters are biological intercepts and were determined from a controlled experiment (Bounket et al., 2019). The third and fourth steps consist in determining whether the relationship between otolith radii and fish sizes is allometric or isometric and were performed independently for each section/year. To do this, we fitted the nonlinear regression:
With Lcpt the size at capture and Rcpt the otolith radius at capture. The six coefficient c were tested against 1 and we concluded that allometry was required, since all the tests were significant (α = 5%) excepted for the TAIL. For each section/year the back-calculation was performed with the formula:
With Li the size at age i, Ri the radius at age i, and a derived from the formula
Relationship Between GDD and Fish Size
We fitted exponential response curves between length at capture and GDD using multiple linear regression (MLR) on the log-scale. To assess the relative influence of GDD, year (taken as a qualitative variable) and section, we first considered in the “complete model” all variables, the two-way interactions and the three-way interaction. Then, we tested the significance of the three-way interaction by testing (F-test) the complete model against a model without this interaction. If it was not significant, the interaction was removed and we tested models with and without the two-way interactions. If the two-way interactions were not significant, they were removed from the MLR and the MLR integrated only of the additional effect of the three explanatory variables.
We checked for the homoscedasticity. If it was not verified, then Generalised Least Square models (GLS) were used to account for the heteroscedasticity. GLS extend the linear models by modelling the heterogeneity with covariates (Zuur et al., 2009).
Fish Growth Curves
To model the growth of fish we used a logistic growth model (Ricker, 1979) with four parameters, of the form:
With Li the size at age i, α the minimal asymptotic size, L∞ the asymptotic size, T the inflexion point (in days), and δ a scale factor (Figure 2) inversely related to the rate of maximum growth (the slope at the inflexion point is steepest for the lower value of δ). Indeed, the first derivate of this function is:
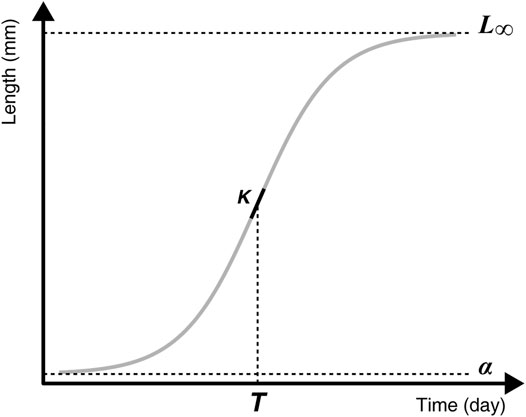
FIGURE 2. The logistic growth curve with the four parameters: asymptotic size (L∞), minimal asymptotic size (α), time at the inflexion point (T), and maximum growth rate (K), derived from the scale parameter δ and computed as K = (L∞ - α)/(4δ).
At the inflexion point T (when i = T), it simplifies to:
The minimal asymptomatic size, α, is not biologically meaningful (i.e., it is not an estimation of the size at hatching), but is important to fit constituent growth curves.
To model fish growth curves we used a Bayesian hierarchical framework, considering that each combination of section and year k, (i.e. BPS-2013, BPS-2015, TAIL-2013, TAIL-2015, RES-2013, RES-2015) had its own set of hyperparameters: αk, L∞k, Tk and δk. Then each fish, j, was supposed to have its own set of parameters sampled from normal distributions with mean the hyperparemeters and with a given variance
Therefore “hyperparameters” represented the average coefficients of the growth model in each section/year, while “parameters” represented the coefficients of the individual growth curves. For each fish (j) of each section/year (k) we computed the average size at age i (µkji) such as:
Finally, the observed size at age i, Lkji, was supposed to be normally distributed:
This hierarchical model is also heteroscedastic as each fish has its own dispersion parameters (
For each hyperparameters we used a normal non-informative prior with mean 0 and for variance the inverse of the precision (τ) for which we used a gamma non-informative prior:
To compare the hyperparameters of each section/year, we computed the median and the associated credible interval (CI, 95%) of their posterior distributions that were obtained from 10 Monte-Carlo Markov Chains with 100,000 iterations. After an initial burning of 50,000 values, one value on 10 was conserved (to limit the autocorrelation between estimations). The convergence was checked through the Gelman and Rubin’s convergence diagnostic that had to be close to one for all estimated parameters (Congdon, 2007).
The growth patterns were compared using the average growth curves of each section/year and their associated CI. To do so, the hyperparameters posterior distributions served to predict the average sizes at age for each section/year (50,000 µki values), for which we computed the mean value (average pattern of growth) and the quantiles 2.5 and 97.5% (limits of the CI).
All these computations were performed using the Bayesian software JAGS, the statistical software R (v. 4.1.0) and the libraries emmeans (1.6.1), R2jags (0.7.1), rjags (4.10), coda (0.19.4), car (3.0.10), dplyr (1.0.6), doParallel (1.0.16), gridExtra (2.3) ggplot2 (3.3.3), itertools (0.1.3), nlme (3.1.152), nls2 (0.2), and tidyr (1.1.3).
The R script is available in Supplementary Material.
Results
Hatching and Growth Period
The hatching dates varied from the end of April to the end of July in 2013, and from the beginning of April to the end of July in 2015. Hatching dates differed significantly between years (F1,259 = 289.40, p-value < 0.001) and between sections (F2,259 = 4.46, p = 0.012), but without interaction between years and sections (F2,257 = 2.44, p = 0.090) (Figure 3). On average in 2015, the YOY hatched 28.24 days earlier (average hatching day = 137.67 Julian days) than in 2013 (average hatching day = 165.91 Julian days). In mean, the hatching dates were not significantly different in the BPS and in the RES (t = −0.029, p = 0.999), whereas YOY hatched 6.12 days (t = 2.765, p = 0.017) and 6.17 days (t = 2.684, p = 0.021) earlier in the TAIL than in the BPS and the RES, respectively.
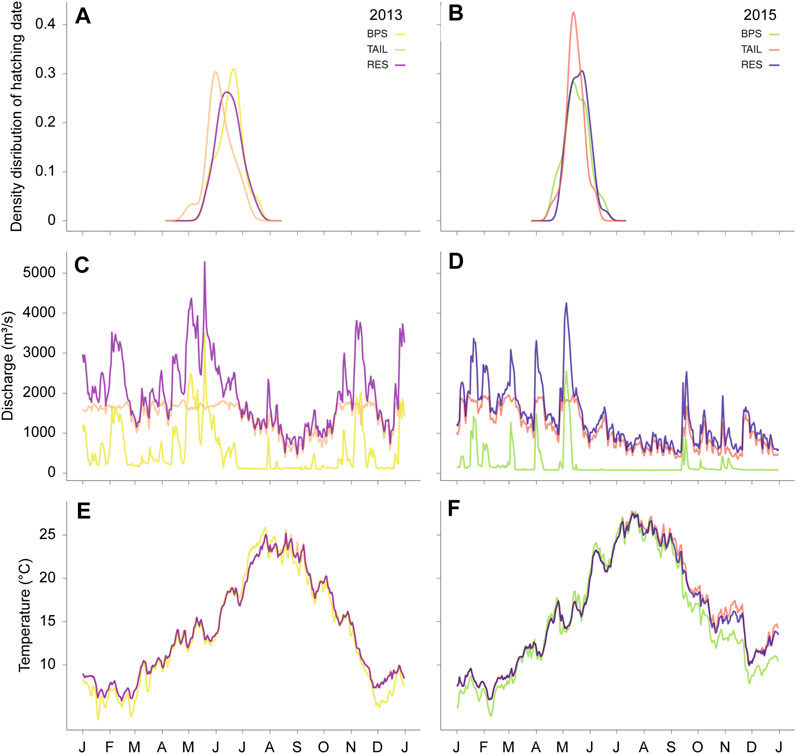
FIGURE 3. Hatching date distributions (A,B), daily mean discharges (m3 s−1) (C,D), and daily mean water temperature (°C) patterns (E,F) during the two studied years (2013, left panels and 2015, right panels).
The growth period was on average 16.55 days longer in 2015 than in 2013 (F1,261 = 104.81, p < 0.001).
Stream-Flow and GDD
All ρ-values were close to one (≥0.96) and highly significant (p-values < 0.001). These correlations were explained by the highest discharge values in early spring (Figure 3). Therefore, fish that hatched earlier experienced higher discharge, had a longer growth period and thus greater GDD values than fish that hatched later in the year. Owing to the correlations observed between discharge and temperatures, we only presented and discussed the effect of temperature on fish growth.
GDD and Size at Capture
The sum of degree day (GDD) varied between years and between sections (GLS, p-values <0.001), without interaction (F2,257 = 0.094, p = 0.910). On average in 2015, GDD exceeded by 379.4°C those experienced by fish in 2013 (t259 = 44.1, p < 0.001). As for the hatching dates, GDD in the BPS and RES were not significantly different (t = 0.172, p = 0.984), whereas the TAIL exhibited higher values of GDD than the BPS and the RES, with differences of 42.4 and 40.6°C, respectively (t-tests, p-values < 0.001).
The effect of GDD on size at capture (Lcpt) varied between sections and years, as revealed by the significant interaction between these three variables (F2,251 = 3.616, p = 0.029). The slope of the relationship between GDD and the logarithm of Lcpt was different but always positive whatever the couple of section-year (Figure 4). The goodness of fit of these relationships, measured by the root mean square errors (RMSE; Table 1), was variable and greater for the BPS or the TAIL (depending of the year), followed by the RES. RMSEs were higher in 2015 than in 2013 (Table 1).
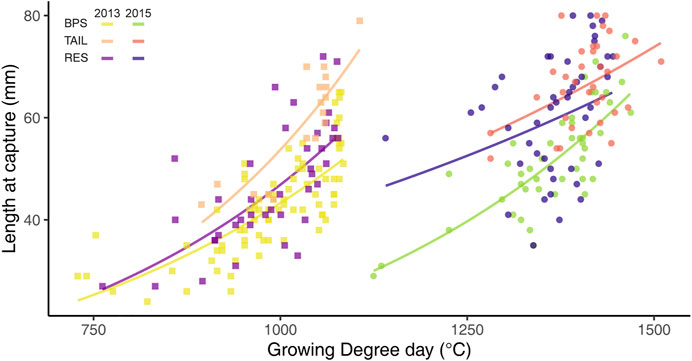
FIGURE 4. Relationship between growing degree-days (GDD > 12°C) and chub size at capture (Lcpt), between years and sections. Curves are the estimated exponential regressions.
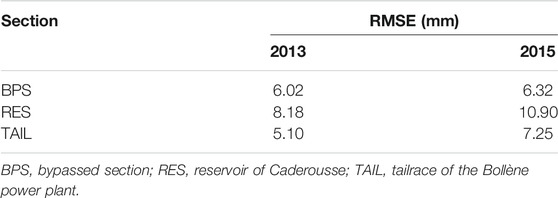
TABLE 1. Root mean square errors (mm) of the relationships between growing degree-days (GDD) and size at capture (Lcpt) for the different sections and years for chub collected in the reach of Caderousse (Rhône River, France).
Fish Growth Curve
Gelman and Rubin’s convergence diagnostics were all close to 1 revealing that convergence was achieved. The average RMSEs were low whatever the sections or years, ranging between 0.298 and 0.556 mm (Table 2). Therefore, the logistic growth model seemed well adapted to model the daily growth of YOY chub.
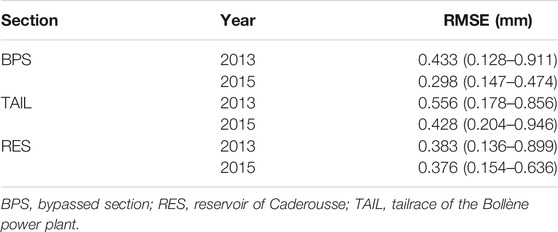
TABLE 2. Average root mean square errors (RMSE; mm) of individual growth curves and their associated credible interval CI (95%).
Minimal Asymptotic Size, α
The α varied between years and sections (Figure 5). The lower median value was observed for the TAIL in 2013, while RES had always the highest values (even higher in 2015). There was no difference between the 2 years for the BPS (Figure 5).
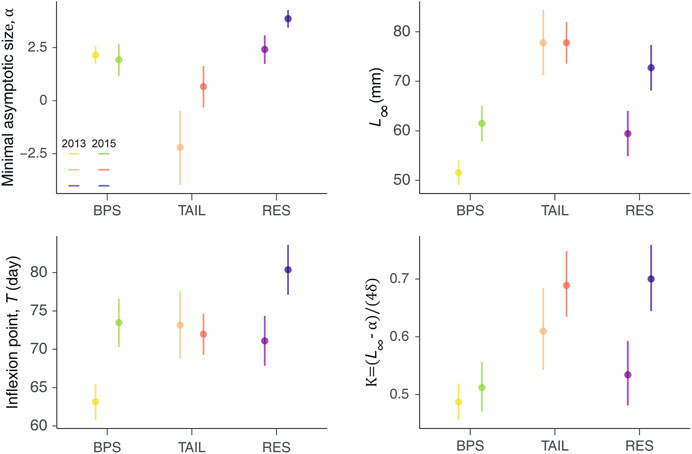
FIGURE 5. Average values (dots) and their associated credible intervals (95%; vertical lines) of the posterior distributions of the four parameters of the logistic growth curves, per sections and year, with the maximum asymptotic size (L∞), the minimal asymptotic size (α), the time at the inflexion point (T), and the maximum growth rate (K).
Asymptotic Size, L∞
The fitted L∞ varied between sections and years, as revealed by the CI displayed on Figure 5. TAIL displayed the highest L∞, but conversely to the BPS and RES, they were consistent between years (77.8 mm). BPS had the lowest L∞ values and RES intermediate values. BPS and RES displayed greater asymptotic size during 2015 than in 2013, but the difference was magnified in the reservoir (△L∞ = 13.32 mm for RES and 9.93 mm for BPS) (Figure 5).
Inflexion Point, T
Similar patterns were observed for T and L∞ values, except that TAIL displayed intermediate values and not the greatest ones. For BPS and RES, the inflexion points appeared later in the growing period during the warmest year, but no significant differences were observed for the TAIL (Figure 5).
Maximum Growth Rate, K
The maximum growth rates (K, slope at the inflexion point) were stronger in 2015 than in 2013 in all sections, but the difference was only significant in RES. The greatest values were observed in RES in 2015. The lowest K were observed in the BPS. TAIL had a greater median value than RES in 2013 (but CIs overlapped) and shared with RES fairly similar values in 2015 (Figure 5).
Fish Growth
Growth patterns were highly variable between sections and between years (Figure 6) with all average daily growth curves different except for the BPS (Figure 6). Up to the 75th day of growth, the curves of BPS were almost similar. Then in 2015 the YOY tended to have a slightly faster growth (but overlapping CIs) to reach a larger asymptotic size, also due to a longer growing period. For the TAIL, all along their growing period YOY were larger in 2015 than in 2013, the deviations increased with time (but overlapping CIs). For the RES, until the 70th day of growth, YOY of 2013 were slightly larger. Then a shift occurred with a steeper growth for YOY of 2015, which became increasingly larger than those of 2013, with magnitude of deviation not observed in the two other sections.
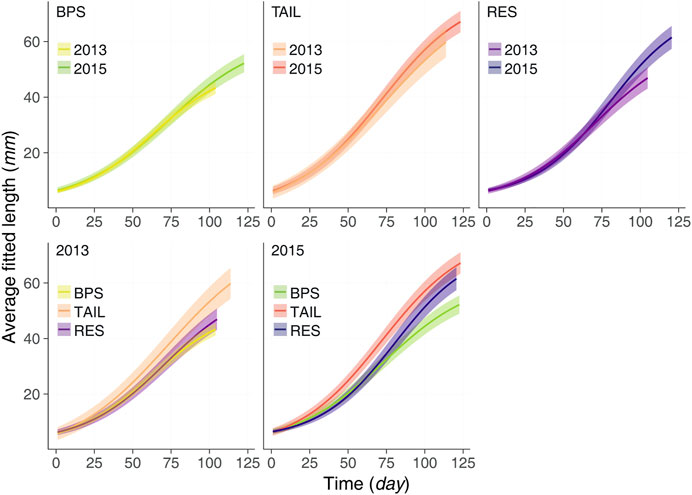
FIGURE 6. The average growth curves (lines) and their associated credible intervals (95%; bands) for each section and each year during the maximum growth periods observed.
When comparing growth curves within each year, we observed that in the colder year (2013) YOY of TAIL had the fastest growth, and that YOY of BPS and RES had close growth patterns. In 2015, YOY of TAIL became larger sooner than all the others. After the 50th day of growth YOY of TAIL were significantly larger than YOY of the BPS. Up to the 85th day of growth, this was also true for RES, but due to the steeper growth in this section, the deviation between the sizes of TAIL and RES decreased and became not significant (CIs overlapping). The growth curve in the RES was partly similar to that of the BPS (during very early life) and that of the TAIL (after day 75).
Individual Variability
Even not observable in Figure 5 (but see Supplementary Material S1), the variability between YOY collected at the same location, and during the same year, was also important as revealed by the posterior distributions of the dispersion parameters (τ) expressed as standard deviations (Table 3). They were higher for the parameters with the greatest values (L∞ and T), but standard deviations also varied between sections and years without clear patterns.
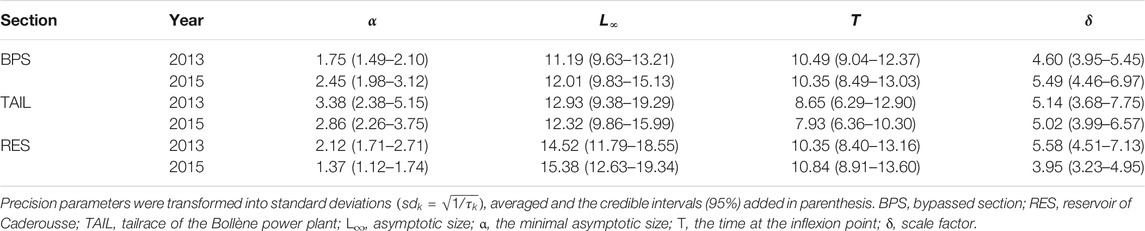
TABLE 3. Summary of the posterior distribution of the dispersion parameters (τk).
Discussion
First, our results showed that YOY chub hatched earlier and had a longer hatching period in 2015 than in 2013 resulting in a longer growing period during the warmer year. Second, the YOY sizes at capture were positively related to growing degree-days. Third, the growth patterns were highly variable between sections and years, with an increase in size-at-age in all sections when GDD increased.
Hatching Date
In the Caderousse reach, the YOY chub hatched from mid-April to the end of July. Most of the estimated hatching dates were observed when the water temperature exceeded 12°C and followed the last spring high. Our observations indicated an extended and longer hatching period compared to former results from European temperate rivers: the Ourthe River, Belgium (April), the Spree River, Germany (May), the rivers Jilhava and Rokytna, Czech Republic (mid-May to mid-June), rivers of Great Britain such as the Stour (May to June), the Lugg (May/June), the Trent (mid-June to mid-July), or in the Upper Rhône (June) (Hellawell, 1971; Mann, 1976; Peňáz et al., 1978; Prokeš and Peňáz, 1980; Philippart and Vranken, 1983; Carrel, 1986; Nunn et al., 2002; Fredrich et al., 2003; Nunn et al., 2007). These differences could be linked to the elapsed time between these studies and our observations, and the possible temperature shift along this period. The extension of the breeding period could result from multiple or protracted spawning events of chub in a new climate context (Dayon et al., 2018; Ouellet et al., 2020).
Temperature played a major role in hatching date variability, both between years and between sections. Indeed, the hatching occurred on average 1 month earlier (≈28 days) during the warmest year and about 1 week earlier (≈6 days) in the warmer section (within the same year). Such variability in hatching date is consistent with previous observations on the aforementioned chub and other species such as roach and common bream (Abramis brama (Linnaeus, 1758)) (Nõges and Järvet, 2005), the roach (Gillet and Quétin, 2006), the Selincuo naked carp (Gymnocypris selincuoensis), a cyprinid from the Tibetan Plateau (Tao et al., 2018), or the threespined stickleback (Gasterosteus aculeatus (Linnaeus, 1758)) (Hovel et al., 2017). Gillet and Quétin (2006) showed that an increase of 1°C in Lake Geneva led to earlier development of the ovaries and spawning date of roach, suggesting that spawning would be reached earlier with global warming. In a historical review, Thorpe (1977) showed a positive relationship between spawning date and latitude for the Eurasian perch (Perca fluviatilis (Linnaeus, 1758)), which generally spawn at a lower temperature and later date as latitude increases. However, current work using long-term surveys showed significant phenological trends associated with climate change. Spring spawning of Eurasian perch of the North Basin and the South Basin of Windermere (UK) advanced by 2.5–5.0 days decade−1 from 1968 to 2009 (Thackeray et al., 2013). Furthermore, shifts in the annual thermal regime to an earlier spring warming and later autumn cooling now affect both spring and autumn spawners. In the Laurentian Great Lakes, Lyons et al. (2015) suggested that the yellow perch (P. flavescens (Mitchill, 1814)) was spawning earlier to maintain a consistent spawning temperature. The phenological patterns observed for lake trout (Salvelinus namaycush (Walbaum, 1792)) indicated a possible tendency for later spawning in autumn, but the trend was less explicit for the period studied (1983–2012). In the current context of global warming, multi-spawning species as chub and thermophilous fish species could benefit from an extended spawning period, a longer first year growing period and progressively dominate fish assemblages (Mueller et al., 2018; Maire et al., 2019).
Temperature is already known to affect numerous aspects of fish reproduction and early life stages, such as gonad development, hatching date (Pankhurst and Munday, 2011), and the number of annual spawning events for multiple or protracted spawning species (Nunn et al., 2007). Multiple spawners such as bleak and chub (Peňáz et al., 1978; Fredrich et al., 2003) experienced more spawning events in warm compared with cold environmental conditions (Mann et al., 1984). While these breeding strategies were known to increase the number of yearly sub-cohorts and the extent of YOY size range during warmer and dryer years (Bolland et al., 2007; Nunn et al., 2007), current change in the thermal regime of large rivers such as the Rhône River could explain the observed recent success of species with multiple spawning such as chub, bleak (Alburnus alburnus (Linnaeus, 1758)), gudgeon (Gobio gobio (Linnaeus, 1758)), barbel (Barbus barbus (Linnaeus, 1758)), schneider (Alburnoides bipunctatus (Bloch, 1782)), bitterling (Rhodeus amarus (Bloch, 1792)), and topmouth gudgeon (Pseudorasbora parva (Temminck and Schlegel, 1846)) (Maire et al., 2019). In addition to these changes in fish assemblages, current monitoring surveys showed an increase in the variability and extent of YOY size range in autumn, with sampling of small surviving individuals in following year (G. Carrel, pers. obs.).
Growth
Degree-days are known to be a reliable predictor of fish growth (Neuheimer and Taggart, 2007). In our study, the size at capture of YOY chub had a clear positive exponential relationship with GDD regardless of section or year. The thermal integral has already been used to explain the inter-annual variation of the mean size of dominant cyprinids such as roach, dace, and chub in British rivers (Mills and Mann, 1985; Nunn et al., 2003) and of the most common species of fish assemblage in the lower Oder River (Wolter, 2007). Nonetheless, our results suggest that the variation in GDD experienced individually by YOY during their first growth period could also explain the variability in autumnal size between individuals. Therefore, GDD is a useful thermal parameter to explain both inter-annual and intra-annual variability of size. As proposed by Spurgeon et al. (2020), GDD could be more widely used as a predictor of fish growth.
Several models were developed to model individual growth and were successfully used with fish (Gamito, 1998; Blanck and Lamouroux, 2007). Even if the Von Bertalanffy model (one of the most used model) was successfully used by some authors to model daily growth (e.g., Loisel et al., 2019), it performed poorly on our data (unpublished results) in accordance with other studies (e.g. Lester et al., 2004). By contrast, the logistic growth model with four parameters (minimal asymptotic size, maximal asymptotic size time at the point of inflexion, and the rate of maximum growth) was well adapted to model YOY daily growth from size back-calculation, as demonstrated by the RMSE values.
Growth patterns showed an increase in fish growth with the increase in temperature for the three sections. Overall, when temperature increased, we observed an increase in the asymptotic size (L∞), the growth rate (K), and a delayed inflexion point (≈10 days later than in 2013). Therefore, fish were larger due to the fact that they grew faster and for a longer period of time in warmer conditions. However, the magnitude of the difference between average growth curves varied among sections and was most marked for the reservoir. For the BPS, growth curves diverged lately but led to very different asymptotic size, mainly due to the delayed inflexion point. This reveals the importance of the early hatching and thus of the longer growing period on the autumn size of the YOY inhabiting the BPS. Fish in the tailrace also exhibited magnified growth in warmer conditions, with fast deviation of the average growth curves (but overlapping credible intervals). Surprisingly, the estimated L∞ were relatively similar. Several hypotheses could explain the high L∞ values observed in the TAIL: a selection of the most robust individuals according to the hydraulic characteristics of this section; the achievement of maximal fish growth in relation to the artificial thermal context; a greatest food availability or a higher food quality (Jonsson et al., 2013; Uphoff et al., 2013); or a lower density of fish for example (Grant and Imre, 2005). In a previous study, Morat et al. (2018) also showed that roach were more abundant in the BPS than in the TAIL. By reducing competition, this lower fish density could explain the higher fish size observed in the TAIL. The relative stability of TAIL abiotic conditions (oxygen saturation and temperature) compared with other sections could also explain this pattern as variations in oxygen saturation was shown to reduce fish growth (Mustafa et al., 2011). Although these parameter values are estimated and not observed size at the end of the first growing season, they were consistent with YOY total size already recorded in this section during early winter (Meynard et al., 2012); but other physicochemical characteristics could also have been of major importance. Therefore, the mechanisms explaining the different growth patterns observed between the two studied years were different for the three sections, as revealed by the distributions of the model parameters.
Globally, our results are consistent with the general theory that attempts to explain the variation in individual size with temperature. Indeed, the “Temperature-Size Rule” (TSR) theory (Atkinson, 1994) states that, in warmer conditions, growth at young stages is magnified compared with the growth of individuals reared in cooler temperatures. While working with individuals sampled in situ, we obtained results consistent with those obtained in controlled conditions (Loisel et al., 2019): larger fish and greater growth rates in warmer conditions. This was observed when comparing the growth pattern of chub YOY for each section: as GDD increased, size-at-age also increased. As other large river-floodplain hydrosystems in Europe, the composition of Rhône fish assemblages had been historically modified following major engineering works during the 19th and 20th centuries (Olivier et al., 2009). Daufresne et al. (2015) showed that global warming increased the rapid turnover of the fish communities in the Rhône River, with “southern” and smaller-size species increasingly represented. Along the Rhône River, three open-cycle cooling nuclear power plants (Bugey, Saint-Alban, and Tricastin) contribute to an artificial increase in water temperature along the river (Wawrzyniak et al., 2012). Current climate change exacerbates the ecological impacts of rising temperatures (Daufresne et al., 2003). The TSR predicts that adults will be smaller and their size at first reproduction will likewise be smaller (Kuparinen et al., 2011; Loisel et al., 2019), leading to the rejuvenation of fish populations (e.g. Daufresne and Boet, 2007; Piffady et al., 2010). The success of small thermophile species such as the bitterling or the topmouth gudgeon in the lower Rhône River, as in other large regulated European rivers, strengthens the general decrease in fish size within the overall fish assemblage. Nonetheless, even if these results were consistent with the TSR, the patterns observed in the different sections and their variations between years demonstrated that other factors such as the water velocity, phenology, or the oxygen availability are able to modulate the effect of temperature on the growth of chub YOY.
In addition, even if significant differences in GDD were observed between years, only fish in the RES displayed large differences in their growth pattern, although growth was magnified for the three sections during the warmer year. This is consistent with the study of Richard and Rypel (2013), which showed that temperature effect on growth rate is magnified in lentic systems. Temperature effect varies with fish size and/or life stages. Indeed, the effect of warming on fish growth was positive but stronger for small individuals than for larger fish; this was observed for flatfishes (Imsland et al., 1996), Gadids (Pedersen and Jobling, 1989), Salmonids (Beauchamp, 2009), and Percids (Huss et al., 2019). This difference seems linked to thermal optimum that decrease with fish size. On two long time series, Huss et al. (2019) showed that the average size of fish was longer for all size-at-age with warming, but also that this is related to a gradual higher growth at early life stage. This size–dependent warming effect on fish growth are known to change regulation and dynamic of populations and communities by affecting the species interactions (Lindmark et al., 2018; 2019).
The inter-annual variations of YOY size at the end of the growing season observed in the Rhône River, as well as other rivers (Bolland et al., 2007), could be explained both by an important variability in hatching time (earlier in the warmest environment or years), in the length of their growing period and by differential growth rates among individuals and/or populations. Moreover, our study results evidenced the major effect of thermal conditions (expressed in GDD) experienced by YOY during their life and are in accordance with the TSR. However, our results also showed that other factors might mitigate the influence of temperature on the early life stage of fish.
Data Availability Statement
The original contributions presented in the study are publicly available. This data can be found here. https://doi.org/10.6084/m9.figshare.16691323 (Logez and Morat, 2021).
Ethics Statement
Ethical review and approval was not required for the animal study because All relevant international, national, and/or institutional guidelines for the care and use of animals were followed. Fish were sacrificed using anaesthetic overdose (eugenol) in accordance with the European Directive 2010/63/EU. Fish were collected in accordance with the authorisation numbers: 2013-203-0005 and 2015-229-DDTSE01 delivered by the prefecture.
Author Contributions
This study was designed by GC and FM. Field collections were made GC, FM, XC, PG, and VD. Otolith analyses were conducted by BB, PG, XC, and FM. Statistical analyses were conducted by ML. The manuscript was written by ML, FM, GC, and BB.
Funding
This study was funded by the French Office for Biodiversity (OFB), by Electricity of France (EDF), and by the national research institute in science and technology for the environment and agriculture (INRAE).
Conflict of Interest
The authors declare that the research was conducted in the absence of any commercial or financial relationships that could be construed as a potential conflict of interest.
Publisher’s Note
All claims expressed in this article are solely those of the authors and do not necessarily represent those of their affiliated organizations, or those of the publisher, the editors and the reviewers. Any product that may be evaluated in this article, or claim that may be made by its manufacturer, is not guaranteed or endorsed by the publisher.
Acknowledgments
The authors would like to thank Baptiste Testi and Pierre Favriou for their help with fish collection, Jean-Jacques Boreux of the University of Liége for his precious help concerning Bayesian hierarchical models, Christine Argillier for her help in the preparation of this paper and Coralie Garron for her precious help with the English.
Supplementary Material
The Supplementary Material for this article can be found online at: https://www.frontiersin.org/articles/10.3389/fenvs.2021.784751/full#supplementary-material
References
Atkinson, D. (1994). Temperature and Organism Size-A Biological Law for Ectotherms? Adv. Ecol. Res. 25, 1–58. doi:10.1016/S0065-2504(08)60212-3
Barnes, C., Maxwell, D., Reuman, D. C., and Jennings, S. (2010). Global Patterns in Predator-Prey Size Relationships Reveal Size Dependency of Trophic Transfer Efficiency. Ecology 91 (1), 222–232. doi:10.1890/08-2061.1
Beauchamp, D. A. (2009). “Bioenergetic Ontogeny: Linking Climate and Mass-specific Feeding to Life-Cycle Growth and Survival of salmon,” in Pacific Salmon: Ecology and Management of Western Alaska's Populations. Editors C. Zimmerman, and C. C. Krueger (Bethesda, MD: American Fisheries Society Symposium), 53–72.
Benitez, J.-P., and Ovidio, M. (2018). The Influence of Environmental Factors on the Upstream Movements of Rheophilic Cyprinids According to Their Position in a River Basin. Ecol. Freshw. Fish. 27 (3), 660–671. doi:10.1111/eff.12382
Blanck, A., and Lamouroux, N. (2007). Large-scale Intraspecific Variation in Life-History Traits of European Freshwater Fish. J. Biogeogr. 34 (5), 862–875. doi:10.1111/j.1365-2699.2006.01654.x
Bolland, J. D., Britton, J. R., and Cowx, I. G. (2007). Lifetime Consequences of Variable 0 Year Group Length in Riverine Populations of Chub Leuciscus cephalus (L.). J. Fish Biol. 71 (6), 1810–1819. doi:10.1111/j.1095-8649.2007.01650.x
Bounket, B., Gibert, P., Gennotte, V., Argillier, C., Carrel, G., Maire, A., et al. (2019). Otolith Shape Analysis and Daily Increment Validation During Ontogeny of Larval and Juvenile European Chub Squalius cephalus. J. Fish. Biol. 95, 444–452. doi:10.1111/jfb.13976
Carrel, G.. (1986). Caractérisation physico-chimique du Haut-Rhône français et de ses annexes ; incidences sur la croissance des populations d'alevins. Villeurbanne: Université Claude Bernard - Lyon I.
Ceballos, G., Ehrlich, P. R., and Raven, P. H. (2020). Vertebrates on the Brink as Indicators of Biological Annihilation and the Sixth Mass Extinction. Proc. Natl. Acad. Sci. USA 117 (24), 13596–13602. doi:10.1073/pnas.1922686117
Copp, G. H., and Peňáz, M. (1988). Ecology of Fish Spawning and Nursery Zones in the Flood Plain, Using a New Sampling Approach. Hydrobiologia 169, 209–224. doi:10.1007/BF00007312
Cowx, I., Noble, R., Nunn, A., Harvey, J., Welcomme, R., and Halls, A. (2004). Flow and Level Criteria for Coarse Fish and Conservation Species. Bristol: Environment Agency Science Report SC020112/SR.
Daufresne, M., and Boët, P. (2007). Climate Change Impacts on Structure and Diversity of Fish Communities in Rivers. Glob. Change Biol. 13, 2467–2478. doi:10.1111/j.1365-2486.2007.01449.x
Daufresne, M., Roger, M. C., Capra, H., and Lamouroux, N. (2003). Long-term Changes within the Invertebrate and Fish Communities of the Upper Rhône River: Effects of Climatic Factors. Glob. Change Biol. 10, 124–140. doi:10.1046/j.1529-8817.2003.00720.x
Daufresne, M., Veslot, J., Capra, H., Carrel, G., Poirel, A., Olivier, J.-M., et al. (2015). Fish Community Dynamics (1985-2010) in Multiple Reaches of a Large River Subjected to Flow Restoration and Other Environmental Changes. Freshw. Biol. 60 (6), 1176–1191. doi:10.1111/fwb.12546
Dayon, G., Boé, J., Martin, É., and Gailhard, J. (2018). Impacts of Climate Change on the Hydrological Cycle over France and Associated Uncertainties. Comptes Rendus Geosci. 350 (4), 141–153. doi:10.1016/j.crte.2018.03.001
Dudgeon, D. (2010). Prospects for Sustaining Freshwater Biodiversity in the 21st Century: Linking Ecosystem Structure and Function. Curr. Opin. Environ. Sustainability 2 (5-6), 422–430. doi:10.1016/j.cosust.2010.09.001
Fredrich, F., Ohmann, S., Curio, B., and Kirschbaum, F. (2003). Spawning Migrations of the Chub in the River Spree, Germany. J. Fish Biol. 63 (3), 710–723. doi:10.1046/j.1095-8649.2003.00184.x
Gamito, S. (1998). Growth Models and Their Use in Ecological Modelling: An Application to a Fish Population. Ecol. Model. 113 (1-3), 83–94. doi:10.1016/S0304-3800(98)00136-7
Gillet, C., and Quétin, P. (2006). Effect of Temperature Changes on the Reproductive Cycle of Roach in Lake Geneva from 1983 to 2001. J. Fish. Biol. 69 (2), 518–534. doi:10.1111/j.1095-8649.2006.01123.x
Grant, J. W. A., and Imre, I. (2005). Patterns of Density-dependent Growth in Juvenile Stream-Dwelling Salmonids. J. Fish Biol. 67, 100–110. doi:10.1111/j.0022-1112.2005.00916.x
Harrison, I., Abell, R., Darwall, W., Thieme, M. L., Tickner, D., and Timboe, I. (2018). The Freshwater Biodiversity Crisis. Science 362 (6421), 1369. doi:10.1126/science.aav9242
Hartmann, P., Bordet, F., Chevalier, C., Colin, J., and Khalanski, M. (2014). Centrales nucléaires et environnement–Prélèvements d’eau et rejets. Saint Denis: Guide EDF E. Edpsciences.
Hellawell, J. M. (1971). The Autecology of the Chub, Squalius cephalus (L.), of the River Lugg and the Afon Llynfi. Freshw. Biol. 1 (4), 369–387. doi:10.1111/j.1365-2427.1971.tb01569.x
Hovel, R. A., Carlson, S. M., and Quinn, T. P. (2017). Climate Change Alters the Reproductive Phenology and Investment of a Lacustrine Fish, the Three‐spine Stickleback. Glob. Change Biol. 23 (6), 2308–2320. doi:10.1111/gcb.13531
Hurst, T. P. (2007). Causes and Consequences of Winter Mortality in Fishes. J. Fish. Biol. 71 (2), 315–345. doi:10.1111/j.1095-8649.2007.01596.x
Huss, M., Lindmark, M., Jacobson, P., Van Dorst, R. M., and Gårdmark, A. (2019). Experimental Evidence of Gradual Size‐dependent Shifts in Body Size and Growth of Fish in Response to Warming. Glob. Change Biol. 25 (7), 2285–2295. doi:10.1111/gcb.14637
Imsland, A. K., Sunde, L. M., Folkvord, A., and Stefansson, S. O. (1996). The Interaction of Temperature and Fish Size on Growth of Juvenile Turbot. J. Fish Biol. 49 (5), 926–940. doi:10.1111/j.1095-8649.1996.tb00090.x
Jonsson, B., Jonsson, N., and Finstad, A. G. (2013). Effects of Temperature and Food Quality on Age and Size at Maturity in Ectotherms: An Experimental Test with Atlantic salmon. J. Anim. Ecol. 82 (1), 201–210. doi:10.1111/j.1365-2656.2012.02022.x
Konečná, M., Jurajda, P., and Reichard, M. (2009). River Discharge Drives Recruitment Success of the European Bitterling Rhodeus amarus in a Regulated River in Central Europe. J. Fish Biol. 74 (7), 1642–1650. doi:10.1111/j.1095-8649.2009.02207.x
Kuparinen, A., Cano, J. M., Loehr, J., Herczeg, G., Gonda, A., and Merilä, J. (2011). Fish Age at Maturation Is Influenced by Temperature Independently of Growth. Oecologia 167 (2), 435–443. doi:10.1007/s00442-011-1989-x
Lester, N. P., Shuter, B. J., and Abrams, P. A. (2004). Interpreting the von Bertalanffy model of Somatic Growth in Fishes: The Cost of Reproduction. Proc. R. Soc. Lond. B 271, 1625–1631. doi:10.1098/rspb.2004.2778
Li, X., Chen, Y., He, D., and Chen, F. (2009). Otolith Characteristics and Age Determination of an Endemic Ptychobarbus dipogon (Regan, 1905) (Cyprinidae: Schizothoracinae) in the Yarlung Tsangpo River, Tibet. Environ. Biol. Fish. 86 (1), 53–61. doi:10.1007/s10641-008-9420-0
Lindmark, M., Huss, M., Ohlberger, J., and Gårdmark, A. (2018). Temperature‐dependent Body Size Effects Determine Population Responses to Climate Warming. Ecol. Lett. 21 (2), 181–189. doi:10.1111/ele.12880
Lindmark, M., Ohlberger, J., Huss, M., and Gårdmark, A. (2019). Size‐based Ecological Interactions Drive Food Web Responses to Climate Warming. Ecol. Lett. 22 (5), 778–786. doi:10.1111/ele.13235
Logez, M., and Morat, F. (2021). Fish_growth_data_set. Available at: https://figshare.com/articles/dataset/Fish_growth_data_set/16691323. doi:10.6084/m9.figshare.16691323.v1
Loisel, A., Isla, A., and Daufresne, M. (2019). Variation of thermal Plasticity in Growth and Reproduction Patterns: Importance of Ancestral and Developmental Temperatures. J. Therm. Biol. 84, 460–468. doi:10.1016/j.jtherbio.2019.07.029
Lyons, J., Rypel, A. L., Rasmussen, P. W., Burzynski, T. E., Eggold, B. T., Myers, J. T., et al. (2015). Trends in the Reproductive Phenology of Two Great Lakes Fishes. Trans. Am. Fish. Soc. 144 (6), 1263–1274. doi:10.1080/00028487.2015.1082502
Maire, A., Thierry, E., Viechtbauer, W., and Daufresne, M. (2019). Poleward Shift in Large‐river Fish Communities Detected with a Novel Meta‐analysis Framework. Freshw. Biol. 64 (6), 1143–1156. doi:10.1111/fwb.13291
Mann, R. H. K., Mills, C. A., and Crisp, D. T. (1984). “Geographical Variation in the Life-History Tactics of Some Species of Freshwater Fish,” in Fish Reproduction: Strategies and Tactics. Editors G. W. Pott, and R. J. Wootton. (London: Academic Press), 171–186.
Mann, R. H. K. (1976). Observations on the Age, Growth, Reproduction and Food of the Chub Squalius cephalus (L.) in the River Stour, Dorset. J. Fish. Biol. 8, 265–288. doi:10.1111/j.1095-8649.1976.tb03950.x
Meynard, M., Testi, B., Veslot, J., and Carrel, G. (2012). Etude thermique du Rhône Phase IV – Lot 2(Aix-en-Provence: U.R. Hydrobiologie, Irstea. Facteurs hydroclimatiques et taille des poissons juvéniles, 85. Available at: https://www.rhone-mediterranee.eaufrance.fr/sites/sierm/files/content/migrate_documents/ETR-P4-Lot2-Rapport.pdf.
Miller, T. J., Crowder, L. B., Rice, J. A., and Marschall, E. A. (1988). Larval Size and Recruitment Mechanisms in Fishes: Toward a Conceptual Framework. Can. J. Fish. Aquat. Sci. 45 (9), 1657–1670. doi:10.1139/f88-197
Mills, C. A., and Mann, R. H. K. (1985). Environmentally-induced Fluctuations in Year-Class Strength and Their Implications for Management. J. Fish Biol. 27 (Suppl. l), 209–226. doi:10.1111/j.1095-8649.1985.tb03243.x
Morat, F., Gibert, P., Reynaud, N., Testi, B., Favriou, P., Raymond, V., et al. (2018). Spatial Distribution, Total Length Frequencies and Otolith Morphometry as Tools to Analyse the Effects of a Flash Flood on Populations of Roach (Rutilus rutilus). Ecol. Freshw. Fish. 27, 421–432. doi:10.1111/eff.12357
Mueller, M., Pander, J., and Geist, J. (2018). Comprehensive Analysis of >30 Years of Data on Stream Fish Population Trends and Conservation Status in Bavaria, Germany. Biol. Conservation 226, 311–320. doi:10.1016/j.biocon.2018.08.006
Mustafa, S. A., Al-Subiai, S. N., Davies, S. J., and Jha, A. N. (2011). Hypoxia-induced Oxidative DNA Damage Links with Higher Level Biological Effects Including Specific Growth Rate in Common Carp, Cyprinus carpio L. Ecotoxicology 20 (6), 1455–1466. doi:10.1007/s10646-011-0702-5
Nelva, A., Persat, H., and Chessel, D. (1979). Une nouvelle méthode d'étude des peuplements ichtyologiques dans les grands cours d'eau par échantillonnage ponctuel d'abondance. Comptes-Rendus de l'Académie des Sci. de Paris 289 (D), 1295–1298. Available at: https://gallica.bnf.fr/ark:/12148/bpt6k5496019d.
Neuheimer, A. B., and Taggart, C. T. (2007). The Growing Degree-Day and Fish Size-At-Age: The Overlooked Metric. Can. J. Fish. Aquat. Sci. 64 (2), 375–385. doi:10.1139/f07-003
Nõges, P., and Järvet, A. (2005). Climate Driven Changes in the Spawning of Roach (Rutilus rutilus (L.)) and Bream (Abramis brama (L.)) in the Estonian Part of the Narva River basin. Boreal Environ. Res. 10 (1), 45–55. Available at: http://www.borenv.net/BER/archive/pdfs/ber10/ber10-045.pdf.
Nunn, A. D., Cowx, I. G., Frear, P. A., and Harvey, J. P. (2003). Is Water Temperature an Adequate Predictor of Recruitment Success in Cyprinid Fish Populations in Lowland Rivers? Freshw. Biol. 48 (4), 579–588. doi:10.1046/j.1365-2427.2003.01033.x
Nunn, A. D., Cowx, I. G., and Harvey, J. P. (2002). Recruitment Patterns of Six Species of Cyprinid Fishes in the Lower River Trent, England. Ecol. Freshw. Fish 11 (2), 74–84. doi:10.1034/j.1600-0633.2002.t01-1-00001.x
Nunn, A. D., Frear, P. A., Lee, M., and Cowx, I. G. (2010). Is There Evidence for a Shift in Fish Growth and Recruitment Success Linked to Climate Change. J. Fish Biol. 77 (8), 1780–1792. doi:10.1111/j.1095-8649.2010.02751.x
Nunn, A. D., Harvey, J. P., and Cowx, I. G. (2007). Variations in the Spawning Periodicity of Eight Fish Species in Three English Lowland Rivers over a 6 Year Period, Inferred from 0+ Year Fish Length Distributions. J. Fish. Biol. 70 (4), 1254–1267. doi:10.1111/j.1095-8649.2007.01415.x
Olivier, J.-M., Dole-Olivier, M.-J., Amoros, C., Carrel, G., Malard, F., Lamouroux, N., et al. (2009). “The Rhône River Basin,” in Rivers Of Europe. Editors K. Tockner, U. Uehlinger, and C. T. Robinson. 1st Edn. (London: Academic Press), 247–295. doi:10.1016/b978-0-12-369449-2.00007-2, Elsevier
Ouellet, V., St-Hilaire, A., Dugdale, S. J., Hannah, D. M., Krause, S., and Proulx-Ouellet, S. (2020). River Temperature Research and Practice: Recent Challenges and Emerging Opportunities for Managing thermal Habitat Conditions in Stream Ecosystems. Sci. Total Environ. 736, 139679. doi:10.1016/j.scitotenv.2020.139679
Panfili, J., De Pontual, H., Troadec, H., and Wright, P. J. (2002). Manuel de sclérochronologie des poissons. Coédition Ifremer-IRD. Editors J. Panfili, H. de Pontual, H. Troadec, and P. J. Wright (France), 464.
Pankhurst, N. W., and Munday, P. L. (2011). Effects of Climate Change on Fish Reproduction and Early Life History Stages. Mar. Freshw. Res. 62 (9), 1015–1026. doi:10.1071/MF10269
Pedersen, T., and Jobling, M. (1989). Growth Rates of Large, Sexually Mature Cod Gadus morhua, in Relation to Condition and Temperature During an Annual Cycle. Aquaculture 81 (2), 161–168. doi:10.1016/0044-8486(89)90242-1
Peňáz, M., Prokeš, M., and Wohlgemuth, E. (1978). Fish Fry Community of the Jilhava River Near Mohelno. Acta Scientiarum Naturalium - Academiae Scientiarum Bohemoslovacae Brno 12 (5), 1–36.
Philippart, J.-C., and Vranken, M. (1983). Atlas des poissons de Wallonie. Distribution, écologie, éthologie, pêche, conservation. Cahiers d'Ethologie Appliquée. Liege: Universite de Liege. Institut de Zoologie.
Piffady, J., Souchon, Y., Capra, H., and Parent, E. (2010). Quantifying the Effects of Temperature and Flow Regime on the Abundance of 0+ Cyprinids in the Upper River Rhone Using Bayesian Hierarchical Modelling. Freshw. Biol. 55, 2359–2374. doi:10.1111/j.1365-2427.2010.02453.x
Prokeš, M., and Peňáz, M. (1980). Early Development of the Chub. Leuciscus cephalus. Acta Scientiarum Naturalium - Academiae Scientiarum Bohemoslovacae Brno 14, 1–40.
Richard, J. C., and Rypel, A. L. (2013). Water Body Type Influences Climate-Growth Relationships of Freshwater Drum. Trans. Am. Fish. Soc. 142 (5), 1308–1320. doi:10.1080/00028487.2013.806350
Ricker, W. E. (1979). “Growth Rates and Models,” in Fish Physiology, VIII: Bioenergetics and Growth. Editors W. S. Hoar, D. J. Randall, and J. R. Brett. (New York, NY: Academic Press), 677–743. doi:10.1016/s1546-5098(08)60034-5:
Roff, D. (1992). The Evolution of Life Histories: Theory and Analysis. New York, NY: Chapman & Hall.
Santos, R., Poulet, N., and Besnard, A. (2021). Life‐history Traits Correlate with Temporal Trends in Freshwater Fish Populations for Common European Species. Freshw. Biol. 66, 317–331. doi:10.1111/fwb.13640
Smith, B. B., and Walker, K. F. (2003). Validation of the Ageing of 0+ Carp (Cyprinus carpio L.). Mar. Freshw. Res. 54 (8), 1005–1008. doi:10.1071/MF03010
Sogard, S. M. (1997). Size-selective Mortality in the Juvenile Stage of Teleost Fishes: A Review. Bull. Mar. Sci. 60 (3), 1129–1157.
Spurgeon, J. J., Pegg, M. A., Pope, K. L., and Xie, L. (2020). Ecosystem-specific Growth Responses to Climate Pattern by a Temperate Freshwater Fish. Ecol. Indicators 112, 106130. doi:10.1016/j.ecolind.2020.106130
Tao, J., He, D., Kennard, M. J., Ding, C., Bunn, S. E., Liu, C., et al. (2018). Strong Evidence for Changing Fish Reproductive Phenology under Climate Warming on the Tibetan Plateau. Glob. Change Biol. 24 (5), 2093–2104. doi:10.1111/gcb.14050
Thackeray, S. J., Henrys, P. A., Feuchtmayr, H., Jones, I. D., Maberly, S. C., and Winfield, I. J. (2013). Food Web De-synchronization in England's Largest lake: An Assessment Based on Multiple Phenological Metrics. Glob. Change Biol. 19 (12), 3568–3580. doi:10.1111/gcb.12326
Thorpe, J. E. (1977). Morphology, Physiology, Behavior, and Ecology of Perca fluviatilis L. And P. flavescens Mitchill. J. Fish. Res. Bd. Can. 34 (10), 1504–1514. doi:10.1139/f77-215
Uphoff, C. S., Schoenebeck, C. W., Hoback, W. W., Koupal, K. D., and Pope, K. L. (2013). Degree-day Accumulation Influences Annual Variability in Growth of Age-0 Walleye. Fish. Res. 147, 394–398. doi:10.1016/j.fishres.2013.05.010
Vigliola, L., and Meekan, M. G. (2009). “The Back-Calculation of Fish Growth from Otoliths,” in Tropical Fish Otoliths: Information for Assessment, Management and Ecology (Dordrecht: Spinger), 174–211. doi:10.1007/978-1-4020-5775-5_6.
Wawrzyniak, V., Piégay, H., and Poirel, A. (2012). Longitudinal and Temporal Thermal Patterns of the French Rhône River Using Landsat ETM+ thermal Infrared Images. Aquat. Sci. 74 (3), 405–414. doi:10.1007/s00027-011-0235-2
Werner, E. E., and Gilliam, J. F. (1984). The Ontogenetic Niche and Species Interactions in Size-Structured Populations. Annu. Rev. Ecol. Syst. 15, 393–425. doi:10.1146/annurev.es.15.110184.002141
West, G. B., and Brown, J. H. (2005). The Origin of Allometric Scaling Laws in Biology from Genomes to Ecosystems: Towards a Quantitative Unifying Theory of Biological Structure and Organization. J. Exp. Biol. 208 (9), 1575–1592. doi:10.1242/jeb.01589
Winemiller, K. O., and Rose, K. A. (1992). Patterns of Life-History Diversification in North American Fishes: Implications for Population Regulation. Can. J. Fish. Aquat. Sci. 49 (10), 2196–2218. doi:10.1139/f92-242
Wolter, C. (2007). Temperature Influence on the Fish Assemblage Structure in a Large lowland River, the Lower Oder River, Germany. Ecol. Freshw. Fish 16 (4), 493–503. doi:10.1111/j.1600-0633.2007.00237.x
Keywords: Leuciscidae, logistic model, temperature, hatching, otoliths, large regulated river
Citation: Logez M, Bounket B, Gibert P, Carrel G, Diouloufet V, Colombet X and Morat F (2021) The Interannual Variability of the Fall Size of Young-of-The-Year Chub (Squalius cephalus): Influence of Phenology, Growth Patterns and Abiotic Factors. Front. Environ. Sci. 9:784751. doi: 10.3389/fenvs.2021.784751
Received: 28 September 2021; Accepted: 22 October 2021;
Published: 09 December 2021.
Edited by:
Maria Ilhéu, University of Evora, PortugalReviewed by:
José Maria Santos, University of Lisbon, PortugalJeyaraj Antony Johnson, Wildlife Institute of India, India
Copyright © 2021 Logez, Bounket, Gibert, Carrel, Diouloufet, Colombet and Morat. This is an open-access article distributed under the terms of the Creative Commons Attribution License (CC BY). The use, distribution or reproduction in other forums is permitted, provided the original author(s) and the copyright owner(s) are credited and that the original publication in this journal is cited, in accordance with accepted academic practice. No use, distribution or reproduction is permitted which does not comply with these terms.
*Correspondence: Maxime Logez, bWF4aW1lLmxvZ2V6QGlucmFlLmZy