
94% of researchers rate our articles as excellent or good
Learn more about the work of our research integrity team to safeguard the quality of each article we publish.
Find out more
ORIGINAL RESEARCH article
Front. Environ. Sci., 12 January 2022
Sec. Interdisciplinary Climate Studies
Volume 9 - 2021 | https://doi.org/10.3389/fenvs.2021.783864
This article is part of the Research TopicClimate Change, Extreme Weather, and Vector-Borne Diseases: Spatial and Temporal RisksView all 5 articles
 Junyu He1,2
 Xianyu Wei3Wenwu Yin4Yong Wang3Quan Qian3Hailong Sun3Yuanyong Xu3
 Ricardo J. Soares Magalhaes5,6
 Yuming Guo7
 Wenyi Zhang3*
Scrub typhus (ST) is expanding its geographical distribution in China and in many regions worldwide raising significant public health concerns. Accurate ST time-series modeling including uncovering the role of environmental determinants is of great importance to guide disease control purposes. This study evaluated the performance of three competing time-series modeling approaches at forecasting ST cases during 2012–2020 in eight high-risk counties in China. We evaluated the performance of a seasonal autoregressive-integrated moving average (SARIMA) model, a SARIMA model with exogenous variables (SARIMAX), and the long–short term memory (LSTM) model to depict temporal variations in ST cases. In our investigation, we considered eight environmental variables known to be associated with ST landscape epidemiology, including the normalized difference vegetation index (NDVI), temperature, precipitation, atmospheric pressure, sunshine duration, relative humidity, wind speed, and multivariate El Niño/Southern Oscillation index (MEI). The first 8-year data and the last year data were used to fit the models and forecast ST cases, respectively. Our results showed that the inclusion of exogenous variables in the SARIMAX model generally outperformed the SARIMA model. Our results also indicate that the role of exogenous variables with various temporal lags varies between counties, suggesting that ST cases are temporally non-stationary. In conclusion, our study demonstrates that the approach to forecast ST cases needed to take into consideration local conditions in that time-series model performance differed between high-risk areas under investigation. Furthermore, the introduction of time-series models, especially LSTM, has enriched the ability of local public health authorities in ST high-risk areas to anticipate and respond to ST outbreaks, such as setting up an early warning system and forecasting ST precisely.
Scrub typhus (ST) is a mite-borne disease caused by the Orientia tsutsugamushi (O. tsutsugamushi). A number of rodent species have been identified to carry O. tsutsugamushi including Apodemus agrarius, Micromys minutus, Mus musculus, Rattus norvegicus, Microtus fortis, and Tscherskia triton (Kim et al., 2010; O’Guinn et al., 2010; Sames et al., 2010).Once infected, patients will have typical clinical symptoms, such as fever, headache, fatigue, myalgia, chills, eschar, facial flushing, rash, acute hearing loss, and pneumonitis (Premaratna et al., 2006; Zhang et al., 2010). Delays in diagnosis of scrub typhus can lead to acute respiratory distress syndrome, septic shock, and multi-organ failure, leading to death (Chrispal et al., 2010). Currently, ST attracts considerable public health concerns in China, South Korea, India, and Thailand (Park, 2016; Rodkvamtook et al., 2018; Zheng et al., 2019). In China, not only the incidence of reported ST cases has significantly increased from 0.09 to 1.6 per 100,000 population in 2006 and 2016, respectively, but also ST cases are reported in the entire country within rural and urban communities (Li et al., 2020).
ST epidemiology has been extensively studied in China, such as identification of zoonotic sources of ST infection (Kuo et al., 2015), the clinical manifestations of ST infection (Zhang et al., 2010; 2012), the local spatial or spatio-temporal distributions of ST notifications (Kuo et al., 2011; Ding et al., 2012b), and the associations between the environmental factors and ST notifications (Tsai and Yeh, 2013; Wardrop et al., 2013; Li et al., 2014; Yang et al., 2014). Although the spatial variation of ST cases in China has been comprehensively studied, to date there are relatively few studies aiming to validate epidemiological time-series models to forecast ST cases. Precise forecasting of the ST cases can help local health administrative departments release an early warning of the increased risk of ST incidence and distribute reasonable medical resources in a timely manner for preventing and controlling the ST spread. Machine learning techniques have been developing rapidly during the past decade; random forest, support vector machine, or gradient boost machine techniques are used to determine the relationship between the studied natural attribute and the related environmental variable in the field of public health (Carvajal et al., 2018; He et al., 2018a). However, these methodologies have certain limitations on forecasting the disease in the future. The available literature indicates that several time-series modeling approaches have been applied to infectious diseases in China including the autoregressive-integrated moving average (ARIMA) model and the seasonal ARIMA (SARIMA) model (Ding et al., 2012a; Yang et al., 2015).While the ARIMA and SARIMA modeling approaches cannot account for the effect of disease-related environmental factors (e.g., the meteorological and land cover factors), the SARIMAX model allows time-variant exogenous variables to be considered along with the temporal autocorrelation in disease counts. The SARIMAX models have previously been utilized to model the time series of hemorrhagic fever with renal syndrome in China (He et al., 2018b). Recently, a new time-series modeling approach based on recurrent neural networks (RNNs) has been developed (Yu et al., 2019; Sherstinsky, 2020). This modeling approach known as the long–short term memory (LSTM) model, a machine learning method, has shown strong ability for COVID-19 time-series forecasting (Chimmula and Zhang, 2020). The memory capability of LSTM to retain information from previous time instants is suitable for time-series forecasting, especially in the case of time-series with temporal correlations. The LSTM model inherits all features from RNN and the basic artificial neural network (ANN), such as self-learning, self-adaption, and self-organization; moreover, the structure of LSTM can to some extent solve the issue of vanishing and/or exploding temporal gradients that occur in RNN modeling (Gonzalez and Yu, 2018; DiPietro and Hager, 2020). However, to date the relative performance of these time-series modeling approaches at forecasting the time series of ST cases in high-risk areas in China has not been explored. Therefore, such a study will benefit the public health managers on providing precise ST forecasting models, especially in the high-risk ST counties.
In this study, we aimed to evaluate the performance of three competing time-series modeling approaches at uncovering the temporal variability of ST cases in eight high-risk counties of China and quantifying the role of ST-related environmental factors at explaining the temporal variation in ST incidence.
Monthly ST cases were collected for the top eight high-risk ST counties of China for the 2012–2020 period from the China Information System for Disease Control and Prevention, including Yingshang County (Anhui province), Guangning County (Guangdong province), Huaiji County (Guangdong province), Yingde City (Guangdong province), Longling County (Yunnan province), Gengma County (Yunnan province), Mang city (Yunnan province), and Yingjiang County (Yunnan province), as shown in Figure 1. The total cases of the eight counties over the time period of analysis were 2,177, 2,832, 3,395, 2,688, 4,052, 1,936, 1,952, and 2,073, respectively. The criteria for a confirmed ST case included epidemiological exposure patient histories (travel to an epidemic area and contact with chiggers or rodents within 3 weeks before the onset of illness), clinical manifestations (for example, skin rash, lymphadenopathy, high fever, and eschar or ulcers), and also positivity for at least one of the laboratory diagnostic criteria/tests: isolation of O. tsutsugamushi from clinical specimens, or detection of O. tsutsugamushi by polymerase chain reaction (PCR) in clinical specimens, or a 4-fold or greater rise in serum IgG antibody titers between acute and convalescent sera by using indirect immunofluorescence antibody assay (IFA) (Zhang et al., 2013; Li et al., 2020).
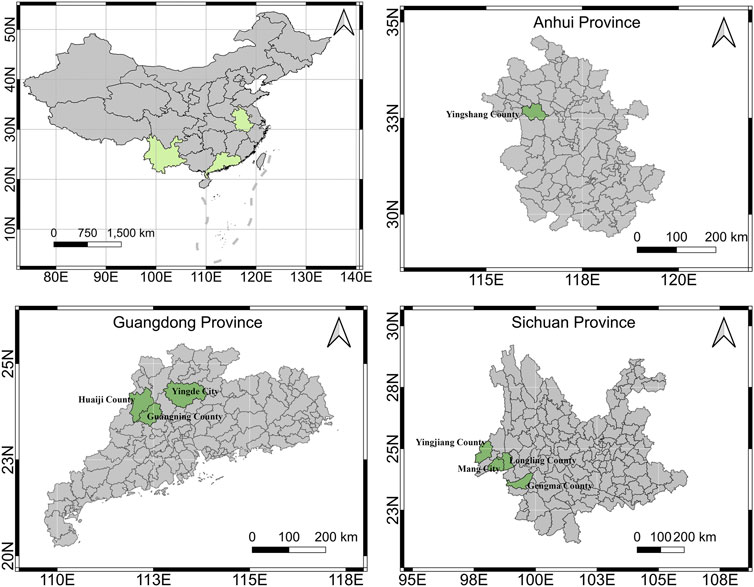
FIGURE 1. Locations of the eight study counties.
Environmental data used in this study included raster maps of the normalized difference vegetation index (NDVI) representing the amount of vegetation at specific locations which was collected from the MODIS-Terra products (MOD13A2, https://modis.gsfc.nasa.gov/data/dataprod/mod13.php) with spatial resolution 1 km. We also used meteorological data from weather monitoring stations in China from the China Meteorological Administration (http://www.cma.gov.cn/), including precipitation, pressure, relative humidity, sunshine duration, daily mean temperature, daily minimum temperature, daily maximum temperature, and mean wind speed. The multivariate El Niño/Southern Oscillation Index (MEI), regarded as global climate change proxy, was collected from the physical sciences laboratory of National Oceanic and Atmospheric Administration (https://psl.noaa.gov/enso/mei/).
The inverse distance weighted method was employed for mapping the six meteorological data with the same spatial resolution of the NDVI. Then, the NDVI and the six meteorological data were extracted by the administrative boundaries of the eight counties, and the mean values of each variable were calculated each month during the study period for further analysis.
Based on the standard ARIMA model, the SARIMAX model considers simultaneously the seasonal variation in ST cases and accounts for the effects of exogenous risk factors for better understanding and fitting the considered time series. The basic equations of SARIMAX are as follows:
where
In order to test the possibility of applying LSTM in ST modeling and forecasting, the exogenous variables included in the final SARIMAX model together with the ST time series were chosen as the LSTM input. LSTM is constructed by a number of connected cells (the basic unit of the network), while each cell consists of three gates, i.e., the forget gate, input gate, and output gate; see Figure 2. Specifically, the hidden state from the previous cell
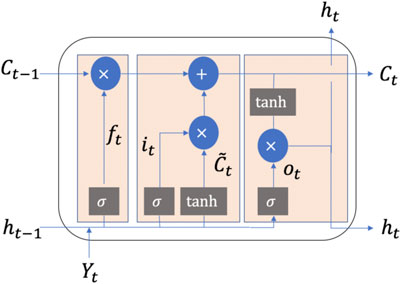
FIGURE 2. Workflow of each cell of LSTM. The three light yellow rectangles represent the forget gate, input gate, and output gate, respectively.
Various SARIMA and SARIMAX models were established with different model structures, and temporal lagged exogenous variables at the eight considered counties and the optimal model structure with the corresponding performance are presented in Supplementary Appendix Table A1. According to the optimal model structures, all models have the same seasonal difference order, i.e.,
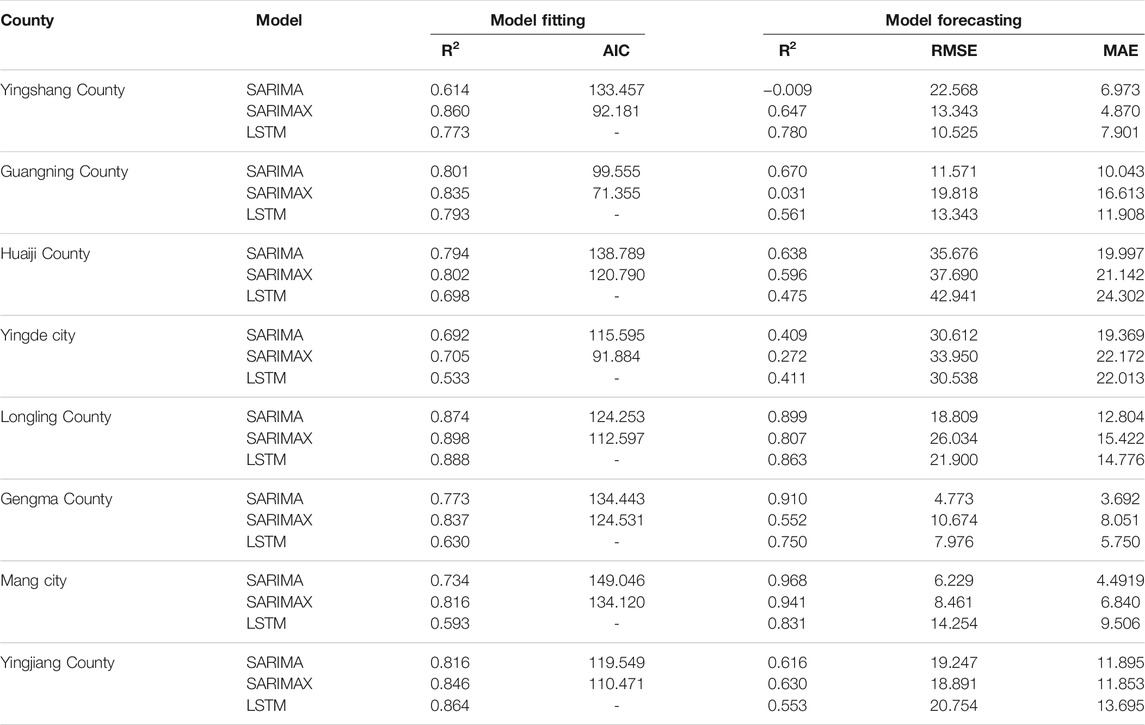
TABLE 1. Performance of SARIMA, SARIMAX, and LSTM on forecasting ST cases at eighty counties of China.
Through exogenous variable selection processes, the SARIMAX models absorb the strength of one or several exogenous variables with temporal lags for ST variation modeling. Atmospheric pressure with a 4-month temporal lag was found to be the sole exogenous variable for SARIMAX modeling in Huaiji County. As shown in Supplementary Appendix Table A1, the significant ST-associated exogenous variables vary between the eight counties under investigation. Atmospheric pressure, sunshine duration, wind speed, and MEI with various temporal lags were found to be correlated with the ST temporal variation in Yingyang County and Guangning County; however, precipitation and relative humidity were also included in ST forecasting at Yingyang County, while NDVI was included in the model at Guangning County. At Gengma County and Yingjiang County, relative humidity and sunshine duration were significant variables associated with ST; specifically, mean temperature was also found to be associated with ST at Yingjiang County. In addition, mean temperature and wind speed were two important impact factors of ST at Yingde city and Mang city, but precipitation and MEI were considered as other important factors for the two cities, respectively. Finally, the ST variation at Longling County was closely correlated with precipitation, relative humidity, and mean temperature with various temporal lags. Compared to the SARIMA model, the results of the SARIMAX model showed that more accuracy performance (in terms of R2) can be achieved at the model fitting stage in all of the eight counties; meanwhile, at the model forecasting stage, only the SARIMAX models in Yingshang County and Yingjiang County showed better forecasting accuracy than the SARIMA models in terms of RMSE and MAE.
By inputting the ST series and the corresponding significantly related exogenous variables shown in Supplementary Appendix Table A1 to the LSTM model, the optimal model structure was obtained according to the smallest R2 in the model fitting stage. The results showed that better performance can be yielded by setting the length of input series as 12 months at Huaiji County, Yingde city, Longling County, Gengma County, and Yingjiang County, while the optimal length of input series at Yingshang County, Guangning County, and Mang city were 10, 3, and 11, respectively. The hidden dimension, batch size, and number of layers varied between counties. At the model fitting process, the LSTM model showed better performance than SARIMA at Yingshang County and Longling County in terms of R2; at the model forecasting stage, LSTM showed more accuracy in forecasting ST cases than SARIMA and SARIMAX at Yingshang County and Yingde County, while only than SARIMAX at Guangning County and Longling County (Table 1).
The model fitting and forecasting results were separated by a vertical dash line, as shown in Figure 3. The gray line, yellow line, red line, and green line represent the real ST notification series, SARIMA estimation, SARIMAX estimation, and LSTM estimation, respectively. It can be concluded as follows: 1) the LSTM model used a smaller length of input data for ST fitting than SARIMA and SARIMAX because the green line begins much earlier than the yellow and red lines; for example, most of the green lines at the eight counties begins during 2013 except the Guangning County, while the yellow and red lines begin during 2014 for Yingshang County, Huaiji County, Yingde County, and Yingjiang County, and for the other four counties, the model estimations begin during 2015. 2) Compared to the SARIMA and SARIMAX, LSTM showed smoother estimation values and less local fluctuations.3) Through comparing the real ST time series in the eight counties, four kinds of temporal patterns of ST variations can be concluded as follows: the ST series peaks in October and August in Yingshang County and Longling County, respectively; two peaks can be found in June and October in Guangning County, Huaiji County, and Yingde city, while in Gengma County, Mang city, and Yingjiang County, bio-peak phenomena can also be found in summer and winter during multiple years of the study period.
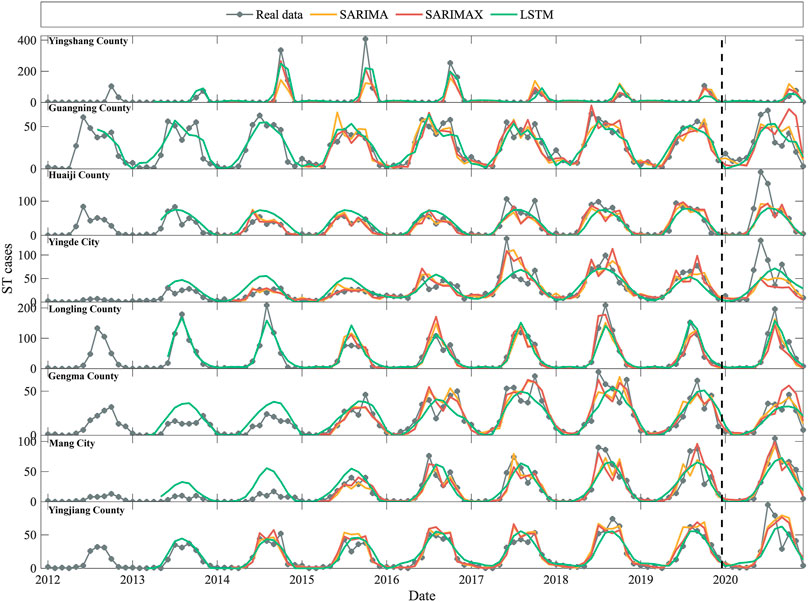
FIGURE 3. ST fitting and forecasting results by SARIMA, SARIMAX, and LSTM at eight counties of China. The vertical dash line separated the model fitting and forecasting parts.
Although the performance of the three time-series forecasting methods varied between counties at both the model fitting stage and the model forecasting stage, the methodological comparisons among SARIMA, SARIMAX, and LSTM should be discussed as follows: 1) continuous series modeling was the core concept of the three methods, i.e., the previous conditions can be used to forecast the current or future conditions; furthermore, the SARIMA and SARIMAX models took a step ahead that included seasonal or cyclic parts in modeling, i.e., the seasonal auto regression part and seasonal moving average part with the cycle of 12 months. Similarly, the similar SARIMA model was employed for modeling the ST series at Laiwu city and Shandong province, China (Ding et al., 2012a; Yang et al., 2015). On the other hand, LSTM also borrows the continuous characteristics of ST series for forecasting. Compared to the standard artificial neural network (ANN), the forget gate was utilized to remove the information with larger lags, which is similar to the memory of humans that one can remember the recent things but will forget some of the things that occurred long time ago (Yu et al., 2019). In the current work, we have demonstrated that the length of the time-series data used to forecast ST varies between high-risk counties being 12 months in five counties, 11, 10, and 3 months in the other three counties. These results indicate that ST has predominantly an annual cycle, which is in line with the literature that 8–12 months is the general cycle of ST in Guangzhou city, China (Wei et al., 2017). 2) Previous studies have used a number of regression techniques to unravel the ST temporal variation in incidence, and its associations with environmental factors using the spatial Poisson regression model, negative binomial regression model, MaxEnt, random forest, and ANN models (Wardrop et al., 2013; Li et al., 2014; Yang et al., 2014; Kwak et al., 2015; Seto et al., 2017; Yu et al., 2018; Acharya et al., 2019). However, these models cannot capture the seasonal characteristics of ST incidence, which can be overcome by the SARIMAX model that can simultaneously depict the seasonal characteristics and the effects of exogenous factors. Given the complex and often nonlinear interplay between ST factors and ST infection (Elliott et al., 2019), the linear regression component of the SARIMAX model may not be sufficient for modeling and forecasting ST incidence. The LSTM model offers a self-organizing, self-learning, and highly nonlinearity system from the ANN, and thus, it is rather suitable for modeling the ecological system of ST. In view of its model structure, the LSTM was initially postulated as the optimal model among the three methods. However, our results indicate that LSTM not always outperforms SARIMA or SARIMAX indicating that the selection of methods for ST series modeling and forecasting should be carefully considered through model comparison and validation to local conditions.
Another outcome of the current work is the determination of environmental factors in each of the considered eight counties associated with ST cases using SARIMAX models. Including these factors (i.e., exogenous variables mentioned above), the SARIMAX showed better performance than SARIMA at the modeling fitting stage (Table 1), demonstrating that the considered factors were significantly associated with ST variations. Temperature with various temporal lags was found to be positively related to ST variations at Yingde city, Longling County, Mang city, and Yingjiang County, which is in line with the ecological niche modeling of ST in the literature that temperature was found to be the key factor in determining ST occurrence (Yu et al., 2018). A previous study found that the sunshine duration was negatively and positively associated with ST with 1–3 month lags and 4–6 month lags, respectively (Yang et al., 2014). Similar findings can be found in the current study, i.e., sunshine duration with 3-, 2-, and 1-month lags were negatively associated with the ST variations at Yingshang County, Guangning County, and Gengma County, respectively, but the sunshine duration with 0-month lag showed positive relationship with ST at Yingjiang County. Warming the environment promotes the growth of vector larvae and rodents and increased exposure opportunities due to people wearing shorter clothes (Yao et al., 2019). The other study found that the ST case was positively correlated with the duration of sunshine, suggesting an occupational exposure where people possibly have longer time for agricultural field work, leading to an increased probability of exposure (Li et al., 2014). Besides, relative humidity and pressure were supposed to be key factors that influenced the regeneration of the rodents, i.e., a 1–2 month lag effects of relative humidity and pressure were closely related to the ST variation (Sun et al., 2017), which is similar to the findings of the results at Yingshang County, Guangning County, Huaiji County, Longling County, and Gengma County. In our study, we considered the wind speed in our SARIMAX models with 1-, 2-, 3-, 5-month lag since it can be a factor associated with the spawning conditions of mites (Kwak et al., 2015). Indeed, we found that wind speed was a contributor to ST variation at four counties of the current study, especially in Yingde city. Finally, our results indicate a significant effect of the multivariate ENSO index on the time series of ST cases in three of the eight counties investigated (i.e., Yingshang County, Guangning County, and Mang city). This is in line with other studies that found an association between ST incidence and the ENSO Index which is regarded as a global pattern of climatic oscillation affecting the local environment and thus human population behaviors (Wei et al., 2017).
Machine learning techniques have become popular in modeling nonlinear systems, including in the field of public health (dos Santos et al., 2019; Panch et al., 2018), by providing precise predictive models (Passos et al., 2016). Introduction of LSTM has enriched the ability of local public health authorities in ST high-risk areas to anticipate and respond to ST outbreaks. The proposed models, such as SARIMAX and LSTM, can be used locally in high-risk ST counties for ST early warning and precise ST forecasting programs; it can also enable local public health managers to monitor the variation of the environmental factors and deploy public health measures, such as health promotion alerts to the communities to prevent large ST outbreaks.
Certain limitations of the current work should be mentioned. First, due to lack of a longer time series of ST series data, this study only utilized a 96-month time series for model fitting, which may have hindered the performance of LSTM models; it may be the reason why LSTM showed low accuracy in ST estimation. Second, this study explored the basic LSTM model in structure and did not explore modeling combinations that considered SARIMAX + LSTM, which can also give accuracy predictions (Sheng and Jia, 2020); hence, future studies should explore the possibility of this combination for ST forecasting. Third, our SARIMAX models did not consider socioeconomic factors (including the gross domestic product, income, urbanization, population density, educational institutions, land use and land change, and medical institution), which may also play a role in the variations of ST (Ranjan and Prakash, 2018). Finally, although it is reported the warming condition might favor the reproduction of mites and increase the probability of human infection, the mechanism between the global climate change and ST outbreaks is still unclear (Jeung et al., 2016; Kuo et al., 2015); given the short-term impact of temperature mentioned in previous subsection, the long-term impact of global climate change (such as the warming condition) on ST outbreaks and its feasibility in forecasting ST outbreaks are worthy to explore in the future (Zhou et al., 2021); furthermore, the hydrology impact of climate change on ST variations will be another topic for consideration (Zhou et al., 2018).
In the current study, SARIMA, SARIMAX, and LSTM models were employed to model the temporal variation of ST cases in high-risk communities in China. The results indicated that annual dynamics of ST vary significantly between the eight studied counties; with exogenous variables, the SARIMAX and LSTM models showed better performance than SARIMA models. Specifically, precipitation, atmospheric pressure, relative humidity, mean temperature, sunshine duration, wind speed, NDVI, and MEI were found to be partly associated with the time series of ST cases. The models and findings of the current study will support the development of local early warning systems for ST in the high-risk areas in China.
The data analyzed in this study are subject to the following licenses/restrictions: Patient data are protected by the China CDC and are unsuitable for public sharing. The scrub typhus data are not allowed to be publicly shared due to the local infection disease law Requests to access these datasets should be directed to ZGF0YUBjaGluYWNkYy5jbg==.
JH and WZ contributed to conception and design of the study. WZ, WY, YW, and QQ organized the database. JH performed the statistical analysis. JH wrote the first draft of the manuscript. All authors contributed to manuscript revision, read, edit, and approved the submitted version.
This work is partly supported by the China Postdoctoral Science Foundation (2020M681825) and the projects from the 13th Five-Year Plan (Nos.18QNP063 and 17SAZ01).
The authors declare that the research was conducted in the absence of any commercial or financial relationships that could be construed as a potential conflict of interest.
All claims expressed in this article are solely those of the authors and do not necessarily represent those of their affiliated organizations, or those of the publisher, the editors, and the reviewers. Any product that may be evaluated in this article, or claim that may be made by its manufacturer, is not guaranteed or endorsed by the publisher.
The Supplementary Material for this article can be found online at: https://www.frontiersin.org/articles/10.3389/fenvs.2021.783864/full#supplementary-material
Acharya, B., Chen, W., Ruan, Z., Pant, G., Yang, Y., Shah, L., et al. (2019). Mapping Environmental Suitability of Scrub Typhus in Nepal Using MaxEnt and Random Forest Models. Int. J. Env. Res. Public Health 16, 4845. doi:10.3390/ijerph16234845
Carvajal, T. M., Viacrusis, K. M., Hernandez, L. F. T., Ho, H. T., Amalin, D. M., and Watanabe, K. (2018). Machine Learning Methods Reveal the Temporal Pattern of Dengue Incidence Using Meteorological Factors in Metropolitan Manila, Philippines. BMC Infect. Dis. 18, 183. doi:10.1186/s12879-018-3066-0
Chimmula, V. K. R., and Zhang, L. (2020). Time Series Forecasting of COVID-19 Transmission in Canada Using LSTM Networks. Chaos, Solitons & Fractals 135, 109864. doi:10.1016/j.chaos.2020.109864
Chrispal, A., Boorugu, H., Gopinath, K. G., Prakash, J. A. J., Chandy, S., Abraham, O. C., et al. (2010). Scrub Typhus: an Unrecognized Threat in South India - Clinical Profile and Predictors of Mortality. Trop. Doct 40, 129–133. doi:10.1258/td.2010.090452
Ding, L., Ding, S. J., Zhang, M., Wang, X. J., Li, Z., and Zhao, Z. T. (2012a). Study on the Characteristics of Temporal Distribution and the Epidemic Trend of Autumn-winter Type Scrub Typhus under Time Series Analysis. Zhonghua Liu Xing Bing Xue Za Zhi 33, 698–701.
Ding, L., Li, Z., Wang, X. J., Ding, S. J., Zhang, M., and Zhao, Z. T. (2012b). Analysis of Epidemic Features of Scrub Typhus between Year 2006 and 2010 in Shandong Province, China. Zhonghua Yu Fang Yi Xue Za Zhi 46, 338–342.
DiPietro, R., and Hager, G. D. (2020). “Chapter 21 - Deep Learning: RNNs and LSTM,” in Handbook of Medical Image Computing and Computer Assisted Intervention, The Elsevier and MICCAI Society Book Series. Editors S.K. Zhou, D. Rueckert, and G. Fichtinger (Amsterdam: Academic Press), 503–519. doi:10.1016/B978-0-12-816176-0.00026-0
dos Santos, B. S., Steiner, M. T. A., Fenerich, A. T., and Lima, R. H. P. (2019). Data Mining and Machine Learning Techniques Applied to Public Health Problems: A Bibliometric Analysis from 2009 to 2018. Comput. Ind. Eng. 138, 106120. doi:10.1016/j.cie.2019.106120
Elliott, I., Pearson, I., Dahal, P., Thomas, N. V., Roberts, T., and Newton, P. N. (2019). Scrub Typhus Ecology: A Systematic Review of Orientia in Vectors and Hosts. Parasites Vectors 12, 513. doi:10.1186/s13071-019-3751-x
Fouladgar, N., and Främling, K. (2020). A Novel LSTM for Multivariate Time Series with Massive Missingness. Sensors 20, 2832. doi:10.3390/s20102832
Gonzalez, J., and Yu, W. (2018). Non-Linear System Modeling Using LSTM Neural Networks. IFAC-PapersOnLine 51, 485–489. doi:10.1016/j.ifacol.2018.07.326
He, J., Christakos, G., Wu, J., Cazelles, B., Qian, Q., Mu, D., et al. (2018a). Spatiotemporal Variation of the Association between Climate Dynamics and HFRS Outbreaks in Eastern China during 2005-2016 and its Geographic Determinants. Plos Negl. Trop. Dis. 12, e0006554. doi:10.1371/journal.pntd.0006554
He, J., Yin, W., He, J., Han, Z., Teng, Y., and Zhang, W. (2018b). Environmental Determinants of Hemorrhagic Fever with Renal Syndrome in High-Risk Counties in China: A Time Series Analysis (2002-2012). Am. J. Trop. Med. Hyg. 99, 1262–1268. doi:10.4269/ajtmh.18-0544
Jeung, Y. S., Kim, S.-W., Kim, D.-M., Yun, N. R., Han, M. A., and Kim, C.-M. (2016). Effect of Latitude and Seasonal Variation on Scrub Typhus, South Korea, 2001-2013. Am. J. Trop. Med. Hyg. 94, 22–25. doi:10.4269/ajtmh.15-0474
Kim, T.-Y., and Cho, S.-B. (2019). Predicting Residential Energy Consumption Using CNN-LSTM Neural Networks. Energy 182, 72–81. doi:10.1016/j.energy.2019.05.230
Kim, H. C., Lee, I. Y., Chong, S. T., Richards, A. L., Gu, S. H., Song, J.-W., et al. (2010). Serosurveillance of Scrub Typhus in Small Mammals Collected from Military Training Sites Near the DMZ, Northern Gyeonggi-Do, Korea, and Analysis of the Relative Abundance of Chiggers from Mammals Examined. Korean J. Parasitol. 48, 237–243. doi:10.3347/kjp.2010.48.3.237
Kuo, C.-C., Huang, J.-L., Ko, C.-Y., Lee, P.-F., and Wang, H.-C. (2011). Spatial Analysis of Scrub Typhus Infection and its Association with Environmental and Socioeconomic Factors in Taiwan. Acta Tropica 120, 52–58. doi:10.1016/j.actatropica.2011.05.018
Kuo, C.-C., Lee, P.-L., Chen, C.-H., and Wang, H.-C. (2015). Surveillance of Potential Hosts and Vectors of Scrub Typhus in Taiwan. Parasites Vectors 8, 611. doi:10.1186/s13071-015-1221-7
Kwak, J., Kim, S., Kim, G., Singh, V., Hong, S., and Kim, H. (2015). Scrub Typhus Incidence Modeling with Meteorological Factors in South Korea. Int. J. Env. Res. Public Health 12, 7254–7273. doi:10.3390/ijerph120707254
Li, T., Yang, Z., Dong, Z., and Wang, M. (2014). Meteorological Factors and Risk of Scrub Typhus in Guangzhou, Southern China, 2006-2012. BMC Infect. Dis. 14, 139. doi:10.1186/1471-2334-14-139
Li, Z., Xin, H., Sun, J., Lai, S., Zeng, L., Zheng, C., et al. (2020). Epidemiologic Changes of Scrub Typhus in China, 1952-2016. Emerg. Infect. Dis. 26, 1091–1101. doi:10.3201/eid2606.191168
O'Guinn, M. L., Klein, T. A., Lee, J. S., Richards, A. L., Kim, H.-C., Ha, S. J., et al. (2010). Serological Surveillance of Scrub Typhus, Murine Typhus, and Leptospirosis in Small Mammals Captured at Firing Points 10 and 60, Gyeonggi Province, Republic of Korea, 2001-2005. Vector-Borne Zoonotic Dis. 10, 125–133. doi:10.1089/vbz.2008.0123
Panch, T., Szolovits, P., and Atun, R. (2018). Artificial Intelligence, Machine Learning and Health Systems. J. Glob. Health 8, 020303. doi:10.7189/jogh.08.020303
Park, J. (2016). Recent Outbreak of Scrub Typhus in North Western Part of India. Indian J. Med. Microbiol. 34, 114. doi:10.4103/0255-0857.167682
Passos, I. C., Mwangi, B., and Kapczinski, F. (2016). Big Data Analytics and Machine Learning: 2015 and Beyond. The Lancet Psychiatry 3, 13–15. doi:10.1016/s2215-0366(15)00549-0
Premaratna, R., Chandrasena, T. G. A. N., Dassayake, A. S., Loftis, A. D., Dasch, G. A., and de Silva, H. J. (2006). Acute Hearing Loss Due to Scrub Typhus: A Forgotten Complication of a Reemerging Disease. Clin. Infect. Dis. 42, e6–8. doi:10.1086/498747
Ranjan, J., and Prakash, J. A. J. (2018). Scrub Typhus Re-Emergence in India: Contributing Factors and Way Forward. Med. Hypotheses 115, 61–64. doi:10.1016/j.mehy.2018.03.019
Rodkvamtook, W., Kuttasingkee, N., Linsuwanon, P., Sudsawat, Y., Richards, A. L., Somsri, M., et al. (2018). Scrub Typhus Outbreak in Chonburi Province, Central Thailand, 2013. Emerg. Infect. Dis. 24, 361–365. doi:10.3201/eid2402.171172
Sames, W. J., Klein, T. A., Kim, H. C., Gu, S. H., Kang, H. J., Shim, S. H., et al. (2010). Serological Surveillance of Scrub Typhus, Murine Typhus, and Leptospirosis in Small Mammals Captured at Twin Bridges Training Area, Gyeonggi Province, Republic of Korea, 2005-2007. Mil. Med. 175, 48–54. doi:10.7205/milmed-d-05-01308
Seto, J., Suzuki, Y., Nakao, R., Otani, K., Yahagi, K., and Mizuta, K. (2017). Meteorological Factors Affecting Scrub Typhus Occurrence: A Retrospective Study of Yamagata Prefecture, Japan, 1984-2014. Epidemiol. Infect. 145, 462–470. doi:10.1017/S0950268816002430
Sheng, F., and Jia, L. (2020). “Short-Term Load Forecasting Based on SARIMAX-LSTM,” in 2020 5th International Conference on Power and Renewable Energy (ICPRE). Presented at the 2020 5th International Conference on Power and Renewable Energy (ICPRE), Shanghai, China, September 12–14, 2020, 90–94. doi:10.1109/ICPRE51194.2020.9233117
Sherstinsky, A. (2020). Fundamentals of Recurrent Neural Network (RNN) and Long Short-Term Memory (LSTM) Network. Physica D: Nonlinear Phenomena 404, 132306. doi:10.1016/j.physd.2019.132306
Sun, Y., Wei, Y.-H., Yang, Y., Ma, Y., de Vlas, S. J., Yao, H.-W., et al. (2017). Rapid Increase of Scrub Typhus Incidence in Guangzhou, Southern China, 2006―2014. BMC Infect. Dis. 17, 13. doi:10.1186/s12879-016-2153-3
Tsai, P.-J., and Yeh, H.-C. (2013). Scrub Typhus Islands in the Taiwan Area and the Association between Scrub Typhus Disease and forest Land Use and Farmer Population Density: Geographically Weighted Regression. BMC Infect. Dis. 13, 191. doi:10.1186/1471-2334-13-191
Wan, R., Mei, S., Wang, J., Liu, M., and Yang, F. (2019). Multivariate Temporal Convolutional Network: A Deep Neural Networks Approach for Multivariate Time Series Forecasting. Electronics 8, 876. doi:10.3390/electronics8080876
Wardrop, N. A., Kuo, C.-C., Wang, H.-C., Clements, A. C. A., Lee, P.-F., and Atkinson, P. M. (2013). Bayesian Spatial Modelling and the Significance of Agricultural Land Use to Scrub Typhus Infection in Taiwan. Geospat Health 8, 229–239. doi:10.4081/gh.2013.69
Wei, Y., Huang, Y., Li, X., Ma, Y., Tao, X., Wu, X., et al. (2017). Climate Variability, Animal Reservoir and Transmission of Scrub Typhus in Southern China. Plos Negl. Trop. Dis. 11, e0005447. doi:10.1371/journal.pntd.0005447
Yang, L. P., Liu, J., Wang, X. J., Ma, W., Jia, C. X., and Jiang, B. F. (2014). Effects of Meteorological Factors on Scrub Typhus in a Temperate Region of China. Epidemiol. Infect. 142, 2217–2226. doi:10.1017/S0950268813003208
Yang, L.-P., Liang, S.-Y., Wang, X.-J., Li, X.-J., Wu, Y.-L., and Ma, W. (2015). Burden of Disease Measured by Disability-Adjusted Life Years and a Disease Forecasting Time Series Model of Scrub Typhus in Laiwu, China. Plos Negl. Trop. Dis. 9, e3420. doi:10.1371/journal.pntd.0003420
Yao, H., Wang, Y., Mi, X., Sun, Y., Liu, K., Li, X., et al. (2019). The Scrub Typhus in mainland China: Spatiotemporal Expansion and Risk Prediction Underpinned by Complex Factors. Emerg. Microbes Infect. 8, 909–919. doi:10.1080/22221751.2019.1631719
Yu, H., Sun, C., Liu, W., Li, Z., Tan, Z., Wang, X., et al. (2018). Scrub Typhus in Jiangsu Province, China: Epidemiologic Features and Spatial Risk Analysis. BMC Infect. Dis. 18, 372. doi:10.1186/s12879-018-3271-x
Yu, Y., Si, X., Hu, C., and Zhang, J. (2019). A Review of Recurrent Neural Networks: LSTM Cells and Network Architectures. Neural Comput. 31, 1235–1270. doi:10.1162/neco_a_01199
Zhang, S., Song, H., Liu, Y., Li, Q., Wang, Y., Wu, J., et al. (2010). Scrub Typhus in Previously Unrecognized Areas of Endemicity in China. J. Clin. Microbiol. 48, 1241–1244. doi:10.1128/JCM.01784-09
Zhang, M., Wang, X.-J., Ding, L., Zhao, Z.-T., Li, Z., and Ding, S.-J. (2012). Scrub Typhus: Surveillance, Clinical Profile and Diagnostic Issues in Shandong, China. Am. J. Trop. Med. Hyg. 87, 1099–1104. doi:10.4269/ajtmh.2012.12-0306
Zhang, W.-Y., Wang, L.-Y., Ding, F., Hu, W.-B., Soares Magalhaes, R. J., Sun, H.-L., et al. (2013). Scrub Typhus in Mainland China, 2006-2012: The Need for Targeted Public Health Interventions. Plos Negl. Trop. Dis. 7, e2493. doi:10.1371/journal.pntd.0002493
Zheng, C., Jiang, D., Ding, F., Fu, J., and Hao, M. (2019). Spatiotemporal Patterns and Risk Factors for Scrub Typhus from 2007 to 2017 in Southern China. Clin. Infect. Dis. 69, 1205–1211. doi:10.1093/cid/ciy1050
Zhou, X., Huang, G., Piwowar, J., Fan, Y., Wang, X., Li, Z., et al. (2018). Hydrologic Impacts of Ensemble-RCM-Projected Climate Changes in the Athabasca River Basin, Canada. J. Hydrometeorol. 19, 1953–1971. doi:10.1175/jhm-d-17-0232.1
Keywords: scrub typhus, time-series modeling, SARIMAX model, LSTM model, China, environmental factors, SARIMA model
Citation: He J, Wei X, Yin W, Wang Y, Qian Q, Sun H, Xu Y, Soares Magalhaes RJ, Guo Y and Zhang W (2022) Forecasting Scrub Typhus Cases in Eight High-Risk Counties in China: Evaluation of Time-Series Model Performance. Front. Environ. Sci. 9:783864. doi: 10.3389/fenvs.2021.783864
Received: 27 September 2021; Accepted: 13 December 2021;
Published: 12 January 2022.
Edited by:
Sen Li, Huazhong University of Science and Technology, ChinaReviewed by:
Olusegun Steven Ayodele Oluwole, University of Ibadan, NigeriaCopyright © 2022 He, Wei, Yin, Wang, Qian, Sun, Xu, Soares Magalhaes, Guo and Zhang. This is an open-access article distributed under the terms of the Creative Commons Attribution License (CC BY). The use, distribution or reproduction in other forums is permitted, provided the original author(s) and the copyright owner(s) are credited and that the original publication in this journal is cited, in accordance with accepted academic practice. No use, distribution or reproduction is permitted which does not comply with these terms.
*Correspondence: Wenyi Zhang, end5MDQxOUAxMjYuY29t
Disclaimer: All claims expressed in this article are solely those of the authors and do not necessarily represent those of their affiliated organizations, or those of the publisher, the editors and the reviewers. Any product that may be evaluated in this article or claim that may be made by its manufacturer is not guaranteed or endorsed by the publisher.
Research integrity at Frontiers
Learn more about the work of our research integrity team to safeguard the quality of each article we publish.