 Min Xie
 Chenchao Zhan1
- 1School of Atmospheric Sciences, Nanjing University, Nanjing, China
- 2School of the Environment, Nanjing University, Nanjing, China
- 3State Environmental Protection Key Laboratory of Atmospheric Physical Modeling and Pollution Control, Nanjing, China
- 4Jiangsu Provincial Academy of Environmental Science, Nanjing, China
This paper investigates the spatiotemporal variability of air stagnation in summer as well as its relation to summer ozone (O3) over the Yangtze River Delta (YRD) region of China. Air stagnation days (ASDs) in the YRD during the summers from 2001 to 2017 range from 9 to 54 days (9.2–58.4% of the entire summer days). With the empirical orthogonal function (EOF) analysis, the dominant weather systems affecting air stagnation in the YRD are illustrated. The first three EOFs explain 68.8, 11.3, and 7.1% of the total variance of ASDs, respectively. The first EOF represents the same phase of the entire YRD, which is attributed to the East Asian summer monsoon and mainly depends on the area and the intensity of the South China Sea subtropical high. The second EOF shows significant maritime-continental contrasts, which is related to stronger near-surface winds on sea. As for the third EOF, the air stagnation in the north and the south of the YRD has the opposite phase, with a dividing line along approximately 31°N. This spatial pattern depends on the area and the intensity of the northern hemisphere polar vortex that affects the meridional circulation. O3 is the typical air pollutant in hot seasons in the YRD. It is generally at a high pollution level in summer, and has a positive trend from 2013 to 2017. Air stagnation can affect O3 pollution levels in the YRD. In ASDs, there are usually weak wind, less precipitation, low relative humidity, high temperature, strong solar radiation and high surface pressure, which are favorable to the formation of O3. More O3 pollution episodes in 2013 than 2015 can be partly attributed to more ASDs in 2013. These results show that stagnant meteorological state can lead to the hazardous air quality, and provide valuable insight into the effect of air stagnation on the changes in surface O3 during hot months.
Introduction
Air stagnation is usually described as the stable weather condition with less rainfalls and weak winds in the lower to mid troposphere (Garrido-Perez et al., 2018; Li et al., 2019). Weak winds indicate a stable atmospheric stratification with reduced advection and dispersion. Less precipitation means that the wet scavenging process is minimal. It has been revealed that this kind of stagnant weather condition can elevate O3 or PM2.5 concentrations, and thereby deteriorate air quality on daily to inter-annual timescales (Wang and Angell, 1999; Jacob and Winner 2009; Horton et al., 2012, Horton et al., 2014; Schnell and Prather, 2017; Garrido-Perez et al., 2018, 2019). Consequently, air stagnation has significant environmental and health effects (Kerr and Waugh, 2018).
As is well known, China is facing serious air quality deterioration along with the fast economic growth and rapid urban expansion (Chan and Yao, 2008; Ma et al., 2012; Xie et al., 2014; Wang et al., 2017; Zhu, 2017; Wu et al., 2020; Hu et al., 2021). In and around the megacities, poor air quality is usually caused by high emissions and adverse meteorological conditions characterized by light wind and less precipitation (Chan and Yao, 2008; Ma et al., 2012; Li et al., 2017; Wang et al., 2017; Xie et al., 2017; Xu et al., 2018; Shen et al., 2021; Wang et al., 2021). In recent years, under the very strict emission control strategies implemented by the Chinese government, the effects of meteorological conditions on air pollution have attracted more attention and interest from researchers, especially in the Beijing-Tianjin-Hebei (BTH) region (Xu et al., 2011; Zhang et al., 2016), the Yangtze River Delta (YRD) region (Shu et al., 2016, 2017; Xie et al., 2016a, 2016b; Gao et al., 2020, 2021; Zhan et al., 2020, 2021), the Pearl River Delta (PRD) region (Xie et al., 2016c; Zhu et al., 2017) and the Sichuan Basin (Zhan et al., 2019; Yang et al., 2020, 2021). Previous investigations have found that air quality can be worse under stagnant weather conditions. Moreover, Huang et al. (2017) revealed that there was a nationwide increasing trend of air stagnation occurrence in China from 1985 to 2014. Li et al. (2019) also reported that urbanization contributed to air stagnation in Shenzhen (a metropolitan city of the PRD). Therefore, how and to what extent air quality deterioration relates to air stagnation need to be further investigated in the city cluster areas of China.
The YRD region is one of the most developed city clusters in the world. It is located in the eastern coast areas of China (Figure 1A). O3 pollution is the typical atmospheric environment problem in this region, with a positive trend in O3 concentration in recent years (Li et al., 2011; Ding et al., 2016; Xu et al., 2018). In previous studies, it was found that high O3 events generally occur in hot and dry seasons, and are usually related to strong photochemical reactions and high air temperature (Chan and Yao, 2008; Li et al., 2011; Ma et al., 2012; Ding et al., 2013, 2016; Xie et al., 2016b; Hu et al., 2016; Pu et al., 2017; Wang et al., 2017; Gao et al., 2021; Zhan et al., 2021). The subtropical high also have significant impacts on O3 concentrations (Shu et al., 2016; Gao et al., 2020; Zhan et al., 2020). Numerous current projections also suggested that O3 pollution in the YRD is likely to worsen in the future due to the changes in weather conditions, such as the increase of air temperature and the decrease in precipitation (Wang et al., 2013; Xie et al., 2017), which can increase air stagnation as well. Therefore, it is necessary to study air stagnation and its impacts on summertime O3 in the YRD. Though some researchers found that air stagnation should not directly used as an index to assess meteorological or climatic effects on air quality without proper assessments, they still pointed out that O3 pollution and air stagnation can co-occur with greater correlations in some areas (Kerr and Waugh, 2018; Garrido-Perez et al., 2019). Consequently, to study this issue in the YRD can help to evaluate the role of air stagnation in this high polluted region.
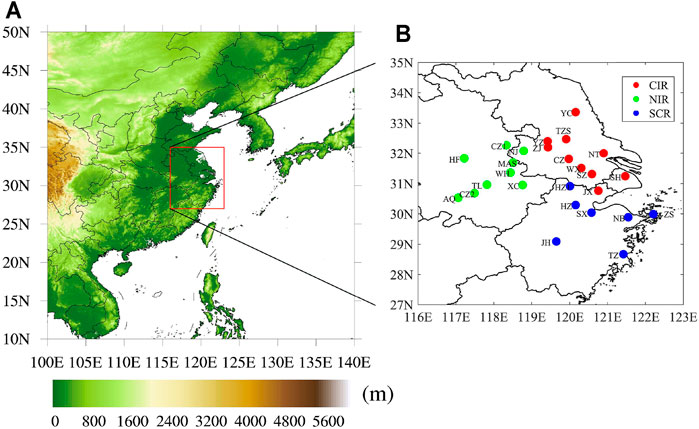
FIGURE 1. The geographic information of the YRD region, including (A) its location in China with terrain elevation data and (B) the 26 typical YRD cities. In (B), the cities include Nanjing (NJ), Wuxi (WX), Changzhou (CZ), Suzhou (SZ), Nantong (NT), Yancheng (YC), Yangzhou (YZ), Zhenjiang (ZJ), Taizhoushi (TZS), Hangzhou (HZ), Ningbo (NB), Jiaxing (JX), Huzhou (HZ1), Shaoxing (SX), Jinhua (JH), Zhoushan (ZS), Taizhou (TZ), Hefei (HF), Wuhu (WH), Maanshan (MAS), Tongling (TL), Anqing (AQ), Chuzhou (CZ1), Chizhou (CZ2), Xuancheng (XC) and Shanghai (SH). CIR, NIR and SCR respectively represent the cities in the Central Inland, the Northwest Inland and the Southeast Coastal Region, which are discussed in Spatiotemporal Distribution of O3 Section in details.
The main purpose of this study is to investigate the regional characteristic of air stagnation and its influence on summertime O3 in the YRD, including 1) the inter-annual variation of air stagnation in summer over the YRD, 2) the dominant weather systems and the corresponding meteorological factors related to air stagnation, 3) the spatiotemporal distribution of summertime O3 in the YRD and the relations to air stagnation, and 4) the meteorological mechanism of air stagnation impacting O3 pollution. In the following, the data and the detailed analytical methods used in this study are presented in Data and Methods Section. Results and Discussions Section gives the main findings. A brief summary is shown in Conclusion Section.
Data and Methods
Meteorological Data
Air stagnation in the YRD are calculated based on meteorological data from 2001 to 2017. The data include precipitation, 500 hPa winds, 10 m winds, 2 m temperature, relative humidity, surface pressure and solar radiation. As for precipitation, the TRMM 3B42 data (https://pmm.nasa.gov/data-access/downloads/trmm) are used. TRMM 3B42 products are an estimate of precipitation rate based on the combined instrument rain calibration algorithm, with a temporal resolution of 3 h and a spatial resolution of 0.25° (Huffman et al., 2001; Mao and Wu, 2012). These data have been widely used in China in the field of meteorology, hydrology and water resources management (Sun et al., 2012; Zhang et al., 2013). For solar radiation, the monthly data from 2000 to 2017 over China provided by Feng and Wang (2021) are adopted. This dataset has the spatial resolution of 0.1°. It was generated by the geographically weighted regression method to merge the sunshine-duration-derived solar radiation data with the satellite-derived cloud fraction data (MODAL2 M CLD) and aerosol optical depth data (CERES SYN AOD). The data for other meteorological factors are obtained from the daily ERA datasets provided by European Center for Medium-Range Weather Forecasts (ECMWF) (Dee et al., 2011). The datasets have the spatial resolution of 0.25°. They are widely used and have a good application in China as well (Bao and Zhang, 2013; Wang et al., 2015).
Ozone Observation Data
To illustrate the overview of summertime O3 in the YRD, the air quality monitoring data in the typical YRD cities from 2013 to 2017 are used. The data are acquired from the national air quality real-time publishing platform (http://106.37.208.233:20035), which provides hourly concentrations of six air pollutants (PM2.5, PM10, SO2, NO2, O3, and CO) over China. These data are strictly in accordance with the national monitoring regulations. The hourly values for each city are calculated by averaging the concentrations at all national monitoring sites in that city. Identification and handling of invalid and lacking data are also manually performed during data processing, following the methods adopted in some previous studies (Xie et al., 2016b; Shu et al., 2016; Gao et al., 2020, 2021; Zhan et al., 2020, 2021). The YRD region consists of 26 typical cities. As shown in Figure 1B, the cities include Shanghai (SH); Nanjing (NJ), Wuxi (WX), Changzhou (CZ), Suzhou (SZ), Nantong (NT), Yancheng (YC), Yangzhou (YZ), Zhenjiang (ZJ), Taizhoushi (TZS) in Jiangsu province; Hangzhou (HZ), Ningbo (NB), Jiaxing (JX), Huzhou (HZ1), Shaoxing (SX), Jinhua (JH), Zhoushan (ZS), Taizhou (TZ) in Zhejiang province; and Hefei (HF), Wuhu (WH), Maanshan (MAS), Tongling (TL), Anqing (AQ), Chuzhou (CZ1), Chizhou (CZ2) and Xuancheng (XC) in Anhui province.
Air Stagnation Day, ASDs, and Sn
Air stagnation is usually identified by using predefined thresholds of daily upper level winds, near-surface winds and precipitation (Wang and Angell, 1999; Horton et al., 2012; Horton et al., 2014; Huang et al., 2017; Garrido-Perez et al., 2018, 2019). In this study, based on the previous researches, the used meteorological variables include wind speed at 500 hPa (as upper level wind), 10 m wind speed (as near-surface wind) and precipitation. Thus, a given day can be considered as an air stagnant day when the daily mean 500 hPa wind speed is weaker than 13 m s−1, the daily mean 10 m wind speed is weaker than 3.2 m s−1, and the daily precipitation is less than 1 mm (Wang and Angell, 1999; Horton et al., 2014; Huang et al., 2017). We use ASDs to represent the total number of air stagnation days throughout the summer (June–August).
To study the relation between O3 pollution and air stagnation (Ozone Pollution and its Relation to Air Stagnation Section), Sn is further defined to indicate the air stagnant intensity in a day, given by:
where Ai denotes the threshold of the ith meteorological variable and Bi is the exact daily value of the ith variable. In this study, the value of A1 for wind speed at 500 hPa is set as 13 m s−1, A2 for 10 m wind speed is 3.2 m s−1, and A3 for precipitation is 1 mm. The used meteorological data are described in Meteorological Data Section. Large Sn represents strong air stagnant intensity. Because the spatial resolutions of the data are 0.25°, the values of ASDs and Sn are calculated at each 0.25° grid over the YRD (116–123°E, 27–35°N).
Empirical Orthogonal Function Analysis
The empirical orthogonal function (EOF) analysis has been widely used to split the temporal variance of spatially distributed data into orthogonal spatial patterns called EOFs (Gianelli et al., 2007; Hannachi et al., 2007; Fu et al., 2015). Each EOF has a corresponding eigenvalue, which determines the relative variance contribution to the total variance in the field. Furthermore, the eigenvector, which describes the spatial pattern of the EOFs, is associated with a time series that represents the temporal evolution of that spatial pattern. Most of the variance contribution can be contained into the first few EOFs, which can convey enough information to understand the underlying process. In this study, the NCAR Command Language (NCL) EOF coding package is used. For detailed calculation formulas of EOF as well as the manuals can refer to official website of NCL (https://www.ncl.ucar.edu/Applications/eof.shtml).
To investigate the reasons for the variations of ASDs, the EOFs of ASDs are calculated. Since the time series represent the temporal evolution of its associated spatial pattern, we can effectively obtain the dominant weather systems that affects the spatial pattern by establishing the connection between time series and existing atmospheric circulation indexes (Hannachi et al., 2007; Fu et al., 2015). The atmospheric circulation indexes used in this paper come from 130 climate system monitoring indexes (http://cmdp.ncc-cma.net/Monitoring/cn_index_130.php) issued by the National Climate Center of China. Based on the meteorological reanalysis data, these historical indexes were calculated and provided monthly. Furthermore, we calculate the linear regression coefficients between the time series and the meteorological variables (500 hPa wind speed, 10 m wind speed and precipitation) defined ASD to investigate the specific mechanism. The regression coefficients are equal to the increment of the variables when the time series change by unit 1.
Results and Discussions
Spatiotemporal Variability of Air Stagnation in Summer Over the YRD
Figure 2 gives the spatiotemporal distribution of ASDs in summer over the YRD from 2001 to 2017. The regional average value of summertime ASDs is about 30 days (32.3% of the entire summer days), similarly as found by Huang et al. (2017). There are significant spatial and temporal variations for ASDs. For the inter-annual variation, the regional average value of ASDs ranges from 9 to 54 days (9.2–58.4% of the entire summer days), with the maximum ASDs value in 2010 and the minimum value in 2015. This may be associated with the anomaly of the intensity and position of the western Pacific subtropical high system (discussed in Meteorological Dynamic Mechanism for Air Stagnation Days in Summer of the YRD Section in detail). For the spatial distribution, the values of ASDs on the ocean are usually smaller than those on land for a particular year. In the YRD, ASDs generally show a considerable regional heterogeneity, which is similar with the finding reported by Garrido-Perez et al. (2018) for Europe and Huang et al. (2017) for China.
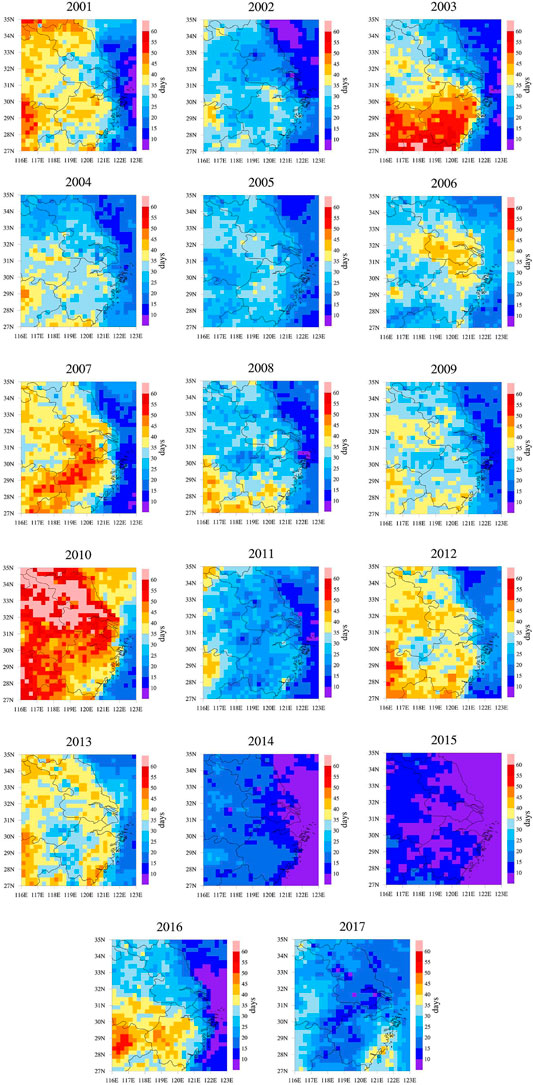
FIGURE 2. The spatiotemporal distribution of summertime air stagnation days over the YRD from 2001 to 2017.
Meteorological Dynamic Mechanism for Air Stagnation Days in Summer of the YRD
EOF analysis of ASDs is carried out to investigate the above spatiotemporal variations. The first three EOFs explain 68.6, 11.3, and 7.1% of the total variations in ASDs, respectively. Figure 3 shows the results for the first EOF (EOF1). As shown in Figure 3A, the spatial pattern of EOF1 is characterized by the same phase over the entire YRD. Figure 3B further illustrates the atmospheric circulation condition causing this consistency. The time series of EOF1 is correlated with the South China Sea subtropical high area index and the South China Sea subtropical high intensity index, with the correlation coefficients of 0.40 and 0.42, respectively (statistically significant at the 90% confidence level), implying that the consistency over the YRD may depend on the area and the intensity of the South China Sea subtropical high. When the South China Sea subtropical high is large and strong, this spatial pattern is usually typical, which means it is likely to appear air stagnation in the YRD. As the main component of the East Asian summer monsoon, the subtropical high acts on the monsoon anomaly through its location, area and intensity, which can directly affect the summertime precipitation, rain belt distribution, and drought/flood anomalies in eastern China (Ding and Chan, 2005). Figures 3C–E illustrate the regression coefficients between the time series of EOF1 and the three meteorological variables used to define ASD. The role of each meteorological variable is different in EOF1. Wind speed at 500 hPa (Figure 3C) and precipitation (Figure 3E) are the main affecting factors. Generally, with the north jump of the subtropical high, its intensity increases and it controls wide areas of eastern China. In this case, the YRD region is dominated by the subtropical high. The weather is usually stable, and the upper and lower wind fields are generally weak (Figures 3C,D). In addition, once the subtropical high is northward, the rain belt generated by the cold and the warm air also moves to north, which can result in less precipitation in midsummer of the YRD as well (Figure 3E). Both weak wind and little precipitation in EOF1 are favorable to cause more air stagnation days.
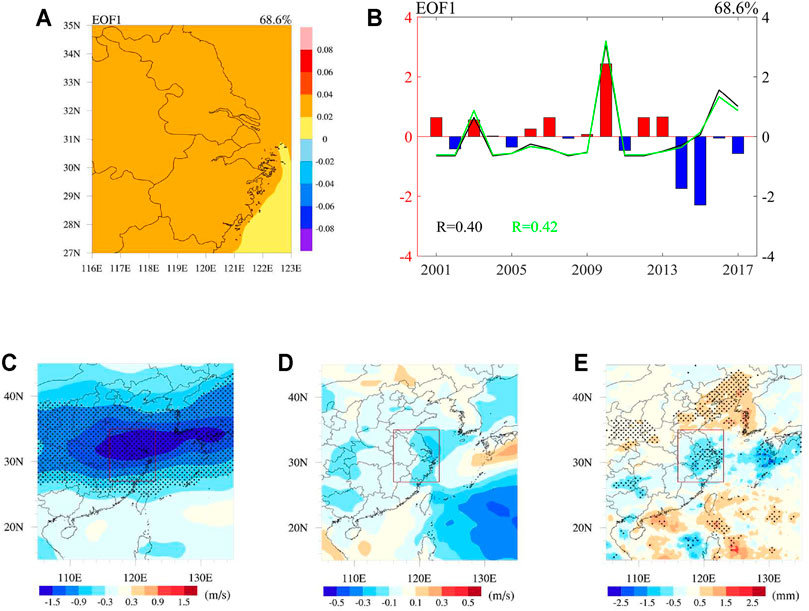
FIGURE 3. The results for the first EOF (EOF1), including (A) the spatial pattern of EOF1, (B) the time series of EOF1 (histogram), the South China Sea subtropical high area index (black solid line) and the South China Sea subtropical high intensity index (green solid line), and the regression coefficients between time series of EOF1 and (C) 500 hPa wind speed, (D) 10 m wind speed, and (E) precipitation. In (B), the indexes are normalized. In (C) to (E), the spotted area passes 90% of the significance test, and the red rectangular region indicates the YRD.
Figure 4 illustrates the results for the second EOF (EOF2). As shown in Figure 4A, the spatial pattern of EOF2 shows significant maritime-continental contrasts, suggesting opposite changes between ocean and land, which can be explained by the fact that the surface wind is usually stronger on sea than on land (Figure 4D). Figure 4B presents that the time series of EOF2 cannot be linked to existing atmospheric circulation indexes. However, as shown in Figure 4C, it can be found that the north of the YRD is affected by the subtropical jet while the south is affected by the easterlies, corresponding to high wind speeds in the north and low in the south of the YRD at the 500 hPa layer. This may be the factor leading to the spatial pattern of EOF2 on land.
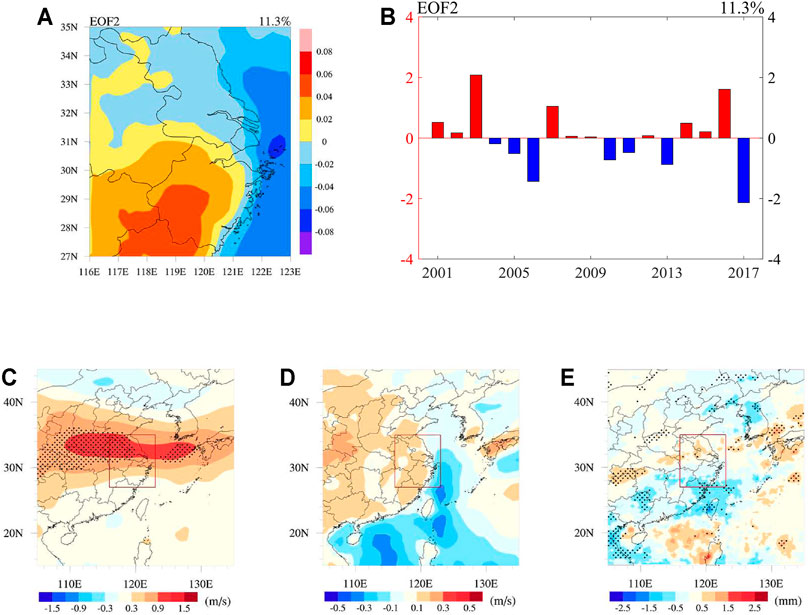
FIGURE 4. The results for the second EOF (EOF2), including (A) the spatial pattern of EOF2, (B) the time series of EOF2 (histogram), and the regression coefficients between time series of EOF2 and (C) 500 hPa wind speed, (D) 10 m wind speed, and (E) precipitation. In (B), the indexes are normalized. In (C) to (E), the spotted area passes 90% of the significance test, and the red rectangular region indicates the YRD.
Figure 5 presents the results for the third EOF (EOF3). With regard to the spatial pattern, the ASDs in the north and the south of the YRD has the opposite phase, with a dividing line of approximately 31°N (Figure 5A). Figure 5B shows that the time series of EOF3 has a good relation to the northern hemisphere polar vortex (the tropospheric polar vortex) area index and the northern hemisphere polar vortex intensity index, with the correlation coefficients of −0.42 and −0.42, respectively (statistically significant at the 90% confidence level). When the northern hemisphere polar vortex is small and weak, the north part of the YRD has high ASDs values while the south has low ones. The specific physical process is probably as follows: with the small and weak tropospheric polar vortex, an abnormal high-pressure center is prone to occur above the mid-high latitudes of Asia, which is conductive to the weakening of the westerly wind at 500 hPa (Figure 5C). The atmospheric circulation shows a meridional distribution and the position of the upper-level jet stream is southward. Thus, the cold air can move southward easily, which can form precipitation in the south of the YRD with the warm and wet flow conveyed by the subtropical high (Figure 5E). For another, the subtropical high is usually strong while the tropospheric polar vortex is weak. The near-surface wind speed is low in the areas dominated by the subtropical high (Figure 5B). The tropospheric polar vortex controls the semi-permanent atmospheric center of action, which has important effects on atmospheric circulation at high latitudes. These effects are usually continuous more than seasonal scales. Furthermore, these effects are commonly expressed by significant atmospheric oscillations in climatology, such as the Northern Atlantic Oscillation, the Arctic Oscillation and the East Atlantic-West Russia Pattern (Waugh et al., 2017), which provides a way to link the variances of air stagnation to climate anomalies.
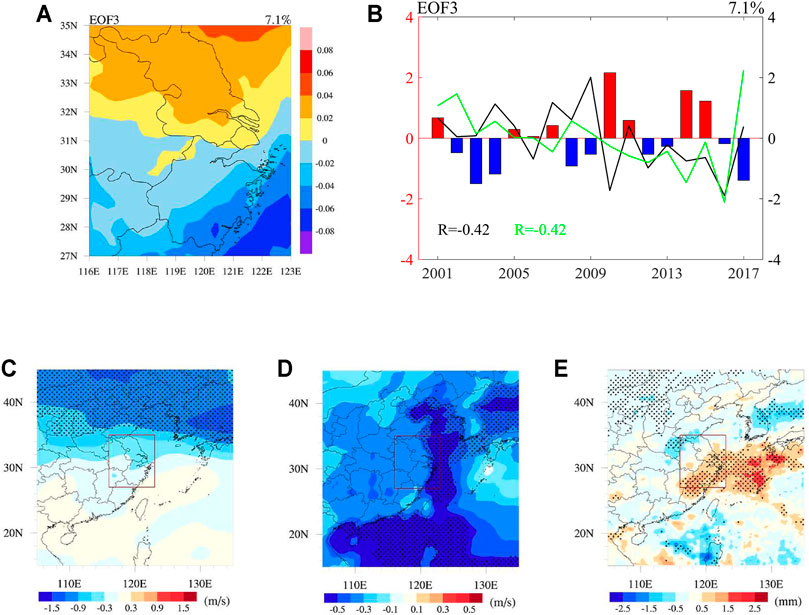
FIGURE 5. The results for the third EOF (EOF3), including (A) the spatial pattern of EOF3, (B) the time series of EOF3 (histogram), the northern hemisphere polar vortex (the tropospheric polar vortex) area index (back solid line) and the northern hemisphere polar vortex intensity index (green solid line), and the regression coefficients between time series of EOF3 and (C) 500 hPa wind speed, (D) 10 m wind speed, and (E) precipitation. In (B), the indexes are normalized. In (C) to (E), the spotted area passes 90% of the significance test, and the red rectangular region indicates the YRD.
Summertime Ozone in the YRD and its Relation to Air Stagnation
Spatiotemporal Distribution of O3
Figure 6 presents the spatiotemporal distribution of MDA8 O3 during the summers from 2013 to 2017 over the YRD. The summer mean values of MDA8 O3 in many cities are over 120 μg m−3. According to the geographical locations and the summer mean MDA8 O3 concentrations, the 26 typical cities in the YRD can be classified into three categories, which are the cities in the Central Inland Region (CIR), the Northwest Inland Region (NIR) and the Southeast Coastal Region (SCR) (Figure 1B). The cities in the CIR include SH, WX, CZ, SZ, NT, YC, YZ, ZJ, TZS, and JX. These cities have the highest O3 concentrations, with the average summer MDA8 O3 of 134.4 μg m−3 in 2017. The cities in the NIR include NJ, HF, WH, MAS, TL, AQ, CZ1, CZ2, and XC. These cities usually have relatively high O3 concentrations, with the average summer MDA8 O3 of 121.3 μg m−3 in 2017. The cities in the SCR include HZ, NB, HZ1, SX, JH, ZS, and TZ. These cities have relatively low O3 concentrations, but still have the average summer MDA8 O3 of 112.0 μg m−3 in 2017. The increasing rates of O3 concentrations in these three regions are also different. Among them, the MDA8 O3 of the cities in the NIR increases the most rapidly, with an average increment of 22.6 μg m−3 a−1 from 2015 to 2017. The cities in the CIR have the second highest increase rate of MDA8 O3, with an average increment of 2.5 μg m−3 a−1. As for those cities in the SCR, the MDA8 O3 almost remains the same, with a small average increment of 0.9 μg m−3 a−1. The YRD is located in a typical monsoon affected region. The summer monsoon can play an important role in the transport and the dilution processes of O3 in the YRD. The strong solar radiation and the high air temperature that are related with subtropical high are the main causes of the high O3 concentration, especially before and after the monsoon rain belt (He et al., 2008; Wang et al., 2011; Zhou et al., 2013; Yin et al., 2019; Jiang et al., 2021). For the low concentration of O3 in the SCR, it associates with clean maritime airflows from the Pacific Ocean driven by the monsoon (Xie et al., 2016b; Shu et al., 2016).
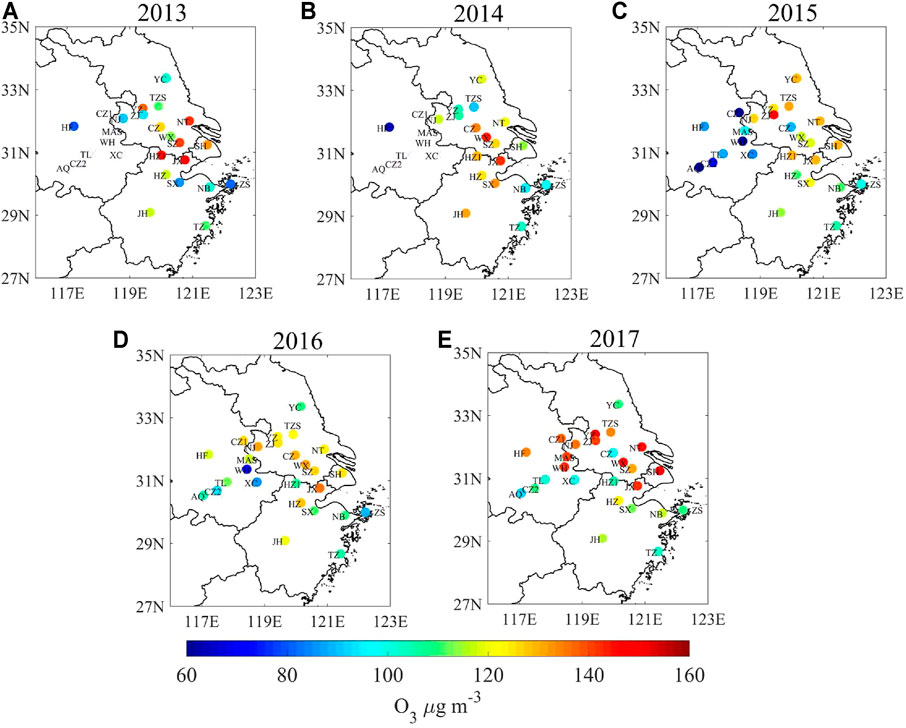
FIGURE 6. The spatial distribution of summer average MDA8 O3 in the YRD, including (A) 2013, (B) 2014, (C) 2015, (D) 2016, and (E) 2017. The purple x symbols in (A) and (B) indicate that there are no data.
Ozone Pollution and its Relation to Air Stagnation
To reveal whether air stagnation affects summertime O3 pollution, Figure 7 illustrates the relationship between air stagnation state and O3 pollution level in the CIR, the NIR, the SCR, and the whole YRD region. The MDA8 O3 concentrations are divided into three pollution levels from low to high, which are 0–100 μg m−3 (level Ⅰ), 100–160 μg m−3 (level Ⅱ) and higher than 160 μg m−3 (level Ⅲ). 100 and 160 μg m−3 are the class 1 and 2 criterion for MDA8 O3 in the National Ambient Air Quality Standard of China, respectively. Moreover, Sn defined in Air Stagnation Day, ASDs, and Sn Section are used to reflect the stagnant intensity.
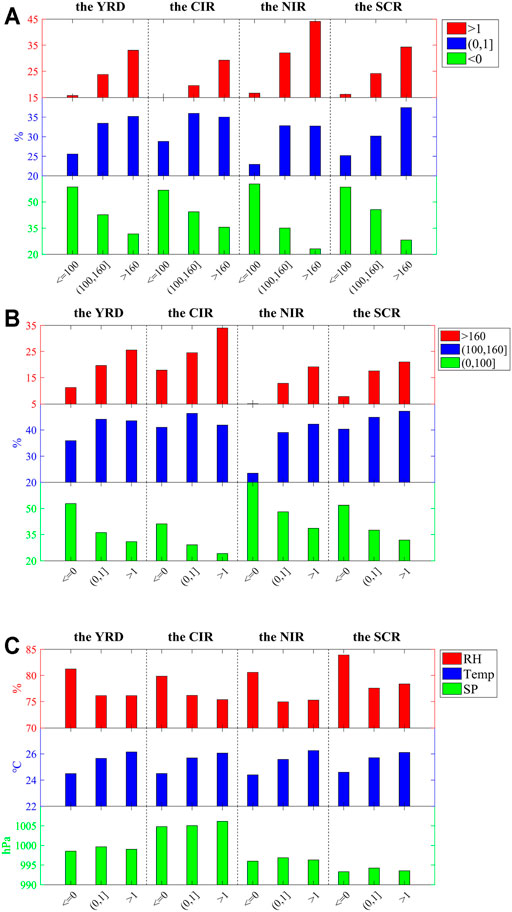
FIGURE 7. The relations between O3 pollution levels and air stagnation intensity in the YRD, including (A) the distribution of percentages of Sn values under different O3 pollution levels, (B) the distribution of percentages of the O3 pollution levels for a given Sn value range, and (C) the distribution of relative humidity (RH), 2 m air temperature (Temp) and surface air pressure (SP) for a given Sn value range.
As shown in Figure 7A, when the O3 pollution becomes worse, the percentage of Sn greater than 0 (tendency to form air stagnation) increases while the percentage of Sn less than 0 (tendency to cause the atmosphere unstable) decreases. For the distribution of percentages of the MDA8 O3 concentrations for a given Sn value range, as presented in Figure 7B, the percentage of high O3 concentration increases with the increasing of Sn value, which means more O3 pollution events occur when the atmosphere is more stable. These findings reveal that the air stagnant status does have an influence on O3 pollution. It is worth mentioning that the positive relation between O3 pollution and air stagnation not only occurs in special areas in the YRD (the CIR, the NIR and the SCR) but also is the common phenomena throughout the YRD.
Since the calculation of Sn does not cover all meteorological factors that affect O3 concentrations, it is necessary to discuss the performance of other meteorological factors in air stagnation days. Figure 7C gives the distribution of meteorological factors for a given Sn value range. The meteorological factors include relative humidity (RH), 2 m air temperature (Temp) and surface air pressure (SP). As illustrated in Figure 7C, the days with Sn greater than 0 (tendency to form air stagnation) usually have lower relative humidity, higher 2 m temperature and higher surface pressure than days with Sn less than 0 (tendency to cause the atmosphere unstable) in the YRD. Low relative humidity and high temperature, as well as less precipitation that results in more solar radiation to penetrate the atmosphere, are all favorable to form O3 pollution episodes (Ding et al., 2013, 2016; Pu et al., 2017). Particularly, the 2 m temperature increases with the Sn value, which explains that the high O3 pollution level tends to occur when Sn is greater than 1 (the atmosphere is more stagnant).
Mechanism for the Effect of Air Stagnation on O3 Pollution in the Summer of 2013 and 2015
Previous studies, as well as the result of Spatiotemporal Distribution of O3 Section, show a positive trend of O3 concentrations in the YRD during 2013–2017 (Lu et al., 2020; Wang et al., 2020; Zhan et al., 2021). However, the O3 pollution days account for 17.0, 16.1, 14.7, 15.3, and 20.2% (from 2013 to 2017 respectively) of the summer days of the YRD. It seems that O3 pollution episodes are more likely to occur in the summer of 2013 than 2015. Additionally, Figure 2 shows that there are more air stagnant days in 2013 than 2015. Figures 3–5 also illustrate that the time series of all three EOFs show opposite phase in 2013 and 2015. Therefore, comparing the meteorological fields between 2013 and 2015 may reveal how air stagnation affects O3 pollution in the YRD from the perspective of meteorological conditions.
Figure 8 shows the summertime averages and the differences between 2013 and 2015 for the three meteorological variables identifying air stagnation day. In the 500 hPa weather map of 2013 (Figure 8A), the tropospheric polar vortex is large and strong. The flat isopleths indicate that there is a small geopotential height gradient, which can result in weak wind in the YRD. However, in 2015, the tropospheric polar vortex is small and weak. There are obvious troughs and ridges in the upper reaches of the YRD (Figure 8B), and thereby the cold air can move southward. These differences are visually shown in Figure 8C. Compared to 2015, there is a significant positive potential height perturbation in 2013, which can lead to easterly wind component over the YRD and result in a smaller wind speed at 500 hPa atmospheric layer. Furthermore, the westerly component appearing at 45°N confirms the fact that the westerly jet lies more to the north. For 10 m wind speed, it is higher on the ocean than on the land in both 2013 (Figure 8D) and 2015 (Figure 8E), which partly explains the reason why the ocean usually has a smaller ASDs. Figure 8F shows that the 10 m wind speed has a southwest component in 2013 (compared with 2015), which can block the prevailing southeasterly wind.
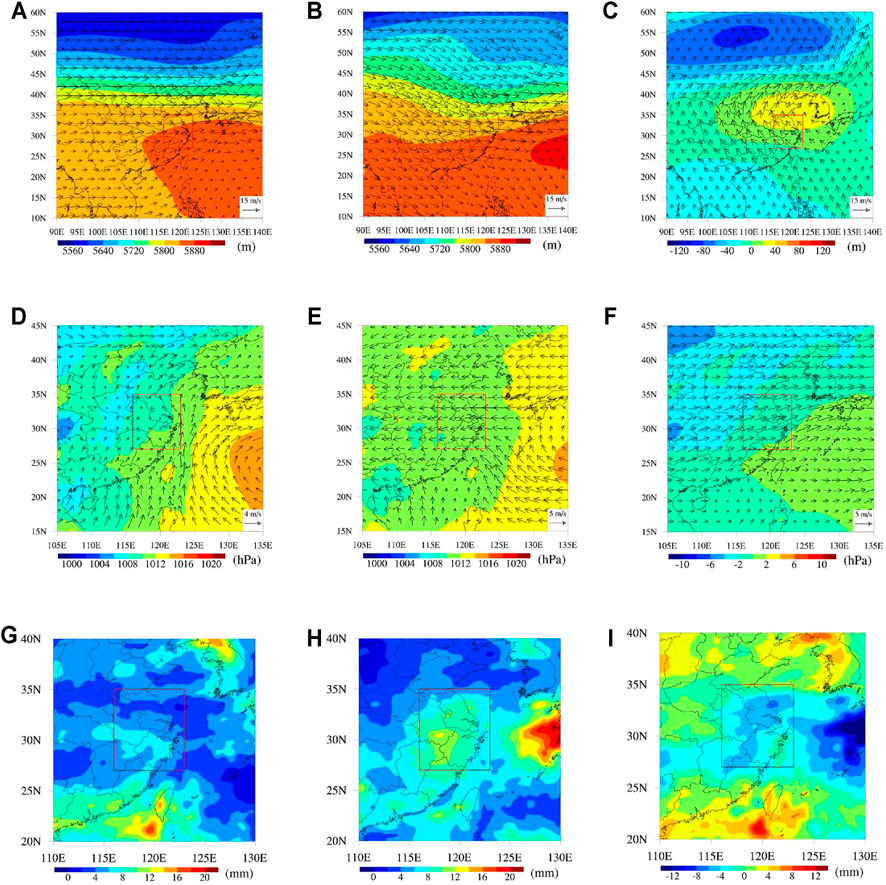
FIGURE 8. The summertime averages for the three meteorological variables identifying an air stagnation day, including the fields of geopotential height and wind at 500 hPa atmospheric layer (A–C), the sea level pressure field and 10 m wind field (D–F), and the precipitation (G–I). (A), (D), and (G) show the results in 2013. (B), (E) and (H) show the results in 2015. (C), (F), and (I) show the differences between 2013 and 2015. In (A–I), the red rectangular region indicates the YRD.
As for precipitation, there is a significant difference in the spatial distribution between 2013 and 2015. In the summer of 2013, there are more rainfalls in the south of China, and there is less precipitation in the YRD and the north part of China (Figure 8G). In the summer of 2015, however, more rains fall in the YRD, especially in the south of Anhui province (Figure 8H). The difference of precipitation between 2013 and 2015 (precipitation in the summer of 2013 minus that in 2015) are shown in Figure 8I. Obviously, the precipitation over the YRD is much higher in 2015, implying that the processes of the dilution and the removal of air pollutants are more intensive in 2015. Less precipitation in 2013 also means there are more intensive solar radiation reaching the ground and higher air temperature near the surface over the YRD, as shown in Figure 9.
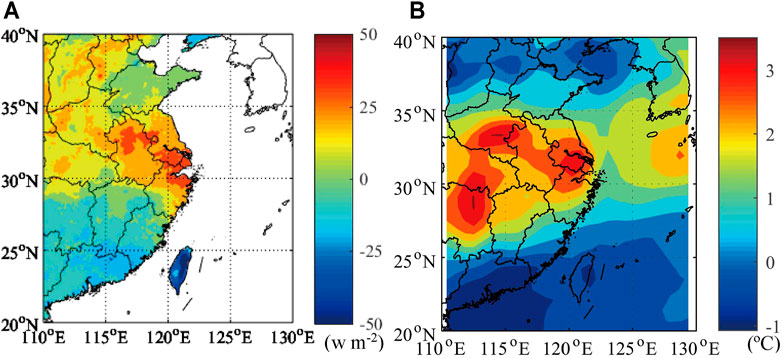
FIGURE 9. The differences of solar radiation (A) and 2 m air temperature (B) over the YRD between the summer in 2013 and 2015.
In summary, larger and stronger of the tropospheric polar vortex and the subtropical high result in more air stagnation days over the YRD in the summer of 2013. Under this circumstance, the upper- and lower-level winds are weak, and more air pollutants including O3 and its precursors are trapped near surface over the YRD. Moreover, less precipitation, higher air temperature and stronger solar radiation that are associated with air stagnation facilitate the photochemical reactions of O3 formation. Then, more O3 pollution days occur in the summer of 2013. The weather systems and the changes in relevant meteorological factors related to air stagnation can affect the physical and chemical processes of O3 formation, and thereby severe O3 pollution tends to form under air stagnant conditions.
Conclusion
Stagnant meteorological state can lead to hazardous air quality. O3 is the typical air pollutant in hot seasons of the YRD. In this study, air stagnation and its impact on summertime O3 in the YRD are investigated. The summertime air stagnation days over the YRD have significant spatiotemporal variations from 2001 to 2017. The regional average value is about 30 days (32.3% of the entire summer days) in the YRD. The values range from 9 days (9.2%) in 2015 to 54 days (58.4%) in 2010. The values on the ocean are usually smaller than those on land. Based on EOF analysis, the first three EOFs explain 68.8, 11.3, and 7.1% of the variations of air stagnation days in the YRD, respectively. The spatial pattern of the first EOF is related to the East Asian summer monsoon, and mainly depends on the area and the intensity of the South China Sea subtropical high. When the South China Sea subtropical high is large and strong, air stagnation is likely to appear in the YRD. The second EOF shows significant maritime-continental contrasts, which is due to stronger surface wind on sea than that on land. As for the third EOF, the north and the south of the YRD has the opposite phase, with a dividing line along approximately 31°N. This spatial pattern is related to the area and the intensity of the northern hemisphere polar vortex that can affect the meridional circulation. When the northern hemisphere polar vortex is small and weak, the north part of the YRD has more air stagnation days. O3 concentration is high in summer and shows an increase from 2013 to 2017 over the YRD. The 26 typical YRD cities can be classified into three categories (CIR, NIR, and SCR) based on their O3 characteristics and geographical locations. The cities in the CIR have the highest concentrations of MDA8 O3. The cities in the NIR have the most rapid increasing of MDA8 O3. Air stagnation can affect O3 pollution levels in the YRD. The percentage of high O3 pollution level increases with air stagnant intensity both in special areas and all over the YRD. Weak wind, less precipitation, low relative humidity, high temperature, strong solar radiation and high surface pressure under stagnant days are favorable to form severe O3 pollution. More stagnant weather condition in 2013 can explain more O3 pollution episodes in that year than in 2015. Larger and stronger of the tropospheric polar vortex and the subtropical high result in more air stagnation days over the YRD in the summer of 2013. Under this circumstance, there are weaker upper- and lower-level winds, less precipitation, higher air temperature and stronger solar radiation over the YRD in 2013 than 2015. The weather systems and the changes in relevant meteorological factors can affect the physical and chemical processes of O3 formation, and thereby severe O3 pollution tends to form.
This work provides an overview of air stagnation and its behaviors over the YRD, and discusses its effects on the summertime O3 pollution over this region in recent years. The above findings provide valuable insight into the formation of O3 pollution in the YRD, and help to understand the effect of air stagnant state on the changes in surface O3 concentration in hot seasons.
Data Availability Statement
The original contributions presented in the study are included in the article/supplementary material, further inquiries can be directed to the corresponding author.
Author Contributions
MX had the original ideas, designed the research, collected the data, prepared the original draft, and acquired financial support for the project leading to this publication. CZ carried out the data analysis and helped to prepare the original draft. YZ, JS, and YL help to collect the data and prepare the original draft. MZ, QL, and FS reviewed the initial draft and checked the English of the original manuscript.
Funding
This work was supported by the Natural Science Foundation of Jiangsu Province (BK20211158), the National Natural Science Foundation of China (41475122, 40805059) and the National Key Basic Research Program of China (2006CB403701).
Conflict of Interest
The authors declare that the research was conducted in the absence of any commercial or financial relationships that could be construed as a potential conflict of interest.
Publisher’s Note
All claims expressed in this article are solely those of the authors and do not necessarily represent those of their affiliated organizations, or those of the publisher, the editors and the reviewers. Any product that may be evaluated in this article, or claim that may be made by its manufacturer, is not guaranteed or endorsed by the publisher.
Acknowledgments
We are grateful to NEMC for the air quality monitoring data and to ECMWF for the meteorological reanalysis data.
References
Bao, X., and Zhang, F. (2013). Evaluation of NCEP-CFSR, NCEP-NCAR, ERA-Interim, and ERA-40 Reanalysis Datasets against Independent Sounding Observations over the Tibetan Plateau. J. Clim. 261, 206–214. doi:10.1175/Jcli-D-12-0005610.1175/jcli-d-12-00056.1
Chan, C. K., and Yao, X. (2008). Air Pollution in Mega Cities in China. Atmos. Environ. 42, 1–42. doi:10.1016/j.atmosenv.2007.09.003
Dee, D. P., Uppala, S. M., Simmons, A. J., Berrisford, P., Poli, P., Kobayashi, S., et al. (2011). The ERA-Interim Reanalysis: Configuration and Performance of the Data Assimilation System. Q.J.R. Meteorol. Soc. 137, 553–597. doi:10.1002/qj.828
Ding, A. J., Fu, C. B., Yang, X. Q., Sun, J. N., Zheng, L. F., Xie, Y. N., et al. (2013). Ozone and fine Particle in the Western Yangtze River Delta: an Overview of 1 Yr Data at the SORPES Station. Atmos. Chem. Phys. 13, 5813–5830. doi:10.5194/acp-13-5813-2013
Ding, A. J., Nie, W., Huang, X., Chi, X., Sun, J., Kerminen, V.-M., et al. (2016). Long-Term Observation of Air Pollution-Weather/climate Interactions at the SORPES Station: a Review and Outlook. Front. Environ. Sci. Eng. 10 (5), 15. doi:10.1007/s11783-016-0877-3
Ding, Y. H., and Chan, J. C. L. (2005). The East Asian Summer Monsoon: an Overview. Meteorol. Atmos. Phys. 89, 117–142. doi:10.1007/s00703-005-0125-z
Feng, F., and Wang, K. (2021). Merging Ground-Based sunshine Duration with Satellite Cloud and Aerosol Data to Produce High Resolution Long-Term Surface Solar Radiation over China. Earth Syst. Sci. Data 13 (3), 907–922. doi:10.5194/essd-13-907-2021
Fu, T.-M., Zheng, Y., Paulot, F., Mao, J., and Yantosca, R. M. (2015). Positive but Variable Sensitivity of August Surface Ozone to Large-Scale Warming in the Southeast United States. Nat. Clim Change 5, 454–458. doi:10.1038/Nclimate2567
Gao, D., Xie, M., Chen, X., Wang, T., Liu, J., Xu, Q., et al. (2020). Systematic Classification of Circulation Patterns and Integrated Analysis of Their Effects on Different Ozone Pollution Levels in the Yangtze River Delta Region, China. Atmos. Environ. 242, 117760. doi:10.1016/j.atmosenv.2020.117760
Gao, D., Xie, M., Liu, J., Wang, T., Ma, C., Bai, H., et al. (2021). Ozone Variability Induced by Synoptic Weather Patterns in Warm Seasons of 2014-2018 over the Yangtze River Delta Region, China. Atmos. Chem. Phys. 21, 5847–5864. doi:10.5194/acp-21-5847-2021
Garrido-Perez, J. M., Ordóñez, C., García-Herrera, R., and Barriopedro, D. (2018). Air Stagnation in Europe: Spatiotemporal Variability and Impact on Air Quality. Sci. Total Environ. 645, 1238–1252. doi:10.1016/j.scitotenv.2018.07.238
Garrido-Perez, J. M., Ordóñez, C., García-Herrera, R., and Schnell, J. L. (2019). The Differing Impact of Air Stagnation on Summer Ozone across Europe. Atmos. Environ. 219, 117062. doi:10.1016/j.atmosenv.2019.117062
Gianelli, S. M., Carlson, B. E., and Lacis, A. A. (2007). Using EOF Analysis to Qualitatively Analyze, and Identify Inhomogeneities in, Data from Ground-Based Aerosol Monitoring Instruments. J. Geophys. Res. 112. D20210. doi:10.1029/2006jd008300
Hannachi, A., Jolliffe, I. T., and Stephenson, D. B. (2007). Empirical Orthogonal Functions and Related Techniques in Atmospheric Science: A Review. Int. J. Climatol. 27, 1119–1152. doi:10.1002/joc.1499
He, Y. J., Uno, I., Wang, Z. F., Pochanart, P., Li, J., and Akimoto, H. (2008). Significant Impact of the East Asia Monsoon on Ozone Seasonal Behavior in the Boundary Layer of Eastern China and the West Pacific Region. Atmos. Chem. Phys. 8, 7543–7555. doi:10.5194/acp-8-7543-2008
Horton, D. E., Harshvardhan, , and Diffenbaugh, N. S. (2012). Response of Air Stagnation Frequency to Anthropogenically Enhanced Radiative Forcing. Environ. Res. Lett. 7, 044034. doi:10.1088/1748-9326/7/4/044034
Horton, D. E., Skinner, C. B., Singh, D., and Diffenbaugh, N. S. (2014). Occurrence and Persistence of Future Atmospheric Stagnation Events. Nat. Clim Change 4, 698–703. doi:10.1038/Nclimate2272
Hu, J., Chen, J., Ying, Q., and Zhang, H. (2016). One-year Simulation of Ozone and Particulate Matter in China Using WRF/CMAQ Modeling System. Atmos. Chem. Phys. 16, 10333–10350. doi:10.5194/acp-16-10333-2016
Hu, C., Kang, P., Jaffe, D. A., Li, C., Zhang, X., Wu, K., et al. (2021). Understanding the Impact of Meteorology on Ozone in 334 Cities of China. Atmos. Environ. 248, 118221. doi:10.1016/j.atmosenv.2021.118221
Huang, Q., Cai, X., Song, Y., and Zhu, T. (2017). Air Stagnation in China (1985-2014): Climatological Mean Features and Trends. Atmos. Chem. Phys. 17, 7793–7805. doi:10.5194/acp-17-7793-2017
Huffman, G. J., Adler, R. F., Morrissey, M. M., Bolvin, D. T., Curtis, S., Joyce, R., et al. (2001). Global Precipitation at One-Degree Daily Resolution from Multisatellite Observations. J. Hydrometeor 2, 36–50. doi:10.1175/1525-7541(2001)002<0036:gpaodd>2.0.co;2
Jacob, D. J., and Winner, D. A. (2009). Effect of Climate Change on Air Quality. Atmos. Environ. 43, 51–63. doi:10.1016/j.atmosenv.2008.09.051
Jiang, Z., Li, J., Lu, X., Gong, C., Zhang, L., and Liao, H. (2021). Impact of Western Pacific Subtropical High on Ozone Pollution over Eastern China. Atmos. Chem. Phys. 21, 2601–2613. doi:10.5194/acp-21-2601-2021
Kerr, G. H., and Waugh, D. W. (2018). Connections between Summer Air Pollution and Stagnation. Environ. Res. Lett. 13, 084001. doi:10.1088/1748-9326/Aad2e2
Li, L., Chen, C. H., Fu, J. S., Huang, C., Streets, D. G., Huang, H. Y., et al. (2011). Air Quality and Emissions in the Yangtze River Delta, China. Atmos. Chem. Phys. 11, 1621–1639. doi:10.5194/acp-11-1621-2011
Li, Z., Guo, J., Ding, A., Liao, H., Liu, J., Sun, Y., et al. (2017). Aerosol and Boundary-Layer Interactions and Impact on Air Quality. Natl. Sci. Rev. 4, 810–833. doi:10.1093/nsr/nwx117
Li, Z., Zhou, Y., Wan, B., Chen, Q., Huang, B., Cui, Y., et al. (2019). The Impact of Urbanization on Air Stagnation: Shenzhen as Case Study. Sci. Total Environ. 664, 347–362. doi:10.1016/j.scitotenv.2019.01.232
Lu, X., Zhang, L., Wang, X., Gao, M., Li, K., Zhang, Y., et al. (2020). Rapid Increases in Warm-Season Surface Ozone and Resulting Health Impact in China since 2013. Environ. Sci. Technol. Lett. 7, 240–247. doi:10.1021/acs.estlett.0c00171
Ma, J., Xu, X., Zhao, C., and Yan, P. (2012). A Review of Atmospheric Chemistry Research in China: Photochemical Smog, Haze Pollution, and Gas-Aerosol Interactions. Adv. Atmos. Sci. 29, 1006–1026. doi:10.1007/s00376-012-1188-7
Mao, J., and Wu, G. (2012). Diurnal Variations of Summer Precipitation over the Asian Monsoon Region as Revealed by TRMM Satellite Data. Sci. China Earth Sci. 55, 554–566. doi:10.1007/s11430-011-4315-x
Pu, X., Wang, T. J., Huang, X., Melas, D., Zanis, P., Papanastasiou, D. K., et al. (2017). Enhanced Surface Ozone during the Heat Wave of 2013 in Yangtze River Delta Region, China. Sci. Total Environ. 603, 807–816. doi:10.1016/j.scitotenv.2017.03.056
Schnell, J. L., and Prather, M. J. (2017). Co-occurrence of Extremes in Surface Ozone, Particulate Matter, and Temperature over Eastern North America. Proc. Natl. Acad. Sci. USA 114, 2854–2859. doi:10.1073/pnas.1614453114
Shen, L., Wang, H., Zhu, B., Zhao, T., Liu, A., Lu, W., et al. (2021). Impact of Urbanization on Air Quality in the Yangtze River Delta during the COVID-19 Lockdown in China. J. Clean. Prod. 296, 126561. doi:10.1016/j.jclepro.2021.126561
Shu, L., Xie, M., Wang, T., Gao, D., Chen, P., Han, Y., et al. (2016). Integrated Studies of a Regional Ozone Pollution Synthetically Affected by Subtropical High and Typhoon System in the Yangtze River Delta Region, China. Atmos. Chem. Phys. 16, 15801–15819. doi:10.5194/acp-16-15801-2016
Shu, L., Xie, M., Gao, D., Wang, T., Fang, D., Liu, Q., et al. (2017). Regional Severe Particle Pollution and its Association with Synoptic Weather Patterns in the Yangtze River Delta Region, China. Atmos. Chem. Phys. 17, 12871–12891. doi:10.5194/acp-17-12871-2017
Sun, Z., Chang, N.-B., Huang, Q., and Opp, C. (2012). Precipitation Patterns and Associated Hydrological Extremes in the Yangtze River basin, China, Using TRMM/PR Data and EOF Analysis. Hydrological Sci. J. 57, 1315–1324. doi:10.1080/02626667.2012.716905
Wang, J. X. L., and Angell, J. K. (1999). Air Stagnation Climatology for the United States(1948-1998). USA: NOAA/Air Resources Laboratory ATLAS, Silver Spring.
Wang, Y., Zhang, Y., Hao, J., and Luo, M. (2011). Seasonal and Spatial Variability of Surface Ozone over China: Contributions from Background and Domestic Pollution. Atmos. Chem. Phys. 11, 3511–3525. doi:10.5194/acp-11-3511-2011
Wang, Y., Shen, L., Wu, S., Mickley, L., He, J., and Hao, J. (2013). Sensitivity of Surface Ozone over China to 2000-2050 Global Changes of Climate and Emissions. Atmos. Environ. 75, 374–382. doi:10.1016/j.atmosenv.2013.04.045
Wang, S., Zhang, M., Sun, M., Wang, B., Huang, X., Wang, Q., et al. (2015). Comparison of Surface Air Temperature Derived from NCEP/DOE R2, ERA-Interim, and Observations in the Arid Northwestern China: a Consideration of Altitude Errors. Theor. Appl. Climatol 119, 99–111. doi:10.1007/s00704-014-1107-1
Wang, T., Xue, L., Brimblecombe, P., Lam, Y. F., Li, L., and Zhang, L. (2017). Ozone Pollution in China: A Review of Concentrations, Meteorological Influences, Chemical Precursors, and Effects. Sci. Total Environ. 575, 1582–1596. doi:10.1016/j.scitotenv.2016.10.081
Wang, Y., Gao, W., Wang, S., Song, T., Gong, Z., Ji, D., et al. (2020). Contrasting Trends of PM2.5 and Surface-Ozone Concentrations in China from 2013 to 2017. Natl. Sci. Rev. 7, 1331–1339. doi:10.1093/nsr/nwaa032
Wang, H. L., Pei, Y., Yin, Y., Shen, L. J., Chen, K., Shi, Z., et al. (2021). Observational Evidence of Lightning‐generated Ultrafine Aerosols. Geophys. Res. Lett. 48, e2021GL093771. doi:10.1029/2021gl093771
Waugh, D. W., Sobel, A. H., and Polvani, L. M. (2017). What Is the Polar Vortex and How Does it Influence Weather? B Am. Meteorol. Soc. 98 (1), 37–44. doi:10.1175/bams-d-15-00212.1
Wu, K., Yang, X., Chen, D., Gu, S., Lu, Y., Jiang, Q., et al. (2020). Estimation of Biogenic VOC Emissions and Their Corresponding Impact on Ozone and Secondary Organic Aerosol Formation in China. Atmos. Res. 231, 104656. doi:10.1016/j.atmosres.2019.104656
Xie, M., Zhu, K., Wang, T., Yang, H., Zhuang, B., Li, S., et al. (2014). Application of Photochemical Indicators to Evaluate Ozone Nonlinear Chemistry and Pollution Control Countermeasure in China. Atmos. Environ. 99, 466–473. doi:10.1016/j.atmosenv.2014.10.013
Xie, M., Liao, J., Wang, T., Zhu, K., Zhuang, B., Han, Y., et al. (2016a). Modeling of the Anthropogenic Heat Flux and its Effect on Regional Meteorology and Air Quality over the Yangtze River Delta Region, China. Atmos. Chem. Phys. 16, 6071–6089. doi:10.5194/acp-16-6071-2016
Xie, M., Zhu, K., Wang, T., Chen, P., Han, Y., Li, S., et al. (2016b). Temporal Characterization and Regional Contribution to O3 and NOx at an Urban and a Suburban Site in Nanjing, China. Sci. Total Environ. 551, 533–545. doi:10.1016/j.scitotenv.2016.02.047
Xie, M., Zhu, K., Wang, T., Feng, W., Gao, D., Li, M., et al. (2016c). Changes in Regional Meteorology Induced by Anthropogenic Heat and Their Impacts on Air Quality in South China. Atmos. Chem. Phys. 16, 15011–15031. doi:10.5194/acp-16-15011-2016
Xie, M., Shu, L., Wang, T.-j., Liu, Q., Gao, D., Li, S., et al. (2017). Natural Emissions under Future Climate Condition and Their Effects on Surface Ozone in the Yangtze River Delta Region, China. Atmos. Environ. 150, 162–180. doi:10.1016/j.atmosenv.2016.11.053
Xu, W. Y., Zhao, C. S., Ran, L., Deng, Z. Z., Liu, P. F., Ma, N., et al. (2011). Characteristics of Pollutants and Their Correlation to Meteorological Conditions at a Suburban Site in the North China Plain. Atmos. Chem. Phys. 11, 4353–4369. doi:10.5194/acp-11-4353-2011
Xu, W., Xu, X., Lin, M., Lin, W., Tarasick, D., Tang, J., et al. (2018). Long-term Trends of Surface Ozone and its Influencing Factors at the Mt Waliguan GAW Station, China - Part 2: The Roles of Anthropogenic Emissions and Climate Variability. Atmos. Chem. Phys. 18, 773–798. doi:10.5194/acp-18-773-2018
Yang, X., Wu, K., Wang, H., Liu, Y., Gu, S., Lu, Y., et al. (2020). Summertime Ozone Pollution in Sichuan Basin, China: Meteorological Conditions, Sources and Process Analysis. Atmos. Environ. 226, 117392. doi:10.1016/j.atmosenv.2020.117392
Yang, X., Wu, K., Lu, Y., Wang, S., Qiao, Y., Zhang, X., et al. (2021). Origin of Regional Springtime Ozone Episodes in the Sichuan Basin, China: Role of Synoptic Forcing and Regional Transport. Environ. Pollut. 278, 116845. doi:10.1016/J.Envpol.2021.116845
Yin, C. Q., Solmon, F., Deng, X. J., Zou, Y., Deng, T., Wang, N., et al. (2019). Geographical Distribution of Ozone Seasonality over China. Sci. Total Environ. 689, 625–633. doi:10.1016/j.scitotenv.2019.06.460
Zhan, C., Xie, M., Fang, D.-X., Wang, T.-J., Wu, Z., Lu, H., et al. (2019). Synoptic Weather Patterns and Their Impacts on Regional Particle Pollution in the City Cluster of the Sichuan Basin, China. Atmos. Environ. 208, 34–47. doi:10.1016/j.atmosenv.2019.03.033
Zhan, C., Xie, M., Huang, C., Liu, J., Wang, T., Xu, M., et al. (2020). Ozone Affected by a Succession of Four Landfall Typhoons in the Yangtze River Delta, China: Major Processes and Health Impacts. Atmos. Chem. Phys. 20, 13781–13799. doi:10.5194/acp-20-13781-2020
Zhan, C., Xie, M., Liu, J., Wang, T., Xu, M., Chen, B., et al. (2021). Surface Ozone in the Yangtze River Delta, China: A Synthesis of Basic Features, Meteorological Driving Factors, and Health Impacts. Geophys. Res. Atmos. 126, e2020JD033600. doi:10.1029/2020jd033600
Zhang, M., Chen, S., Qi, Y. C., and Yang, Y. (2013). Evaluation of TRMM Summer Precipitation Over Huai-River Basin in China. Amr 726-731, 3401–3406. doi:10.4028/www.scientific.net/amr.726-731.3401
Zhang, Z., Zhang, X., Gong, D., Kim, S.-J., Mao, R., and Zhao, X. (2016). Possible Influence of Atmospheric Circulations on winter Haze Pollution in the Beijing-Tianjin-Hebei Region, Northern China. Atmos. Chem. Phys. 16, 561–571. doi:10.5194/acp-16-561-2016
Zhou, D., Ding, A., Mao, H., Fu, C., Wang, T., Chan, L. Y., et al. (2013). Impacts of the East Asian Monsoon on Lower Tropospheric Ozone over Coastal South China. Environ. Res. Lett. 8, 044011. doi:10.1088/1748-9326/8/4/044011
Zhu, K., Xie, M., Wang, T., Cai, J., Li, S., and Feng, W. (2017). A Modeling Study on the Effect of Urban Land Surface Forcing to Regional Meteorology and Air Quality over South China. Atmos. Environ. 152, 389–404. doi:10.1016/j.atmosenv.2016.12.053
Keywords: air quality, ozone, air stagnation, the Yangtze River Delta region, pollution meteorological characteristics
Citation: Xie M, Zhan C, Zhan Y, Shi J, Luo Y, Zhang M, Liu Q and Shen F (2021) Spatiotemporal Variability of Air Stagnation and its Relation to Summertime Ozone in the Yangtze River Delta of China. Front. Environ. Sci. 9:783524. doi: 10.3389/fenvs.2021.783524
Received: 26 September 2021; Accepted: 21 October 2021;
Published: 08 November 2021.
Edited by:
Lijuan Shen, University of Toronto, CanadaReviewed by:
Junjun Deng, Tianjin University, ChinaYongwei Wang, Nanjing University of Information Science and Technology, China
Xianyu Yang, Chengdu University of Information Technology, China
Copyright © 2021 Xie, Zhan, Zhan, Shi, Luo, Zhang, Liu and Shen. This is an open-access article distributed under the terms of the Creative Commons Attribution License (CC BY). The use, distribution or reproduction in other forums is permitted, provided the original author(s) and the copyright owner(s) are credited and that the original publication in this journal is cited, in accordance with accepted academic practice. No use, distribution or reproduction is permitted which does not comply with these terms.
*Correspondence: Min Xie, bWlueGllQG5qdS5lZHUuY24=