 Han Xiao1,2*
 Jianbo Liu1Guojin He1Xiaomei Zhang1
 Hua Wang1Tengfei Long1Zhaoming Zhang1Wei Wang1Ranyu Yin1Yantao Guo1Bo Cheng1Qianqian Cao1,2
- 1Aerospace Information Research Institute, Chinese Academy of Sciences, Beijing, China
- 2School of Electronic, Electrical and Communication Engineering, University of Chinese Academy of Science, Beijing, China
Forest cover plays an important role in sustaining ecological security to realize Sustainable Development Goals (SDGs). The research target area is composed of the African region which is experiencing unprecedented deforestation based on the data collection from 54 countries and regions between 2000 and 2020. Spatial autocorrelation analysis, global principal component analysis, and geographic detector model have been used as the core research tool. The temporal and spatial patterns of forest cover change in Africa and the driving effects of population growth, economic and trade, social development, arable land expansion, and other factors on forest cover change in different periods have been demonstrated. The findings are as follows: 1) extremely unequal distribution of Africa forest has caused forest area reduction in 20 years. The reduction quantity of forest has been illustrated from strong to weak: Central Africa (strongest), East Africa (higher strong), West Africa (medium), South Africa (higher weak), and North Africa (weakest). However, the forest reduction area in West Africa with the original ratio is the most significant. More than 80% of the forest area reduction in Africa has occurred in 14 countries, just five national forest areas to achieve the net growth, but the increase amount was only 1% of loss amount. 2) The spatial pattern of forest cover change in Africa contracted and clustered gradually, especially after 2012. Algeria was the hotspot cluster of Morocco and Tunisia, forming the increase area of forest cover in North Africa. Zambia, the coldest point, gathers Angola significantly, while the Democratic Republic of the Congo and Tanzania form a significantly reduced forest cover area. 3) Total population, land area, cultivated land, urban population, consumer price index, and birth rate are the main factors influencing the temporal evolution of forest cover change in Africa. It can be divided into four stages to interpret the different explanations and significance of each factor for forest cover change in the study area.
1 Introduction
Forest is not only one of the important sources of human production and life but also one of the important indicators to maintain ecological security to achieve the Sustainable Development Goals (SDGs) (Glaser, 2012; Giam, 2017; Macdicken, 2015). After human beings frantically plundered forest resources, they gradually realized that large-scale deforestation would cause adverse consequences such as climate change, soil erosion, and biodiversity loss, so the net loss rate of global forest cover has been slowed down through various appeals and efforts (Barlow et al., 2007; Edwards et al., 2012; Bonan, 2008; Hansen et al., 2013; Harris et al., 2021). However, from 2010 to 2020, Africa’s forest cover will be reduced by 3.9 million hectares, surpassing South America, and the net loss rate is the highest in the world (FAO, 2020; Hoang and Kanemoto, 2021). It is expected that Africa will experience large-scale population growth and climate change, and Africa has a typical disturbance-driven ecosystem (Diffenbaugh and Giorgi, 2012; United Nations, Department of Economic and Social Affairs, Population Division, 2017). Once the forests in most areas are affected, the entire ecological environment will become highly vulnerable (Midgley and Bond, 2015; Réjou-Méchain et al., 2021). Analyzing and digging out the main driving factors that affect the changes in forest cover in Africa is essential to promote the protection of global forest protection and help regions achieve Sustainable Development Goals.
Many scholars have conducted research on the relationship between temporal and spatial characteristics based on the changes in forest cover in a specific study area and possible influencing factors, such as cocoa migration and deforestation in West Africa are positively correlated (Ruf et al., 2015), deforestation in Cameroon in relation to food security of poor populations (Gbetnkom, 2009; Pendrill et al., 2019), and road accessibility, agricultural product prices, household income levels, and catchment water balance . are all related to deforestation (Mainardi, 1998; Beckman et al., 2017; Kaimowitz, 1999; Assogba and Zhang, 2018; Mushi et al., 2020; Wilson et al., 2001; A et al., 2004; Garzuglia and Saket, 2003). Research shows that the aforementioned factors can be the root cause of deforestation to a certain extent, which in turn promotes deforestation (farmers, poor populations, animal husbandry, and loggers) to become the main source of deforestation (Gbetnkom, 2009; Afdb and Kouakou, 2010). However, causal attribution of natural and ecosystem system evolution is complicated because exploring forest cover dynamics is being affected by the interaction of many factors such as ecological environment, political, economic, and social factors, and have a wide range of impacts on time and space scales (Geist and Lambin, 2002; Defries et al., 2010; Sandel and Svenning, 2013; Rudel and Roper, 1997; Sannigrahi et al., 2018; Kim and Kim, 2010). Forzieri et al. quantify the vulnerability of European forests to fires, windthrows, and insect outbreaks by random forest (RF) regression (Forzieri et al., 2021). Curtis developed a forest loss classification model, to determine a spatial attribution of forest disturbance, was attributed to commodity production, forestry, shifting agriculture, and wildfire (Curtis et al., 2018; Goodchild and Glennon, 2010). Hoang et al. used remote sensing data and multi-regional input–output models to provide correlation analysis of the spatial pattern of international trade and deforestation (Hoang and Kanemoto, 2021). Beckman used economic models to simulate the reference scenarios of land use in 14 regions around the world to determine the potential impact of policies on relative forest losses (Beckman et al., 2017). DeFries used forest loss data from 2000 to 2005 to estimate the economic, agricultural, and population correlations of 41 countries and found that forest loss was positively correlated with urban population growth and agricultural exports during this period (Defries et al., 2010).
However, different countries have different social and economic development stages and different forest protection strategies, which may result in significant differences in regional deforestation (Deacon, 1994; Hosonuma et al., 2012; Heitzig et al., 2016). Considering Tobler’s first law of geography, severe deforested areas can also be a key driver of deforestation in neighboring areas. Currently, most research in the context of the driving factors of forest cover change has used local decomposition analysis of a few specific factors but do not evolve the spatial heterogeneity of each factor on the intensity of forest cover. This research analysis has mainly evolved the following two aspects: 1) it analyzes the spatial correlation, heterogeneity, and evolution characteristics of the forest cover change pattern in African countries from 2000 to 2020; 2) the 21 driving factors have been opted based on four dimensions of economy, society, and population. The nature of the research analysis is to explore and detect the significant driving factors of forest cover change in different historical periods via geographic detectors and weighted regression geographical models’ applications. The research results are intended to provide benchmark for balancing population, economy, and green sustainable development in Africa.
2 Study Region
African area is about 30.2 million square kilometers (land area), accounting for 20.4% of the world’s total land area. The plateau (60%) is the major part of the Africa terrain. The elevation is gradually lower from southeast to northwest. The climate factors present high temperature and arid due to the north–south symmetry distributed climate zone in the middle of the African continent (across equator). It is the second largest continent in the world and has the second largest population (about 1.286 billion). Africa is rich in forest resources, accounting for 13.85 percent of the world’s forest area (about 51,400 hectares) in 2018 (National Remote Sensing Center of China, 2019). Africa also has one of the fastest growing populations in the world. The Africa’s population is growing at an annual rate of 2.3 percent with sub-Saharan Africa in turn growing faster than North Africa. Sub-Saharan Africa is the only region in the world where the number of poor populations is increasing significantly, reaching 2 billion by 2050 (World Bank Group, 2020). The challenge of reducing widespread poverty in Africa can be the core of the continent’s development model for improving their living conditions including their increased use of the natural resources around them (Kouakou, 2005). Population growth, the impact of poverty, and the exploitation of natural resources have inevitably restricted and influenced each other. It is difficult to obtain data of individual islands/regions due to the influence of economic development and political situation. Therefore, this study has selected 54 countries and regions in Africa which are represented in Table 1, and the population and area of the study area cover more than 99% of the African continent. (Figure 1). Refer to World Population Prospects data for the classification of countries and regions (United Nations, Department of Economic and Social Affairs, Population Division, 2019).
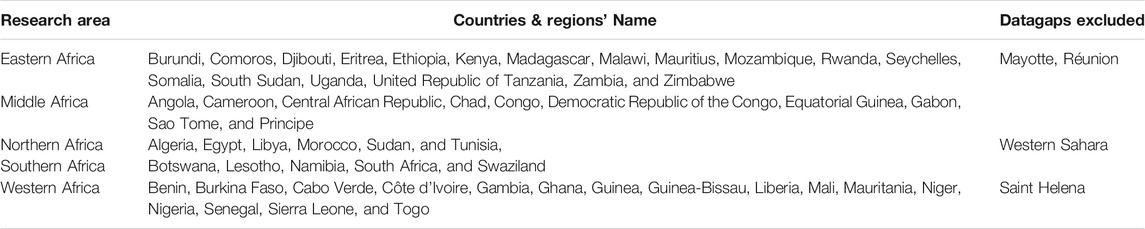
TABLE 1. Geographical division of countries in the study area.
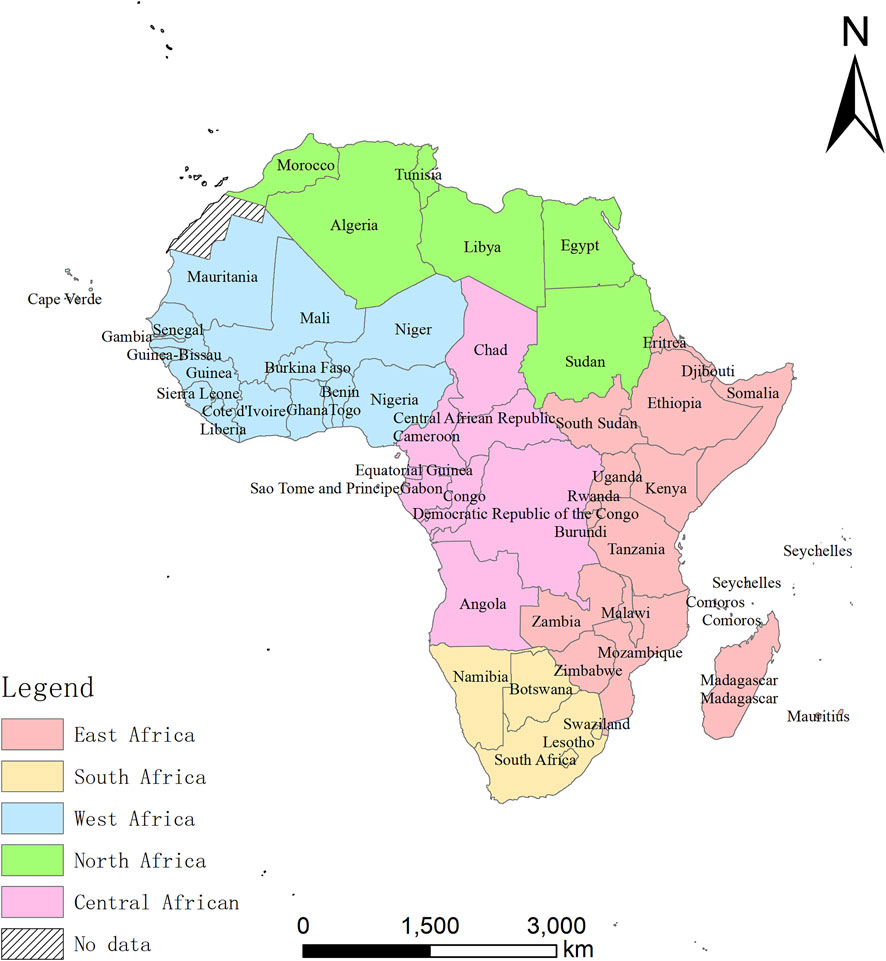
FIGURE 1. Map of location and geographical division of the study area. According to UN Department of Economic and Social Affairs World Population Prospects data, the research divisions are divided into East Africa, South Africa, West Africa, North Africa, and Central Africa. Western Sahara, Mayotte, Reunion, and Saint Helena are not including in the study area due to lack of the datasets. The benched map is from the standard Map Service System of the Ministry of Natural Resources of P.R of China. The reviewed map number is GS (2020) 4391.
3 Datasets and Methodology
3.1 Datasets
Forest cover change has been influenced by multiple factors (Curtis et al., 2018; Geist and Lambin, 2002; FAO, 2015). We selected 21 indicators from four dimensions of those are economy, society, population, and nature as explained variables for analysis. Economic dimension indicators reflect the size of a country’s economic development including GDP, GDP growth, foreign direct investment (net inflows), Foreign Direct Investment (net inflows), goods exports, and goods imports. The social dimension reflects the general state of development including forest rents, net ODA received, and consumer price index, unemployment, access to clean fuels and technologies for cooking (% of population) and compulsory education. Population factor indicators reflect the possible consumption of forest resources, including population, total, rural population, urban population, labor force, death rate, and birth rate. The natural dimension index reflects natural resource abundance, land area, terrestrial protected areas (% of total land area), and arable Land. The data cover the period from 2000 to 2020, and the data sources include World Development Indicators (WDI), and it is consistent (Table 2) in the Center for International Prospective Studies (CEPII) database (The World Bank, 2021). The number of years of compulsory education is based on UNESCO statistics for 2020 (UNESCO, 2021). Since most of the other population, economic, and social data selected in the subsequent analysis originated from the official statistical data of the World Bank, the forest cover data of the research area from 2000 to 2018 inevitably refer to “Ag.lnd.frst.k2-Forest Area (SQ.km)” in the WDI dataset. A small part of the missing forest cover data is supplemented via data from FRA 2020 published by FAO and remote-sensing data products (Hansen et al., 2013; Shimada et al., 2014; National Remote Sensing Center of China, 2019; Zhang et al., 2020).
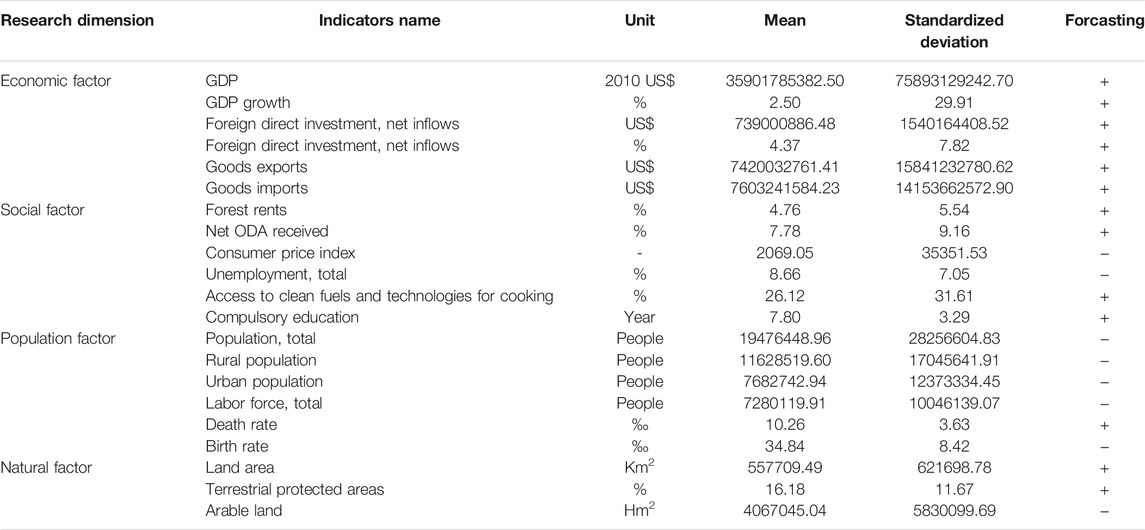
TABLE 2. Variable description of driving indicators.
3.2 Spatial Autocorrelation
The purpose of spatial autocorrelation analysis is to analyze whether a certain variable can show a certain spatial correlation and the degree of correlation. Relevant studies indicate that forest distribution will be deeply affected via the Tobler’s first law of geography, forest protection, logging, and trade in neighboring countries in terms of the same natural growth environment affected by neighboring regions with a certain spatial autocorrelation (Jha et al., 2016; Kaimowitz et al., 2002). The global Moran’s I index can be used to describe the spatial dependence of forest cover, growth, or deforestation in African countries and regions quantitatively (Moran and Ap, 1950). When I∈ (0, 1], the variables become more similar with the shortening of the measured distance, presenting a positive spatial correlation. When I∈ [-1, 0), it indicates that the overall spatial agglomeration is negatively correlated; when I = 0, it indicates that there is no spatial dependence, and the spatial pattern is randomly distributed. The calculation equation is as follows:
where N is the number of countries along the Belt and Road, I and j represent country numbers, Wij is the spatial weight matrix, Xi is the forest cover value of country I, and
where E (I) represents the mathematical expectation of global Moran’s I, v (I) represents the variance of global Moran’s I, and N (0, 1) represents the normal distribution.
For Moran’s I value, if Z ≥ 1.96 or ≤ -1.96, it is considered that space has spatial autocorrelation (Moran’s I >0 represents positive spatial correlation. The larger the value is, the more significant the spatial correlation is. 0 means spatial negative correlation; the smaller its value is, the greater the spatial difference is; If not, Moran’s I = 0 represents that the space is random).
The global Moran’s I index can count the significant characteristics of overall agglomeration, while the local indicators of spatial association (LISA) can identify the local characteristics of spatial agglomeration, thus revealing the heterogeneity of local regional spatial association (Anselin, 1995). The LISA index identifies four spatial association types of “high–high cluster,” “high–low cluster,” “low–high cluster,” and “low–low cluster,” representing different types of spatial agglomeration patterns.
3.3 Geo-Detector
Geographical Detector is a popular spatial statistical tool developed by the Prof. WangJinfeng team of LREIS, IGNRSS of Chinese Academy of Sciences, based on Excel to measure spatial differentiation and reveal driving factors. By calculating the similarity of the spatial distribution pattern between the independent variable X and dependent variable Y, the geographic detector model detects the explanatory effect intensity of the independent variable on the dependent variable (Wang and Xu, 2017). The geographic detector method was used to analyze the relationship strength of driving factors among the 6 principal component variables obtained from the original 21 variables via global principal component analysis dimension reduction. The main driving factors affecting the formation of the spatial pattern of forest cover change in the study area have been identified in different timescales. The equation is as follows:
where q value is the explanatory degree of the independent variable to the dependent variable, and the larger the q value is, the stronger the explanatory power is. I is the stratification number of the independent variable X and dependent variable Y. The Jenks natural discontinuity point grading method is adopted for stratification to discretize continuous variables. Ni and N are the number of the layer I and countries in the research area, respectively. σ2i and σ2 are the variances of the layer I and independent variables within the research area, respectively.
3.4 Global Principal Component Analysis
Global principal component analysis (GPCA) is to construct the index system of the three-dimensional time-series data table based on the use of time series and spatial sequence mutual integration, seeking a unified for all cross-section data tables and comparable to simplify subspace. Each data table on which the projection to approximate the best comprehensive effect based on the global data view is constructed.
The indicators to influence forest cover change are very diverse. Human activities are likely to be more rapid and direct, while geographical and climatic factors can also influence over long time series (with the exception of sudden natural disasters, pest disasters, or forest fires). Therefore, the analysis of 20-year time series index data of different countries and regions is constituted into sequential stereoscopic data tables for global principal component analysis. A few of “factors” are deduced from numerous observable “variables” via the analysis of three-dimensional time series data, and the minimum “factors” are used to summarize and explain the largest number of observed facts so as to establish the simplest and most basic conceptual system and reveal the essential relationship between indicators affecting forest cover change.
The steps for extracting principal factors based on global principal component analysis are described as follows:
Step 1 Construct a data table: if n regions are counted and p variables are used to describe, the “global data table” of T years is
Step 2 Normalize the elements in the table X by moving the origin of coordinates to the data center and compress and transform them to eliminate dimensional influence.
Step 3 Calculate the covariance matrix
Step 4 Find the first m eigenvalues λ1≥λ2≥... ≥λm of the matrix V and the corresponding eigenvectors μ1, μ2... μm; they are orthonormal, and μ1, μ2... μm is called the global principal axis.
Step 5 Calculate the global principal fraction and calculate the representation accuracy of the original data:
4 Results
4.1 Forest Cover and Its Change in 21 Years
The distribution of forests in Africa is extremely uneven in terms of the differences in precipitation, sunshine, soil properties, geographical location, natural conditions, and other factors. More than 45% of forests are distributed in Central Africa, 30% in East Africa, 13% in West Africa, 6.2% in South Africa, and 4.2% in North Africa. The forest area has decreased in recent 20 years. The largest loss is in Central Africa, the second one is in East Africa, the third one is in West Africa, the fourth one is in South Africa, and the fifth one is in North Africa. However, the most significant loss of the forest area was in West Africa, which has a loss percentage more than 12%. The percentage of forest area loss has decreased more than 10% in Central Africa and South Africa and 9.6% in East Africa and North Africa. More than 80 percent of the forest loss occurred in these 14 countries: the Democratic Republic of the Congo, Angola, Tanzania, Mozambique, Sudan, Nigeria, Botswana, Cote d’Ivoire, Zambia, Chad, Somalia, Ethiopia, Namibia, and Cameroon (Figure 2).
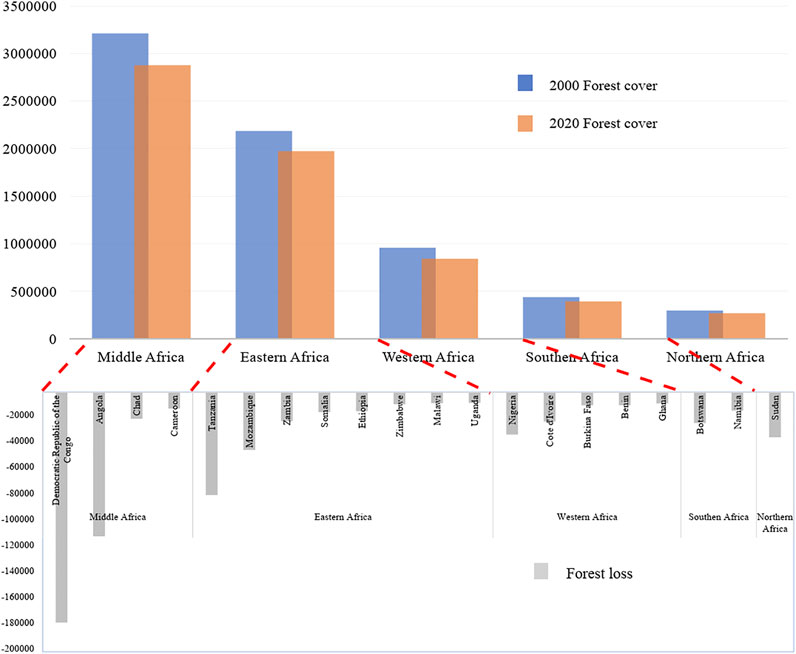
FIGURE 2. Largest forest loss is in Central Africa, the second one is in East Africa, the third one is in West Africa, the fourth one is in South Africa, and the fifth one is in North Africa. The amount of forest reduction in the original area is more significant than that in West Africa. The most significant loss of forest in the original area was in West Africa. The top 20 countries with reduced forest area in Africa are the Democratic Republic of the Congo, Angola, Tanzania, Mozambique, Sudan, Nigeria, Botswana, Cote d’lvoire, Zambia, Chad, Somalia, Ethiopia, Namibia, Cameroon, Burkina Faso, Benin, Zimbabwe, Ghana, Malawi, and Uganda.
The Democratic Republic of the Central African Republic has experienced the largest loss of forest, accounting for about a quarter of the total in Africa, more than half of the loss in Central Africa, and equal to the sum of the loss in West, South, and North Africa. Middle Africa had the second largest loss of Chad forests, losing nearly a third of its total forest area in 20 years. Eastern Africa’s Tanzania has the third largest forest in Africa and never changed for 20 years. Cote d'Ivoire and Benin forests in West Africa have lost 44 and 24% more of their original forest area. Gambia in Western Africa, which was not originally rich in forest resources, has lost nearly a third of its original forest area. Eastern Africa’s Malawi and Uganda have both lost more than a quarter of their forests in 20 years.
Just seven countries have shown a net increase in the forest area over the past 20 years. Only five countries showed significant growth (more than 200 square kilometers). Algeria, Morocco, and Tunisia in North Africa, East Africa, and Swaziland in South Africa have shown forest improvement, but the forest growth area just accounts for only 1% of the loss area.
It is worth mentioning that more countries have realized the importance of forest protection and put into actions gradually. They have slowed down the rate of deforestation and actively regulated in Rwanda, Kenya, and Ghana. It experienced a low point toward growing year by year although the forest area in Rwanda has been still decreasing in the past 20 years.
4.2 Spatial Correlation Features of Forest Cover Change
Global spatial autocorrelation analysis of net forest cover change values from 2000 to 2019 has been conducted in order to analyze the spatial correlation characteristics of forest cover change in different countries and regions in Africa. The results have illustrated (Table 3) that Moran’s I indexes of forest cover change in the past 20 years were all positive, indicating that forest cover change presented a positive correlation of spatial aggregation. However, 0≤Z≤1.65 and p ≥0.05 in the first decade of the 21st century did not adapt the significance test. Forest cover reduction in the study area was judged to be random in that period (of course, subjected to technical means, early statistical data may not be accurate enough to affect the calculation results). Until 2010 and 2012, when p ≤0.05, only less than 5% of the data distribution in the study area is likely to be random, and the probability of data aggregation is greater than that of random distribution. Z ≥1.65 and 1.96 can significantly reject the null hypothesis. The results have demonstrated that the forest cover change in the study area has begun to cluster in 2010 and more significant in 2012, and the degree of spatial agglomeration increased annually. The spatial correlation of forest cover change amongst neighboring countries or regions has been increasingly strengthened.
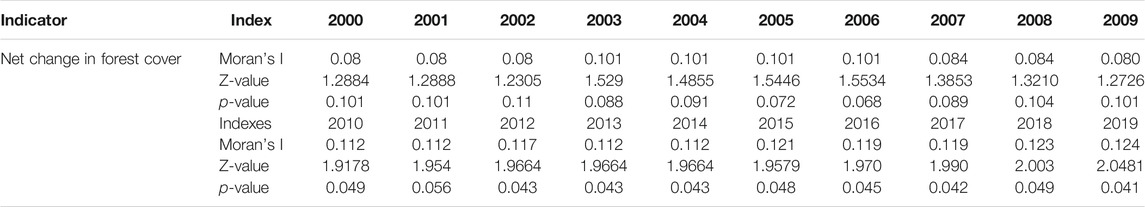
TABLE 3. Moran’s I estimate of national and regional forest cover change from 2000 to 2019.
Moran’s I estimate of national and regional forest cover change in the study area from 2000 to 2019 was analyzed (Figure 3A). A Global Moran’s I Z ≥ 1.96 after 2020 indicates that the forest cover change in the study area shows spatial autocorrelation, I∈ (0, 1] forest cover change is positively correlated with spatial distance, and p ≤0.05 after 2012 shows significant spatial aggregation characteristics in Figures 3B,C. The LISA index has been used to study the local agglomeration characteristics of forest cover change in the region further. The LISA significance map and agglomeration map have passed the 95% significance test via ArcGIS software analysis. The spatial clustering of the hot spots has been divided into two regions: Morocco and Tunisia forest cover expanding area based on Algeria as the hot spot agglomeration; Angola, the Democratic Republic of the Congo, and Tanzania have been reduced low-forest coverage in Angola, Rwanda, Uganda, Central African Republic and Congo high–low zone.
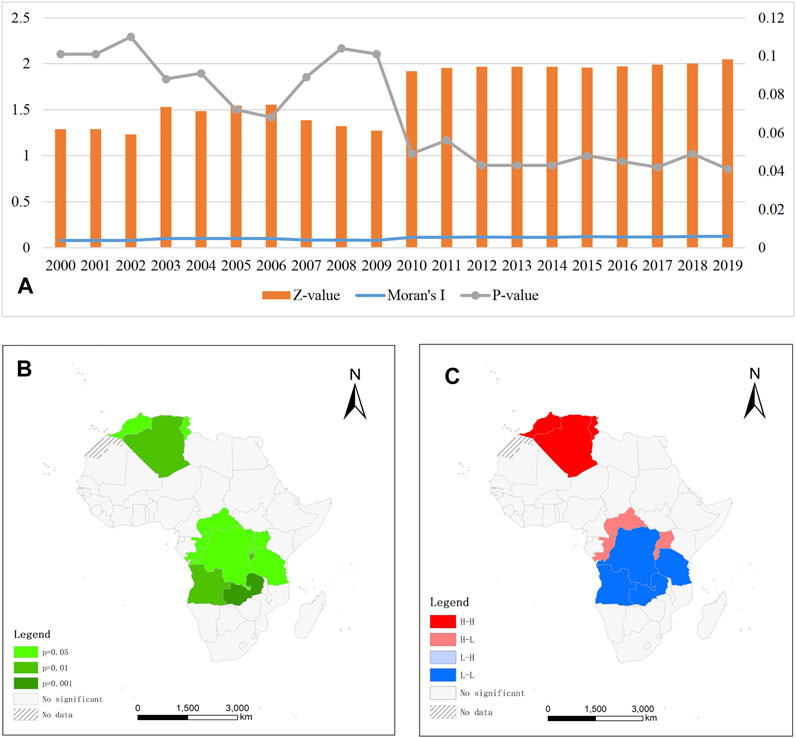
FIGURE 3. Spatial correlation map. (A) Global Moran’s | Z ≥1.96 after 2020 is considered that the forest cover change in the study area shows spatial autocorrelation, | ∈ (0, 1] forest cover change is positively correlated with spatial distance, and p ≤0.05 after 2012 shows significant spatial aggregation characteristics in figures (B,C). (B) Significant Map (2012–2019). The forest cover change in the study area has begun to cluster in 2010 and more significant in 2012, and the degree of spatial agglomeration increased annually. (C) Clustered map (2012–2019). The spatial clustering of the hot spots has been divided into two regions: Morocco and Tunisia forest cover expanding area based on Algeria as the hot spot agglomeration; Angola, the Democratic Republic of the Congo, and Tanzania have been reduced low-forest coverage in Angola, Rwanda, Uganda, Central African Republic, and Congo high–low zone.
4.3 GPCA Calculation Results and Analysis
A 54×21×21 dimensional sequential stereo data table was constructed, including sample points from 54 countries and regions, 21 driving index variables, and 21 data tables from 2000 to 2020. According to the analysis steps of GPCA, the global principal component factors were extracted by SPSS 26. In the analysis, the maximum variance transaction rotation method is adopted. After 11 iterations, the results tend to converge. According to the principle that the eigenvalue is greater than 1, a total of 6 principal components are extracted. The cumulative contribution rate of the first principal component is 33.189%; the cumulative contribution rate of the second principal component is 17.490%; the third to sixth principal components play a similar role, with accumulative contribution rates of 6.966%, 6.052%, 5.355% and 5.023%, respectively. In the process of reducing the dimension of the data table from 21 to 6, 74.075% of the information in the original data table is retained, and the original features are basically completely preserved (See Table 4). The six main components are population, rural population, urban population, labor force, GDP, unemployment, death rate, foreign direct investment (net inflows), consumer price index, and terrestrial protected areas (% of the total land area).
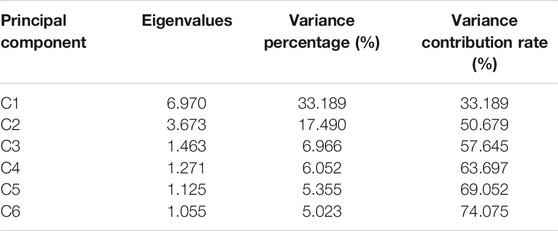
TABLE 4. Generalized eigenvalues of principal components and accumulative percentage.
In order to investigate whether there is a certain linear relationship among economic, social, demographic, and geographical evaluation indexes affecting forest cover and whether GPCA analysis method is suitable, the KMO test and Bartlett sphericity test are selected for analysis, and the results are shown in Table 5. The KMO statistic is 0.783 and Sig. < 0.005, indicating that there is correlation for each variable, and the factor analysis is effective and got better results.

TABLE 5. KMO and Bartlett’s test.
4.4 Forest Cover Change and Driving Factors on the Geographical Detector
The geographical detector is an emerging statistical method for driving force and factor analysis of spatial data (Wang, 2010), which is mainly composed of four detectors: factor detector, interactive detector, ecological detector, and risk detector. The first three detection functions are mainly adopted and conducted. Factor detection: The influence of economic, social, demographic, and natural factors (Table 2) on the spatial distribution of forest cover change can be calculated via factor detection analysis (q value). The larger the q value is, the greater the influence of this factor on forest cover change is. Ecological detection: Ecological detection is demonstrated to compare the significant differentiation in the spatial distribution of forest cover amongst economic, social, demographic, and natural factors. Interaction detection: The interactions are implemented amongst different influence factors. Based on the single factor q value comparative analysis and the q value sum of the two factors and the q value following the two interactive factors, we can identify whether the two post-interactive factors increase or decline their influence on the spatial distribution of forest cover or whether play an independent role themselves.
Factor detectors are first used to obtain the q values for five targeted years of 2000, 2005, 2010, 2015, and 2019 in the timescale (shown in Table 6). The explanatory power of the bold numerical factors all passed the 95% significance level. Overall, some significant factors have a great impact on the spatial differentiation analysis of forest cover change, such as consumer price index, agricultural land area, goods import, urbanization population, goods export, and human birth rate. These six factors can be regarded as the leading factors affecting forest cover change this year in terms of their Q values which are all greater than 0.25. However, each driving factor showed a trend of fluctuation in the temporal scale. Consumer price index and urban population had significant effects in 2000 only, with q values of 0.48 and 0.29, respectively. The effect of the human birth rate on forest cover increased annually until it reached a significant level in 2019, with a value of 9 of 0.25. Total population, land area, and agricultural land area played important roles in the disturbance of forest cover all in this time span. The weight of the total population decreased annually, while the proportion of agricultural land increased. The former decreased from 0.36 down to 0.26 between 2019 and 2020, and the latter increased from 0.17 to 0.45 from 2019 to 2000.
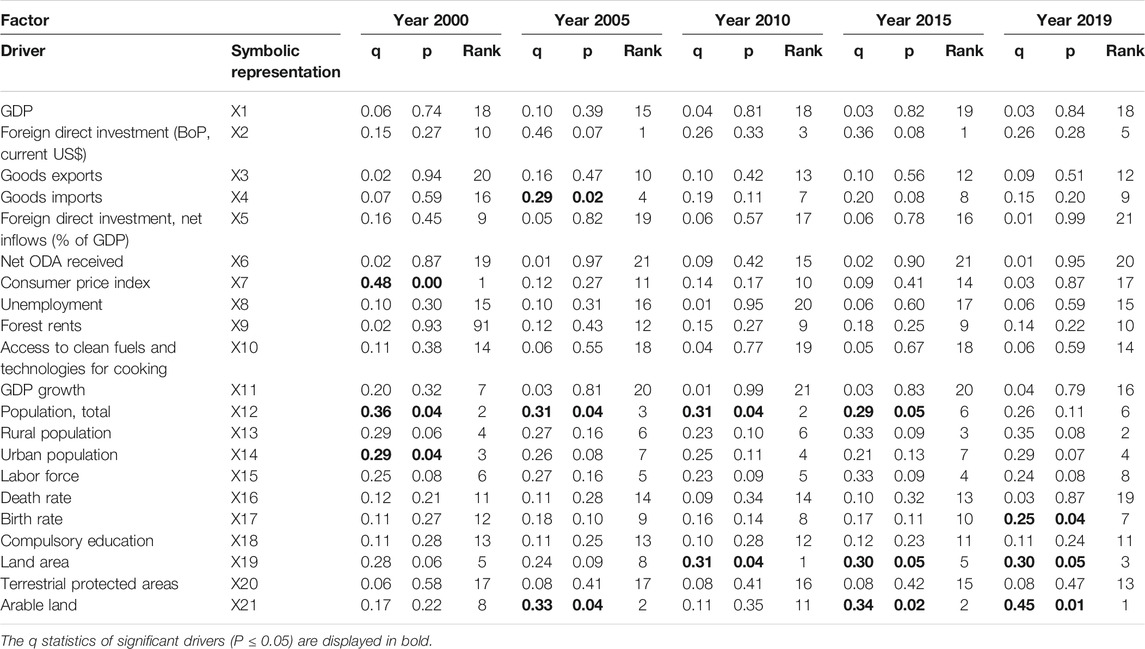
TABLE 6. Factor detection results of spatial differentiation of forest cover change.
To further explore the changes of interpreting power of forest disturbance based on the interaction of different driving factors, the sample analysis is implemented based on the demonstrated illustration of 2000, 2005, 2010, 2015, and 2019. The interactive factor detection mechanism of the leading factors picked on forest cover change was analyzed (shown in Table 7): The demonstration illustrated that each factor was significantly correlated and independent in rare cases. About 76.67% of the interaction categories among several leading factors were non-linear enhancement, more than 18.33% were dual factors enhancement, and only 5% were single factor independence. The explanatory power of factor interaction illustrates differentiation and shows the characteristics of fluctuation in timescale excluded that the interaction of X4 (goods import) and X14 (urban population) is increasing from 0.71 to 0.88 between 2019 and 2020.
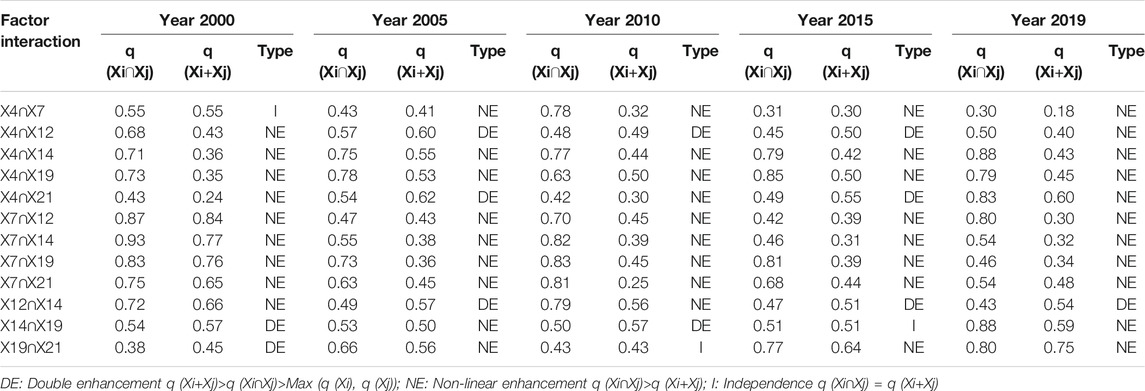
TABLE 7. Interactive detection results of spatial differentiation of forest cover change.
5 Discussion
Many scholars have been sorting out, improving, and verifying the development and evolution results of various direct driving factors under the UN SDGs constantly (Griggs et al., 2013; Weitz et al., 2019a; Weitz et al., 2019b; Guo, 2020; Guo et al., 2020; Guo et al., 2021). The IPBES global assessment provides a global review of the scientific evidence on major environmental and secondary social impacts of drivers of change, including the drivers, pressures, and responses sections of the DPSIR framework (Merino et al., 2019). The impact of geographical and climatic factors on forest cover change is likely to occur over a longer time series, but human activities are likely to be more rapid and straightforward, excluding accidental natural disasters, pest, and disease disasters or forest fires. The potential synergistic effect research method between the forest cover index in UN SDGs and human social and economic development has been illustrated further in terms of current research contributions.
Multiple driven factors play a role of different structure of the 6 principal components via global principal component analysis. The significant factors are influencing the forest cover change via the geographical detector monitoring all drivers annually. The two results of each analysis have been demonstrated slightly different subject to the inconsistency of research purpose, timescale, and precision. Global principal component analysis has placed all the data in the last 20 years on the same 3D observation model to abstract dimension reduction. The results of driving factors influencing the last 20 years have been extracted. The geographical detector has detected the significant drivers of forest cover change each year to verify and summarize the significant common factors over the past 20 years. The both extracted analyses of driving factors of forest cover change can be in support of making decision further.
A comprehensive analysis of 21 driving factors in 54 countries and regions in the target area for 20 consecutive years was completed by using geographical detectors (see Figure 4), and forest cover change and driving factors can be summarized into four stages: in the first stage, the factors causing the reduction of forest cover are complicated in the first 4 years of the 21st century (2000–2003). The consumer price index (CPI) has the significant and highest explanatory power, which can reflect the degree of inflation or deflation. The second is the total population. The pressure caused by the total and urban population also shows a significant impact. In addition, almost all other factors showed significantly different trends in the effects of two factors at the same time. In the second stage, the rapid growth of the total population in the study area was the most important and significant explanatory factor driving the rapid decrease of forest cover from 2004 to 2009. Meanwhile, the factors promoting regional economic development were different from population pressure and played a moderating role in influencing the change of forest cover gradually. In the third stage, the expansion of cultivated land in the study area has a significant impact year by year from 2010 to 2015, especially in the area with a larger land area, the amount of deforestation and land conversion is greater. The growth of total population still has a relatively significant explanation for forest change, but the impact value decreases year by year. In Stage 4, the growth of the cultivated land for forest cover to reduce the influence of the significant increase from 2016 to 2019 (Williams et al., 2021), the chance of vast country in deforestation is greater, and with the development of economy, the total population bearing pressure on forest change is no longer significant; the neo-birth rate can significantly represent more of a certain explanation on forest cover change; in addition, changes in the number of rural population have significant differences with other factors (≥3) on the spatial distribution of forest cover, which becomes extremely complicated.
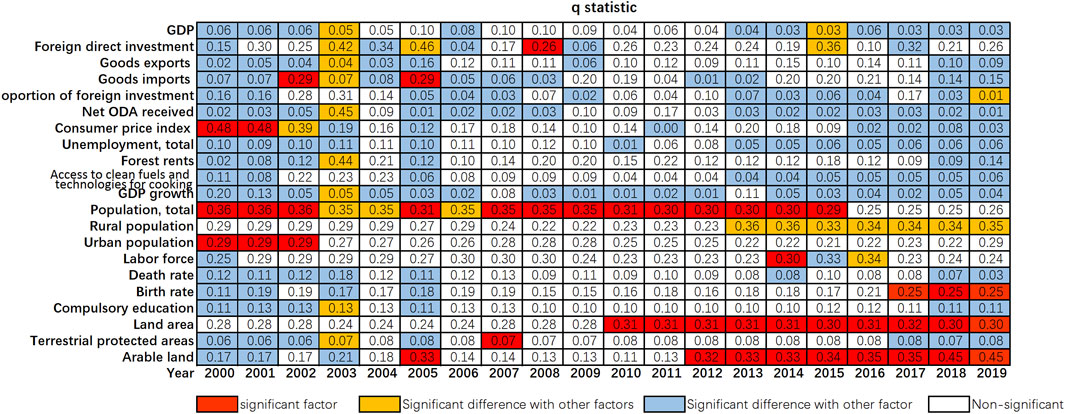
FIGURE 4. Sketch map of differential superposition analysis and identification of significance, which of driving factors affecting forest cover change in the study area. Note: q value is the explanatory degree of driving factors to forest cover change in the study area. Red represents the driving factors with an explanatory degree of more than 95% confidence. Yellow represents the significant difference between the effects of the linear factor and other factors (≥3) on the spatial distribution of forest cover. Blue indicates that there is a significant between the effect of one factor and another or two factors on the spatial distribution of forest cover. White indicates no significant difference compared with other factors (95% confidence).
6 Conclusion
Forest cover change assessment has become one of the key indicators of Sustainable Development Goals (SDGs). Africa is experiencing unprecedented deforestation of forest resources. The study area is composed of data from 54 countries and regions from 2000 to 2020. Spatial autocorrelation analysis, global principal component analysis, and geographic detector model are used to illustrate the spatio-temporal patterns of forest cover change in Africa. The driving effects of population growth, economic and trade, social development, and cultivated land expansion on forest cover change in different timescale were analyzed in geographical spatial heterogeneity. Relevant conclusions are as follows:
1) The distribution of forests in Africa is extremely uneven. Based on the distributed quantities, Africa has the largest forest area in Central Africa, the second in East Africa, the third in West Africa, the fourth in South Africa, and the fifth in North Africa. In the past 20 years, the forest area decreased significantly, and the forest area decreased more significantly than that in West Africa including the Democratic Republic of the Congo, Angola, Tanzania, Mozambique, Sudan, Nigeria, Botswana and Cote d 'Ivoire, Zambia, Chad, Somalia, Ethiopia, Namibia, and Cameroon. Only 7 countries showed a net increase in the forest area during the 20 years, and only 5 countries showed a significant increase (over 200 square kilometers). Algeria, Morocco, and Tunisia in North Africa, East Africa, and Swaziland in South Africa have presented an increase status, but forest growth accounts for only 1% of the loss.
2) The forest cover change in the study area began to show the clustering from 2010 to 2012 and became more significant. The degree of spatial agglomeration increased year by year, and the spatial correlation of forest cover change between neighboring countries or regions became increasingly stronger. The LISA index was used to study the local agglomeration characteristics of forest cover change. The spatial clustering of hot spots was divided into two regions: first, Algeria as a hot spot clustering in Morocco and Tunisia increased forest cover area; in the other place, Zambia was the coldest spot with a significant clustering in Angola, the Democratic Republic of the Congo, and Tanzania have reduced their low-forest coverage to Angola, Rwanda, Uganda, Central African Republic, and Congo high–low zone.
3) Total population, land area, cultivated land, urban population, consumer price index, and birth rate are the main factors influencing the temporal evolution of forest cover change in Africa. It can be divided into four stages to interpret the different explanations and significance of each factor for forest cover change in the study area. In the first stage, the factors causing the reduction of forest cover are complicated in the first 4 years of the 21st century (2000–2003). The consumer price index (CPI) has the significant and highest explanatory power, which can reflect the degree of inflation or deflation. The second is the total population. The pressure caused by the total and urban population also shows a significant impact. In addition, almost all other factors showed significantly different trends in the effects of two factors at the same time. In the second stage, the rapid growth of the total population in the study area was the most important and significant explanatory factor driving the rapid decrease of forest cover from 2004 to 2009. Meanwhile, the factors promoting regional economic development were different from population pressure and played a moderating role in influencing the change of forest cover gradually. In the third stage, the expansion of cultivated land in the study area has a significant impact year by year from 2010 to 2015, especially in the area with a larger land area, the amount of deforestation and land conversion is greater. The growth of total population still has a relatively significant explanation for forest change, but the impact value decreases year by year. In Stage 4, the growth of the cultivated land for forest cover to reduce the influence of the significant increase from 2016 to 2019, the chance of vast country in deforestation is greater, and with the development of economy, the total population bearing pressure on forest change is no longer significant; the neo-birth rate can significantly represent more of a certain explanation on forest cover change; in addition, changes in the number of rural population have significant differences with other factors (≥3) on the spatial distribution of forest cover, which becomes extremely complicated.
Data Availability Statement
The original contributions presented in the study are included in the article/Supplementary Material; further inquiries can be directed to the corresponding author.
Author Contributions
HX, JL, NF, and GH conceived the research project. HX and HW performed simulations and wrote the manuscript. XZ, TL, ZZ, WW, RY, YG, BC, and QC contributed to model development. All other authors contributed to data and commented on or approved the manuscript.
Conflict of Interest
The authors declare that the research was conducted in the absence of any commercial or financial relationships that could be construed as a potential conflict of interest.
Publisher’s Note
All claims expressed in this article are solely those of the authors and do not necessarily represent those of their affiliated organizations, or those of the publisher, the editors, and the reviewers. Any product that may be evaluated in this article, or claim that may be made by its manufacturer, is not guaranteed or endorsed by the publisher.
References
Afdb, A., and Kouakou, K. L. (2010). Gender, Poverty and Environmental Indicators on African Countries 2010. Available at: https://www.afdb.org/fileadmin/uploads/afdb/Documents/Publications/Gender%20Poverty%20and%20Environmental%20Indicators%20on%20African%20Countries%202010.pdf (Accessed March 20, 2021).
Anselin, L. (1995). Local Indicators of Spatial Association-LISA. Geographical Anal. 27 (2), 93–115.
Assogba, N. P., and Zhang, D. (2018). Factors Influencing the Conservation of Tropical Forest Resources in West Africa. 2018 Conference. Vancouver, British Columbia: International Association of Agricultural Economists.
Barlow, J., Gardner, T. A., Araujo, I. S., Avila-Pires, T. C., Bonaldo, A. B., Costa, J. E., et al. (2007). Quantifying the Biodiversity Value of Tropical Primary, Secondary, and Plantation Forests. Proc. Natl. Acad. Sci. 104, 18555–18560. doi:10.1073/pnas.0703333104
Beckman, J., Sands, R., Riddle, A., Lee, T., and Walloga, J. M. (2017). International Trade and Deforestation: Potential Policy Effects via a Global Economic Model. Washington: Economic Research Report.
Bonan, G. B. (2008). Forests and Climate Change: Forcings, Feedbacks, and the Climate Benefits of Forests. Science 320 (5882), 1444–1449. doi:10.1126/science.1155121
Curtis, P. G., Slay, C. M., Harris, N. L., Tyukavina, A., and Hansen, M. C. (2018). Classifying Drivers of Global forest Loss. Science 361 (6407), 1108–1111. doi:10.1126/science.aau3445
Deacon, R. T. (1994). Deforestation and the Rule of Law in a Cross-Section of Countries. Land Econ. 70, 414–430. doi:10.2307/3146638
Defries, R. S., Rudel, T., Uriarte, M., and Hansen, M. (2010). Deforestation Driven by Urban Population Growth and Agricultural Trade in the Twenty-First century. Nat. Geosci 3 (3), 178–181. doi:10.1038/ngeo756
Diffenbaugh, N. S., and Giorgi, F. (2012). Climate Change Hotspots in the Cmip5 Global Climate Model Ensemble. Climatic Change 114 (3-4), 813–822. doi:10.1007/s10584-012-0570-x
Edwards, D. P., Koh, L. P., and Laurance, W. F. (2012). Indonesia's Redd+ Pact: Saving Imperilled Forests or Business as Usual? Biol. Conservation 151 (1), 41–44. doi:10.1016/j.biocon.2011.10.028
FAO (2015). Global Forest Resources Assessment 2015. Available at: www.fao.org/forest-resources-assessment/past-assessments/fra-2015/en/(Accessed May 1, 2021).
Forzieri, G., Girardello, M., Ceccherini, G., Spinoni, J., Feyen, L., Hartmann, H., et al. (2021). Emergent Vulnerability to Climate-Driven Disturbances in European Forests. Nat. Commun. 12 (1), 1081. doi:10.1038/s41467-021-21399-7
Garzuglia, M., and Saket, M. (2003). Wood Volume and Woody Biomass: Review of FRA 2000 Estimates. Rome: Forest Resources Assessment Programme Working Paper. Available at: https://agris.fao.org/agris-search/search.do?recordID=XF2016031581 (Accessed March 15, 2021).
Gbetnkom, D. (2009). Forest Depletion and Food Security of Poor Rural Populations in Africa: Evidence from cameroon. J. Afr. Economies 18 (2), 261–286. doi:10.1093/jae/ejn012
Geist, H. J., and Lambin, E. F. (2002). Proximate Causes and Underlying Driving Forces of Tropical Deforestation. Bioscience 52 (2), 143–150. doi:10.1641/0006-3568(2002)052[0143:pcaudf]2.0.co;2
Giam, X. (2017). Global Biodiversity Loss from Tropical Deforestation. Proc. Natl. Acad. Sci. USA 114, 5775–5777. doi:10.1073/pnas.1706264114
Glaser, G. (2012). Policy: Base Sustainable Development Goals on Science. Nature 491 (7422), 35. doi:10.1038/491035a
Goodchild, M. F., and Glennon, J. A. (2010). Crowdsourcing Geographic Information for Disaster Response: a Research Frontier. Int. J. Digital Earth 3 (3), 231–241. doi:10.1080/17538941003759255
Griggs, D., Stafford-Smith, M., Gaffney, O., Rockström, J., Öhman, M. C., Shyamsundar, P., et al. (2013). Sustainable Development Goals for People and Planet. Nature 495 (7441), 305–307. doi:10.1038/495305a
Guo, H. D. (2020). Big Earth Data in Support of the Sustainable Development Goals. Beijing: Science Press, EDP Sciences.
Guo, H., Chen, F., Sun, Z., Liu, J., and Liang, D. (2021). Big Earth Data: a Practice of Sustainability Science to Achieve the Sustainable Development Goals. Sci. Bull. 66 (11), 1. doi:10.1016/j.scib.2021.01.012
Guo, H., Nativi, S., Liang, D., Craglia, M., Wang, L., Schade, S., et al. (2020). Big Earth Data Science: an Information Framework for a Sustainable Planet. Int. J. Digital Earth 13 (7), 743–767. doi:10.1080/17538947.2020.1743785
Hansen, M. C., Potapov, P. V., Moore, R., Hancher, M., Turubanova, S. A., Tyukavina, A., et al. (2013). High-resolution Global Maps of 21st-century forest Cover Change. SCIENCE 342, 850–853. doi:10.1126/science.1244693
Harris, N. L., Gibbs, D. A., Baccini, A., Birdsey, R. A., de Bruin, S., Farina, M., et al. (2021). Global Maps of Twenty-First century forest Carbon Fluxes. Nat. Clim. Chang. 11, 234–240. doi:10.1038/s41558-020-00976-6
Heitzig, J., Kittel, T., Donges, J. F., and Molkenthin, N. (2016). Topology of Sustainable Management of Dynamical Systems with Desirable States: from Defining Planetary Boundaries to Safe Operating Spaces in the Earth System. Earth Syst. Dynam. 7, 21–50. doi:10.5194/esd-7-21-2016
Hoang, N. T., and Kanemoto, K. (2021). Mapping the Deforestation Footprint of Nations Reveals Growing Threat to Tropical Forests. Nat. Ecol. Evol. 5, 845–853. doi:10.1038/s41559-021-01417-z
Hosonuma, N., Herold, M., De Sy, V., De Fries, R. S., Brockhaus, M., Verchot, L., et al. (2012). An Assessment of Deforestation and forest Degradation Drivers in Developing Countries. Environ. Res. Lett. 7 (4), 044009. doi:10.1088/1748-9326/7/4/044009
Jha, C., S., Manaswini, G., Singh, S., and Sathish, K. V. (2016). Conservation Priorities of forest Ecosystems: Evaluation of Deforestation and Degradation Hotspots Using Geospatial Techniques. Ecol. Eng. J. Ecotechnology 91, 333–342. doi:10.1016/j.ecoleng.2016.03.007
Kaimowitz, A. D. (1999). Rethinking the Causes of Deforestation: Lessons from Economic Models. World Bank Res. Observer 14 (1), 73–98. doi:10.2307/3986539
Kaimowitz, D., Mendez, P., Puntodewo, A., and Vanclay, J. K. (2002). Spatial Regression Analysis of Deforestation in Santa Cruz, Bolivia. Gainesville: OAI.
Kim, M. C., and Kim, J.-K. (2010). “Digital divide: Conceptual Discussions and prospect,” in The Human Society and the Internet-Related Socio-Economic Issues (Springer), 78–91.
Kouakou, K. L. (2005). Gender, Poverty and Environmental Indicators on African Countries[J]. Tunis, Tunisia: Gender, Poverty and Environmental Indicators on African Countries.
Macdicken, K. G. (2015). Global forest Resources Assessment 2015: what, Why and How? For. Ecol. Manag. 352, 3–8. doi:10.1016/j.foreco.2015.02.006
Mainardi, S. (1998). An Econometric Analysis of Factors Affecting Tropical and Subtropical Deforestation/'N Ekonometriese Analise Oor Faktore Wat Tropiese En Subtropiese Ontbossing Beïnvloed. Agrekon 37 (1), 23–65. doi:10.1080/03031853.1998.9523494
Merino, L., Viña, A., García Frapolli, E., Ainul Hussain, S., AkongMinang, P., and Nagabhatla, N. (2019). “Chapter 2. Status and Trends; Indirect and Direct Drivers of Change,” in IPBES Global Assessment on Biodiversity and Ecosystem Services (Bonn, Germany: IPBES secretariat).
Midgley, G. F., and Bond, W. J. (2015). Future of African Terrestrial Biodiversity and Ecosystems under Anthropogenic Climate Change. Nat. Clim Change 5, 823–829. doi:10.1038/NCLIMATE2753
Moran, P. A., and Ap, P. (1950). Notes on Continuous Stochastic Phenomena. Biometrika 37 (1-2), 17–23. doi:10.1093/biomet/37.1-2.17
Mushi, H., Yanda, P. Z., and Kleyer, M. (2020). Socioeconomic Factors Determining Extraction of Non-timber forest Products on the Slopes of Mt. Kilimanjaro, tanzania. Hum. Ecol. 48 (1), 695–707. doi:10.1007/s10745-020-00187-9
National Remote Sensing Center of China (2019). Global Ecosystem and Environment Observation Analysis Research Cooperation (GEOARC) Global forest Cover and Changes. Available at: http://www.chinageoss.cn/geoarc/en/news/2019A.html (Accessed March 15, 2021).
Parmesan, C., and Yohe, G. (2003). A Globally Coherent Fingerprint of Climate Change Impacts across Natural Systems. Nature 421 (6918), 37–42. doi:10.1038/nature01286
Pendrill, F., Persson, U. M., Godar, J., and Kastner, T. (2019). Deforestation Displaced: Trade in forest-risk Commodities and the Prospects for a Global forest Transition. Environ. Res. Lett. 14 (5), 055003. doi:10.1088/1748-9326/ab0d41
Réjou-Méchain, M., Mortier, F., Bastin, J.-F., Cornu, G., Barbier, N., Bayol, N., et al. (2021). Unveiling African Rainforest Composition and Vulnerability to Global Change. Nature 593 (7857), 90–94. doi:10.1038/s41586-021-03483-6
Rudel, T., and Roper, J. (1997). The Paths to Rain forest Destruction: Crossnational Patterns of Tropical Deforestation, 1975-90. World Dev. 25 (1), 53–65. doi:10.1016/S0305-750X(96)00086-1
Ruf, F., Schroth, G., and Doffangui, K. (2015). Climate Change, cocoa Migrations and Deforestation in West Africa: what Does the Past Tell Us about the Future? Sustain. Sci. 10 (1), 101–111. doi:10.1007/s11625-014-0282-4
Sandel, B., and Svenning, J.-C. (2013). Human Impacts Drive a Global Topographic Signature in Tree Cover. Nat. Commun. 4, 1. doi:10.1038/ncomms3474
Sannigrahi, S., Bhatt, S., Rahmat, S., Paul, S. K., and Sen, S. (2018). Estimating Global Ecosystem Service Values and its Response to Land Surface Dynamics during 1995–2015. J. Environ. Manage. 223, 115–131. doi:10.1016/j.jenvman.2018.05.091
Shimada, M., Itoh, T., Motooka, T., Watanabe, M., Shiraishi, T., Thapa, R., et al. (2014). New Global forest/non-forest Maps from ALOS PALSAR Data (2007-2010). Remote Sensing Environ. 155, 13–31. doi:10.1016/j.rse.2014.04.014
Stévart, T., Dauby, G., Lowry, P. P., Blach-Overgaard, A., Droissart, V., Harris, D. J., et al. (2019). A Third of the Tropical African flora Is Potentially Threatened with Extinction. Sci. Adv. 5 (11), eaax9444. doi:10.1126/sciadv.aax9444
The World Bank (2021). World Development Indicators. Available at: https://datacatalog.worldbank.org/search/dataset/0037712 (Accessed May 1, 2021).
Timothy, E. L., Mike, U., and Marks, D. (2004). The Dynamics of Rainfall Interception by a Seasonal Temperate Rainforest. Agric. For. Meteorology 124 (3–4), 171–191. doi:10.1016/j.agrformet.2004.01.010
UNESCO (2021). Education in Afica. Available at: http://uis.unesco.org/en/topic/education-africa (Accessed May 1, 2021).
United Nations, Department of Economic and Social Affairs, Population Division (2019). World Population Prospects 2019, Custom Data Acquired via Website. Available at: https://www.un.org/development/desa/pd/node/1114 (Accessed March 15, 2021).
United Nations, Department of Economic and Social Affairs, Population Division (2017). World Population Prospects: The 2017 Revision, Key Findings and Advance Tables. New York, NY: Working Paper No. ESA/P/WP/248.
Wang, J. F., and Xu, C. D. (2017). Geodetector:principle and Prospective. Acta GeographicaSinica 72 (1), 116–134. doi:10.1016/j.ecolind.2016.08.001
Weitz, N., Carlsen, H., Skanberg, K., Dzebo, A., and Viaud, V. (2019b). SDGs and the Environment in the EU: A Systems View to Improve Coherence. Stockholm, Sweden: Stockholm Environment Institute. Available at: https://www.sei.org/wp-content/uploads/2019/10/sei-2019-pr-weitz-sdg-synergies-eu-env.pdf (Accessed July 16, 2021).
Weitz, N., Carlsen, H., and Trimmer, C. (2019a). SDG Synergies: An Approach for Coherent 2030 Agenda Implementation. Stockholm, Sweden: Stockholm Environment Institute. Available at: https://www.sei.org/publications/sdg-synergies-factsheet/(Accessed July 16, 2021).
Williams, D. R., Clark, M., Buchanan, G. M., Ficetola, G. F., Rondinini, C., and Tilman, D. (2021). Proactive Conservation to Prevent Habitat Losses to Agricultural Expansion. Nat. Sustain. 4, 314–322. doi:10.1038/s41893-020-00656-5
Wilson, K. B., Hanson, P. J., Mulholland, P. J., Baldocchi, D. D., and Wullschleger, S. D. (2001). A Comparison of Methods for Determining forest Evapotranspiration and its Components: Sap-Flow, Soil Water Budget, Eddy Covariance and Catchment Water Balance. Agric. For. Meteorology 106 (2), 153–168. doi:10.1016/s0168-1923(00)00199-4
World Bank Group (2020). September 2020 PovcalNet Update: What’s New (English). Available at: http://documents.worldbank.org/curated/en/144451599591697923/September-2020-PovcalNet-Update-What-s-New (Accessed September 1, 2020).
Keywords: data-driven, forest cover change, driving factors, spatio-temporal features, Big Earth Data, environmental modeling
Citation: Xiao H, Liu J, He G, Zhang X, Wang H, Long T, Zhang Z, Wang W, Yin R, Guo Y, Cheng B and Cao Q (2022) Data-Driven Forest Cover Change and Its Driving Factors Analysis in Africa. Front. Environ. Sci. 9:780069. doi: 10.3389/fenvs.2021.780069
Received: 20 September 2021; Accepted: 06 December 2021;
Published: 07 January 2022.
Edited by:
Yizhe Zhan, MetService, New ZealandReviewed by:
Tianhai Cheng, Institute of Remote Sensing and Digital Earth (CAS), ChinaShi Shen, Beijing Normal University, China
Copyright © 2022 Xiao, Liu, He, Zhang, Wang, Long, Zhang, Wang, Yin, Guo, Cheng and Cao. This is an open-access article distributed under the terms of the Creative Commons Attribution License (CC BY). The use, distribution or reproduction in other forums is permitted, provided the original author(s) and the copyright owner(s) are credited and that the original publication in this journal is cited, in accordance with accepted academic practice. No use, distribution or reproduction is permitted which does not comply with these terms.
*Correspondence: Han Xiao, eGlhb2hhbkBhaXJjYXMuYWMuY24=