 Iain Perry1
 Ifan B. Jâms1
 Roser Casas-Mulet1,2,3
 Josefina Hamutoko4
 Angela Marchbank1Selma Lendelvo4Erold Naomab5Benjamin Mapani4,5Simon Creer6
 Heike Wanke4,7Isabelle Durance1
 Peter Kille1*
- 1Water Research Institute, Cardiff University, Cardiff, United Kingdom
- 2Aquatic Systems Biology Unit, TUM School of Life Sciences, Technical University of Munich, Freising, Germany
- 3Environmental Hydrology and Water Resources, Infrastructure Engineering Department, University of Melbourne, Melbourne, VIC, Australia
- 4University of Namibia (UNAM), Windhoek, Namibia
- 5Namibia University of Science and Technology, Windhoek, Namibia
- 6School of Natural Sciences, Bangor University, Bangor, United Kingdom
- 7Department of Geography and Environmental Management, University of the West of England (UWE Bristol), Bristol, United Kingdom
By identifying fragments of DNA in the environment, eDNA approaches present a promising tool for monitoring biodiversity in a cost-effective way. This is particularly pertinent for countries where traditional morphological monitoring has been sparse. The first step to realising the potential of eDNA is to develop methodologies that are adapted to local conditions. Here, we test field and laboratory eDNA protocols (aqueous and sediment samples) in a range of semi-arid ecosystems in Namibia. We successfully gathered eDNA data on a broad suite of organisms at multiple trophic levels (including algae, invertebrates and bacteria) but identified two key challenges to the implementation of eDNA methods in the region: 1) high turbidity requires a tailored sampling technique and 2) identification of taxa by eDNA methods is currently constrained by a lack of reference data. We hope this work will guide the deployment of eDNA biomonitoring in the arid ecosystems of Namibia and neighbouring countries.
Introduction
Freshwaters host a disproportional amount of the Earth’s biodiversity, are vital for human societies, and are under high pressure from human activities (Vörösmarty et al., 2010; Reid et al., 2019). A large proportion of global freshwaters are managed by developing countries (Syed and Famiglietti 2009), where ecosystem and human health are often closely tied (Myers et al., 2013). When ecosystems fail to function properly, they also fail to deliver the goods and services on which the poorest disproportionally rely (Small et al., 2017). The residents of low-income countries are thus likely to be the most vulnerable when freshwater ecosystems collapse (Kumar and Yashiro 2014). However, the ecosystems of low-income countries are monitored less intensely than those of high-income countries (Martin et al., 2012). This is particularly true for freshwater ecosystems (Jackson et al., 2016).
Biomonitoring schemes assess the status of ecosystems by following the dynamics of their underlying biodiversity (Bondaruk et al., 2015) and are traditionally reliant on methods developed in the middle of the 20th Century (Bohan et al., 2017). Typically, these traditional methods are resource-intensive and deployed in the well-understood ecosystems of developed countries (Resh 2007). Traditional biomonitoring methods focus on a relatively narrow taxonomic range and may include the detection of “indicator taxa” which are known to be sensitive to particular environmental conditions (sensu Rosenberg and Resh 1993) or may seek-out specific biological or functional traits (Jackson et al., 2016). A more efficient and cost-effective way of monitoring freshwater ecosystems, that is suitable for developing countries, is needed urgently.
In 1987, Ogram, Sayler and Barkay were instrumental in the advent of eDNA research when they detected bacterial communities in marine sediments (Ogram et al., 1987; Díaz-Ferguson and Moyer, 2014). Microbiologists later pioneered the field of eDNA; but the past decade has seen a rapid development of techniques for detecting macroscopic organisms (Tsuji et al., 2019). Since the 1980s the potential of eDNA as an alternative biomonitoring tool has been discussed at length (Stat et al., 2017; Ruppert et al., 2019). Now, researchers can deploy a broad-suite of primers via a stratified analysis to detect bacteria, algae and eukaryotic organisms from a wide spectrum, as well as highly specific primers to detect key organisms (Biggs et al., 2014; Deiner et al., 2016). An important part of the eDNA approach is the existence of databases that contain reference sequences. These databases allow researchers to identify specific taxa by matching eDNA data collected in the field to known genetic sequences.
In contrast to traditional biomonitoring schemes that are customarily resource-intensive endeavours, both temporally and financially; eDNA analyses promise a rapid, cost-effective and non-invasive biomonitoring tool (Harper et al., 2019). This advancement has the potential to release biomonitoring efforts from the economic constraints of traditional methods for the benefit of under-represented and less resolved ecosystems in developing countries (Resh 2007; Belle et al., 2019). The first step to realising this potential is to develop field and laboratory eDNA protocols for specific ecosystems.
The aim of this study is thus to 1) test field and laboratory eDNA protocols (aqueous and sediment samples) in a range of semi-arid freshwater ecosystems in central and northern Namibia (using gathered eDNA data from a broad-suite of organisms at multiple trophic levels (including algae, invertebrates and bacteria)), and to 2) identify key challenges to the implementation of eDNA methods in the region.
Methods
Study Area
With the semi-arid Kalahari to the east and the arid Namib Desert to the west, the landscape of Namibia is characterised by savannah, extensive livestock farming and a few urban centres. Except for the Orange River in the south, and the Kunene, Okavango, Kwando and Zambezi Rivers in the north, all of the country’s rivers are ephemeral. Mean annual precipitation increases from southwest to northeast. Potential evapotranspiration follows the opposite gradient. The capital, Windhoek, has an arid climate, with an average temperature of 20.1°C, mean annual precipitation of 369 mm/a that occurs in summer (mainly from December to April), and a potential evaporation rate of ∼2,800 mm/a. This study focuses on central and northern Namibia.
Geologically, the northern part of the Cuvelai-Etosha Basin is characterised by thick (up to 600 m), terrestrial, mostly unconsolidated sediments that were deposited during the Late Cretaceaous–Quarternary, known as the Kalahari Group sediments. The southern part (Swakop and Omatako) is covered by the Damara crystalline basements (Thomas and Shaw 1990; Miller 2008). Surface water in the Cuvelai-Etosha Basin drains toward the Etosha Pan or remains in surface depressions (locally called iishana) which form a vast, partly inter-connected channel-like system north-west of the Etosha Pan (Mendelsohn et al., 2013).
Sample Collection
On two separate expeditions (December 2017 at the beginning of the wet season and May 2018 at the beginning of the dry season) we collected aqueous (water-column) and sediment samples from the catchments of the Swakop, Omatako and Cuvelai-Etosha in central and north-central Namibia (Figure 1). Sampling occurred across a range of environment types, some natural (ephemeral rivers and ishana) and others artificial (canals, reservoirs and wells) (Figure 1; Supplementary Table SI1). Aqueous and sedimentary samples were taken from 24 sites across these environment types. Still bottled water (BonAqua® filtered via reverse osmosis and treated with ozone) was poured directly from its original bottles into plastic 500 ml cups to settle over night with other site samples for comparison. Tap water samples (water supply system in Windhoek) were also collected for reference. The canals and wells sampled are excavated areas for water transport and supply.
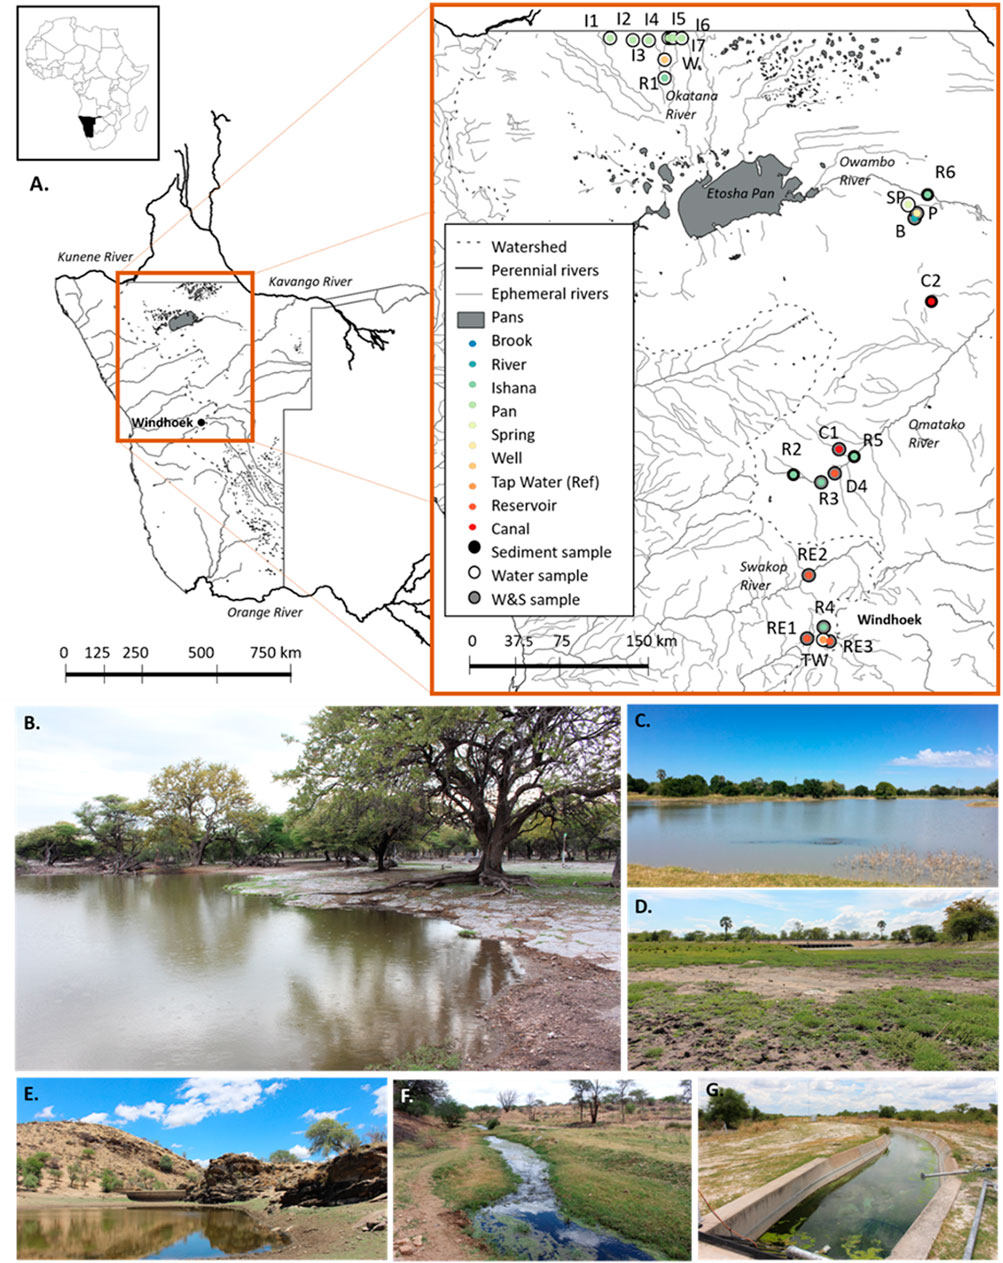
FIGURE 1. (A) Study area and sampling sites. A range of artificial (canal-C, reservoir-RE, hand-dug wells-W, tap water in Windhoek used as a reference-TW) and natural (river-R, brook-B, spring-SP, ishana-I, and pan-P) environment types were sampled. Sampling sites are denoted by points and corresponding names (e.g. C1, R2, I3). The inner colours of points indicate the environment types sampled. For each site, the outer colours of points indicate whether samples were collected of: sediments only (black), water only (white) or both sediments and water (grey). Generated using QGIS (QGIS Development Team, 2019). Examples of surveyed environment types include a pan (B), ishana (C), river (dry) (D), a reservoir (E), a river (F), and a canal (G). Photographs: Rhidian Thomas and Roser Casas-Mulet.
Aqueous (Water-Column) Sampling
All aqueous samples (December 2017 and May 2018) were preserved with RNAlater® in sealed filters, kept cool and in the dark. Nitrile gloves were worn throughout. Aqueous samples collected in December 2017 were filtered in-situ, following the protocol presented in Laramie et al. (2015). Collected water volumes varied between 70 and 900 ml in line with water availability for collection. After a short sedimentation period in the sample bottles, we poured the upper layer of the samples into a funnel held with a utility clamp to a sturdy metal stand that was attached to a SterivexTM filter (0.22 μm aperture). The filter was in turn connected to a Nalgene® polypropylene vacuum filtering flask (1,000 ml volume, Figure 2). We filtered the water using a Nalgene® hand-operated PVC vacuum pump attached to the flask, until the filter was blocked with particulates or to a maximum water volume of 900 ml.
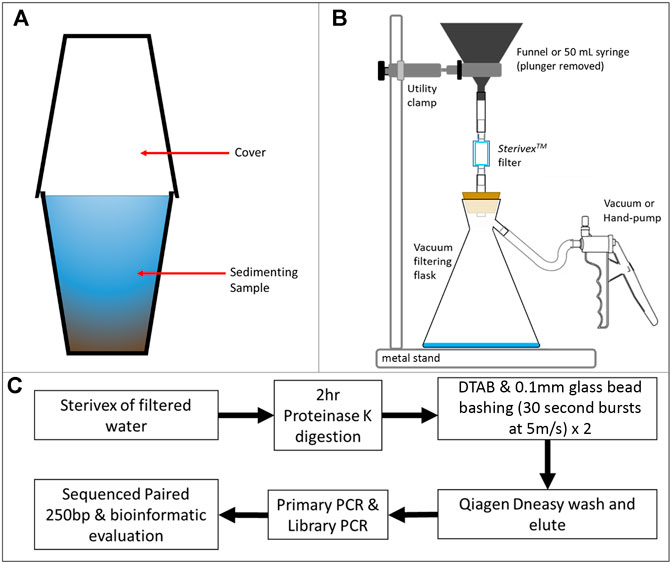
FIGURE 2. eDNA-particulate filtration and eDNA extraction workflow. (A) Sedimentation of water samples in preparation for filtering (to minimise blockage of filters). (B) Filtration of samples to collect and preserve eDNA on a 0.22 μm filter. Water passed through a SterivexTM filter (0.22 μm aperture) from either a funnel or 50 ml sterile syringe with the plunger removed. The sample was drawn under powered vacuum or hand pump, depositing eDNA on the filter. (C) Workflow for sampling, DNA extraction, clean-up, PCR and library generation for sequencing and bioinformatic evaluation.
In May 2018, in-situ filtering was not possible due to high sediment content. Aqueous samples were collected using 330 ml bottles. Bottles were sourced from a plastics supplier in the Oshakati area and used only once. Bottles were unused, but they were not stored by the supplier in a way that prevented dust and other airborne contaminants to enter, therefore they were considered equally exposed to ambient DNA material. Future studies would bring sterile containers to sampling sites. To facilitate the filtering processes, samples were transported to a temporary processing laboratory. Samples were kept cool and out of direct sunlight between collection and transport. We poured ∼475 ml of a ∼500 ml water sample into a single plastic cup, leaving any sediment that had settled during transit behind in the collection bottles. Sediment was allowed to settle under gravity for periods of between 12 and 60 h in covered plastic cups (Figure 2). This process was performed for all aqueous samples collected in May 2018. Cups were only used once, but in a similar manner to the bottles used to collect the samples, cups were not stored pre-use in a way that prevented airborne contamination, and so were considered equally exposed to ambient DNA material. Following the sedimentation period, 50 ml of the upper (clearest) layer of water was gathered using a fresh sterile syringe and attached to a SterivexTM filter (0.22 μm aperture) per sample. By removing the plunger from the filled syringe, the sample could be filtered using electrically powered vacuum pumps (Fisher Scientific type FB65453 Diaphram Pump; Figure 2). Still bottled water purchased locally for the role of a negative control was poured into cups (without using intermediate field collection bottles, a methodological oversite of this sampling trip) and filtered for comparison with field samples. All filters were filled with 2 ml RNAlater® for sample preservation.
Sediment Sampling
Sediment sampling followed the guidelines of Turner et al. (2015), adapted to the range of shallow-water environment types we surveyed. Sediment samples were collected using an Eijkelkamp® hand auger (7 cm external diameter, ∼5 cm internal diameter, 10 cm sample length) attached to a ∼80 cm stainless-steel bar. At each site, we collected 1-2 samples. At sites covered with water, we collected a sediment sample of the saturated area, and another one at the bank or shore that presented unsaturated sediments. At dry sites, we chose areas with high moisture content to take the unsaturated sediment sample. We dropped the auger vertically from a standing position at the edge of the sampling area, to avoid disturbance. After gently pulling the corer to the surface, we collected ∼5 ml of wet surficial sediment (or moist equivalent) from the bottom 2 cm of the sediment core, using a clean scoop. We transferred the sample to a 90 ml Thermo ScientificTM SamcoTM ClicktainerTM, sterilized and pre-assembled a vial and preserved it with LifeGuard® Soil Preservation Solution. We thoroughly cleaned the sediment auger and scoops with bleached water (house hold bleach containing between 3 and 6% sodium hypochlorite) and rinsed them with distilled water between samplings. Nitrile gloves were worn throughout.
DNA Extraction and Sequencing
Following the removal of RNAlater® from a SterivexTM filter via the exit port, 1 ml of digestion buffer (comprising: ATL Buffer, Qiagen Ltd., containing 100 μL of Proteinase K (>600 mAU/ml), Qiagen Ltd.) was introduced onto a filter and incubated with shaking at 21°C for 2 hours. An air-filled sterile syringe was then connected to the outflow of the SterivexTM filter and the digestion buffer pushed into a sterile Eppendorf tube for further processing. Similarly, LifeGuard® Soil Preservation Solution was removed from sediment samples before shaking at 21°C for 2 hours in 1 ml of digestion buffer. The digestion buffer was transferred to a sterile Eppendorf tube. An aliquot of the resultant digestion buffer (200 μL) was vortexed for 30 s with 225 μL of a DNA extraction buffer (1M NaCl, 70 mM Tris, 30 mM Na2EDTA at pH 8.6) and 25 μL of a 10% Dodecyltrimethylammonium bromide (DTAB) solution. Subsequently, 0.1 mm glass beads were introduced together with 200 μL of chloroform and this was agitated using a MP FastPrep-24 Tissue and Cell homogeniser twice using two 30-s bursts at 5 m/s, separated by 5 min cooling on a bed of ice. After being centrifuged at 2000 g for 2 min to separate phases, the supernatant was removed and cleaned using a standard Qiagen DNeasy column purification method (modified from Fawley and Fawley (2004)).
Purified DNA underwent three parallel PCR amplifications as specified in Supplementary Table SI2, with sets of primers (Supplementary Table SI3), with each being engineered to contain a 5’ Nextera tag, designed against 16S ribosomal RNA (Caporaso et al., 2011) to target bacterial communities (Illumina Nextera protocol document 15027987 v01), Ribulose bisphosphate carboxylase large chain (RBCL) to target Algae (Environment Agency document SC140024/R) and Cytochrome C oxidase subunit 1 (COI) for Eukaryote sequences (Folmer et al., 1994; Leray et al., 2013). All PCRs were performed with a negative control. Successfully amplified samples were cleaned using solid phase reversible immobilization beads (SPRI-beads) at a ratio of 1:18 (SPRIselect protocol B24965AA, Beckman Coulter), before undergoing secondary amplification as specified in Supplementary Table SI2 with Illumina-Nextera primers (index i5 and i7). Samples were cleaned using SPRI beads at a ratio of 1:1.8 and eluted in Illumina elution buffer.
The quality of samples was assessed by an Agilent 2,200 TapeStation High Sensitivity D1000 tape (Agilent Technologies, United Kingdom), then balanced in accordance to their molar concentration measured by Qubit dsDNA HS (Life Technologies, United States) spectral analysis and pooled together at an equimolar ratio of 2.7 nM. Samples were sequenced successfully at 2 × 250 bp paired-end read on a Miseq-nano chip (8,000 sample read depth), yielding 646.6M reads (>=Q30) and underwent automatic de-multiplexing.
Assessing Taxonomic Composition Profiles
Reads were trimmed and quality filtered with FastP (Chen et al., 2018) using default parameters before merging with USearch (Edgar 2010) using default parameters. Merged sequences were classified taxonomically via Kraken2 (Wood et al., 2019) using the PlusPFP database (v9/19/2020) for bacterial reads and custom RBCL and COI database built from all NCBI entries for each gene (accessed 27/10/21). The percentage of a samples’ total reads taxonomically identified as belonging to the Species, Genus, Partial Classification (at a higher taxonomic level than species or genus) or Unclassified groupings was calculated. Composite data representing each environment type and two reference water types (Bottled Water and Tap Water) were generated for water and sediment samples. Where more than one sample was collected and successfully amplified for each environment type, sample taxonomic classification percentages were averaged according to their nature (aqueous or sediment) and environment type: Bottled Water, Tap Water, Canal Water, Canal Sediment, Reservoir Water, Reservoir Sediment, Ishana Water, Pan Water, Pan Sediment, River Water, River Sediment, Brook Water, Brook Sediment, Spring Water, Well Water. The Qiime bacterial 16s data analysis pathway was used to test rarefaction of sequencing depth. Composite data was produced to represent the material sampled, water or sediment, together with each of the environment types.
Assessing NCBI Entries
The number of entries to NCBI for each kingdom was retrieved (accessed 2020) from NCBI Taxonomy (NCBI Taxonomy, 2019) for the years 2000, 2010 and 2019; both including and excluding “unclassified,” “uncultured” and “informal.”
Results
Dealing With High Turbidity
Field sampling was generally more successful at the beginning of the wet season (December 2017) than at the beginning of the dry season (May 2018), possibly due to the increasing turbidity of waterbodies as they contract during the course of the dry season. At the beginning of the wet season, 70–900 ml of water could be filtered with a hand-held vacuum pump, with just a short “settling” period, through a SterivexTM (0.22 μm aperture) filter before it became congested with sediment. At the beginning of the dry season, however, a maximum of ∼70 ml of water could be filtered through the same 0.22 μm aperture SterivexTM filters after 3 h of electrically powered vacuum-pumping (Merck Millipore) (the electrically powered pump is generally more powerful than the hand-held vacuum pump). For reference, 1,000 ml of upland stream water in mid Wales, United Kingdom, can be filtered through a Sterivex 0.22 μm aperture filter in around 5–10 min using a peristaltic pump (Jâms 2021 pers. comm.). Therefore, samples collected at the beginning of the dry season were transported off-site to settle for 12–60 h. The clearest, upper 50 ml of a ∼500 ml sample was then filtered using an electrically powered vacuum pump (Merck Millipore). Without a “settling” period, we found 10 ml to be the maximum volume of water that was feasible to filter through a SterivexTM 0.22 μm aperture filter using an electrically powered vacuum pump (Merck Millipore) in the field (Cuvelai-Etosha Basin) during the beginning of the dry season. In this way, a trial 50 ml water sample was collected as 5 × 10 ml samples, each 10 ml filtered through a unique SterivexTM filter. All of the field methodologies yielded eDNA that could be amplified with Bacterial, Algal and Eukaryote primers.
Collection of eDNA Material and Lack of Taxonomic Reference Data
We detected eDNA in a range of environment types. Bacterial eDNA extraction was successful for 96% of aqueous and sediment samples. Algal eDNA and eDNA from a broader range of taxa amplified with Eukaryote COI were extracted from a number of samples (18 and 28% of samples respectively). The method used to extract DNA was sufficient to obtain amplifiable material from tougher algal species such as those that are polysaccharide- and polyphenol-rich (Philips et al., 2006), without degrading the more readily available DNA from other species.
A total of 68 samples (aqueous and sediment) were analysed, of which: 12 amplified for Algae RBCL, 18 for Eukaryote COI and 64 for Bacterial 16s. None of the negative controls yielded amplification. Qiime bacterial 16s data analysis pathway alpha rarefaction (Supplementary Figure SI1) indicated that sufficient sequencing depth was achieved at 2000 reads for all samples. Composite data representing each environment type and two reference water types (Bottled Water and Tap Water), were generated for water/sediment samples. Algal and eukaryote profiles were found in eight environment types; and bacterial profiles were found in all environment types sampled. Figure 3 summarises the taxonomic identification and sample species complexity for each sample that yielded an amplicon. The Algal RBCL profiles achieved the greatest species resolution. Eukaryote COI achieved genus resolution for most of the samples. Bacterial 16s species profiles could identify many individual species, although a large proportion of each profile was comprised of an unknown bacterium that is yet to be formally described. NCBI Taxonomic entry assessment (Supplementary Figure SI2) identified the majority of entries to the NCBI nucleotide (nt) database are unclassified, uncultured or informal.
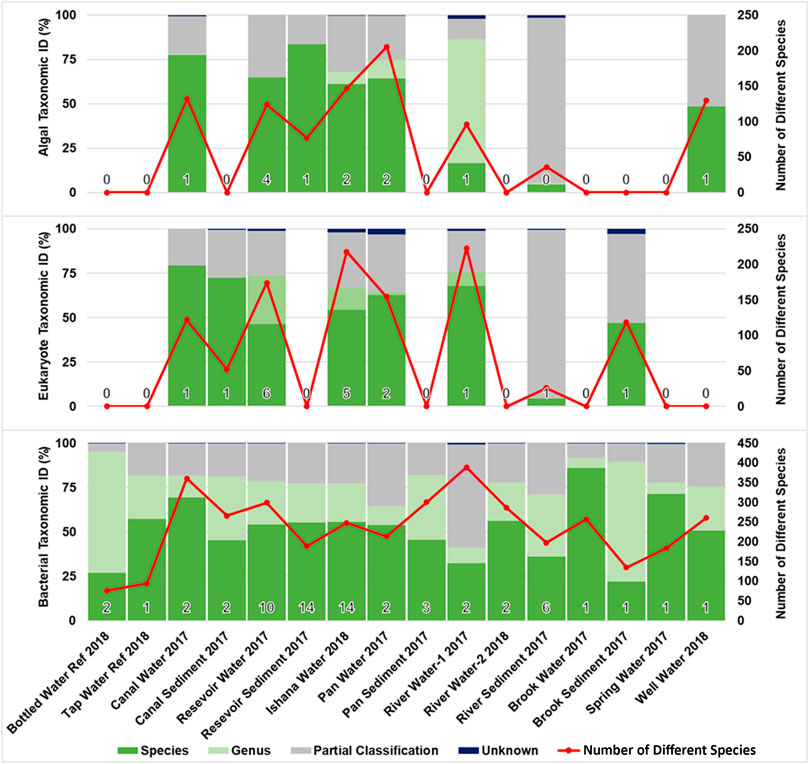
FIGURE 3. Species identification and biodiversity profiles for environment types. The percentage of a samples’ total reads taxonomically identified as belonging to the Species, Genus or Partial Classification (at a higher taxonomic level than species or genus) groupings, expressed as percentage compositions. The Number of Different Species taxonomically identified for each sample is shown; indicating the complexity of sample composition. For each sample, a number (bottom of each bar) indicates the number of amplified samples averaged for each environment type (for Algal (RBCL), Eukaryote (COI) and Bacterial (16s) primers).
Where water turbidity was very high, filtering a volume of 50 ml proved challenging. To identify if performing multiple filtrations at a lower volume produced a similar biodiversity profile, 50 ml filtrations were compared with 10 ml filtrations. While the percentage of species taxonomically identified was similar between methods, slightly fewer species were identified (an average of 264 species in 50 ml samples compared to an average of 249 species in 10 ml samples) and there was increased variability in the number of species identified in 10 ml samples (Figure 4).
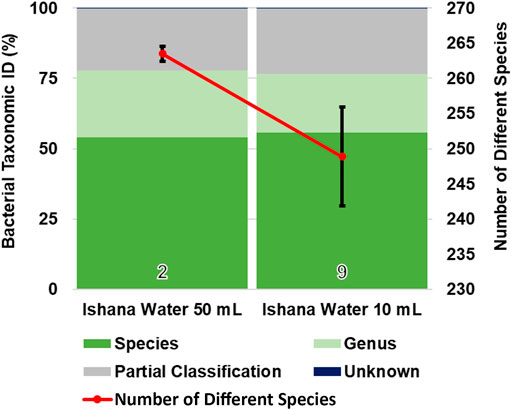
FIGURE 4. Comparison of collection volumes and bacterial biodiversity. The taxonomic identification profile is similar for both collection volumes. Fewer different species (with greater variance between samples) were identified via 10 ml collection volumes, compared to 50 ml collection volumes.
Discussion
Here we successfully gathered eDNA data on a broad suite of organisms at multiple trophic levels (including algae, invertebrates and bacteria) but identified two key challenges to the implementation of eDNA methods in the arid ecosystems of Namibia: 1) high turbidity requires a tailored sampling technique and 2) identification of taxa by eDNA methods is currently constrained by a lack of reference data. The former is a practical challenge, that is relatively easily resolved. The latter, is a systemic challenge that limits the ecological interpretation of eDNA data for developing cost-effective biomonitoring programmes in countries like Namibia. The development and publication of reference libraries is an obvious priority.
Ultimately, sample volumes will be determined by the practicality of filtering, which, in turn, is largely regulated by the turbidity of water samples (Hunter et al., 2019). The main processes leading to an increase in turbidity is the washing-in of particles, loosened by rain/storms, with the overland flow into waterbodies. Wind and water flow also erode soils particles and transport these in the river bed as turbidity. The finer the particles, the longer they stay in suspension leading to a marked decrease in the amount of light transmitted through a sample (an increase in Formazin Attenuation Units) (Wanke et al., 2018). We trialled two approaches to deal with the problem of high turbidity (specifically during the dry season in Namibia): 1) the use of a settling period; 2) the use of multiple SterivexTM filters to collect a desired volume of water. Other approaches to facilitate larger volume filtration include multi-stage filtration and the inclusion of Phenol-Chloroform-Isoamyl (PCI) (Hunter et al., 2019). While allowing a covered sample to settle was effective in generating a layer of relatively clear water that could be filtered, this process may have increased the likelihood of sample contamination through increased handling, and the breakdown of eDNA material during the settling period, a factor that has been demonstrated to occur between 24 and 48 h (Holman et al., 2021). However, much of this research has been performed in temperate climates and flowing waters. It is interesting to postulate, that in a warm climate like that of Namibia’s, some eDNA degradation would have already occurred in the mostly still environments sampled. Where a settling period cannot be shortened or avoided, several filters may be used to collect smaller volumes to a desired total volume of water. While this was effective in the field, the process decreased the total number of species detected when compared with eDNA collected via a “single-site, single-filter” approach. Another possible solution could be the implementation of staged pore-size filtering to reduce initial turbidity. Our study identified practical limitations associated with field sampling including sourcing sampling vessels as well as field based pre-processing. The 2018 sampling trip did not generate a negative control passing through intermediate field collection bottles, an oversight in regard to accurate reporting of definitive species presence. However, amplifications from the 2017 sampling trip that did provide a suitable negative control for the same environment types, did achieve successful amplifications in this proof of concept study. Further, our approach identified the impact of these limitations by performing reference analysis with bottled and tap water. Neither “reference” gave rise to algal or eukaryotic amplicons but both provided a bacterial community signature, with that resulting from bottled water representing a restricted number of species (<100), a comparatively small number when compared to the environmental samples. We recommend taking distilled and pre-sterilised plasticware to the field. Where this is not possible, robust reference controls should be performed and used in subsequent data processing.
Sequencing errors such as tag jumping, as identified by Schnell et al. (2015), can be a downside to metabarcoding eDNA samples, though the development of novel systems is reducing this risk (Caroe and Bohmann, 2020). By following stringent library preparation practices as advised by all patterned flow cell systems (Sayers et al., 2009), this risk can be further reduced. Further emerging technologies including Oxford Nanopore MinIon and Flongle devices offer alternative sequencing methods that would facilitate physical separation of sequence samples, and where samples could be phylogenetically identified in real time; potentially in the field (Pomerantz et al., 2018). The technology does not generate the read accuracy of the Illumina platforms but since species assignment is performed over the full length of the sequence species assignment (using Lowest Common Ancestry LCA—methodology) it is robust (Fan et al., 2021). Alternatively, reads can be polished before classification by kmer as performed here with Kraken2 (Schafran et al., 2020). Additionally the “hand-held” size of these devices allows high portability in remote environments, though this is currently limited by the stability of the pore-based membrane used in each “flow-cell”. Overall, this method is cost-effective, can be used to generate results rapidly for a small batch of samples (6–12) within 24–48 h, requires modest capital investment and can be performed in field settings.
PCR bias was minimised in our study by removing the effect of preferential primer binding to target DNA and amplification experienced when including indices with variable binding efficiencies into the primary amplification primers (Deagle et al., 2014). By exploiting a common universal Nextera-Illumina tag to all primers, any bias introduced by the primer tailoring is common for all targets. However, this study does not identify a universal eukaryote primer that addresses the challenge posed by the variability of the COI primer binding region, which has the potential to exclude some species (Deagle et al., 2014). Bioinformatic processing artefacts can be generated in the clustering of read data, to simplify ultra-complex datasets (Rossberg et al., 2014). For identifying individual species, we advocate informatic extraction (“fishing out”) by means of baits (Alfano, et al., 2021) for target sequences to confirm presence and sequence diversity.
The expanding field of eDNA monitoring can be broken down into a series of incremental steps of complexity and data richness: 1) establishing species eDNA persistence (Hay et al., 2002; Gebhard and Smalla, 2006; Dejean et al., 2011; Andersen et al., 2012; Thomsen et al., 2012; Goldberg et al., 2013; Barnes et al., 2014; Strickler et al., 2015; Turner et al., 2015); 2) description of whole community profiles (Thomsen et al., 2012; Yoccoz 2012; Kelly et al., 2014) and 3) estimation of organism abundance (Lawson-Handley et al., 2017; McClenaghan et al., 2019). Much of this work has been conducted in developed countries (Resh 2007). In July 2019, Belle and colleagues published a comprehensive review of eDNA research in freshwaters. They found a substantial geographical bias: 72% of studies were conducted in North America or Europe. No studies were conducted in Africa. Coble et al. (2019) found a similar geographical bias in their review. A few days after the Belle et al. (2019) publication, Krol et al. (2019) published their comparison of eDNA tools and traditional trapping for monitoring mosquitoes in South Africa. Our findings are congruent with current patterns in eDNA research. Momentum needs to be built for the deployment and adaption of eDNA tools in the countries of southern Africa as a cost-effective way of monitoring ecosystems.
Our study illustrates the problem of geographical bias in research effort. While field and laboratory protocols were successful in gathering genetic data, the ecological interpretation of these data was hindered by a lack of reference libraries. For example, as identified in Supplementary Figure SI2, less than a quarter of samples uploaded to the National Centre for Biotechnology Information (NCBI) reference sequence database are identified; the majority being unclassified, uncultured or informal, significantly reducing the ability to identify species or even genera. The low proportion of bacterial species identified in our study is consistent with the low proportion of taxonomically identified bacteria within the NCBI reference database. The development and publication of reference libraries for the biota of southern Africa is needed (Czachur et al., 2021).
Traditional biomonitoring has been under-represented in developing countries, where properly functioning ecosystems are often intrinsic to the well-being and livelihood of societies. We found that field and laboratory eDNA tools are well suited to monitoring freshwater ecosystems in semi-arid Namibia. While the data published here are not intended to provide definitive proportions or quantities of taxa, it does offer a rare and valuable insight into African freshwater biodiversity. Future studies would investigate the biodiversity patterns observed. The promise of rapid, non-invasive and cost-effective eDNA biomonitoring is currently constrained by a lack of reference sequences. Unlocking the ecological information embedded in genetic data may quickly expand our understanding of the life-sustaining ecosystems of Namibia and neighbouring countries, and how these ecosystems are responding to global change.
Data Availability Statement
The datasets presented in this study can be found in online repositories. The names of the repository/repositories and accession number(s) can be found below: NCBI [accession: PRJNA625425].
Author Contributions
IP performed eDNA extraction, amplification, library preparation and data analysis. IBJ, RC-M, and HW coordinated fieldwork. All authors contributed to the design, implementation and writing of the manuscript.
Funding
This work was funded by the Global Challenges Research Fund (GCRF) project HEFCW GCRF Small Project: Freshwater ecosystems, biodiversity and pathogens in Namibia awarded to Durance, Kille and Mapani. The data collected in December 2017 was done via an EPSRC Global Challenges Research Fund Institutional Sponsorship awarded to Casas-Mulet.
Conflict of Interest
The authors declare that the research was conducted in the absence of any commercial or financial relationships that could be construed as a potential conflict of interest.
Publisher’s Note
All claims expressed in this article are solely those of the authors and do not necessarily represent those of their affiliated organizations, or those of the publisher, the editors and the reviewers. Any product that may be evaluated in this article, or claim that may be made by its manufacturer, is not guaranteed or endorsed by the publisher.
Acknowledgments
We are grateful to all those that advised on, and assisted with, fieldwork.
Supplementary Material
The Supplementary Material for this article can be found online at: https://www.frontiersin.org/articles/10.3389/fenvs.2021.773991/full#supplementary-material
References
Alfano, N., Dayaram, A., Axtner, J., Tsangaras, K., Kampmann, M. L., Mohamed, A., et al. (2021). Non‐invasive Surveys of Mammalian Viruses Using Environmental DNA. Methods Ecol. Evol. 12 (10), 1941–1952. doi:10.1111/2041-210x.13661
Andersen, K., Bird, K. L., Rasmussen, M., Haile, J., Breuning-Madsen, H., Kjaer, K. H., et al. (2012). Meta-barcoding of 'dirt' DNA from Soil Reflects Vertebrate Biodiversity. Mol. Ecol. 21, 1966–1979. doi:10.1111/j.1365-294x.2011.05261.x
Barnes, M. A., Turner, C. R., Jerde, C. L., Renshaw, M. A., Chadderton, W. L., and Lodge, D. M. (2014). Environmental Conditions Influence eDNA Persistence in Aquatic Systems. Environ. Sci. Technol. 48, 1819–1827. doi:10.1021/es404734p
Belle, C. C., Stoeckle, B. C., and Geist, J. (2019). Taxonomic and Geographical Representation of Freshwater Environmental DNA Research in Aquatic Conservation. Aquat. Conserv.: Mar. Freshw. Ecosyst. 29 (11), 1996–2009. doi:10.1002/aqc.3208
Biggs, J., Ewald, N., Valentini, A., Gaborioud, C., Griffiths, R. A., Foster, J., et al. (2014). Analytical and Methodological Development for Improved Surveillance of the Great Crested Newt. Appendix 5. Technical Advice Note for Field and Laboratory Sampling of Great Crested Newt (Triturus Cristatus). environmental DNA. Oxford: Freshwater Habitats Trust.
Bohan, D. A., Vacher, C., Tamaddoni-Nezhad, A., Raybould, A., Dumbrell, A. J., and Woodward, G. (2017). Next-generation Global Biomonitoring: Large-Scale, Automated Reconstruction of Ecological Networks. Trends Ecol. Evol. 32 (7), 477–487. doi:10.1016/j.tree.2017.03.001
Bondaruk, J., Janson, E., Wysocka, M., and Chałupnik, S. (2015). Identification of Hazards for Water Environment in the Upper Silesian Coal Basin Caused by the Discharge of Salt Mine Water Containing Particularly Harmful Substances and Radionuclides. J. Sust. Mining 14 (4), 179–187. doi:10.1016/j.jsm.2016.01.001
Caporaso, J. G., Lauber, C. L., Walters, W. A., Berg-Lyons, D., Lozupone, C. A., Turnbaugh, P. J., et al. (2011). Global Patterns of 16S rRNA Diversity at a Depth of Millions of Sequences Per Sample. Proc. Natl. Acad. Sci. U S A. 108 (1), 4516–4522. doi:10.1073/pnas.1000080107
Carøe, C., and Bohmann, K. (2020). Tagsteady: A Metabarcoding Library Preparation Protocol to Avoid False Assignment of Sequences to Samples. Mol. Ecol. Resour. 20 (6), 1620–1631. doi:10.1111/1755-0998.13227
Chen, S., Zhou, Y., Chen, Y., and Gu, J. (2018). Fastp: an Ultra-fast All-In-One FASTQ Preprocessor. Bioinformatics 34 (17), i884–i890. doi:10.1093/bioinformatics/bty560
Coble, A. A., Flinders, C. A., Homyack, J. A., Penaluna, B. E., Cronn, R. C., and Weitemier, K. (2019). eDNA as a Tool for Identifying Freshwater Species in Sustainable Forestry: A Critical Review and Potential Future Applications. Sci. Total Environ. 649, 1157–1170. doi:10.1016/j.scitotenv.2018.08.370
Czachur, M. V., Seymour, M., Creer, S., and von der Heyde, S. (2021). Novel Insights into marine Fish Biodiversity across a Pronounced Environmental Gradient Using Replicated Environmental DNA Analyses. Environ. DNA 00, 1–10. doi:10.1002/edn3.238
Deagle, B. E., Jarman, S. N., Coissac, E., Pompanon, F., and Taberlet, P. (2014). DNA Metabarcoding and the Cytochrome C Oxidase Subunit I Marker: Not a Perfect Match. Biol. Lett. 10, 20140562. doi:10.1098/rsbl.2014.0562
Deiner, K., Bik, H. M., Mächler, E., Seymour, M., Lacoursière-Roussel, A., Altermatt, F., et al. (2016). Environmental DNA Metabarcoding: Transforming How We Survey Animal and Plant Communities. Mol. Ecol. 26, 5872–5895. doi:10.1111/mec.14350
Dejean, T., Valentini, A., Duparc, A., Pellier,-Cuit, S., Pompanon, F., Taberlet, P., et al. (2011). Persistence of Environmental DNA in Freshwater Ecosystems. PLoS One 6, e23398. doi:10.1371/journal.pone.0023398
Díaz-Ferguson, E. E., and Moyer, G. R. (2014). History, Applications, Methodological Issues and Perspectives for the Use Environmental DNA (eDNA) in marine and Freshwater Environments. Rbt 62 (4), 1273–1284. doi:10.15517/rbt.v62i4.13231
D. M. Rosenberg, and V. H. Resh (Editors) (1993). Freshwater Biomonitoring and Benthic Macroinvertebrates (No. 504.4 FRE) (New York, NY, USA: Chapman & Hall).
Edgar, R. C. (2010). Search and Clustering Orders of Magnitude Faster Than BLAST. Bioinformatics 26 (19), 2460–2461. doi:10.1093/bioinformatics/btq461
Fan, J., Huang, S., and Chorlton, S. D. (2021). BugSeq: a Highly Accurate Cloud Platform for Long-Read Metagenomic Analyses. BMC Bioinformatics 22, 160. doi:10.1186/s12859-021-04089-5
Fawley, M. W., and Fawley, K. P. (2004). A Simple and Rapid Technique for the Isolation of DNA from Microalgae. J. Phycology 40 (1), 223–225. doi:10.1111/j.0022-3646.2004.03-081.x
Folmer, O., Black, M., Hoeh, W., Lutz, R., and Vrijenhoek, R. (1994). DNA Primers for Amplification of Mitochondrial Cytochrome C Oxidase Subunit I from Diverse Metazoan Invertebrates. Mol. Mar. Biol. Biotechnol. 3 (5), 294–299.
Gebhard, F., and Smalla, K. (2006). Monitoring Field Releases of Genetically Modified Sugar Beets for Persistence of Transgenic Plant DNA and Horizontal Gene Transfer. FEMS Microbiol. Ecol. 28, 261–272.
Goldberg, C. S., Sepulveda, A., and Ray, A. (2013). Environmental DNA as a New Method for Early Detection of New Zealand Mudsnails (Potamopyrgus Antipodarum). Freshw. Sci. 32, pp792–800. doi:10.1899/13-046.1
Harper, L. R., Buxton, A. S., Rees, H. C., Bruce, K., Brys, R., Halfmaerten, D., et al. (2019). Prospects and Challenges of Environmental DNA (eDNA) Monitoring in Freshwater Ponds. Hydrobiologia 826 (1), 25–41. doi:10.1007/s10750-018-3750-5
Hay, I., Morency, M.-J., and Séguin, A. (2002). Assessing the Persistence of DNA in Decomposing Leaves of Genetically Modified poplar Trees. Can. J. For. Res. 32, 977–982. doi:10.1139/x02-017
Holman, L. E., Chng, Y., and Rius, M. (2021). How Does eDNA Decay Affect Metabarcoding Experiments. Environ. DNA 201, 1–9. doi:10.1002/edn3.201
Hunter, M. E., Ferrante, J. A., Meigs-Friend, G., and Ulmer, A. (2019). Improving eDNA Yield and Inhibitor Reduction through Increased Water Volumes and Multi-Filter Isolation Techniques. Sci. Rep. 9, 5259. doi:10.1038/s41598-019-40977-w
Jackson, M. C., Weyl, O. L. F., Altermatt, F., Durance, I., Friberg, N., Dumbrell, A. J., et al. (2016). Recommendations for the Next Generation of Global Freshwater Biological Monitoring Tools. Adv. Ecol. Res. 55, 615–636. doi:10.1016/bs.aecr.2016.08.008
Kelly, R. P., Port, J. A., Yamahara, K. M., and Crowder, L. B. (2014). Using environmental DNA to census marine fishes in a large mesocosm. PLoS One 9, e86175. doi:10.1371/journal.pone.0086175
Kumar, P., and Yashiro, M. (2014). “The Marginal Poor and Their Dependence on Ecosystem Services: Evidence from South Asia and Sub-saharan Africa,” in Marginality (Dordrecht: Springer), 169–180. doi:10.1007/978-94-007-7061-4_11
Laramie, M. B., Pilliod, D. S., Goldberg, C. S., and Strickler, K. M. (2015). Environmental DNA Sampling Protocol—Filtering Water to Capture DNA from Aquatic Organisms. U.S. Geol. Surv. Tech. Methods book 2 (15), A13.
Lawson-Handley, L., Lunt, D., Shum, P., Winfiled, I., Read, D., and Hanfling, B. (2017). A Review of Recent Advances in Genetic Methods to Identify Improvements in CAMERAS Partners Monitoring Activities. Hull: Scottish Government.
Leray, M., Yang, J. Y., Meyer, C. P., Mills, S. C., Agudelo, N., Ranwez, V., et al. (2013). A New Versatile Primer Set Targeting a Short Fragment of the Mitochondrial COI Region for Metabarcoding Metazoan Diversity: Application for Characterizing Coral Reef Fish Gut Contents. Front. Zool 10 (34), 34. doi:10.1186/1742-9994-10-34
Martin, L. J., Blossey, B., and Ellis, E. (2012). Mapping where Ecologists Work: Biases in the Global Distribution of Terrestrial Ecological Observations. Front. Ecol. Environ. 10 (4), 195–201. doi:10.1890/110154
McClenaghan, B., Compson, Z. G., and Hajibabaei, M. (2019). Validating Metabarcoding-Based Biodiversity Assessments with Multi-Species Occupancy Models: a Case Study Using Coastal marine eDNA. BioRxiv.
Mendelsohn, J. M., Jarvis, A., and Robertson, T. (2013). A Profile and Atlas of the Cuvelai-Etosha Basin. Windhoek, Namibia: RAISON & Gondwana Collection.
Miller, R. (2008). The Geology of Namibia, 3 Volumes. Windhoek, Namibia: Ministry of Mines and Energy Geological Survey.
Myers, S. S., Gaffikin, L., Golden, C. D., Ostfeld, R. S., H. Redford, K., H. Ricketts, T., et al. (2013). Human Health Impacts of Ecosystem Alteration. Proc. Natl. Acad. Sci. 110 (47), 18753–18760. doi:10.1073/pnas.1218656110
NCBI Taxonomy (2019). NCBI Taxonomy Homepage. Bethesda, MD: NCBI. Available at: https://www.ncbi.nlm.nih.gov/Taxonomy/taxonomyhome.html/index.cgi?chapter=STATISTICS&uncultured=hide&unspecified=hide (Accessed August 29, 2019).
Ogram, A., Sayler, G. S., and Barkay, T. (1987). The Extraction and Purification of Microbial DNA from Sediments. J. Microbiol. Methods 7 (2-3), 57–66. doi:10.1016/0167-7012(87)90025-x
Phillips, N., Smith, C. M., and Morden, C. W. (2006). An Effective DNA Extraction Protocol for Brown Algae. Phycological Res. 49 (2), 97–102.
Pomerantz, A., Peñafiel, N., Arteaga, A., Bustamante, L., Pichardo, F., Coloma, L. A., et al. (2018). Real-time DNA Barcoding in a Rainforest Using Nanopore Sequencing: Opportunities for Rapid Biodiversity Assessments and Local Capacity Building. GigaScience 7 (4), giy033. doi:10.1093/gigascience/giy033
QGIS Development Team (2019). QGIS Geographic Information System. Gossau, Switzerland: Open Source Geospatial Foundation Project
Reid, A. J., Carlson, A. K., Creed, I. F., Eliason, E. J., Gell, P. A., Johnson, P. T. J., et al. (2019). Emerging Threats and Persistent Conservation Challenges for Freshwater Biodiversity. Biol. Rev. 94 (3), 849–873. doi:10.1111/brv.12480
Resh, V. H. (2007). Multinational, Freshwater Biomonitoring Programs in the Developing World: Lessons Learned from African and Southeast Asian River Surveys. Environ. Manage. 39, 737–748. doi:10.1007/s00267-006-0151-8
Rossberg, A. G., Rogers, T., and McKane, A. J. (2014). Current Noise-Removal Methods Can Create False Signals in Ecogenomic Data. Proc. R. Soc. B. 281, 20140191. doi:10.1098/rspb.2014.0191
Ruppert, K. M., Kline, R. J., and Rahman, M. S. (2019). Past, Present, and Future Perspectives of Environmental DNA (eDNA) Metabarcoding: A Systematic Review in Methods, Monitoring, and Applications of Global eDNA. Glob. Ecol. Conservation 17, e00547. doi:10.1016/j.gecco.2019.e00547
Sayers, E. W., Barrett, T., Benson, D. A., Bryant, S. H., Canese, K., Chetvernin, V., et al. (2009). 37, D515. Database Resources of the National Center for Biotechnology Information. Nucleic Acids Res. doi:10.1093/nar/gkn741
Schafran, P. W., Cai, V., Yang, H-P., and Li, F-W. (2020). Metagenomic Characterization of a Harmful Algal Bloom Using Nanopore Sequencing. Biorxiv. Preprint. doi:10.1101/2020.11.13.381525
Schnell, I. B., Bohmann, K., and Gilbert, M. T. P. (2015). Tag Jumps Illuminated - Reducing Sequence-To-Sample Misidentifications in Metabarcoding Studies. Mol. Ecol. Resour. 15 (6), 1289–1303. doi:10.1111/1755-0998.12402
Small, N., Munday, M., and Durance, I. (2017). The challenge of Valuing Ecosystem Services that Have No Material Benefits. Glob. Environ. Change 44, 57–67. doi:10.1016/j.gloenvcha.2017.03.005
Stat, M., Huggett, M. J., Bernasconi, R., DiBattista, J. D., Berry, T. E., Newman, S. J., et al. (2017). Ecosystem Biomonitoring with eDNA: Metabarcoding across the Tree of Life in a Tropical marine Environment. Sci. Rep. 7 (1), 12240. doi:10.1038/s41598-017-12501-5
Strickler, K. M., Fremier, A. K., and Goldberg, C. S. (2015). Quantifying Effects of UV-B, Temperature, and pH on eDNA Degradation in Aquatic Microcosms. Biol. Conservation 183, 85–92. doi:10.1016/j.biocon.2014.11.038
Syed, T. H., Famiglietti, J. S., and Chambers, D. P. (2009). GRACE-based Estimates of Terrestrial Freshwater Discharge from Basin to Continental Scales. J. Hydrometeorology 10, 22–40. doi:10.1175/2008jhm993.1
Thomas, D. S. G., and Shaw, P. A. (1990). The Deposition and Development of the Kalahari Group Sediments, Central Southern Africa. J. Afr. Earth Sci. (and Middle East) 10, 187–197. doi:10.1016/0899-5362(90)90054-i
Thomsen, P. F., Kielgast, J., Iversen, L. L., Møller, P. R., Rasmussen, M., and Willerslev, E. (2012). Detection of a Diverse marine Fish Fauna Using Environmental DNA from Seawater Samples. PLoS One 7, e41732. doi:10.1371/journal.pone.0041732
Tsuji, S., Takahara, T., Doi, H., Shibata, N., and Yamanaka, H. (2019). The Detection of Aquatic Macroorganisms Using Environmental DNA Analysis-A Review of Methods for Collection, Extraction, and Detection. Environ. DNA 1, 99–108. doi:10.1002/edn3.21
Turner, C. R., Uy, K. L., and Everhart, R. C. (2015). Fish Environmental DNA Is More Concentrated in Aquatic Sediments Than Surface Water. Biol. Conservation 183, 93–102. doi:10.1016/j.biocon.2014.11.017
Vörösmarty, C. J., McIntyre, P. B., Gessner, M. O., Dudgeon, D., Prusevich, A., Green, P., et al. (2010). Global Threats to Human Water Security and River Biodiversity. Nature 467 (7315), 555–561. doi:10.1038/nature09440
Wanke, H., Beyer, M., Hipondoka, M., Hamutoko, J., Gaj, M., Koeniger, P., et al. (2018). The Long Road to Sustainability: Integrated Water Quality and Quantity Assessments in the Cuvelai-Etosha Basin, Namibia. Biodivers. Ecol. 6, 75–83. In: Climate change and adaptive land management in southern Africa – assessments, changes, challenges, and solutions (ed. by Revermann, R., Krewenka, K.M., Schmiedel, U., Olwoch, J.M., elmschrot, J. & Jürgens, N.), pp. Biodiversity & Ecology, 6, Klaus Hess Publishers, Göttingen & Windhoek. doi:10.7809/b-e.00307
Wood, D. E., Lu, J., and Langmead, B. (2019). Improved Metagenomic Analysis with Kraken 2. Genome Biol. 20, 257. doi:10.1186/s13059-019-1891-0
Keywords: eDNA, Namibia, freshwater, biomonitoring, water security
Citation: Perry I, Jâms IB, Casas-Mulet R, Hamutoko J, Marchbank A, Lendelvo S, Naomab E, Mapani B, Creer S, Wanke H, Durance I and Kille P (2022) Challenges to Implementing Environmental-DNA Monitoring in Namibia. Front. Environ. Sci. 9:773991. doi: 10.3389/fenvs.2021.773991
Received: 10 September 2021; Accepted: 11 November 2021;
Published: 17 January 2022.
Edited by:
Alberto Tiraferri, Politecnico di Torino, ItalyReviewed by:
Zhe Sun, Research Center for Eco-environmental Sciences (CAS), ChinaSyrie Maria Hermans, Friedrich-Schiller-Universität Jena, Germany
Copyright © 2022 Perry, Jâms, Casas-Mulet, Hamutoko, Marchbank, Lendelvo, Naomab, Mapani, Creer, Wanke, Durance and Kille. This is an open-access article distributed under the terms of the Creative Commons Attribution License (CC BY). The use, distribution or reproduction in other forums is permitted, provided the original author(s) and the copyright owner(s) are credited and that the original publication in this journal is cited, in accordance with accepted academic practice. No use, distribution or reproduction is permitted which does not comply with these terms.
*Correspondence: Peter Kille, a2lsbGVAY2FyZGlmZi5hYy51aw==