 Sanjeet Singh
- 1University Centre for Research & Development, Chandigarh University, Mohali, India
- 2University School of Business, Chandigarh University, Mohali, India
- 3Jindal Global Business School, O.P Jindal University, Sonipat, India
This study attempts to analyze the time-varying pattern between the exchange rates, stock market return, temperature, and number of confirmed COVID-19 cases in G7 countries caused by the COVID-19 pandemic. We have implemented our analysis using wavelet coherence and partial wavelet coherence (PWC) on independent variables from January 4, 2021 to July 31, 2021. This paper contributes to the earlier work on the same subject by employing wavelet coherence to analyze the effect of the sudden upsurge of the COVID-19 pandemic on exchange rates, stock market returns, and temperature to sustain and improve previous results regarding correlation analysis between the above-mentioned variables. We arrived at the following results: 1) temperature levels and confirmed COVID-19 cases are cyclical indicating daily temperatures have a material bearing on propagating the novel coronavirus in G7 nations; 2) noteworthy correlations at truncated frequencies show that a material long-term impact has been observed on exchange rates and stock market returns of G7 and confirmed COVID-19 cases; 3) accounting for impact of temperature and equity market returns, a more robust co-movement is observed between the exchange rate returns of the respective nations and the surge in COVID-19 cases; and 4) accounting for the influence of temperature and exchange rate returns and the increase in the confirmed number of coronavirus-infected cases and equity returns, co-movements are more pronounced. Besides academic contributions, this paper offers insight for policymakers and investment managers alike in their attempt to navigate the impediments created by the coronavirus in their already arduous task of shaping the economy and predicting stock market patterns.
Introduction
COVID-19 has been one of the most unexpected global events that has challenged the sustainability and resilience of almost every social and economic system. The continuity of almost every man-made system has been challenged, and the uncertainty of the control and spread of the COVID-19 virus has put to the test every system of estimation and valuation. This event has triggered various studies analyzing correlations between the number of confirmed COVID-19 cases and various other social and economic parameters (Martínez and Cervantes, 2021) (Shahzad et al., 2021). Within a couple of months of confirmation of the novel existence of SARS-CoV-2 by WHO (World Health Organization), the number of cases had crossed 4.5 million, and the death toll had exceeded 0.3 million (G. Sharma et al., 2021). The number of new cases has shown a sinusoidal behavior since 2020 with two peaks; 1.7 million new cases on January 21, 2021 followed by a fall to 0.26 million on February 26, 2021 and back to 0.89 million cases on april 23, 2021 with a drop back to 0.29 million cases on July 13, 2021. In August 2021, as we are writing this paper, the cases have crossed 0.7 million new cases per day. In comparison, the number of fatalities peaked at 17,700 on February 3, 2021, which reduced to 7,600 on March 8, 2021. This surged back to 14,900 on april 29, 2021 and fell to 6,300 casualties on May 6, 2021. Recently, there was a spike of 19,800 cases on July 21, 2021, creating fears of a third wave (Wikipedia, 2021). The virus is very communicable (R0 = 2–5), implying each infected vector can infect two to five subjects, exacerbating the spread. The myriad of symptoms such as fever, pneumonia, dry cough, myalgia, and fatigue sharing commonalities with many other seasonal ailments makes it even more difficult to keep a tab on the infected vectors (Qi et al., 2020; Rosario et al., 2020; Wang et al., 2020). Numerous studies have been conducted using daily average temperature (Huang et al., 2020; Park et al., 2020; Wang et al., 2020) to understand the impact of temperature and weather conditions on the spread and intensity of the COVID-19 virus.
Earlier studies on SARS (Severe Acute Respiratory Syndrome) have shown a negative correlation between the spread of the virus and temperature conditions (Wallis and Nerlich, 2005; Bedford et al., 2015). Similar results have been found for the influenza virus and dengue virus (Chan et al., 2010) (Chumpu et al., 2019). Studies also revealed a dysentery epidemic and temperature had a positive correlation (Li et al., 2019). Experts reason that as COVID-19 falls into a similar category of coronavirus, it is expected to show similar behavior (Ksiazek et al., 2003; Lipsitch, 2003; Wilder-Smith et al., 2020). Contrary to this, studies argue the minimal impact of temperature on the spread of COVID-19 (J. Liu et al., 2020; Shi et al., 2020; Xie and Zhu, 2020). Some authors argue that in colder regions, the dry cold will keep citizens indoors in heated environments and hence curb the spread of the COVID-19 virus (Molteni, 2020). Contradicting this, a research in India concluded that lower temperatures enhance the spread of viruses in the population, weakening the immune response, and making the proliferation of the virus easy (Roy, 2020; Sharma et al., 2020; Hossain et al., 2021; McClymont and Hu, 2021). These contradictory views on the correlation between the temperature and the spread of the COVID-19 virus make a case for further investigation on the same subject.
Every spike in daily cases is usually followed by a slew of remedial and restrictive measures by local and federal governing bodies globally (Li and Mutchler, 2020; Sandeep Kumar et al., 2020). These include vaccination drives, compulsory mask-wearing in public places, lockdowns, restriction of gatherings, and restriction of manufacturing activities and economic output. This has dire consequences on the earnings of people living pay-check to pay-check (Lal, 2020). It was argued that in Japan the urban labor market was severely impacted directly due to the restrictions, while the rural labor market was impacted due to the shrinkage in the size of the economic opportunity and landscape (Lee and Cho, 2017). Overall, trade velocity has been adversely impacted with a greater impact on foreign trade (Au Yong and Laing, 2021; Biswas et al., 2021). The follow on from the impact on the stock markets cannot be downplayed (Amar et al., 2021; Louhichi et al., 2021; Yousfi et al., 2021). These restrictions have adversely impacted the balance sheets of most of the firms exposed to international trade along with the ones in domestic trade (Chang et al., 2020; Gunay, 2020; Jomo and Chowdhury, 2020). This, in turn, resulted in the major stock indices of the G7 nations along with that of the rest of the world nose-diving before quantitative easing by the central banks provided some respite (Liu et al., 2020; Rebucci et al., 2020; Rubbaniy et al., 2021; Wei and Han, 2021). Trade, financial markets, and central bank rates have impacted the international currency market as well (Andreou et al., 2013; Tsagkanos and Siriopoulos, 2013; Sui and Sun, 2016).
The commodity markets were not spared by the spread of COVID-19 either. For the first time, crude oil futures crashed into negative territory (Albulescu, 2020; Izzeldin et al., 2021; Salisu et al., 2020). At -ve $40, sellers were paying buyers to take oil. This was caused due to the low demand, excess supply, and lack of storage space (Joanna Wilson, 2020). The negative impact of COVID-19 on crude oil prices was short-lived. However, the spillover on the equity markets was more pronounced (Mzoughi et al., 2020). At the same time, the depreciation of the Japanese Yen against the USD caused an appreciation in the Japanese equity markets. “A one standard deviation depreciation of the Yen during the COVID-19 period (equivalent to 0.588%) improved stock market returns by 71% of average returns” (Narayan et al., 2020). During the first wave, the pronounced negative news flow about the infallible and uncontrollable spread of the novel coronavirus in the countries of western Europe plummeted the stock markets globally (Conlon and McGee, 2020; Sharif et al., 2020; Zhang et al., 2020). With the COVID impact not yet over and concerns of repetitive waves still looming, further analysis is warranted to analyze the impact and correlation between COVID-19 and the returns of the equity markets in the G7 nations.
This study derives its motivation from two major studies used to evaluate the impact on the environment (i.e., temperature) and the impact on the equity markets by the COVID-19 virus (G. D. Sharma et al., 2021; Shahzad et al., 2021). The data used in the first study are time-series data and deploy a multitude of models such as the Susceptible Exposed Infectious Recovered model (SEIR) (Shi et al., 2020), Generalized Additive Model (GAM) (Ero lu, 2019; Xie and Zhu, 2020), etc. in the analysis of the magnitude of influence of temperature on the spread and surge in COVID-19 cases. Nonetheless, these studies refrain from ascertaining a firm correlation between the two. The various results obtained by the numerous studies subcategorized under this section are below:
i) temperature and the proliferation of the confirmed number of cases of COVID-19 are positively correlated (Auler et al., 2020; Douro et al., 2020; Kumar, 2020)
ii) temperature and confirmed COVID-19 cases are negatively correlated (Pequeno et al., 2020; Prata et al., 2020; Sarkodie and Owusu, 2020)
This inconclusive result in the available literature on temperature impacting the surge in COVID-19 cases creates a case for further evaluation of the same topic. The second type of evaluation assesses the economic impact of COVID-19 on the equity markets and other securitized tradable instruments (Goodell, 2020; Topcu and Gulal, 2020; Yarovaya et al., 2020a). Studies conducted on the foreign exchange (Holtmann et al., 2020; Iqbal et al., 2020; Sarmadi et al., 2020) concluded that a negative relationship existed between the surge in COVID-19 and the Chinese Yuan rate of exchange. They conducted their studies using wavelet analysis, and it was concluded by other researchers that there existed a positive relationship between the exchange rate and the number of confirmed COVID-19 cases (Villarreal-Samaniego, 2020; Javed et al., 2021; Kinateder et al., 2021). They used ARDL and conditional value-at-risk (CoVaR) estimations to conduct their evaluation.
Various methods have been employed to evaluate the impact of COVID-19 on various securitized traded markets; e.g., the wavelet coherence method to evaluate COVID-19’s ramifications on crude oil rate variance on American equity indices (Mensi et al., 2019; Mnif et al., 2020; Sharif et al., 2020) and to understand the coherence in pandemic upsurge and energy markets (futures) (Aloui et al., 2020; Sharif et al., 2020). The event study method has been used to evaluate the short-term impact of the COVID-19 surge on prominent equity market indices (J. Liu et al., 2020). As a recent investment product, a few papers evaluate COVID-19’s impact on cryptocurrencies (Shahzad et al., 2019; Yarovaya et al., 2020b; Balli et al., 2020; Goodell and Goutte, 2021).
The novel coronavirus has fueled uncertainties. Hence, the above-discussed coherence analysis between the number of confirmed COVID-19 cases and its impact on numerous variables. Based on the above analysis, we chose the wavelet analysis methodology to re-assess the coherence between regional temperature, equities, Forex, and COVID-19-confirmed cases in G7 nations (Shakoor et al., 2020; Zutshi et al., 2021). The wavelet methodology, which mostly finds usage in geophysics, has recently found a place in economics and finance, environment, and meteorology studies, etc. (Bouoiyour et al., 2015; Afshan et al., 2018; Sharif et al., 2020). Not having much experience in usage in COVID-related studies in this unfamiliar terrain, we have assessed the pandemic’s impact in a binary fashion: Using phase difference and wavelet coherence, we analyzed temperatures’ impact on COVID-19 cases. Using PWC and phase difference, accounting for control variables, we analyzed the influence of COVID-19 surge on equity (Forex) returns in G7 markets by conditioning on Forex (equity) and temperature, respectively.
Wavelet techniques have helped us answer two key research questions, 1) assessment of the lead/lag relationship among the variables; and 2) cyclical nature between the assessed variables. We assessed the relationship between temperature (implying weather), equity markets and currency exchange rates (economy), and surge in COVID-19 cases in G7 countries (Table 1)—the United States, Canada, France, Germany, Italy, Japan, and the United Kingdom. Wavelet coherence methodology was used to examine the relationship between the selected variables/indicators. The idea was to arrive at a leading or lag relationship between the variables to use the naturally occurring event to predict the supporting variables, e.g., the impact of temperature on the equity markets while establishing the coherence with the daily confirmed cases of the novel coronavirus (Prataet al., 2020; Wu et al., 2020). Compared to conventional correlation and regression techniques, wavelet analysis is superior as the former only maps a comprehensive mean relationship between the entire time frame whereas in contrast, the latter tells us of microlevel interactions and co-movements in a time-frequency frame (Fareed et al., 2020; Onali, 2020; Tiwari et al., 2016). This predictive capability of the relationship between the variables using wavelet analysis can help policymakers take prophylactic measures to prevent unwarranted catastrophes when one of the indicators gives a particular signal. This can find usage even beyond the pandemic to minimize human casualties and other suffering. In this analysis of the relation of cases of COVID-19 and equity and Forex returns, we came up with profound insights on a predictive lead indicator for the financial markets. This type of study can be extrapolated to find the variation in the occurrence of various diseases in different varying weather conditions in G7 countries and their association if at all with equity and Forex returns.
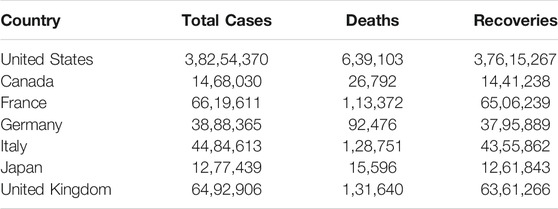
TABLE 1. List of Countries with COVID-19 cases
Our study unfolds three prominent outputs:
a) Wavelet coherence for reported coronavirus cases and temperature shows the existence of an in-phase relationship (cyclicality). Temperature takes the lead in the relationship in the sample dataset in most of the G7 countries using biwavelet coherence (WC).
b) There exists an in-phase (cyclical) and out-of-phase (anti-cyclical) pattern in the analyzed data of the daily confirmed cases of COVID-19 and equity returns, when conditioning for Forex yields along with temperature using the partial wavelet coherence (PWC).
c) PWC between Forex (exchange rate return) and the number of confirmed COVID-19 cases (conditioning for equity returns and temperature) indicates both an in-phase relationship (cyclicality) and out-of-phase (anti-cyclicality) relationship between the variables.
The layout of our article is as follows: data and methodology: second section; results: third section; findings: fourth section; policy implications and conclusion: fifth and final segment.
Data and Methodology
Data
The sample data on daily observations were collected for G7 countries, namely the United States, Canada, France, Germany, Italy, Japan, and the United Kingdom, from January 4, 2021 to July 31, 2021. The details of Forex (exchange rates) and equity (stock) returns considered in the present study are given in Table 2. Table 3 gives the list of the variables and sources of data considered in the present study.
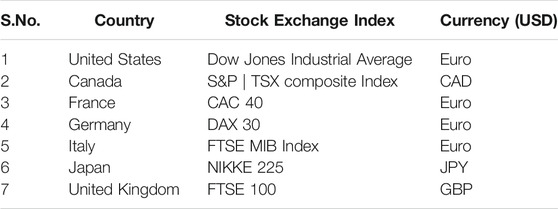
TABLE 2. List of Forex and equity returns considered for G7 countries
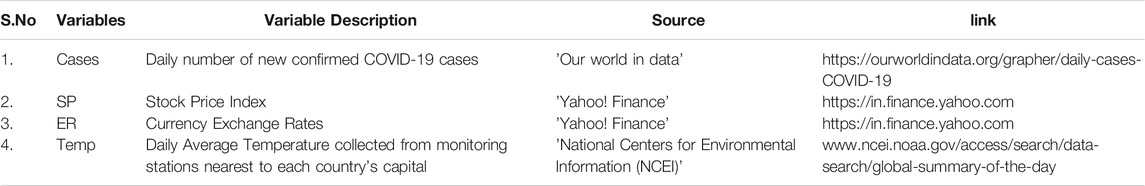
TABLE 3. List of variables and source of data covered in the study
The wavelet analysis is applied to study the coherence between temperature
a) Biwavelet coherence between
b) Partial coherence between
c) Partial coherence between
Methodology
Biwavelet Coherence (WC)
The wavelet coherence methodology is considered an appropriate tool applicable to study the periodic phenomena in a time series, particularly in the presence of abrupt frequency changes across time. Wavelet coherence is analogous to the traditional correlation used to measure the degree and extent of co-movement between two time series but in the time-frequency (location—scale) domain. This approach was applied to measure the nature of the relationship between the two time series - temperature
We defined the squared biwavelet coherence between two time series - Y and X, at scale (s) and location (t) as
where
Partial Wavelet Coherence
Partial wavelet coherence (PWC) is similar to the partial correlation coefficient employed in studying the correlation (co-movement) between two variables (time-series) while controlling (excluding) the effect of a third variable(s) (time series) but in the time-frequency domain. Our second and third objectives were to study the co-movements between.
1) COVID-19 cases
2) COVID-19 cases
The approach of partial wavelet coherence was employed.
We defined the squared partial wavelet coherence (Hu and Si, 2021) between time series - Y and X, after excluding the effect of a pair of time series,
Lead/Lag Relationship Between Time Series
Phase difference (PD), which equals the difference of individual phases of the time series, phase X—phase Y, was used to conceptualize the lead-lag relationship between the two time series. PD, when converted to an angle in the interval,
where
For PWC, PD between X and Y after excluding the effect of
where
If
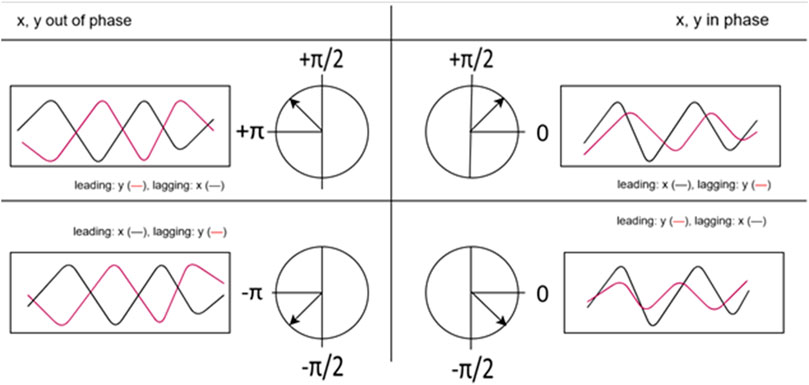
FIGURE 1. Phase difference and their interpretation.
Findings
The biwavelet and partial wavelet coherence analyses were applied between the reference variables on daily observations for the sample period of January 4, 2021 to July 31, 2021. The results are presented in Figures—2 to 8.
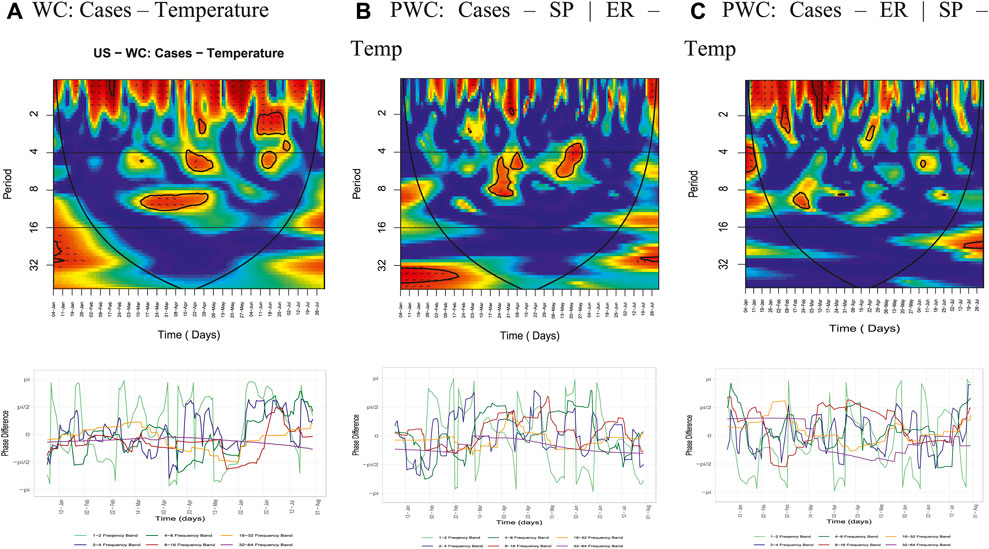
FIGURE 2. United States (A) WC: Cases—Temperature. (B) PWC: Cases—SP | ER—Temp. (C) PWC: Cases—ER | SP—Temp.
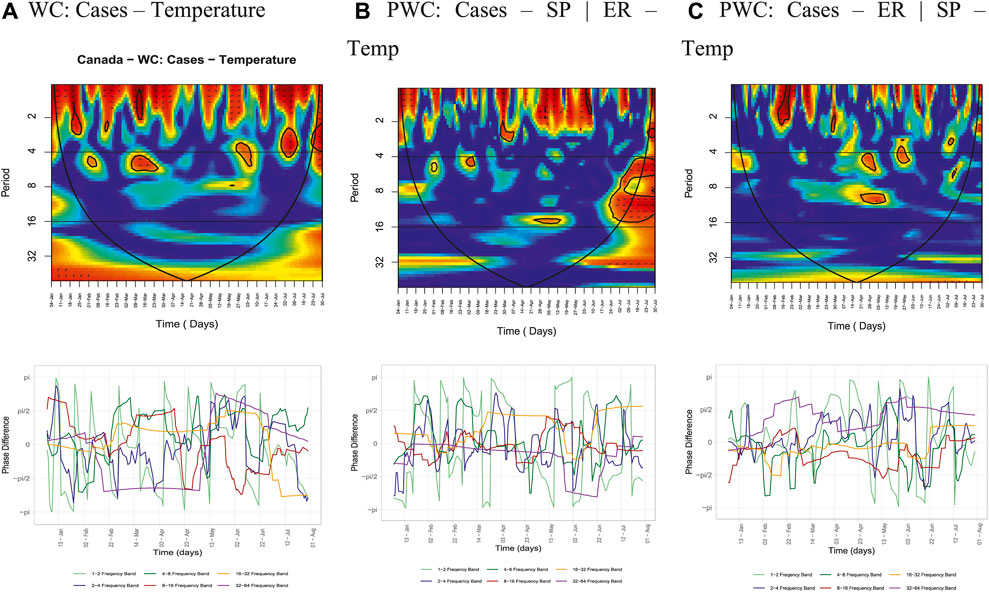
FIGURE 3. Canada. (A) WC: Cases—Temperature. (B) PWC: Cases—SP | ER—Temp. (C) PWC: Cases—ER | SP—Temp.
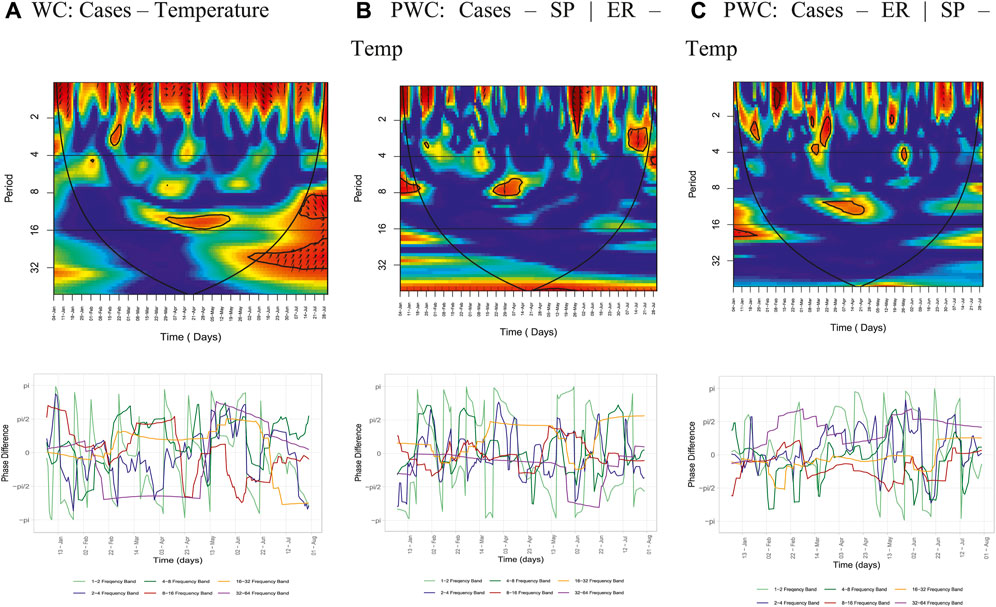
FIGURE 4. France. (A) WC: Cases—Temperature. (B) PWC: Cases—SP | ER—Temp. (C) PWC: Cases—ER | SP—Temp.
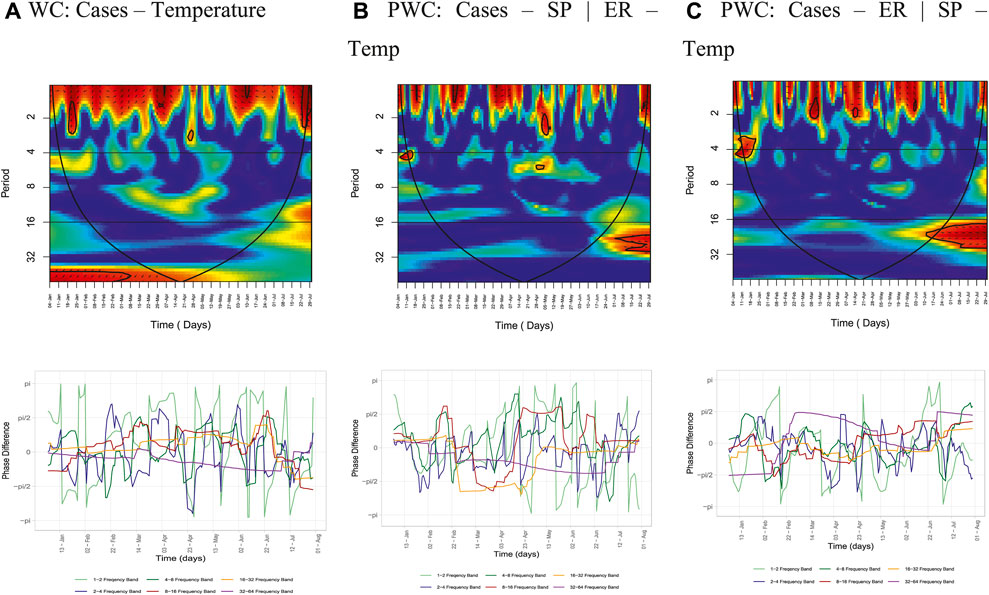
FIGURE 5. Germany. (A) WC: Cases—Temperature. (B) PWC: Cases—SP | ER—Temp. (C) PWC: Cases—ER | SP—Temp.
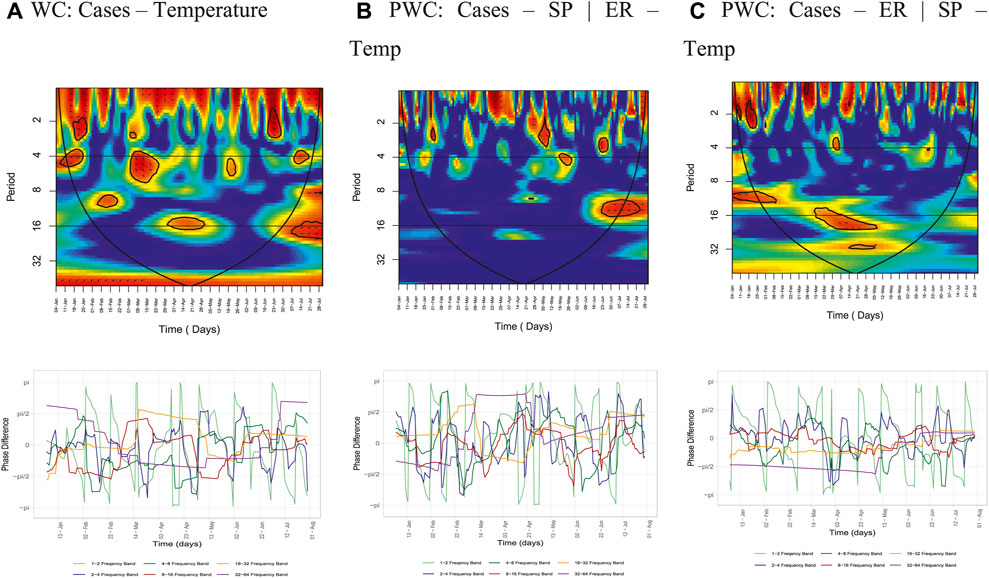
FIGURE 6. Italy. (A) WC: Cases—Temperature. (B) PWC: Cases—SP | ER—Temp. (C) PWC: Cases—ER | SP—Temp.
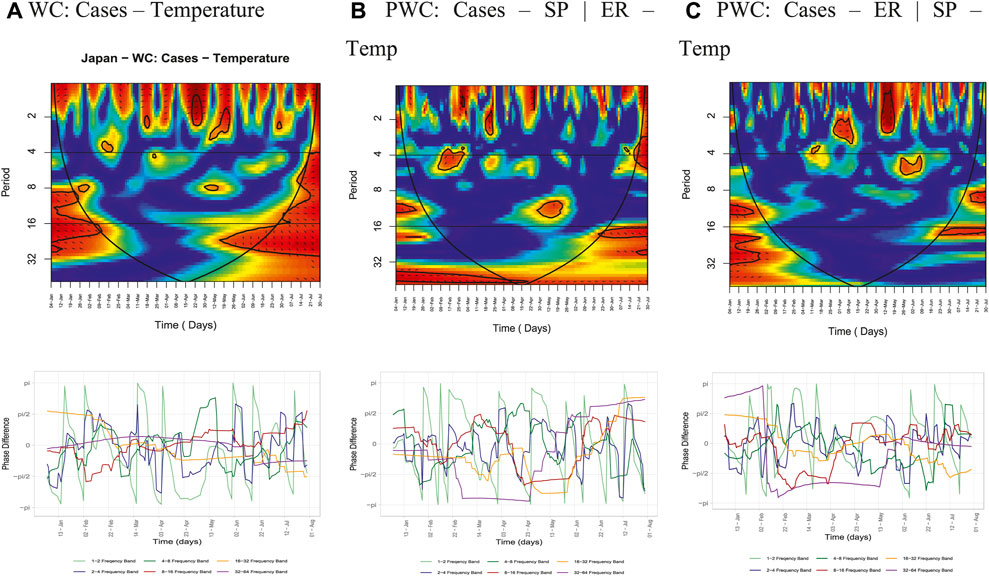
FIGURE 7. Japan. (A) WC: Cases—Temperature. (B) PWC: Cases—SP | ER—Temp. (C) PWC: Cases—ER | SP—Temp.
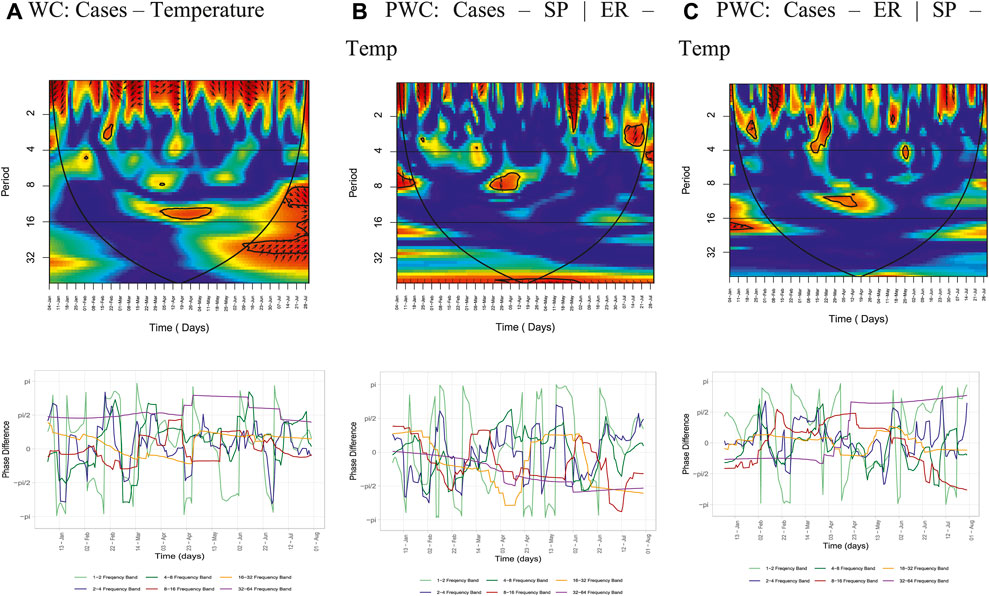
FIGURE 8. United Kingdom (A) WC: Cases—Temperature. (B) PWC: Cases—SP | ER—Temp. (C) PWC: Cases—ER | SP—Temp.
The horizontal axis (X-axis) represents the time points (days), while the vertical axis (Y-axis) represents the frequency domain. For the present analysis, six frequency cycles were considered—1–2, 2–4, 4–8, 8–16, 16–32, and 32–64 days bands. The first two cycles (1–2 and 2–4 days bands) are indicative of the short-run or high-frequency bands, and the remaining four cycles (4–8.8–16.16–32 and 32–64 days bands) are indicative of the long-run or low-frequency bands.
The color spectrum indicates the intensity of the interrelation (co-movement) between the series under study. The warmer color (red) signifies regions with significant co-movement, while a colder color (blues) signifies lower dependence (co-movement) between the series. The regions beyond the black line cone or the cone of influence (COI) which represents the 5% level of significance are not considered as the estimates of wavelet coefficients and are not statistically significant.
The area of arrows depicts the phase differences chosen at a 5% level of significance for the present analysis. The arrows are indicative of lead/lag phase relations between the series under consideration in the diagram. Arrows pointing to the right (left) mean that the series is in-phase (out-phase) while the arrows pointing right-down or left-up indicate the second series is leading while arrows pointing left-down or right-up indicate the first series is leading.
Wavelet Coherence: Cases—Temperature
The wavelet coherence and phase difference (PD) plots for cases vs temperature for the G7 countries are presented in Figure 2A, 3A, 4(a), 5(a), 6(a), 7(a), and 8(a) with interpretations given in Table—4.
For the United States, a small significant coherence was found in the two to four band around april 22–29, and a large island was depicted between June 11–25 where cases and temperature were out of phase (cases leading temperature). Further, two huge islands of significant coherence were found in the four to eight band between april 22—May 6 where cases and temperature were out of phase (temperature leading cases) and June 11–25. For the 8–16 days band, a significant coherence was located between March 12—april 30 with temperature leading cases.
For Canada, small islands with significant coherence could be seen in the one to two band between January 18–28 (out of phase) and March 5—20 (in-phase), where temperature was leading cases. In the two to four band, a huge island of significant coherence could be seen between June 20—July 10 with cases leading temperature and a small significant coherence could be seen between June 18–25 and February 8–16. For the four to eight band, islands with significant coherences could be seen between January 20 -February 8, March 2–31 (out of phase with cases leading temperature) and May 20—June 3.
For France, islands of significant coherences were located between February 15—March 1 (two to four band), March 29 -May 19 (8–16 band), and June 2–15 (16–32 band).
For Germany, significant coherence could be seen between January 15–31 with temperature leading cases in the two to four and 4–8 days bands.
For Italy, in the two to four band, islands of significant coherences were located between January 15—31 and June 15–25 where cases and temperature were in-phase with temperature leading cases. Two huge islands were located in the two to four and four to eight bands between January 15–25 (in-phase) with cases leading temperature and March 1–22 with temperature leading cases. Further, small islands of significant coherences could be seen between May 10–20 (four to eight band) and February 8–22 and april 1–30 (8–16 band).
For Japan, islands of significant coherences could be seen between april 10–20 where cases and temperature were out of phase and april 25—May 20 with cases and temperature in-phase in the one to two and two to four bands with temperature leading cases. A huge island of significant coherence could be seen in the 16–32 band between May 15-June 30 (in-phase) with temperature leading cases.
For the United Kingdom, significant coherences could be seen between February 20–28 (two to four band) and april 1 -May 15 (8–16 band).
Partial Wavelet Coherence: Cases—Stock Price Index | Exchange Rates—Temperature
The partial wavelet coherence and phase difference (PD) plots for COVID-19 cases
For the United States, cases and stock prices were in-phase depicted by islands of significant coherence located between March 15—april 15 (4–8 & 8–16 bands) with cases leading stock prices and between May 5–30 (two to four and four to eight bands).
For Canada, a huge island of significant coherence was seen between June 20—July 20 where cases and stock prices were out of phase (stock price leading cases) for the majority of days in the four to eight and 8–16 bands.
For France, significant coherence was seen in the one to two and two to four bands between May 18–31, where cases and stock prices were out of phase with cases leading stock prices. In the two to four band, an island was located between June 30-Jul 20 with cases and stock prices in-phase with cases leading stock prices. In the four to eight and 8–16 bands, significant coherence was found between March 20-April 15, where cases were seen leading stock prices.
For Germany, cases and stocks were in-phase in the one to two band between January 15–20 and February 20–25. In the two to four band, cases and stock prices were seen to be out of phase with cases leading stock prices between april 28—May 10.
For Italy, cases and stock prices were seen to be out of phase in all islands of significant coherence. In the two to four band, cases were seen to be leading stock prices between February 1–7 and april 30–May 10. For June 20–30, stock prices were observed to be leading cases. A huge island of significant coherence could be seen between June 16-July 15 with stock prices leading cases in the 8–16 band.
For Japan, an island of significant coherence was observed in the one to two band around February 25 -March 5 with cases leading stock prices (out of phase) and april 25–30 with stock prices leading cases (out of phase). In the two to four band, stock prices were observed to be leading cases in islands of significant coherence observed between February 10–28 (out of phase) and March 15–25 (in-phase). Further, significant coherence was seen between February 5–28 with stock prices leading cases (out of phase). In the 8–16 band, stock prices were seen to be leading cases (in-phase) between april 25 -May 20.
For the United Kingdom, in the one to two and two to four bands, an island could be seen with cases leading stock prices (out of phase) between May 18–June 2. In the two to four band, an island of significant coherence could be seen between July 1–15 with cases and stock prices in-phase and cases leading stock prices. For the four to eight and 8–16 bands, an island could be seen between March 20 -April 15 with cases leading stock prices (in-phase).
Partial Wavelet Coherence: Cases—Exchange Rates | Stock Price Index—Temperature
The partial wavelet coherence and phase difference (PD) plots for COVID-19 cases
For the United States, significant coherence could be observed between March 31—april 7 in the one to two band with exchange rates and cases in-phase. In the two to four and four to eight bands, cases and exchange rates were seen in-phase with cases leading exchange rates between May 6—31. Also, significant coherence was observed in the four to eight and 8–16 bands around March 20 -April 15 with cases leading exchange rates in the 8–16 band.
For Canada, an island of significant coherence could be seen between February 15–25 with cases and exchange rates in-phase and exchange rates leading cases in the one to two and two to four bands. In the two to four band, cases were observed to be leading exchange rates (out of phase) between March 28—april 7. In the four to eight and 8–16 bands, significant coherence was depicted by islands seen around april 21 -May 12 and around May 20—June 4 in the two to four and four to eight bands. Cases and exchange rates were in-phase with exchange rates leading cases in the 8–16 band.
For France, significant coherence was seen between February 5–15 with cases leading exchange rates (out of phase) in the one to two band. In the two to four band, exchange rates and cases were in-phase between January 18–31 (exchange rates leading cases) and March 10–25. Further, significant coherence could be seen in the 8–16 band between March 17 -April 15.
For Germany, cases and exchange rates were observed to be in-phase for all significant areas. In the one to two and two to four bands, cases leading exchange rates were observed between March 1–10 and significant coherences were seen between april 10–15 and May 27—June 3. In the two to four band, cases were leading exchange rates from January 10–25, and in the 8–16 band, cases were leading exchange rates from June 10–25.
For Italy, cases were seen to be leading exchange rates (in-phase) in the one to two band, and in two to four band, islands of significant coherence were observed between January 11–25 and March 1–8. For the 8–16 band, an island was observed between January 25—February and between March 15 -May 12 for the 8–16 and 16–32 bands. In the 16–32 band, exchange rates were observed leading cases and were in-phase.
For Japan, cases were seen leading exchange rates and in-phase for all significant coherent islands. Islands of significant coherence were observed between april 30–May 20 (one to two and two to four bands), March 20—april 10 (two to four band) and May 20—June 10 (four to eight band).
For the United Kingdom, cases were leading exchange rates in all areas of significant coherence. In the one to two band, cases and exchange rates were out of phase between February 1–15 while in the two to four band, they were in-phase between January 18–30 and March 10–25. An island of significant coherence was observed between March 15—april 20 in the 8–16 band.
Discussion
Wavelet coherence observed within the dataset of daily temperature and the number of confirmed COVID-19 cases in the G7 nations indicated significant co-movements in both the near-term and longer-term between the two variables. In most countries, the interconnection was led mostly by temperature and showed both in-phase and out of phase relationships indicating both cyclical and anti-cyclical movements in near and long terms. As a result, we infer that the spread of COVID-19 had a significant correlation with the temperature of the region/country. However, the directionality of correlation varied in different regions. This aligns with most of the literature reviewed on the same subject (Prata et al., 2020; Tobías and Molina, 2020; Wu et al., 2020). Similarly, co-movements were observed both in the near-term and longer-term between the confirmed coronavirus cases and equity returns in the PWC between the two while conditioning for Forex yields and temperature. Anti-cyclical and cyclical patterns between the variables were evident, and COVID-19 had prolonged ramifications on equity returns in G7 nations. This is supported by material connectedness shown at low frequencies. Further, we infer that the confirmed coronavirus-infected cases and the equity indices of G7 nations showed an out of phase relationship indicating that the surge in the confirmed coronavirus-infected cases resulted in G7 investors estimating a long global lockdown to curtail the spread. This, in turn, slowed down investment and capital infusions resulting in slowing down or stopping otherwise self-sustaining economic cycles. The G7 countries constitute 39% of the global market cap. Like the rest of the world, the stock markets of these G7 nations fell as lockdowns were announced globally.
The volatility, measured as beta, experienced during this time frame was much higher than usual, as opined by many other authors (Narayan et al., 2020; Narayan et al., 2021; Zhang et al., 2021). The numerous reasons that exacerbated the higher volatility triggered by COVID-19 included nationwide lockdowns, increasing unemployment, plummeting consumption, unavailability of blue-collar workers, artificial clogging of the supply chain channels, and the mellow financial markets (Sharma et al., 2020). The equity stock markets (Harvey, 1989) mirrored the ground conditions and fluctuations of the real economy during the pandemic. Nonetheless, our empirical results are contradicted by a few authors who opine that the impact of COVID-19 is a short-term one (H. Liu et al., 2020), and it will reverse on its own. Assuming January 1 to be the start date, the leading indices of the G7 nations fell close to 35% by March 23, 2020. On an annualized CAGR basis from January 1, 2020 to August 24, 2021, these indices have given a return of ∼10% (Yahoo, 2021). Our results agree with the findings of a few authors (H. Liu et al., 2020). The importance of the negative impact of the surge in coronavirus infections on equity market movements in G7 nations is emphasized in these findings. In line with a few others, we observed that short-term correlation among confirmed COVID-19 cases in the United States and the S&P 500 was significant in all-time frequencies (Sharif et al., 2020). Ever since the major drop in March 2020 in the equity markets and the American Federal Reserve, USFED’s expansionary quantitative easing policies led to a major reversion in equity prices (Thorbecke, 2020). The rally in the indices of G7 nations was fueled due to the easy money and liquidity in the markets instead of the improvement in the fundamentals in the underlying trades (Rebucci et al., 2020). A few have stated that the variation in returns in each country has been directly correlated with the intensity of the outbreak in the respective country (J. Liu et al., 2020). By March 23, 2020 YTD, the S&P 500 was down by 37%, the S&P/TSX Composite Index for Canada had lost 34%, the French CAC was down by 35%, the German DAX was down by 34%, and the Italian IT40 had lost 34% in line with the other G7 nations while the Nikkei 225 of Japan was down 28% YTD. The fall in equity markets resonated with the gloomy investor opinion, plummeting by greater margins than the United States Sub-Prime financial crisis of 2008 (Mazur et al., 2021). It has been projected that the recovery in the economy will be slow in the G7 nations as it will be for the rest of the world. The impact of the COVID-19 pandemic has been forecasted to be very persistent and negative (Foroni et al., 2020; UNCTAD, 2020). The slowdown in commercial activities results in large-scale unemployment rendering a multiplier impact on the consumption and other wings of the economy. This has a negative bearing on the financial and commodity markets and a similar impact on private capital formation as well (Ruth Lea, 2021).
PWC between the exchange rate return and the number of confirmed COVID-19 cases in G7 nations after conditioning for temperature and equity market returns points towards the fact that there is a positive correlation in both short and long term in the sample period amongst COVID-19 cases and the Forex yield. Both anti-cyclicality and cyclicality are observed between the variables. The COVID-19 pandemic has resulted in huge swings in the currency markets as well. Since the beginning of the pandemic in 2020, the dollar has strengthened, and despite the central banks speaking to soften their QE plans, the USD is expected to strengthen further after a short pause (Reuters, 2021; Salisu et al., 2021). The instability of the Euro exchange rate can be reversed by the currency revival and a revival of the economic activities in the Euro-zone (Neykov and Robert, 2021). Material connectedness at low frequencies shows a prolonged correlated impact on the G7 currency exchange markets with confirmed COVID-19 cases. A global foreign direct investment where the G7 nations have a major share fell to a third at $1 trillion of its earlier value. Further, it is estimated that the economic losses behest global disasters was estimated to be at $200bn in 2020 versus $150bn in the previous year (UNCTAD, 2020, 2021).
Small and developing economies gain from the depreciation of their currencies against the USD, impacting United States exports and domestic production (Bruno and Shin, 2020). Authors evaluating the Forex pairs of the United States dollar and the Great Britain pound, the United States dollar and the Turkish Lira, and the United States dollar and the Brazilian real concerning COVID-19 state that correlation between the scare of the pandemic as shown in the media and the currency exchange markets is less than 1 (Goodell, 2020; Gunay, 2020). Our results elucidate the effect of a continual rising number of cases of COVID-19 in the G7 nations impacting the volatility in currency exchange markets. The appreciation of the United States dollar during the beginning of the novel coronavirus pandemic may adversely impact the already fragile international trade (Aizenman et al., 2021). The currencies of advanced economies (United States dollar, Japanese Yen, Euro) are appreciated over the emerging economies’ currencies (OECD, 2020; AsadUllah et al. 2021). The lockdowns over this period exacerbated the situation. The severely impacted European nations of Italy (G7) and Spain were impacted the worst (Dillon, 2020).
In March 2020, the United States infections began to increase, a similar situation can be observed right now. Earlier, the scare induced increased cash withdrawals from banks in the United States to tide rising uncertainty and movement limitations. This coupled with a weakened consumption level led to the Yen’s USD appreciation (Koichi Hamada, 2020). With the rising cases in the current scenario, ceteris paribus, an encore of a similar round of appreciation can be envisaged.
Conclusion
To investigate the relationship amongst the number of confirmed cases of COVID-19, stock market return, currency exchange rates, and temperature, we applied methodologies of biwavelet and partial wavelet coherence. Lead-lag interactions were easier to find in the time-frequency domain using the wavelet-based technique. Additional support for the claims presented in the paper is now provided by this study, which incorporates the wavelet coherence approach to examine the unpredictable repercussions of the pandemic on currency exchange rates, temperature, and stock market returns in G7 countries.
The current research is a distinct evaluation of the economic effect of COVID-19 in the G7 countries. The significance, relevance, and need for such evaluation research are accentuated by Goodell (2020) and Villarreal-Samaniego (2020). We arrived at the following results, 1) temperature levels and confirmed COVID-19 cases are cyclically correlated: Indicating daily temperatures have a material bearing on propagating the novel coronavirus in G7 nations; 2) the noteworthy correlation at truncated frequencies shows that a material long-term impact has been observed on exchange rates and stock markets returns of G7 countries and confirmed COVID-19 cases; 3) accounting for the influence of temperature and equity market returns, a more robust co-movement is observed between the exchange rate returns of the respective nations and the surge in COVID-19 cases; and 4) accounting for the influence of temperature and exchange rate returns, the increase in the confirmed number of coronavirus-infected cases and equity returns’ co-movements are more pronounced.
We have some important novel policy and implementation implications to provide. Society, governments, financial institution professionals, and individual investors are concerned about the fiscal and economic repercussions of the COVID-19 epidemic. The portfolio administrators must adjust the portfolios they manage to minimize the volatility and methodical risk of the COVID-19 spread. When compiling a time-frequency chart of the COVID-19 outbreak, oil prices, geopolitical risk, economic uncertainty, and the stock markets of G7, it is demonstrated in the article written by Sharif, Aloui, and Yarovaya (2020) that the key source of uncertainty for United States policymakers is the likelihood of the pandemic outbreak. To meet this global challenge, organizations like the World Bank, the World Trade Organization, and all national governments and their corresponding central banks and other government officials will need to collaborate at the national and global level.
This paper has significant potential for future research since it is beginning to consider the pandemic issue. Temperature data are only gathered for the capital city of each country, and this may not accurately represent the country’s climate trends. Future studies will conquer this shortcoming. For a specific set of observed motions, substantial co-movements are usually present. The factors that explain these co-movements are identifiable. The findings can be applied to many microeconomic factors, such as fiscal policy, gross domestic product (GDP) progress, industrial production, national income, and employment.
Data Availability Statement
Publicly available datasets were analyzed in this study. This data can be found here: https://ourworldindata.org/grapher/daily-cases-COVID-19 https://in.finance.yahoo.com www.ncei.noaa.gov/access/search/data-search/global-summary-of-the-day.
Author Contributions
SS conceptualizes the idea of the paper, analyzed the data, and interpreted the result. PB Analyzed the data and written the methodology part of the manuscript. NB Written the introduction and Literature review. AA has written the discussion and conclusion.
Conflict of Interest
The authors declare that the research was conducted in the absence of any commercial or financial relationships that could be construed as a potential conflict of interest.
Publisher’s Note
All claims expressed in this article are solely those of the authors and do not necessarily represent those of their affiliated organizations, or those of the publisher, the editors, and the reviewers. Any product that may be evaluated in this article, or claim that may be made by its manufacturer, is not guaranteed or endorsed by the publisher.
References
Afshan, S., Sharif, A., Loganathan, N., and Jammazi, R. (2018). Time-frequency Causality between Stock Prices and Exchange Rates: Further Evidences from Cointegration and Wavelet Analysis. Physica A: Stat. Mech. its Appl. 495, 225–244. doi:10.1016/j.physa.2017.12.033
Aguiar-Conraria, L., and Soares, M. J. (2011). The Continuous Wavelet Transform: A Primer. NIPE Working Paper.’, Núcleo de Investigação em Políticas Económicas, 16. Braga, Portugal: Universidade Do Minho, 1–43.
Aizenman, J., Ito, H., and Pasricha, G. K. (2021). Central Bank Swap Arrangements in the COVID-19 Crisis. NBER Working Papers 28585. Cambridge, MA: National Bureau of Economic Research, Inc. doi:10.3386/w28585
Aloui, D., Goutte, S., Guesmi, K., and Hchaichi, R. (2020). COVID 19’s Impact on Crude Oil and Natural Gas S&P GS Indexes. Working Papers halshs-02613280, HAL. Paris, France: PSB - Paris School of Business.
Amar, A. B., Belaid, F., Youssef, A. B., Chiao, B., and Guesmi, K. (2021). The Unprecedented Reaction of Equity and Commodity Markets to COVID-19. Finance Res. Lett. 38, 101853. doi:10.1016/j.frl.2020.101853
Andreou, E., Matsi, M., and Savvides, A. (2013). Stock and Foreign Exchange Market Linkages in Emerging Economies. J. Int. Financial Markets, Institutions Money 27, 248–268. doi:10.1016/j.intfin.2013.09.003
AsadUllah, M., Bashir, M. A., and Aleemi, A. R. (2021). Forecasting Euro against US Dollar via Combination of NARDL and Univariate Techniques during COVID-19. Fs. doi:10.1108/FS-04-2021-0082
Au Yong, H. H., and Laing, E. (2021). Stock Market Reaction to COVID-19: Evidence from U.S. Firms' International Exposure. Int. Rev. Financial Anal. 76, 101656. doi:10.1016/j.irfa.2020.101656
Auler, A. C., Cássaro, F. A. M., Da Silva, V. O., and Pires, L. F. (2020). Evidence that High Temperatures and Intermediate Relative Humidity Might Favor the Spread of COVID-19 in Tropical Climate: A Case Study for the Most Affected Brazilian Cities. Sci. Total Environ. 729, 139090. doi:10.1016/j.scitotenv.2020.139090
Balli, F., de Bruin, A., Chowdhury, M. I. H., and Naeem, M. A. (2020). Connectedness of Cryptocurrencies and Prevailing Uncertainties. Appl. Econ. Lett. 27 (16), 1316–1322. doi:10.1080/13504851.2019.1678724
Bedford, T., Riley, S., Barr, I. G., Broor, S., Chadha, M., Cox, N. J., et al. (2015). Global Circulation Patterns of Seasonal Influenza Viruses Vary with Antigenic Drift. Nature 523 (7559), 217–220. doi:10.1038/nature14460
Biswas, S., Majumder, S., and Dawn, S. K. (2021). Comparing the Socioeconomic Development of G7 and BRICS Countries and Resilience to COVID-19: An Entropy-MARCOS Framework. Business Perspect. Res., 227853372110154. doi:10.1177/22785337211015406
Bouoiyour, J., Selmi, R., Tiwari, A. K., and Shahbaz, M. (2015). The Nexus between Oil price and Russia's Real Exchange Rate: Better Paths via Unconditional vs Conditional Analysis. Energ. Econ. 51, 54–66. doi:10.1016/j.eneco.2015.06.001
Chan, J., Holmes, A., and Rabadan, R. (2010). “Network Analysis of Global Influenza Spread,” Plos Comput. Biol., 6 (11), e1001005. doi:10.1371/journal.pcbi.1001005
Chang, C.-L., McAleer, M., and Wong, W.-K. (2020). Risk and Financial Management of COVID-19 in Business, Economics and Finance. Jrfm 13 (5), 102. doi:10.3390/jrfm13050102
Chumpu, R., Khamsemanan, N., and Nattee, C. (2019). The Association between Dengue Incidences and Provincial-Level Weather Variables in Thailand from 2001 to 2014. PLoS ONE 14 (12), e0226945. doi:10.1371/journal.pone.0226945
Conlon, T., and McGee, R. (2020). Safe haven or Risky hazard? Bitcoin during the Covid-19 bear Market. Finance Res. Lett. 35, 101607. doi:10.1016/j.frl.2020.101607
Dillon, J. (2020). The Pound to Euro Exchange War and the Impact of Covid-19 on Forex Markets. Available at: https://www.chroniclelive.co.uk/. (Accessed May 30, 2020).
Eroğlu, B. A. (2019). Wavelet Variance Ratio Cointegration Test and Wavestrapping. J. Multivariate Anal. 171, 298–319. doi:10.1016/j.jmva.2018.12.011
Fareed, Z., Iqbal, N., Shahzad, F., Shah, S. G. M., Zulfiqar, B., Shahzad, K., et al. (2020). Co-variance Nexus between COVID-19 Mortality, Humidity, and Air Quality index in Wuhan, China: New Insights from Partial and Multiple Wavelet Coherence. Air Qual. Atmos. Health 13 (6), 673–682. doi:10.1007/s11869-020-00847-1
Foroni, C., Marcellino, M., and Stevanovic, D. (2020). Forecasting the Covid-19 Recession and Recovery: Lessons from the Financial Crisis. Int. J. Forecast. doi:10.1016/j.ijforecast.2020.12.005
Goodell, J. W. (2020). COVID-19 and Finance: Agendas for Future Research. Finance Res. Lett. 35, 101512. doi:10.1016/j.frl.2020.101512
Goodell, J. W., and Goutte, S. (2021). Co-movement of COVID-19 and Bitcoin: Evidence from Wavelet Coherence Analysis. Finance Res. Lett. 38, 101625. doi:10.1016/j.frl.2020.101625
Gunay, S. (2020). COVID-19 Pandemic versus Global Financial Crisis: Evidence from Currency Market. SSRN J. doi:10.2139/ssrn.3584249
Hamada, K. (2020). How the U.S. Response to Coronavirus Is Forcing the Hand of the World’s central banks. Cologny, Switzerland: World Economic Forum.
Harvey, C. R. (1989). Forecasts of Economic Growth from the Bond and Stock Markets. Financial Analysts J. 45 (5), 38–45. doi:10.2469/faj.v45.n5.38
Holtmann, M., Jones, M., Shah, A., and Holtmann, G. (2020). Low Ambient Temperatures Are Associated with More Rapid Spread of COVID-19 in the Early Phase of the Endemic. Environ. Res. 186, 109625. doi:10.1016/j.envres.2020.109625
Hossain, M. S., Ahmed, S., and Uddin, M. J. (2021). Impact of Weather on COVID-19 Transmission in South Asian Countries: An Application of the ARIMAX Model. Sci. Total Environ. 761, 143315. doi:10.1016/j.scitotenv.2020.143315
Hu, W., and Si, B. (2021). Technical Note: Improved Partial Wavelet Coherency for Understanding Scale-specific and Localized Bivariate Relationships in Geosciences. Hydrol. Earth Syst. Sci. 25 (1), 321–331. doi:10.5194/hess-25-321-2021
Huang, Z., Huang, J., Gu, Q., Du, P., Liang, H., and Dong, Q. (2020). Optimal Temperature Zone for the Dispersal of COVID-19. Sci. Total Environ. 736, 139487. doi:10.1016/j.scitotenv.2020.139487
Iqbal, N., Fareed, Z., Shahzad, F., He, X., Shahzad, U., and Lina, M. (2020). The Nexus between COVID-19, Temperature and Exchange Rate in Wuhan City: New Findings from Partial and Multiple Wavelet Coherence. Sci. Total Environ. 729, 138916. doi:10.1016/j.scitotenv.2020.138916
Izzeldin, M., Muradoğlu, Y. G., Pappas, V., and Sivaprasad, S. (2021). The Impact of Covid-19 on G7 Stock Markets Volatility: Evidence from a ST-HAR Model. Int. Rev. Financial Anal. 74, 101671. doi:10.1016/j.irfa.2021.101671
Javed, F., Sabzevari, H., and Virk, N. (2021). Tail Risk Emanating from Troubled European Banking Sectors. Finance Res. Lett., 101952. doi:10.1016/j.frl.2021.101952
Jomo, K. S., and Chowdhury, A. (2020). COVID-19 Pandemic Recession and Recovery. Development 63 (2–4), 226–237. doi:10.1057/s41301-020-00262-0
Kinateder, H., Campbell, R., and Choudhury, T. (2021). Safe haven in GFC versus COVID-19: 100 Turbulent Days in the Financial Markets, Finance Res. Lett., 101951. doi:10.1016/j.frl.2021.101951
Ksiazek, T. G., Erdman, D., Goldsmith, C. S., Zaki, S. R., Peret, T., Emery, S., et al. (2003). A Novel Coronavirus Associated with Severe Acute Respiratory Syndrome. N. Engl. J. Med. 348 (20), 1953–1966. doi:10.1056/NEJMoa030781
Kumar, S. (2020). Will COVID-19 Pandemic Diminish by Summer-Monsoon in India ? Lesson from the First Lockdown Abstract. New Haven, Connecticut: Medrxiv. doi:10.1101/2020.04.22.20075499
Lal, B. S. (2020). Health and Economic Shock of COVID-19. Int. J. Multidiscip. Res. Dev. 7 (4), 6–12. doi:10.22271/ijmrd.2020.v7.i4.02
Lee, A., and Cho, J. (2017). The Impact of City Epidemics on Rural Labor Market: The Korean Middle East Respiratory Syndrome Case. Jpn. World Economy 43, 30–40. doi:10.1016/j.japwor.2017.10.002
Li, C., Wu, X., Ji, D., Liu, J., Yin, J., and Guo, Z. (2019). Climate Change Impacts the Epidemic of Dysentery: Determining Climate Risk Window, Modeling and Projection. Environ. Res. Lett. 14 (10), 104019. doi:10.1088/1748-9326/ab424f
Li, Y., and Mutchler, J. E. (2020). Older Adults and the Economic Impact of the COVID-19 Pandemic. J. Aging Soc. Pol. 32 (4–5), 477–487. doi:10.1080/08959420.2020.1773191
Lipsitch, M., Cohen, T., Cooper, B., Robins, J. M., Ma, S., James, L., et al. (2003). Transmission Dynamics and Control of Severe Acute Respiratory Syndrome. Science 300 (5627), 1966–1970. doi:10.1126/science.1086616
Liu, H., Manzoor, A., Wang, C., Zhang, L., and Manzoor, Z. (2020). The COVID-19 Outbreak and Affected Countries Stock Markets Response. Int. J. Eviron. Pub. Health. 17 (8), 2800. doi:10.3390/ijerph17082800
Liu, H., Yang, R., and Feng, Z. (2020). Age-related Loss of Resources and Perceived Old Age in China. Ageing Soc., 1–19. doi:10.1017/S0144686X20001440
Liu, J., Zhou, J., Yao, J., Zhang, X., Li, L., Xu, X., et al. (2020). Impact of Meteorological Factors on the COVID-19 Transmission: A Multi-City Study in China. Sci. Total Environ. 726, 138513. doi:10.1016/j.scitotenv.2020.138513
Liu, P. C. (1994). Wavelet Spectrum Analysis and Ocean Wind Waves, Wavelet Analysis and its Applications. Cambridge, Massachusetts: Academic Press, 151–166. doi:10.1016/B978-0-08-052087-2.50012-8
Louhichi, W., Ftiti, Z., and Ameur, H. B. (2021). Measuring the Global Economic Impact of the Coronavirus Outbreak: Evidence from the Main Cluster Countries. Technol. Forecast. Soc. Change 167, 120732. doi:10.1016/j.techfore.2021.120732
Mazur, M., Dang, M., and Vega, M. (2021). COVID-19 and the March 2020 Stock Market Crash. Evidence from S&P1500. Finance Res. Lett. 38, 101690. doi:10.1016/j.frl.2020.101690
McClymont, H., and Hu, W. (2021). Weather Variability and COVID-19 Transmission: A Review of Recent Research. Int. J. Eviron. Pub. Health. 18 (2), 396. doi:10.3390/ijerph18020396
Mensi, W., Rehman, M. U., Al-Yahyaee, K. H., Al-Jarrah, I. M. W., and Kang, S. H. (2019). Time Frequency Analysis of the Commonalities between Bitcoin and Major Cryptocurrencies: Portfolio Risk Management Implications. North Am. J. Econ. Finance 48, 283–294. doi:10.1016/j.najef.2019.02.013
Mnif, E., Jarboui, A., and Mouakhar, K. (2020). How the Cryptocurrency Market Has Performed during COVID 19? A Multifractal Analysis. Finance Res. Lett. 36, 101647. doi:10.1016/j.frl.2020.101647
Molteni, M. (2020). Covid Winter Is Coming. Could Humidifiers Help? WIRED. Available at: https://www.wired.com/story/covid-winter-is-coming-could-humidifiers-help/. (Accessed November 12, 2020).
M., S. K., V., M., J., P., M., P., P., J., P., S., et al. (2020). Social Economic Impact of COVID-19 Outbreak in India. Ijpcc 16 (4), 309–319. doi:10.1108/IJPCC-06-2020-0053
Mzoughi, H., Urom, C., Uddin, G. S., and Guesmi, K. (2020). The Effects of COVID-19 Pandemic on Oil Prices, CO2 Emissions and the Stock Market: Evidence from a VAR Model. SSRN J. doi:10.2139/ssrn.3587906
Narayan, P. K., Devpura, N., and Wang, H. (2020). Japanese Currency and Stock Market-What Happened during the COVID-19 Pandemic? Econ. Anal. Pol. 68, 191–198. doi:10.1016/j.eap.2020.09.014
Narayan, P. K., Phan, D. H. B., and Liu, G. (2021). COVID-19 Lockdowns, Stimulus Packages, Travel Bans, and Stock Returns. Finance Res. Lett. 38, 101732. doi:10.1016/j.frl.2020.101732
Neykov, R., and Robert, C. (2021). The Role of the Euro in the Eastern Partnership Countries. European Economy - Discussion Papers 2015 - 138. Brussels, Belgium Luxembourg City: Directorate General Economic and Financial Affairs (DG ECFIN), European Commission. doi:10.2765/50966
OECD (2020). COVID-19 and Global Capital Flows. Paris, France: OECD Policy Responses to Coronavirus (COVID-19.
Oliveiros, B., Caramelo, L., Ferreira, N. C., and Caramelo, F. (2020). Role of Temperature and Humidity in the Modulation of the Doubling Time of COVID-19 Cases. New Haven, Connecticut: MedRxiv.
Park, J. E., Son, W. S., Ryu, Y., Choi, S. B., Kwon, O., and Ahn, I. (2020). Effects of Temperature, Humidity, and Diurnal Temperature Range on Influenza Incidence in a Temperate Region. Influenza Other Respi Viruses 14 (1), 11–18. doi:10.1111/irv.12682
Pequeno, P., Mendel, B., Rosa, C., Bosholn, M., Souza, J. L., Baccaro, F., et al. (2020). Air Transportation, Population Density and Temperature Predict the Spread of COVID-19 in Brazil. PeerJ 8, e9322. doi:10.7717/peerj.9322
Prata, D. N., Rodrigues, W., and Bermejo, P. H. (2020). Temperature Significantly Changes COVID-19 Transmission in (Sub)tropical Cities of Brazil. Sci. Total Environ. 729, 138862. doi:10.1016/j.scitotenv.2020.138862
Qi, H., Xiao, S., Shi, R., Ward, M. P., Chen, Y., Tu, W., et al. (2020). COVID-19 Transmission in Mainland China Is Associated with Temperature and Humidity: A Time-Series Analysis. Sci. Total Environ. 728, 138778. doi:10.1016/j.scitotenv.2020.138778
Rebucci, A., Hartley, J., and Jiménez, D. (2020). An Event Study of COVID-19 Central Bank Quantitative Easing in Advanced and Emerging Economies. CEPR Discussion Papers 14841. Cambridge, MA. doi:10.3386/w27339
Reuters (2021). US Dollar Dips from 9-1/2-month High but Near-Term Outlook Still Upbeat. Mumbai, India: Economic Times.
Rosario, D. K. A., Mutz, Y. S., Bernardes, P. C., and Conte-Junior, C. A. (2020). Relationship between COVID-19 and Weather: Case Study in a Tropical Country. Int. J. Hyg. Environ. Health 229, 113587. doi:10.1016/j.ijheh.2020.113587
Roy, M. P. (2020). Temperature and COVID-19: India, BMJ Evid. Based Med., doi:10.1136/bmjebm-2020-111459
Rubbaniy, G., Khalid, A. A., Umar, M., and Mirza, N. (2021). European Stock Markets' Response to COVID-19, Lockdowns, Government Response Stringency and Central Banks' Interventions. SSRN J. doi:10.2139/ssrn.3785598
Ruth, L. (2021). GDP Falls Nearly 10% in 2020 but, after First Quarter Weakness, Should Recover Well in 2021. United Kingdom: Arbuthnot Banking Group.
Salisu, A. A., Ebuh, G. U., and Usman, N. (2020). Revisiting Oil-Stock Nexus during COVID-19 Pandemic: Some Preliminary Results. Int. Rev. Econ. Finance 69, 280–294. doi:10.1016/j.iref.2020.06.023
Salisu, A. A., Ogbonna, A. E., Oloko, T. F., and Adediran, I. A. (2021). A New Index for Measuring Uncertainty Due to the COVID-19 Pandemic. Sustainability 13 (6), 3212. doi:10.3390/su13063212
Sarkodie, S. A., and Owusu, P. A. (2020). Impact of Meteorological Factors on COVID-19 Pandemic: Evidence from Top 20 Countries with Confirmed Cases. Environ. Res. 191, 110101. doi:10.1016/j.envres.2020.110101
Sarmadi, M., Marufi, N., and Kazemi Moghaddam, V. (2020). Association of COVID-19 Global Distribution and Environmental and Demographic Factors: An Updated Three-Month Study. Environ. Res. 188, 109748. doi:10.1016/j.envres.2020.109748
Shahzad, K., Farooq, T. H., Doğan, B., Zhong Hu, L., and Shahzad, U. (2021). Does Environmental Quality and Weather Induce COVID-19: Case Study of Istanbul, Turkey. Environ. Forensics, 1–12. doi:10.1080/15275922.2021.1940380
Shahzad, S. J. H., Bouri, E., Roubaud, D., Kristoufek, L., and Lucey, B. (2019). Is Bitcoin a Better Safe-haven Investment Than Gold and Commodities? Int. Rev. Financial Anal. 63, 322–330. doi:10.1016/j.irfa.2019.01.002
Shakoor, A., Chen, X., Farooq, T. H., Shahzad, U., Ashraf, F., Rehman, A., et al. (2020). Fluctuations in Environmental Pollutants and Air Quality during the Lockdown in the USA and China: Two Sides of COVID-19 Pandemic. Air Qual. Atmos. Health 13 (11), 1335–1342. doi:10.1007/s11869-020-00888-6
Sharif, A., Aloui, C., and Yarovaya, L. (2020). COVID-19 Pandemic, Oil Prices, Stock Market, Geopolitical Risk and Policy Uncertainty Nexus in the US Economy: Fresh Evidence from the Wavelet-Based Approach. Int. Rev. Financial Anal. 70, 101496. doi:10.1016/j.irfa.2020.101496
Sharma, G. D., Bansal, S., Yadav, A., Jain, M., and Garg, I. (2021). Meteorological Factors, COVID-19 Cases, and Deaths in Top 10 Most Affected Countries: an Econometric Investigation. Environ. Sci. Pollut. Res. 28 (22), 28624–28639. doi:10.1007/s11356-021-12668-5
Sharma, G. D., Tiwari, A. K., Jain, M., Yadav, A., and Erkut, B. (2021). Unconditional and Conditional Analysis between Covid-19 Cases, Temperature, Exchange Rate and Stock Markets Using Wavelet Coherence and Wavelet Partial Coherence Approaches. Heliyon 7, e06181. doi:10.1016/j.heliyon.2021.e06181
Sharma, P., Singh, A. K., Agrawal, B., and Sharma, A. (2020). Correlation between Weather and COVID -19 Pandemic in India: An Empirical Investigation. J. Public Aff. doi:10.1002/pa.2222
Shi, P., Dong, Y., Yan, H., Zhao, C., Li, X., Liu, W., et al. (2020). Impact of Temperature on the Dynamics of the COVID-19 Outbreak in China. Sci. Total Environ. 728, 138890. doi:10.1016/j.scitotenv.2020.138890
Sui, L., and Sun, L. (2016). Spillover Effects between Exchange Rates and Stock Prices: Evidence from BRICS Around the Recent Global Financial Crisis. Res. Int. Business Finance 36, 459–471. doi:10.1016/j.ribaf.2015.10.011
Thorbecke, W. (2020). The Impact of the COVID-19 Pandemic on the U.S. Economy: Evidence from the Stock Market. Jrfm 13 (10), 233. doi:10.3390/jrfm13100233
Tiwari, A. K., Mutascu, M. I., and Albulescu, C. T. (2016). Continuous Wavelet Transform and Rolling Correlation of European Stock Markets. Int. Rev. Econ. Finance 42, 237–256. doi:10.1016/j.iref.2015.12.002
Tobías, A., and Molina, T. (2020). Is Temperature Reducing the Transmission of COVID-19 ? Environ. Res. 186, 109553. doi:10.1016/j.envres.2020.109553
Topcu, M., and Gulal, O. S. (2020). The Impact of COVID-19 on Emerging Stock Markets. Finance Res. Lett. 36, 101691. doi:10.1016/j.frl.2020.101691
Tsagkanos, A., and Siriopoulos, C. (2013). A Long-Run Relationship between Stock price index and Exchange Rate: A Structural Nonparametric Cointegrating Regression Approach. J. Int. Financial Markets, Institutions Money 25, 106–118. doi:10.1016/j.intfin.2013.01.008
UNCTAD (2020). ‘The Covid-19 Shock to Developing Countries: Towards a “Whatever it Takes” Programme for the Two-Thirds of the World’s Population Being Left behind. Geneva, Switzerland: UNITED NATIONS CONFERENCE ON TRADE AND DEVELOPMENT.
Valls Martínez, M. d. C., and Martín Cervantes, P. A. (2021). Testing the Resilience of Csr Stocks during the Covid-19 Crisis: A Transcontinental Analysis. Mathematics 9 (5), 514–523. doi:10.3390/math9050514
Villarreal-Samaniego, D. (2020). COVID-19, Oil Prices, and Exchange Rates: A Five-Currency Examination. SSRN J. doi:10.2139/ssrn.3593753
Wallis, P., and Nerlich, B. (2005). Disease Metaphors in New Epidemics: the UK media Framing of the 2003 SARS Epidemic. Soc. Sci. Med. 60 (11), 2629–2639. doi:10.1016/j.socscimed.2004.11.031
Wang, Y., Wang, Y., Chen, Y., and Qin, Q. (2020). Unique Epidemiological and Clinical Features of the Emerging 2019 Novel Coronavirus Pneumonia (COVID-19) Implicate Special Control Measures. J. Med. Virol. 92 (6), 568–576. doi:10.1002/jmv.25748
Wei, X., and Han, L. (2021). The Impact of COVID-19 Pandemic on Transmission of Monetary Policy to Financial Markets. Int. Rev. Financial Anal. 74, 101705. doi:10.1016/j.irfa.2021.101705
Wilder-Smith, A., Chiew, C. J., and Lee, V. J. (2020). Can We Contain the COVID-19 Outbreak with the Same Measures as for SARS? Lancet Infect. Dis. 20 (5), e102–e107. doi:10.1016/S1473-3099(20)30129-8
Wilson, J. (2020). Why Did Oil Prices Fall below Zero? Analysis from Imperial Experts. South Kensington, London: Imperial College London. Available at: https://www.imperial.ac.uk/news/197034/why-prices-fall-below-zero-analysis/.
Wu, Y., Jing, W., Liu, J., Ma, Q., Yuan, J., Wang, Y., et al. (2020). Effects of Temperature and Humidity on the Daily New Cases and New Deaths of COVID-19 in 166 Countries. Sci. Total Environ. 729, 139051. doi:10.1016/j.scitotenv.2020.139051
Xie, J., and Zhu, Y. (2020). Association between Ambient Temperature and COVID-19 Infection in 122 Cities from China. Sci. Total Environ. 724, 138201. doi:10.1016/j.scitotenv.2020.138201
Yarovaya, L., Brzeszczynski, J., Goodell, J. W., Lucey, B. M., and Lau, C. K. (2020a). Rethinking Financial Contagion: Information Transmission Mechanism during the COVID-19 Pandemic. SSRN J. doi:10.2139/ssrn.3602973
Yarovaya, L., Matkovskyy, R., and Jalan, A. (2020b). The Effects of a 'Black Swan' Event (COVID-19) on Herding Behavior in Cryptocurrency Markets: Evidence from Cryptocurrency USD, EUR, JPY and KRW Markets. SSRN J. doi:10.2139/ssrn.3586511
Yousfi, M., Ben Zaied, Y., Ben Cheikh, N., Ben Lahouel, B., and Bouzgarrou, H. (2021). Effects of the COVID-19 Pandemic on the US Stock Market and Uncertainty: A Comparative Assessment between the First and Second Waves. Technol. Forecast. Soc. Change 167, 120710. doi:10.1016/j.techfore.2021.120710
Zhang, D., Hu, M., and Ji, Q. (2020). Financial Markets under the Global Pandemic of COVID-19. Finance Res. Lett. 36, 101528. doi:10.1016/j.frl.2020.101528
Zhang, P., Sha, Y., and Xu, Y. (2021). Stock Market Volatility Spillovers in G7 and BRIC. Emerging Markets Finance and Trade 57 (7), 1–13. doi:10.1080/1540496X.2021.1908256
Keywords: COVID-19, temprature, stock market return, exchange rate, G7, wavelet coherence
Citation: Singh S, Bansal P, Bhardwaj N and Agrawal A (2021) Nexus Between COVID-19 Infections, Exchange Rates, Stock Market Return, and Temperature in G7 Countries: Novel Insights From Partial and Multiple Wavelet Coherence. Front. Environ. Sci. 9:772783. doi: 10.3389/fenvs.2021.772783
Received: 08 September 2021; Accepted: 04 October 2021;
Published: 29 October 2021.
Edited by:
John Mendy, Unoversity of Lincoln, United KingdomReviewed by:
Khurram Shahzad, Northwest University, ChinaSuleman Sarwar, Jeddah University, Saudi Arabia
Copyright © 2021 Singh, Bansal, Bhardwaj and Agrawal. This is an open-access article distributed under the terms of the Creative Commons Attribution License (CC BY). The use, distribution or reproduction in other forums is permitted, provided the original author(s) and the copyright owner(s) are credited and that the original publication in this journal is cited, in accordance with accepted academic practice. No use, distribution or reproduction is permitted which does not comply with these terms.
*Correspondence: Sanjeet Singh, singh.sanjeet2008@gmail.com; Pooja Bansal, pbansal711@gmail.com